Embed Size (px)
Citation preview

J. Cell Set. 43, 367-377 (1980) 367
Printed in Great Britain © Company of Biologists Limited 10S0
SPONTANEOUS SPATIO-TEMPORAL
ORGANIZATION IN YEAST CELL SUSPENSION
H. JACOBSEN, H.-G. BUSSE AND B. HAVSTEENInstitute of Biochemistry, School of Medicine, University of Kiel,Federal Republic of Germany
SUMMARY
Under suitable conditions of substrate supply, cell suspensions of yeast Saccharomycesuvarum may display synchronized oscillations of glycolytic metabolism.
Also in an unstirred suspension, spatial patterns can be induced by continuously feedingenzymically liberated glucose into the system. The absorption of NADH in the suspensionwas measured in an annular cuvette. The observed structures display moving waves, whichtravel over a distance of some centimetres in the cell suspension and seem to originate froma volume element in which the phase is ahead of those of its neighbours. The wavelength isestimated to be about 10 cm and the velocity of spreading of the wave is about 5 cm/min.Waves are only observed in the beginning of glycolytic oscillations. Subsequently the spatialsynchrony usually increases and destroys the previous organization.
Similar spatio-temporal structures are observed during aggregation of the slime mouldDictyostelium discoideum and in the chemical reaction system of Belousov and Zhabotinsky.
INTRODUCTION
The yeast Saccharomyces uvarum is a eucaryotic micro-organism which normallyforms a uniform population of unicellular metabolically non-interacting organisms.However, under special conditions, cell suspensions can be induced to displaysynchronized oscillations of the glycolytic metabolism (Chance, Estabrook & Ghosh,1964). While regulation of the key enzyme of glycolysis, phosphofructokinase, hasbeen identified as a participant in these oscillations (Hess, Boiteux & Kriiger, 1969),the underlying mechanism of intercellular synchronization still remains obscure(Ghosh, Chance & Pye, 1971).
The glycolytic oscillations are of the nonlinear type, which spontaneously maydevelop a spatio-temporal organization (Hess, Boiteux, Busse & Gerisch, 1975).Investigations on a model system revealed many properties of the structure-generatingphenomena which also should apply to other systems if some prerequisites arefulfilled, e.g. coupled nonlinear interactions (feedback), which occur under highlyunequilibrated conditions (Pavlidis, 1973). Glycolysing yeast cells and their extractsseem to fulfil these prerequisites.
More general models of signal transmission by oscillatory systems in morpho-genetic fields of highly developed organisms have been proposed and recently beensubstantiated by the observation of moving wave fronts of cells in the early chickenembryo (Goodwin & Cohen, 1969; Stern & Goodwin, 1977).

368 H. Jacobsen, H.-G. Busse and B. Havsteen
Here, experimental evidence is suggesting that communication between oscillatingyeast cells may give rise to a spatio-temporal organization and generate propagatingwaves in an otherwise homogeneous cell suspension.
METHODS
Organism, medium and growth
Strain ATCC 0080 of Saccharomyces uvarum was used throughout the experiments. It wasgrown anaerobically in 5-I. batches in a laboratory fermentor (Eschweiler, Kiel) at 32 °C withcontinuous agitation. Anaerobiosis was ensured by a stream of nitrogen (99, 995 %, MesserGriesheim). A medium recommended for aerobic growth (Hess & Boiteux, 1968) was slightlymodified: 50 g glucose. H,O, 2g yeast extract, 6 mg Ergosterol, 2 ml Tween 80 per 1 1.medium. It was inoculated with 50 ml of a preculture. The yeast was grown until the beginningof the stationary phase of growth. This phase corresponds to that of glucose depletion. Afterharvesting and washing, wet weight was determined and the cell paste was resuspended in5 times its volume of potassium phosphate buffer (o-i M, pH 65). This stock suspensionwas maintained at 30 °C under nitrogen atmosphere. Its cell density of about 1-7-1-9 x io*cells/ml remained unchanged. The yeast suspension could be used experimentally for about24 h. Prior to harvesting, cycloheximide was added to a final concentration of 15 fig/ml to-prevent aerobic adaptation (Schatz & Kovac, 1974). The buffer for incubation and washingwas also supplemented with cycloheximide.
Induction of glycolytic oscillations
By external continuous glucose supply. An aliquot of the stock suspension waa centrifugedand resuspended in fresh buffer to its original volume. It was then transferred to a reactionvessel held at 25 °C and protected by a steady stream of nitrogen. The suspension was pumpedfrom the vessel through a flow-cuvette where the NADH-fluorescence was recorded (AmincoBowman Ratio SPF, excitation 340 ran, emission 450 nm, band width 25 nm). A 2 M stock,solution of glucose was continuously fed into the vessel by a tube pump (Varioperpex LKB).
By internal continuous glucose supply. After centrifugation of an aliquot of the stock solution,the yeast was resuspended in fresh buffer containing 4 % glycogen (w/v; E. Merck, Darmstadt).Amyloglucosidase (AG; E.C. 3.2.1.3; Boehringer, Mannheim) was added and after throroughlymixing, the suspension was transferred to a cuvette.
Determination of amyloglucosidase activity
Glycogen was dissolved in potassium phosphate buffer (o-i M, pH 6-5) to a concentrationof 4% (w/v). The solution was prewarmed to 25 °C and 10 /ilof a commercial amyloglucosidase-(AG) suspension were added. After an incubation time of 0-20 min, the reaction was stoppedby heating for 1 min and the glucose released by the AG-action was determined in a coupledhexokinase/glucose-6-phosphate dehydrogenase assay (Gluco-quant; Boehringer).
Device for detection of spatial pattern
Glycolytic oscillations are conveniently monitored by the periodic changes in the NADHabsorption. Spatial patterns can be revealed by the spatial variations in the NADH absorption.Accordingly, a photometric device was constructed to detect such variations (Fig. 1, Eschweiler,Kiel). It consisted of an annular cuvette of 185 cm circumference and 0-52 cm optical path,(special design of Hellma, Miillheim). The cuvette was mounted on the driving shaft of anelectric motor, which could be operated at different speeds. The assembly was placed in the-cuvette housing of a dual-wavelength photometer (Aminco DW 2). The light beams (At = 340M1"1) ^a = 39° n111) °f the photometer were guided to the cuvette by a flexible light pipe.(Schott, Mainz). The cuvette was rotated at 5 rev/min to detect spatial structures in theoscillating cell suspension. Traces of NADH absorption were drawn simultaneously on 2recorders. At first, the time course was displayed. Then, the «-axis of an x, ^-recorder was.
Spatio-temporal organization in yeast
60 mm
369
PMT
Cuvette Lens
Fig. 1. Photometric device with a rotating, annular cuvette for demonstration ofspatial patterns by NADH absorption. The 2 beams from a dual-wavelength photo-meter were guided by a flexible light-pipe to the inner side of the cuvette. Fromthere they passed the cell suspension. The scattered light transmitted by the cellswas collected on the front plate of a photomultiplier tube (PMT). During measure-ments, the cuvette was rotated at 5 rev/min, thus permitting records of NADHabsorption versus the circumference of the cuvette.
coupled to the driv ng shaft of the electric motor which returned the pen to its zero positionafter each revolution of the cuvette, thus producing a record of NADH absorption versus,the circumference of the cuvette. For technical reasons, the last cm of each turn was omitted.
Since the signal/noise ratio was small compared with the differences in NADH absorption,detected, slight differences in the optical path of the cuvette were significantly disturbing.Therefore, a computer (micro 16, Digico) which was connected to the photometer was usedto digitize the signal and store the values. In the lag phase prior to the onset of oscillation, abase-line was recorded and stored. Subsequent records were corrected by subtraction of thebaseline values before the data were fed on to the x, ^-recorder.
In addition, the data for each revolution were punched on paper tape for later display ona television screen of another computer (see below).
RESULTSInduction of glycolytic oscillations
Glycolysing yeast suspensions can develop a stable oscillatory state if glucose isadded continuously from an external source when the rate of supply remains withina suitable range (Hess & Boiteux, 1968; v. Klitzing, 1970). Since stable oscillationsare thought to be required for the demonstration of spatial patterns, we used theprocedure described to test the oscillatory capacity of freshly prepared stock sus-pensions (Fig. 2). A rate of 80-200 mM glucose/h x 1. cell suspension was found to-be adequate (corresponding to 7-8-19-4 x icr6M/min/g wet weight), but the preciserange differed for each preparation of cell suspensions. In Table i, data of an.example of an experiment are shown. Long-lasting oscillation are produced at a rateof supply of 80-140 mM glucose/h/1. suspension. Induction of oscillation in thisparticular experiment was restricted to a rate of 120+iomM glucose/1./h. Thus,

37° H. Jacobsen, H.-G. Busse and B. Havsteen
t, mm 5 min
Fig. 2. Undamped glycolytic oscillation in a cell suspension of S. uvarum. A cellsuspension was transferred to a reaction vessel held at 25 °C and flushed withnitrogen. Glucose was added continuously from an external stock solution at a rateof 120 mM/h/1. suspension. The cell suspension was pumped through a flow-cuvetteof a fluorometer and NADH fluorescence was recorded. The time axis proceedsfrom left to right and top to bottom.
Table 1. Influence of the rate of glucose supply on the amplitude andthe period of the glycolytic oscillations in cell suspension
Glucose influx,mM glucose/h/1.
Amplitude,relative units
Period,
6080IOO
120
140160
0
47-4
10
60
—
57746457
Experimental conditions as described in Fig. 2.
the induction of the oscillatory state seems to demand the satisfaction of morerestrictive conditions than its maintenance.
For detection of spatial patterns, a method was also developed to induce stableglycolytic oscillation in an unstirred suspension. The incubation buffer was supple-mented with glycogen and amyloglucosidase was added (see methods). Since the•enzyme degrades continuously the polymer to free glucose, a steady supply of glucosein each volume element of the suspension could be obtained without stirring.Oscillations induced by this method are shown in Fig. 3.
Under suitable conditions, 40-50 cycles were displayed. The number of cycles

Spatio-temporal organization in yeast
2 min
Fig. 3. Sustained oscillation in a cell suspension fed by a continuous internal glucosesupply. Yeast was suspended in incubation buffer supplemented with. 4 % glycogen(w/v). The NADH absorption was recorded in a dual wavelength photometer.Amyloglucosidase was added when the anaerobic state was approached (see arrowwithin curve). Amyloglucosidase degrades glycogen to free glucose. An optimal rateof glucose supply can be obtained by varying the amount of enzyme added to thesuspension. The time axis proceeds from left to right and from top to bottom.
obtained depended upon the amount of AG added. Usually, optimal conditionswere found when the activity of AG corresponded to a rate of glucose supply of45-55 mM/h/1. cell suspension. This range is much lower than the values reportedabove for external glucose supply. The difference is probably due to the fact thatthe AG activity was determined 'in vitro' at pH 6-5, i.e. at the original pH value ofthe incubation buffer. However, in the unstirred suspension, CO2 can accumulateduring the glucose decomposition and lower the pH value to about 5-6 during anexperiment.
The pH optimum of AG is about 5-0. Hence, the pH drop causes a significantincrease in the AG activity and concomitantly an increase in rate of glucose supply.During the lag phase after the addition of AG, the glucose supply is probably belowthe range necessary for the induction of oscillations. The damping of the oscillatory-state may be caused by a pH-dependent increase in the AG activity above a criticallimit. Accordingly, the duration of the lag-phase before the onset of the oscillatory-state was found to be inversely proportional to the amount of AG added and toincrease with rising buffer capacity (data not given).
372 H. Jacobsen, H.-G. Busse and B. Havsteen
a636
4 min f, mm
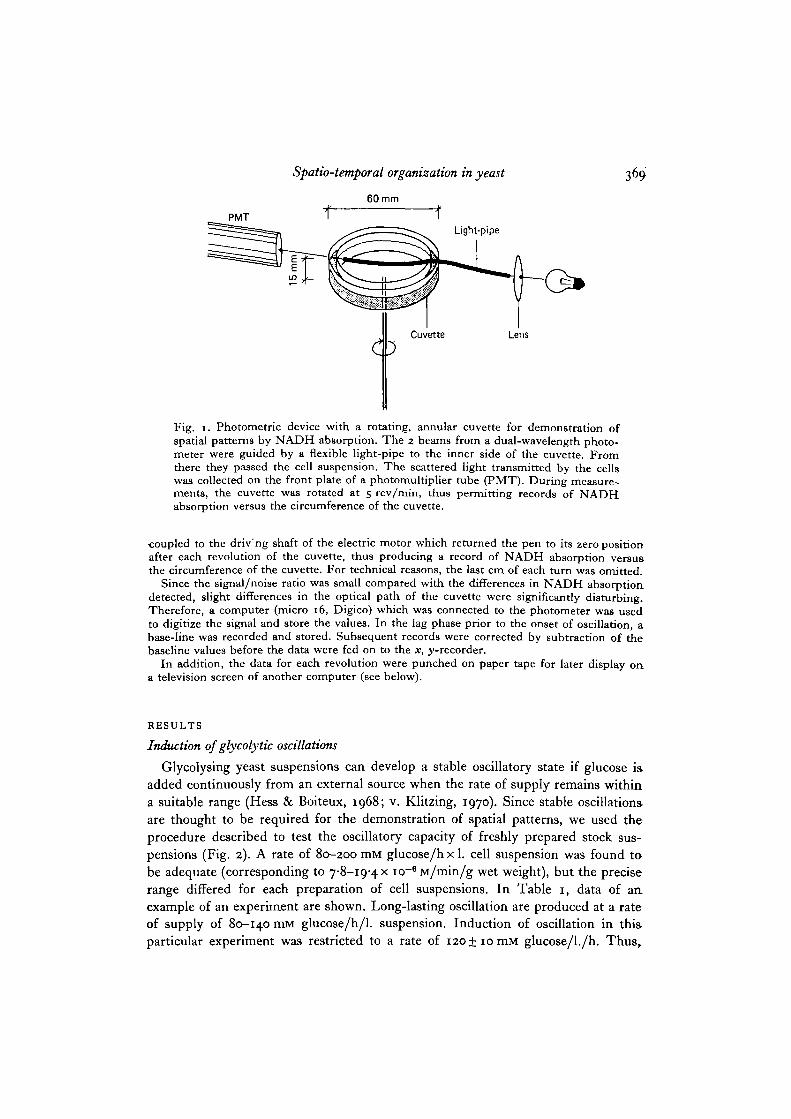
Fig. 4. Glycolytic oscillations in a cell suspension recorded in the rotating cuvette.The yeast cells were suspended in buffer containing glycogen and amyloglucosidaseand after mixing transferred to the rotation cuvette. The first and last few cycleswere recorded with the cuvette arrested; in between, it was rotated at 5 rev/min.The rotation causes an additional variation in the periodic signal, since the NADHabsorption changes along the cuvette circumference due to developing spatial patterns.The time axis increases from right to left.
Demonstration of spatio-temporal organization
An aliquot of stock suspension was centrifuged and resuspended in incubationbuffer containing glycogen to demonstrate spatio-temporal structures (see methods).After addition of AG and mixing, the suspension was transferred to the rotationcuvette. During the lag phase, the NADH absorption was recorded with the cuvettearrested. After onset of the oscillatory state, the cuvette was rotated at 5 rev/minand the NADH absorption was recorded as a function of time (Fig. 4) as well asagainst the circumference of the cuvette (Fig. 5). At the beginning of rotation, theformerly smooth periodic signal acquired an appreciable ' noise' due to variations inNADH absorption at different positions of the cuvette. That phenomenon indicatedthe arisal of spatial patterns (see Fig. 4). A more comprehensible record of thesespatial changes in NADH absorption was provided by the plot of absorption versusthe circumference of the cuvette (see Fig. 5).
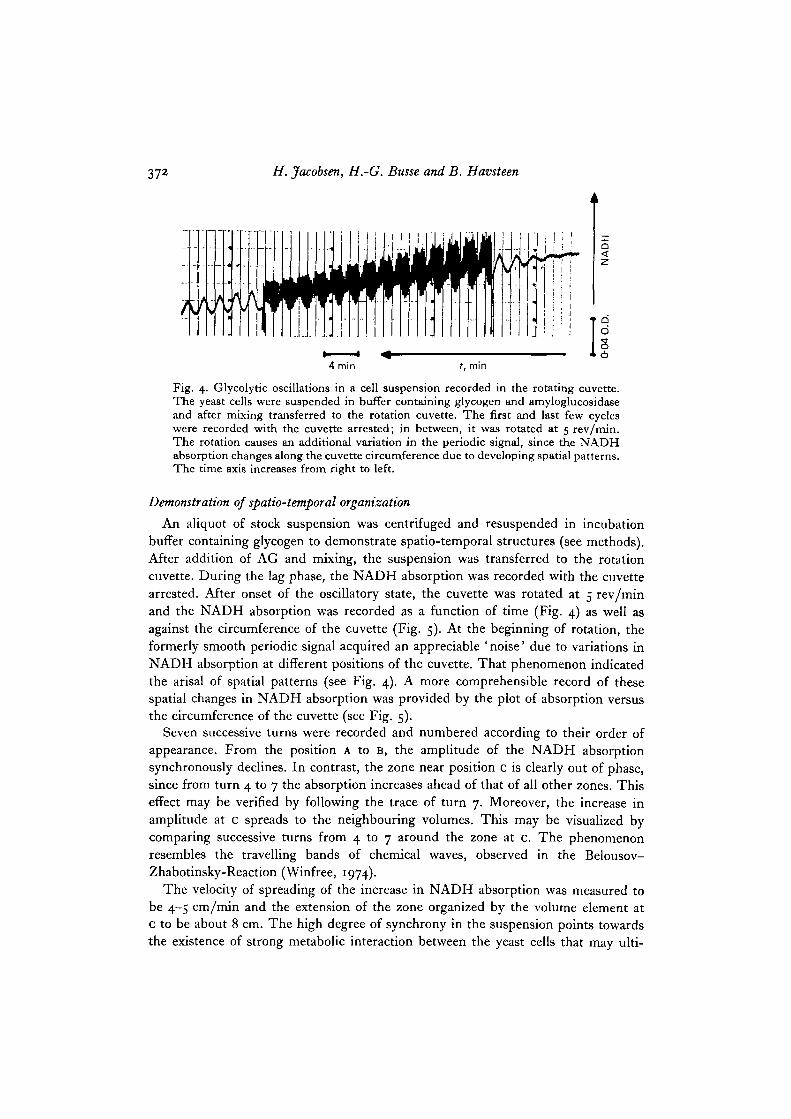
Seven successive turns were recorded and numbered according to their order ofappearance. From the position A to B, the amplitude of the NADH absorptionsynchronously declines. In contrast, the zone near position c is clearly out of phase,since from turn 4 to 7 the absorption increases ahead of that of all other zones. Thiseffect may be verified by following the trace of turn 7. Moreover, the increase inamplitude at c spreads to the neighbouring volumes. This may be visualized bycomparing successive turns from 4 to 7 around the zone at c. The phenomenonresembles the travelling bands of chemical waves, observed in the Belousov-Zhabotinsky-Reaction (Winfree, 1974).
The velocity of spreading of the increase in NADH absorption was measured tobe 4-5 cm/min and the extension of the zone organized by the volume element atc to be about 8 cm. The high degree of synchrony in the suspension points towardsthe existence of strong metabolic interaction between the yeast cells that may ulti-
Spatio-temporal organization in yeast 373
Cuvette-circumference 360°
Fig. 5. Profiles of NADH absorption around the circumference of the cuvette. Thespatial distribution of NADH Oy-axis) along the circumference of the cuvette (x-axis)was displayed on an x, ^-recorder simultaneously with the recording of Fig. 4.Seven successive turns of the cuvette were monitored and numbered according totheir order of appearance. They correspond to the first 7 turns of the cuvette afterstarting the rotation in Fig. 4. Spatial phase differences in the periodic changesof NADH absorption may be observed by comparing the sequences of numbers. Thechange in the left peak is opposite to that of the right peak.
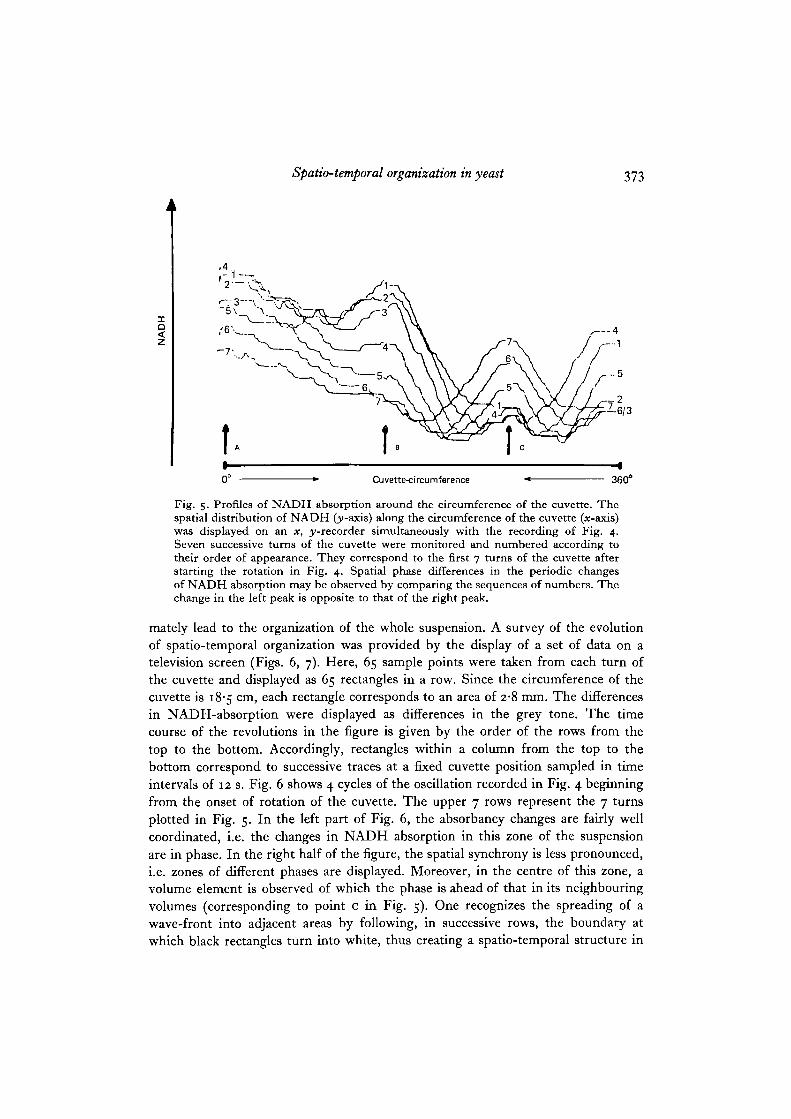
mately lead to the organization of the whole suspension. A survey of the evolutionof spatio-temporal organization was provided by the display of a set of data on atelevision screen (Figs. 6, 7). Here, 65 sample points were taken from each turn ofthe cuvette and displayed as 65 rectangles in a row. Since the circumference of thecuvette is 18-5 cm, each rectangle corresponds to an area of 2-8 mm. The differencesin NADH-absorption were displayed as differences in the grey tone. The timecourse of the revolutions in the figure is given by the order of the rows from thetop to the bottom. Accordingly, rectangles within a column from the top to thebottom correspond to successive traces at a fixed cuvette position sampled in timeintervals of 12 s. Fig. 6 shows 4 cycles of the oscillation recorded in Fig. 4 beginningfrom the onset of rotation of the cuvette. The upper 7 rows represent the 7 turnsplotted in Fig. 5. In the left part of Fig. 6, the absorbancy changes are fairly wellcoordinated, i.e. the changes in NADH absorption in this zone of the suspensionare in phase. In the right half of the figure, the spatial synchrony is less pronounced,i.e. zones of different phases are displayed. Moreover, in the centre of this zone, avolume element is observed of which the phase is ahead of that in its neighbouringvolumes (corresponding to point c in Fig. 5). One recognizes the spreading of awave-front into adjacent areas by following, in successive rows, the boundary atwhich black rectangles turn into white, thus creating a spatio-temporal structure in

374 H. Jacobsen, H.-G. Busse and B. Havsteen
Fig. 6. Graphical representation on an oscilloscope screen of spatio-temporal organ-ization in cell suspension: Each trace of Fig. 5 is digitized and displayed in thisfigure as a horizontal line of rectangles. The intensity of light in each rectanglecorresponds to the NADH absorption at that position in the cuvette. Successive tracesare arranged from the top to the bottom in the order of their appearance, e.g. thetraces 1 to 7 of Fig. 5 are the first 7 horizontal lines. The pattern in the suspensionshows a regularity which is to be expected from spatio-temporal structures.
this part of the cell suspension. The wavefront is annihilated as soon as it collideswith another wave. This occurs at the zone of high synchrony in the left half of thegraph. The volume which in phase is ahead of its neighbours seems to act as apacemaker, which synchronizes neighbouring cells and thus organizes a limited zoneof the suspension.
Fig. 7 shows a graphical representation of a similar experiment. Again, travellingwavefronts which repeatedly are originating from the same point may be recognizedby following the boundary of strong intensity changes in successive rows. In this case,

Spatio-temporal organization in yeast 375
Fig. 7. Spatio-temporal organization in a yeast cell suspension (see Fig. 6). Whereasin Fig. 6 the whole circumference of the cuvette can be fitted to a single wave-structure, i.e. in a horizontal line there is only 1 minimum and 1 maximum of theNADH absorption, here, 2 waves fit into the cuvette. This may be verified, e.g. byexamining the 20th line. Moreover, there exist positions in the cuvette where theNADH variations are small compared to those in other positions (compare a verticalline through a position at one third of the screen width from the right edge of thepicture with one at one third of the screen width from the left edge).
the spatial wave is fully developed and a spatial wavelength of the emerging structureof about 10 cm was calculated. Since this wave is reproducible over several cycles,evidence of a stable spatio-temporal structure has been demonstrated.
DISCUSSION
Spatio-temporal structures developed by oscillating reactions are believed to beinvolved in supracellular morphogenetic processes. Evidence of the existence of suchstructures has been provided by observations of the characteristic aggregation pattern

376 H. Jacobsen, H.-G. Busse and B. Havsteen
of the slime mould Dictyostelium discoideum. This phenomenon is now known toarise from a periodic signal transmission generated by an intracellular biochemicaloscillatory reaction (Hess et al. 1975; Gerisch, Huelser, Malchow & Wick, 1975).Up to date, no good evidence for the development of chemical waves and spatio-temporal organization in cell communities exists except for these organisms. Ourrecords of the spatial distribution of NADH-absorption in yeast cell suspensionsmay partly fill this gap, since they show directly the generation and propagation ofchemical waves as well as the emergence of a supracellular organization in a previouslyuniform cell suspension.
The strong coupling between the single yeast cells is reflected in the high degreeof spatial synchrony in certain parts of the system, i.e. neighbouring cells are nearlyin the same metabolic state. The individual cells are induced by this synchronizationto adjust their individual behaviour to their environment, thus producing structuresof macroscopic dimensions. The magnitude of the structures observed here clearlyexceeds the one which may be expected in morphogenetic processes of multicellularorganisms but does not necessarily disprove the connexion.
Yeast cells may communicate with the aid of an extracellular substance in a mannersimilar to that of cAMP in Dictyostelium discoideum during aggregation. In thatcase, the velocity of signal transmission and the magnitude of the resulting structuresmust depend on, for example: (1) the molecular properties of the diffusible agent,(2) its extracellular concentration gradient in the macroscopic structure, and (3)the threshold concentration at which individual cells respond. Adequate changes ofthese parameters must change the magnitude of the structure and the velocity ofspreading to values which are compatible with the requirements of morphogeneticsignal transmission. Since the molecular mechanism of synchronization in oscillatingyeast cell suspensions at present is not well understood, direct experiments are notyet feasible.
The biological significance of the glycolytic oscillations, their synchronizingcapability and the associated spatiotemporal structures in yeast suspension, remainfor the time being obscure, because no circumstances are known under whichSaccharomyces uvarum undergoes a development in multicellular stages which woulddemand an intercellular communication. This may be a latent ability inherited bythe yeast but superfluous in its evolutionary niche. Nevertheless, these experimentsdemonstrate how macroscopic structures can develop in a cell community whichhad been previously in random order and could serve as a model for processeswhich take place in cell tissues of more highly developed organisms but which areas yet inaccessible to experimental detection.
The support by the Deutsche Forschungsgemeinschaft, Bonn, is greatly acknowledged.
REFERENCES
CHANCE, B., ESTABROOK, R. W. & GHOSH, A. (1964). Damped sinusoidal oscillations ofcytoplasmic reduced pyridine nucleotide in yeast cells. Proc. natn. Acad. Set. U.S.A. 51,1244-1251.
Spatio-temporal organization in yeast 377
GERISCH, G., HUELSER, B., MALCHOW, D. & WICK, U. (1975). Cell communication by periodiccyclic AMP pulses. Phil. Trans. R. Soc. B 272, 181-192.
GHOSH, A. K., CHANCE, B. & PYE, E. K. (1971). Metabolic coupling and synchronization ofNADH oscillations in yeast cell populations. Archs Biochem. Biophys. 145, 319-331.
GOODWIN, B. C. & COHEN, M. H. (1969). A phase-shift model for the spatial and temporalorganization of developing systems. J. theor. Biol. 25, 49-107.
HESS, B. & BOITEUX, A. (1968). Mechanism of glycolytic oscillations in yeast. I. Hoppe-Seyler'sZ.physiol. Chem. 349, 1567-1574.
HESS, B., BOITEUX, A., BUSSE, H. G. & GERISCH, G. (1975). Spatiotemporal organization inchemical and cellular systems. Adv. chem. Phys. 29, 139-168.
HESS, B., BOITEUX, A. & KROGER, J. (1969). Cooperation of glycolytic enzymes. Adv. EnzymeRegul. 7, 149-16?.
KXITZING, L. (1970). Metabolic control in flow systems. I. Sustained glycolytic oscillationsin yeast suspensions under continual substrate infusion. Arch. Mikrobiol. 71, 220-225.
PAVLIDIS, T. (1973). Biological Oscillators: Their Mathematical Analysis. New York & London :Academic Press.
SCHATZ, G. & KOVAC, L. (1974). Isolation of promitochondria from anaerobically grownSaccharomyces cerevisiae. Meth. Enzym. 31, 627-632.
STERN, C. D. & GOODWIN, B. C. (1977). Waves and periodic events during primitive streakformation in the chick. J. Embryol. exp. Morph. 41, 15-22.
WINFREE, A. T. (1974). Rotating chemical reactions. Scient. Am. 23o(G), 82-95.
{Received 30 August 1979 - Revised 22 November 1979)
25 CEL 43