Embed Size (px)
Citation preview

York Mills Collegiate Institute
SPH4U
Course Handbook
Fall 2015
Student Name:

1
SPH4U: Course Syllabus
Course Website: http://abelmoodle.abel.yorku.ca/moodle/course/view.php?id=387
This syllabus contains a list of all classes, topics and homework in the Gr. 12 physics course. You are strongly encouraged to
explore the simulations and videos listed for each lesson – they are optional but quite interesting!
Day Topics Homework Extras
Introduction
1 Course Introduction,
How to Answer a Question
Sign-up with course website
Have parents sign course outline
Handbook: How to Answer a Question
Video: Top 10 Amazing Physics Videos
2 Groups Work Handbook: Thinking About Your Brain
(read the article and answer the questions)
3 Measurement and Numbers Handbook: Measurement and Numbers Video: Scientific Notation
4 Fermi Problems Fermi Problem #1, on solution sheet Lesson: Fermi Problems
5 Short quiz on Introduction Fermi #2, on solution sheet Gr. 11 Review Questions: 1-D Kinematics
Gr. 11 Review Lessons: Kinematics
Motion 1 Uniform Acceleration Problems: pg. 27, #20, 22, pg. 38,
#15 (Use solution sheets!)
Read text: pg. 24-27
Active Physics: Motion Diagrams
Course website: Graphing Kinematics Review Sheets
2 Representations of
Motion
Handbook: Representations of
Motion
Read text: pg. 11-13, 20-24
Active Physics: Graphs from Motion
Active Physics: Motion from Graphs
Video: Converting Between Graphs - Slopes
Video: Converting Between Graphs - Areas
3 Cooperative Group
Problem Solving
Problems: pg. 65 #22, pg. 67 #47 Active Physics: Car Catches Truck
Simulation: The Moving Man
4 CGPS Problems: pg. 65 #21, 26,
Fermi #3
Read: pg. 35-8
Active Physics: Balloonist Drops Lemonade
Active Physics: Avoid the Collision
5 CGPS, continued
Special Events
Complete ball toss problem,
Fermi #4
6 The First Law in 2-D Handbook: 2-D Motion Simulation: Maze Game
7 Vector Components Handbook: Vectors and Components
Read: pg. 756-7
Active Physics: Velocity Components
Video: Components Video 1
Video: Components Video 2
Video: Components Video 3
8 Projectiles! Handbook: Projectiles!
Read: pg.41-45
Active Physics: Changing x-velocity
Video: Velocity Vector Components
Video: Crazy Motorcycle Jump
9 Projectile Problem
Solving
Problems: pg. 46 #5, pg.51 # 8,
Fermi #5
Read: pg. 46-48
Active Physics: Target Practice I
Video: Projectile Problem Solving
10 Projectile Problem
Solving, continued
Problems: pg.51 #5, 7,
Fermi #6
Active Physics: Target Practice II
Simulation: Projectile Motion
11 CGPS Review for test
Problem: pg. 171 #50
12 Test
Forces
1 Representing Forces Hand Book: Representing Forces Gr. 11 Review Lessons: Newton’s Laws
Gr. 11 Review Questions: Newton’s Laws
2 Forces in 2-D Handbook: Forces in 2-D
Homework
Read: pg. 81-83
Active Physics: Rocket Blasts Off

2
Simulation: Forces in 1 Dimension
Video: Simple Force Example
3 Understanding 2-D Forces Problems: pg. 92 #6 a-c, pg.118
#23, Fermi #7
Active Physics: Sliding on an Incline
Simulation: The Ramp: Forces and Motion
Video: Forces with Angles 1
Video: Forces with Angles 2 , Read: pg. 88-9
4 Newton’s 3rd
Law Handbook: Magnets and the Third
Law
Problem: pg. 244#1a
Read: pg. 93-94
5 Weight and Acceleration Problems: pg. 93#9, Fermi #8 Video: Forces and Elevators
6 CGPS Problems: pg. 96 #9
7 Frames of Reference Problems: pg. 110 # 2, 3
Video: Frames of Reference
Read: pg. 108-110
8 Strings and Composite
Objects
Problems: Pg. 94 #10, pg. 95-96 #3,
7
Lesson: Multiple Bodies
9 Tension and Pulleys Problems: pg. 92 #5, pg. 95 #5
Active Physics: Atwood Machine
Video: Atwood Machine
10 CGPS Problems: pg. 96 #10
11 Friction! Problems: Pg. 101 #3, 7, pg. 168
#25, Fermi #9
Active Physics: Push Crate Up Wall
Read: pg. 97-101
12 Friction!
(continued)
Problems: Pg. 118 # 16, 25(a),
Fermi #10
Active Physics: Skier Goes Down
Simulation: Forces and Motion
Video: Inclines with Friction
Video: Pulley, Incline, Friction
13 Going in Circles Problem: pg. 101 #5 Video: Circular Motion Idea
Simulation: Ladybug Motion 2D
14 Going in Circles, continued
Radial Acceleration
Handbook: Going in Circles
Read: 122-126
15 Radial Acceleration
(continued)
Problems: Pg. 126 #8, 10, Fermi
#11
Active Physics: Centripetal Acceleration
Video: Conical Pendulum
Video: Frames of Reference
16 Thinking About Circular
Motion
Read: pg. 130-133
Problems: Pg. 133 #3, Pg. 138 #4, 6,
Fermi #12
Active Physics: Problem Solving
Simulation: Ladybug Revolution
Video: Tension in Vertical Circle
17 CGPS Problems: pg. 138 #9, Fermi #13 Active Physics: Car Circles Track
18 Universal Gravitation Read: pg. 139-142
Problems: pg. 143 #11, 12
Simulation: Lunar Lander
Video: Universal Gravitation
19 Orbits Problems: Pg. 147 #2, 6, use table
pg. 776
Active Physics: Satellites Orbit
Lesson: Satellites
Simulation: My Solar System
Video: Gravity in Orbit
Video: Why Doesn’t the Moon Fall Down?
20 Orbits
(continued)
Lesson: Orbital Calculations
Video: Dark Matter
21 Test on Dynamics Test Review: pg. 117 #7, 24 (text
answer wrong), 28, pg. 168 #16, 19,
20, 23, 24, 26, 27
Energy and Momentum
1 “Oomph” Handbook: “Oomph” parts C and D,
pg. 243 #5
Read: pg. 232, 239-240
Active Physics: Save an astronaut
Video: Intro to Momentum
Lesson: Conservation of Momentum
2 The Idea of Conservation Problems: pg. 237 #8, 10a, pg. 248
#6, Fermi #14
Read: pg. 233-6
Active Physics: Momentum and Energy
Lesson: Isolated Systems
Video: Slow Motion Collision
Video: Impulse, Lesson: Impulse
2 Types of Collisions
CGPS
Problems: pg. 252 #12, 13, 14
Read: pg. 246-7
Active Physics: Elasticity

3
4 Car Crash!
Conservation of Momentum
in 2-D
Handbook: 2-D Momentum
Problem Solving
Problems: pg. 257 #3
Read: pg. 256-8
Video: 1968 Crash Test
5 2-D Collisions Problem: pg. 257 #5, pg. 258 #3
Active Physics: P and E Conservation
Simulation: Collision Lab
6 Work and Kinetic Energy
Problems: pg. 181 #7, pg. 183 #7,
pg. 186 #4,
Fermi #15
Active Physics: Work
Simulation: The Ramp
Video: Roller Coasters
7 Collisions Quiz,
Energy and Coordinate
Systems
Problems: pg. 197 #6, pg. 201 #5,
pg. 227 #17
Lesson: Work
8 Energy Transfers Problems: pg. 200 #13, pg. 202 #8,
10
Handbook: Transfers of Energy
Active Physics: Energy Bar Charts
Simulation: Energy Skate Park
9 The Ballistics Pendulum Problem: pg. 270 #20,
Fermi #16
Active Physics: Pendulum Bashes Box
10 Spring Force and Energy Problems: pg. 206 #5 Read: pg. 203-206
Video: Hooke’s Law, Video: Energy in
Springs
11 Spring Force and Energy,
continued
Problems: pg. 211 #10, 12a, 13,
Fermi #17
Read: pg. 207-210
Active Physics: Inverse Bungee
Simulation: Masses and Springs
12 CGPS Problems: pg. 229 #38
Review: Momentum
Review: Work and Energy
13 Test Review: pg. 307 #4, 5, 10, 14, 18,
20, 26, 48
Special Relativity
1 Velocity and Frames of
Reference
2 Space and Time
Handbook problems: #1-7, identify the
types of intervals only, don’t solve!
Active Physics: Time Dilation
Video: Special Relativity
Active Physics: Length Contraction
Video: Visualizing Relativity
3 The Gamma Factor Handbook: full solutions for #1, 2, 5, 6
4 Relativity Problem Solving,
continued
Visualizing Relativity
Handbook: full solutions for #3, 4, 7
5 Energy and Relativity Handbook problems: #8-10 Video: Einstein Talks
6 Energy and Relativity Handbook problems: #11,12
Text: pg. 690-691
Video: Large Hadron Collider (LHC)
Video: Proton Antiproton Collision
Electric and Magnetic Fields
1 A New Kind of Interaction Read: pg. 318 – 322
Simulation: Static Electricity
2 Relativity Quiz,
A New Kind of Interaction
(continued)
Handbook: A New Kind of
Interaction Homework
3 The Strength of
Electrostatic Interactions
Problems: pg. 331 #3, 336 #10
Active Physics: Coulomb’s Law
Video: Charge and Coulomb’s Law
4 Analyzing Electrical
Forces
Problems: Pg. 335 #4, 334 #8 Read: pg. 332-334
Active Physics: Combining Charges
5 Picturing Electric Forces Problem: pg. 334 #9 (find the
magnitude only)
Simulation: Chargesand Fields
Lesson: Electric Force and Fields
6 The Electric Field Concept Handbook: Field Concept
Homework
Simulation: 3-D Electric Fields
Lesson: Electric Field
7 The Superposition of
Fields
Read: pg. 342 (sample problem
2) and pg. 353 (sample problem
Active Physics: Electric Fields
Active Physics: Field of Dipole

4
4)
Problems: pg. 347 #3, pg. 344#4,
pg. 354 #3, pg.379 #27
Lesson: Calculating Electric Fields
Lesson: Calculating Electric Fields 2
Simulation: Electric Field Hockey
8 Moving Charges in an
Electric Field
Problem: pg. 371 #1
and finish worksheet / summary
Read: pg. 369-370
9 CGPS Problem: pg. 371 #2, pg. 380
#35
10 Magnetic Fields
Read: pg. 384-5 and pg. 387-8 (Field of a Straight
Conductor)
Active Physics: Field Around Wire
Video: Magnetism Review
11 Magnetic Forces on
Charges
Read: pg. 392-5 (Sample
problem 1b, c only)
Problems: pg. 402 #1, 4, 7, pg.
396 #2-4
Active Physics: Magnetic Force
Active Physics: Mass Spectrometer
Simulation: 3-D Magnetic Fields
Video: Force on Moving Charges 1
Video: Force on Moving Charges 2
Image: Hi-res Bubble Chamber
12 Electromagnetic
Disturbances
Read: pg. 530-33
Simulation: EM Waves
Simulation: EM Waves 2
13 Understanding EM Waves Simulation: Antenna
14 Light and Polarization Problems: pg. 498 # 4
Read: pg. 494-5
Active Physics: Polarization, Lesson: Polarization
Video: Polarizing Filters
Video: Polarization and Internal Stress
Video: LCD Screens
Review: Electrostatic Forces and Fields
15 Properties of 2-D Waves –
diffraction, interference
Problems: pg. 454 #2, 3
Read: pg. 453-4
Simulation: 2-D Waves
16 Test
Course Website 1. Go to the website: http://abelmoodle.abel.yorku.ca
2. On the right side of the page click on the “Create new account” button below the login button.
3. Use the initial of your first name followed by your last name for your user name (for example jsmith for John
Smith). Choose any appropriate password. Remember your password!!Follow the rest of the instructions for logging
in.
4. A message will be sent to your e-mail address. Follow the instructions in this message to validate your account.
5. Go back to the website: http://abelmoodle.abel.yorku.ca and login with your username and password.
6. Once you have access to the list of courses click on the Toronto District School Board science category and your
course is called: York Mills 12 Physics. Click on the course name.
7. Type your enrollment key in the text box. The enrollment key to get in is: ym12physics
References Many excellent resources were adapted to develop the physics lessons in this document. Many other resources inspired ideas
here and there. Listing them all would take pages, but here are a few of the most influential ones:
Laws, Priscilla W., and Robert J. Boyle. Workshop physics activity guide. New York: Wiley, 1997.
Heller, Pat and K. Heller. Cooperative Group Problem Solving:
http://groups.physics.umn.edu/physed/Research/CGPS/GreenBook.html
Van Heuvelen, Alan, and Eugenia Etkina. The physics active learning guide. Pearson/Addison-Wesley, 2006.
Etkina, E. Physics Union Mathematics. http://pum.rutgers.edu/
Knight, Randall D., and Juan R. Burciaga. "Five easy lessons: Strategies for successful physics teaching." American
Journal of Physics 72.3 (2004): 414-414.
Redish, Edward F., and Juan R. Burciaga. "Teaching Physics with the Physics Suite." American Journal of Physics 72.3
(2004): 414-414.

5
SPH4U: Learning Log Name:
One of the most important educational skills you can develop is how to monitor and track your own learning. Either at the
end of class or at home, you will complete a daily entry in your learning log.
Written Work: Use our marking scheme for daily class work (out of 5) to assess your written work. What mark do you think
your work would receive if it was collected today?
Group Work: Use a marking scheme out of 5 to assess your contribution to the group’s work and discussions. Remember
that valuable contributions come in many forms: sharing ideas, asking questions, organizing the group, and more. If your
teacher was observing your group for the full period, what mark do you think you would get?
Learning Goals / Difficulties: Record the physics ideas you feel you learned well today. If you had difficulties with any
physics ideas make a note so you will remember to get help with them. Also note whether you had any difficulties with the
written work or group work, so can try to improve for the next class.
Homework: Check off the homework column once you complete the lesson’s homework. If you have a problem with a
question or get stuck, write down the question number.
Got it: Record the result of your effort to resolve any difficulties you had with the lesson or homework. For example, you
might write: help from friend, saw teacher, figured it out, etc. If you had no difficulties or problems to take care of, check
off this column indicating that you feel very confident that you understand the material of that lesson.
As your log fills up, get new pages from the course website or in class. It is your responsibility to keep you log up to date and
have it ready for random checks in class, just like any homework.
Date Lesson Written
Work
Group
Work
Learning Goals / Difficulties Home-
work
Got it
Oct. 8
Motion
#7
4
3
- Vector components, component triangle, writing vectors
- Didn’t understand how to find resultant vector
- Was confused / didn’t ask many questions
#3
Figured
it out

6
SPH4U: Learning Log Name:
One of the most important educational skills you can develop is how to monitor and track your own learning. It is your
responsibility to keep you log up to date and have it ready for random checks in class, just like any homework.
Date Lesson Written
Work
Group
Work
Learning Goals / Difficulties Home-
work
Follow-
up

7
SPH4U: Grade 12 Physics University Preparation
Course Website: http://abelmoodle.abel.yorku.ca/moodle/course/view.php?id=387
An Inquiry-Based Course
Welcome to the wonderful world of physics! SPH3U is an introduction to the world of physics and a prerequisite for the
grade 12 course, SPH4U. This course is designed according to the principles of Physics Education Research which clearly
demonstrate the power of learning through inquiry in a collaborative group format. Major Canadian and American
universities (U of T, McGill, McMaster, MIT, Harvard, Stanford and more) are transforming their introductory physics
courses by reducing or eliminating traditional lectures and replacing them with engaging activities that have a deep
conceptual and practical focus.
Homework
The majority of the class time will be spent doing activities and discussing physics with your colleagues. At home you will be
responsible for solving problems using our solution format. You should expect about 45 minutes of physics homework per
day on average. Homework problems will be randomly submitted for assessment and must be present at the time of
collection. Optional textbook readings, online lessons and resources are listed in the syllabus for each lesson.
Assessment and Evaluation
Due to the central role of group work in this course, the work you do in in class will account for an important portion of your
mark. Daily work will be randomly handed-in and assessed. To help ensure that individual students are pulling their weight
in groups, there will be regular quizzes and tests. There is a final exam that covers the entire course material and a major
project that will be announced halfway through the course.
Mark Breakdown
The categories of Knowledge and Understanding( K/U), Thinking and
Inquiry (T/I), Communication (C), and Application (A) are a component
of most of the assessments used in this course – however some focus on
certain categories more than others. The basic mark breakdown for the
course is 70% term work and 30% final examination. The term mark is
composed as shown in the chart to the right.
Attendance and Punctuality
Students who are absent are responsible for determining what was missed
and making sure that they are caught up before the following class. If
possible, please discuss with your teacher before you miss the class.
Missed Tests
If you miss a test you must:
Let your teacher know in advance if it is due to a pre-arranged reason (i.e. appointment for surgery)
Call in to the school so your name goes on the daily “Absent List” in the main office.
Contact your teacher immediately after setting foot in the school upon your return.
Do not discuss the test by any means with your colleagues.
Be prepared to write the test immediately, at my discretion.
Please Read This Document!
Please sign below signifying that you have read this course description.
____________________________________ __________________________________
Signature of parent, or student if 18 and over Print name
K/U 28% Tests
~ 7 % each
T/I 14% Daily work and regular quizzes
~ 1.5 % per group work check
~ 1.5 % per quiz
C 14% Tests and Problem Solutions
~ 0.5 % per problem solutions
or learning log
~ 3 % per test
A 14% Challenges (CGPS) and Project
~ 1 % per challenge
~ 7% for project

8
SPH4U Homework: How to Answer a Question Name:
Sign up with the course website and follow the Course Introduction and Kinematics Lessons link. For day 1, click on the link
to: Top 10 Amazing Physics Videos. Explore the videos and select one to focus on when you answer the questions below.
Remember the four criteria for high quality responses!
A: Watch Videos and Earn Marks! What a Deal!
1. Record. What is the title of your chosen video?
2. Describe. Describe what you observed in the video (what you saw or heard, but not any explanations).
3. Reason. Which unit from grade 11 physics does the video connect most closely to? (Kinematics, Forces, Energy, Sound
and Waves, Electricity and Magnetism)
4. Explain. What was one interesting or surprising thing from the video?
B: Assess Your Responses
1. Evaluate. Use the questions below to help decide if your answers to the video questions are complete. Use the four
criteria to assess your responses to the questions above and give yourself a mark. Be honest!
Question Follow-Up Question Mark
A#2 Would your description be useful for someone who did not see the video? Explain.
A#3 Did you cite evidence from the video and connect it to specific ideas from a grade 11 unit?
Explain.
A#4 Did you explain why the “thing” you mentioned was interesting to you? Explain.
© C. Meyer, 2014

9
SPH4U: How to Answer a Question?
Sign up for your group roles today. Adjust your seating. Go through the
introduction below together with your group. Feel free to take turns reading.
High quality responses to any physics question must be correct, clear, concise and complete. We will routinely use these
terms and the notation explained below for the evaluation of your daily written work.
Criteria Description Notation
Correct The physics is correctly stated. Conclusions follow logically
from the stated evidence and refer to key definitions or laws.
Technical details are all present and correct.
Incorrect sections are underlined and given an
“ X ”. Correct ideas are checked “ ”
Clear The explanation is precisely stated with a good choice of
physics vocabulary. The explanation is straight forward with
no awkward or unclear phrases. Spelling and grammar are
correct.
Unclear sections are underlined with a wiggly
line and given a “?“ A
poor word choice is indicated by a wiggly
line. Spelling errors are cirlced.
Concise There are no extraneous or distracting statements which may or
may not be correct.
Phrases that are not relevant are crossed out.
Like this.
Complete No important parts of the explanation are missing. The
evidence supporting the conclusion is mentioned along with
the relevant definitions or laws.
Where an explanation is missing or
incomplete we will write “. . . .” or “and …”
or “more …” or give a clear hint at what is
missing: “force?”
A: The Crazy Ball
Once your group has read through the criteria, come to the front of the class and use the “crazy” ball (two hemispheres with
different densities). At this point your group is not allowed to talk.
1. Observe. Rest the ball on the table so its “equator” is horizontal. Push along the top of it to start it
rolling in a “straight” line. Do this a few times until everyone has had a chance to observe its
motion while it rolls. Then return to your seats and, without any discussion, record your
observations.
2. Reason. When your group is ready, take turns reading your observations to one another. Do not change what you have
originally written. In order for a response to be correct and clear, it must use appropriate physics vocabulary correctly.
What are the key physics terms that should be used to clearly describe how the ball was moving? For each term, explain
how to use it correctly in this example.
3. Describe. As a group, discuss a best way to describe your observations of how the ball moved. Record your revised
observations here. Help your recorder write your description on a whiteboard. Call over your teacher for feedback.
4. Explain. (individually) In what ways did your description of the ball’s motion improve after the group discussions?
Recorder: __________________
Manager: __________________
Speaker: __________________
0 1 2 3 4 5
© C. Meyer, Roberta Tevlin 2015
side view
force

10
The group discussion process you went through in developing the final description of your observations is a key component
of effective group work. Everyone shared their initial ideas, the group discussed the options and, together, agreed on a final
response. The final response is, of course, written in your own words. This collaborative approach gives each of you the
greatest chance of crafting a fantastic 5 out of 5 response for each question and improving your physics understanding.
5. Reflect. (individually) How comfortable did you feel when you read out your own description of the ball’s motion? Why
do you think you felt that way? What might help you improve?
The manager will help your group practice the group discussion process described above with each of the following
questions. An important part of this is to make sure people take turns being the first one to share ideas. If the same person is
always the first one to share, the others will get in to the habit of waiting for that person to speak. We all need to learn to
worry less about being right, and to practice confidently sharing our ideas, whatever they might be. To effectively learn, you
need to make clear to another person what you are currently thinking: only then can you begin to improve that thinking.
B: How to Learn and Earn
Your daily work in physics will earn marks based on the four criteria for high quality responses. An overall mark will be
assigned on a scale of 0 to 5 depending on how your responses meet the four criteria according to the rubric below.
0-2 3 4 5
Responses are missing,
fundamentally incorrect, or
challenging to understand. A
“yes or no” answer is given.
Response is
basically correct, but
contains problems
or omissions.
Response is correct,
but minor details
could be improved or
clarified.
Response is thoughtful, clear and
complete. If another physics teacher
saw it they would say, “Wow! A
grade 12 student wrote this?”
1. Evaluate. Another group (we won’t mention any names) offered this as their revised description:
After pushing it, the ball kind of wobbled while it moved forwards in an almost straight line. Its motion
was not very steddy and its speed was changing.
Use the 4 C’s criteria and notation to mark up their response. Determine a mark and justify your decision.
2. Predict. You will hold the ball on the table so its “equator” is vertical. You will then roll it forwards
along the equator. (Call your teacher if you are not sure what this means.) How do you think it will
move after it is released? (Note: groups do not need to agree on predictions, just share and discuss)
3. Observe. Go to the front of the class and try this out. Record your observations.
4. Reflect. (individually) What aspects of written work do you think you need to focus on the most in order to regularly
earn 4’s and 5’s? How can you take advantage of the power of groups to help with this?
(start your learning log now)
top view
force

11
SPH4U: Groups Work
Your group has a challenge: use the elastic attached to three strings (the “flux
capacitor”) to stack the cups into a pyramid. There are two rules: (1) only the
elastic can move the cups, and (2) you must hold the string by its very end.
Start!
A: Skills for the 21st Century
1. Reflect. What skills did your group make use of to accomplish (or partially accomplish!) this task?
2. Explain. Highlight one skill that you think was (or should have been!) the most important. Provide a short rationale.
Record this on your group’s whiteboard and move on.
Here is a reminder of what we learned in grade 11 about how groups in physics will work:
Roles Recorder: The recorder writes on the group whiteboard. The recorder helps each group member carefully record the
group responses to each question.
Manager: Organizes and leads the group through the investigation and helps keep members focused on the same task.
Speaker: Speaks to the class or responds to the teacher on behalf of the group. The speaker asks clarifying questions so
they would always feel comfortable explaining the ideas to someone who is not in our class.
Motivator: If there is a fourth member, this person energizes the group, offers new ideas, encourages/praises the group
Set-Up Sit in a triangle formation, facing one another. Take out a whiteboard and markers and have them ready for the group
discussions. Each group member is responsible for writing in their own words high quality responses for the investigations.
B: It’s All About Me?
Let’s think back to your group work experience in grade 11.
1. Reflect. (individually) It’s time to think about your performance in your grade 11 physics groups. For each habit listed
below give yourself a score (5 = very often, 1 = rarely) indicating how regularly you do that. Next, imagine that the
other members of your old groups were evaluating you; what score do you think they would give you? Finally, record a
reason why you do or don’t use that habit regularly.
Habit Your
Evaluation
Others’
Evaluation
Why
I worked on each question with
the other group members.
I respond to questions thoroughly
and thoughtfully.
I offer ideas to the group
discussions.
I ask for the ideas or concerns of
my other group members.
I make sure the group agrees on
each question before moving on.
I help explain ideas to the other
group members.
Recorder: __________________
Manager: __________________
Speaker: __________________
0 1 2 3 4 5
© C. Meyer, 2015

12
2. Reflect. (individually) Of all the habits listed above, which do you think would be the most important for you to improve
on? Explain why and how you might bring about the improvement in yourself.
C: It’s All About the Group
1. Reason. Does a student need to “know all the answers” in order to be a good member of a physics group? Explain.
2. Explain. Emmy, who is in your group, says, “I shouldn’t ask my group members questions because it will slow the
group down or it might get annoying.” How should you respond (constructively) to Emmy?
3. Explain. Isaac, who is also in your group, says, “The others in my group figure things out much faster than I do which
makes me feel less smart. I’m not sure if I belong here.” How should you respond (constructively) to Isaac?
4. Explain. Marie says, “I just want to hurry up and get the investigation done. I don’t think all this group stuff helps me
much.” How should you respond (constructively) to Marie?
D: In the Big Leagues
If you work in business or industry, you are pretty much guaranteed to be working in teams on projects that are too complex
for any one person to know everything or be able to do everything. New people will enter your teams all the time and,
whether you are a leader or team member, you will need to teach the new people many aspects of their job. Teaching people
effectively is a critical skill and, not coincidently, one of the best way to learn something yourself!
1. Reflect. (individually) Describe an example from grade 11 where sharing your ideas and explaining them helped you to
understand the ideas better yourself.
2. Reflect. (individually) Describe an example from grade 11 where you asked for help or clarification with something
and the discussion helped your group member improve their understanding.
(start your learning log now)

13
SPH4U Homework: Thinking About Your Brain! Name:
How Your Brain Learns and Remembers © 2007 Diana Hestwood and Linda Russell
Minneapolis Community & Technical College
Permission granted to individual instructors to use and reproduce for their own classroom.
Part 1: What Happens Inside Your Brain When You Learn Something New?
Meet Your Brain
Brain cells are called neurons. You are born with at least 100 billion neurons. Dendrites (fibers) grow
out of the neurons when you listen to/write about/talk about/ practice something. Learning is natural.
Neurons know how to grow dendrites, just like a stomach knows how to digest food. Learning is
growth of dendrites. New dendrites take time to grow; it takes a lot of practice for them to grow.
Connections Form between Neurons
When two dendrites grow close together, a contact point is formed. A small gap at the contact point is
called the synapse. Messages are sent from one neuron to another as electrical signals travel across the
synapse.
Practice Improves Connections
Special chemicals called neurotransmitters carry the electrical signals across the synapse. When you practice something, it
gets easier for the signals to cross the synapse. That’s because the contact area becomes wider and more neuro-transmitters
are stored there. When you practice something, the dendrites grow thicker with a fatty coating of myelin. The thicker the
dendrites, the faster the signals travel. The myelin coating also reduces interference. With enough practice, the dendrites build
a double connection. Faster, stronger, double connections last a very long time. You remember what you learned!
Short-term memory is VERY short!
If you learn something new and do it only once or twice, the dendrite connection is very fragile and can disappear within
hours. Within 20 minutes, you remember only 60%. Within 24 hours, you remember only 30%. But if you practice within 24
hours, and then practice again later, you remember 80%.
Make the Most of Practice Time…
You grow dendrites for exactly the same thing you are practicing. If you listen or watch while math problems are solved, you
grow dendrites for listening or for watching. If you read over your notes, you build dendrites for reading. If you actually
solve the problems yourself, you grow dendrites for solving.
Part 2: Brain Friendly Ways to Learn Better
A: Grow Your Intelligence
You can grow your intelligence, because your brain knows how to grow dendrites just like your stomach
knows how to digest food. Think about a baby who learns to speak in its native language without any special
classes or training!
B: Do Something Active to Learn
You must do something active to learn, like explaining, solving, drawing, or writing. That’s because dendrites
grow ONLY when you are actively doing something. No one else can grow dendrites for you!

14
C: Grow Off of What You Know
Dendrites cannot grow in a void. New dendrites can only grow off of what is already there. New skills must connect to, and
grow off of, previously learned skills. If you do not have the necessary dendrites in place, new material will seem to go “right
over your head”.
D: Give It Time and Practice
Learning takes time, because it takes a lot of practice for dendrites to grow. This is why you do homework. This is why trying
to cram everything into your brain the night before a test doesn’t work.
E: Mistakes Are Essential
Making mistakes, and getting feedback so you can correct them, allows you to check the accuracy of the connections in your
brain. Be sure to get feedback quickly so you don’t practice the wrong thing and build a strong, but wrong, connection!
Emotions Affect Learning and Memory
Anxiety floods your body with adrenaline (“fight or flight”).Adrenaline makes it hard for the neurotransmitters
to carry messages across the synapses in your brain. That causes “blanking out” on a test.
How can emotions help you?
Endorphins make you feel calm. Your body produces endorphins when you relax, exercise, laugh, or learn new
things. If you practice producing calming hormones, it will help when you are under stress.
Part 3: What Does All This Mean For Me?
Use your understanding from this article to answer the following questions. (Remember to give a 5/5 response!)
1. Explain. Marie says, “I understand what’s going on in the class just fine. But when I get home and start on the
homework assignment, why am I lost?” Explain to Marie why.
2. Explain. Isaac says, “I attend class and do all the homework and feel like I understand everything. Then why do I just
‘blank out’ on the test and can’t do anything?” Help Isaac understand why.
3. Explain. Emmy says, “Why should I do all this homework? It’s just the same thing over and over.” Respond to Emmy.
4. Explain. Albert says, “I’ve been absent for a week and there’s a test tomorrow. I’ll be fine if I cram tonight.”
So What Should You Do?
1. Do some of the homework as soon as possible after class, before you forget.
2. Try to practice new skills every day.
3. To manage anxiety, set aside regular study-time in your schedule, get lots of sleep and exercise, and learn simple
relaxation techniques such as slow, deep breathing.
4. Make sure you are actively DOING something when you study: draw pictures or diagrams, solve lots of problems, check
your answers
5. Check your understanding by explaining how to do a problem to another student.
6. Create a practice test for yourself. Work it in the same amount of time you’ll be given in class.

15
SPH4U: Measurement and Numbers
Measurements form the backbone of all science. Any theory, no matter how
slick, is only as good as the measurements that support it. Without careful
measurements, science becomes guess work, hunches and superstition.
A: The Meter Stick
Our most basic scientific tool is the meter stick. But, do you know how to use it? Really? For this investigation you will need
one meter stick
1. Observe. Each member of your group will independently (and secretly!) measure the height of your table. Don’t share
the results until everyone has made the measurement. Record everyone’s measured values here.
The number we read from a measurement device is the indicated value. The readability of a device is the smallest increment
or change in a quantity that you can discern from the measuring device. The readability is sometimes called the reading error,
but the term “error” is very problematic so we will avoid it. When we record a measurement, we should also record the
readability with a statement like: “scale readable to ± 1.0 cm”. The reported readability may vary from person to person. If
you think you can estimate a reading between the lines of a scale, do so. Always record a measurement as carefully as you
can.
2. Reason. What is the readability of your measuring device? Your estimation of the readability may be different from the
others in your group, and that can be OK as long as you are using the device appropriately. Explain how you decided on
your readability.
3. Reason. Now think about the height measurements your group has made. How do they compare with one another?
Would you say, roughly speaking, that there is a lot of uncertainty or little uncertainty in your group’s measurements?
Explain.
The true value is the actual, ideal value for a quantity that we are trying to measure. The true value of a quantity is usually
never known: in science this is simply not possible (welcome to science)! Through hard work and ingenuity, we try to get
our measurements (our indicated values) closer to the true value, but there is always some uncertainty in this since we never
get to know the true value!
4. Reason. Some groups find differences of about 0.5 cm amongst their height measurements. What are some suggestions
for a future group to reduce the differences in their height measurements? (This is the ingenuity we mentioned.)
B: The Stopwatch
Now we will examine another common measuring device. You will need one stop watch
1. Observe. Measure the amount of time for the pencil to drop from a 1 m height. Write this reading as a number in
decimal notation with units of seconds.
2. Reason. What is the readability of the stopwatch? Explain.
Recorder: __________________
Manager: __________________
Speaker: _________________
0 1 2 3 4 5
© C. Meyer 2015, adapted from John Denker

16
3. Observe. Perform the pencil drop seven times and record your data below.
4. Reason. Examine the individual measurements in your data above. You probably notice quite a bit of variation in them.
What might be responsible for the spread in these values?
Repeated measurements will usually produce a range or distribution of values. The size or width of this distribution is a
measurement of the uncertainty in our result. One technique to find the width of the distribution is the standard deviation,
but we will not use this in grade 12 physics. Instead, we will define the uncertainty (σ) by making a very crude estimation of
the width (really the half-width) of the distribution:
σ = (high value – low value)/number of measurements
Use the readability of your measuring device to limit the number of digits in your uncertainty result.
5. Reason. Based on your measurements, what is your best estimation of the true value for the time for the pencil drop?
What is the uncertainty in this result? Show your work.
When we present a calculated result based on our measurements we typically report two numbers, the best value (m) and the
uncertainty (σ) written as: m ± σ. This expression represents a distribution of values centred at the value m and with a width
of σ on each side. We interpret this expression by saying, “m is our best estimation of the true value, but we wouldn’t be
surprised if the true value was as high as m + σ or as low as m – σ.”
6. Reason. When you computed your best value, the calculator likely displayed many digits. Use your uncertainty to help
decide how to write the digits of your final result in the form m ± σ. Write your result with uncertainty on a whiteboard.
In the past you may have learned unhelpful rules about significant digits. There is just one proper rule: only the uncertainty
in a value determines which digits are significant (or meaningful). Use the value of the uncertainty to limit the number of
digits you write down.
[e.g. your calculator reads 12.75834 and the uncertainty is ± 0.3, you write 12.8 m ± 0.3 m or 12.8(3) m]
In other situations, like textbook problems or calculated results, we don’t know the uncertainty and will use some simple
rules for writing our numbers:
When recording results, just use three significant digits to avoid too much rounding error (3 digits determined by how it
would be written in scientific notation. e.g. your calculator reads: 1 056 428, you write: 1 060 000 or 1.06x10⁶).
For middle steps in calculations, keep a fourth or fifth guard digit to help reduce the amount of rounding error.
Out of convenience, we will write 5 instead of 5.00, with the understanding that it has three significant digits
7. Calculate. Make a calculation to predict the time for the pencil to drop (use the equation ∆y = v1∆t + ½a∆t2 and a = 9.8
m/s2).
A fundamental process in science is to decide whether two results “agree” with one another. We will adopt a simplified
decision rule for this. Two results agree with one another if one lies within the uncertainty distribution of the other, or if their
distributions overlap. In more advanced studies, you will refine and greatly strengthen this crude rule.
8. Evaluate. Does this calculated value agree with your measured result? Explain.

17
SPH4U Homework: Measurement and Numbers Name:
A: The Pebble Drop
It is sunset. You and a friend walk on to a bridge that passes over a river. After gazing off into the distance and into each
other’s eyes you both arrive at the same question: How high are we above the water? Luckily you have your smartphone with
a timer app. Your friend finds a few rocks which he releases (v1 = 0). You time the fall until you see them splash in the water
below. Your data is shown below.
1.73 s 1.79 s 1.82 s 1.69 s 1.81 s 1.77 s 1.74 s
1. Calculate. Based on your measurements, find the best value for the time for the rock to fall. Express your result in the
form m ± σ with an appropriate number of digits. Show your work.
2. Calculate. Use your time result to calculate the distance the rocks fell (use ∆y = v1∆t + ½a∆t2). Your result from the
calculation should use one or two guard digits. When write your final statement, use three digits.
D: Mathematical Representation Describe steps, complete equations, algebraically isolate, substitutions with units, final statement
We don’t know the uncertainty in your final calculated result. Since the time value you used in the calculation has an
uncertainty, we expect the distance result to also have an uncertainty. There are sophisticated techniques to find this
uncertainty, but we will not use these in grade 12 physics. Instead, make a simple, somewhat educated, estimation (guess!)
for the uncertainty in the final quantity. For example, do you think your result is reliable to 1%, 5%, or 10% of its value?
Decide and use that to estimate an uncertainty. This is an extremely crude technique whose purpose is to make you aware that
there are uncertainties in scientific calculations and that these uncertainties guide our scientific decision making.
3. Evaluate. Do you think your calculated result is reliable to within 1% of its value? Or maybe 10%? Or maybe in
between? State your estimated uncertainty and use it to write your final result with an uncertainty. (For example:
estimated uncertainty is 10%, y = 27.5 m ± 2.8 m)
4. Evaluate. You use your smart phone to look-up the height of the bridge and find a result of 15.1 m. Does your calculated
result agree with this value? Explain.
© C. Meyer, 2015

18
SPH4U Homework: Fermi Problems
When you solve a Fermi problem, be sure to (1) define your key ideas with symbols and justify your estimation of them, and
(2) construct an algebraic equation showing how you use the defined symbols, show the substitutions with units and write a
final statement. We will consider these to be parts A, C and D of our solution process. Do not do any research for these
problems!
1. A stuntwoman steps off an apartment building and lands
in a giant airbag. Carefully estimate the quantities you
will need in order to calculate the acceleration of the
stuntwoman while in contact with the airbag using a BIG
5.
2. A hockey stick collides with a puck during a powerful
shot from the blue line. Carefully estimate the quantities
you will need in order to calculate the acceleration of
the puck while in contact with the stick using a BIG 5.
3. You are walking down the hallway and you realize you
forgot your physics binder in your locker. You suddenly
turn around to get it before you are late for class. What
is your acceleration while you turn around? Carefully
estimate the quantities you will need in order to
calculate your acceleration using a BIG 5.
4. What acceleration does your body experience during a
sudden stop in a car in a local parking lot? Estimate the
quantities you will need in order to calculate the
acceleration. Show your reasoning and justify any
quantities you estimate.
5. After a successful semester of Gr. 12 physics you decide
to try a career as a stunt man/woman/thing. For practice,
you stand on top of a speeding train, step off, and land in
a swimming pool that passes by in the ground right
beside the train. Calculate the distance in advance of the
pool when you step off the train.
6. After a successful semester of Gr. 12 physics you decide
to try a career as a stunt man/woman/thing. For practice,
you drive your motorbike to a parking lot where there is
a bus parked. You set up a ramp that makes an angle of
40o with the ground. Your goal is to jump over the bus!
What is the minimum speed in km/h you should use?
7. What is the size of the force the ground exerts upon you
when you push off to jump up high in the air? Use
kinematic estimations to help determine your answer.
8. You take a ride in an elevator and travel upwards to the
top floor of a building. As the elevator slows down you
notice that you feel lighter. Estimate the quantities
necessary to calculate your acceleration and then
calculate your apparent weight while the elevator is
slowing down.
9. A car screeches to a halt at a traffic light on York Mills
Ave. Estimate the kinematic quantities you will need in
order to calculate μ.
10. I saw the funniest thing one day in the school parking
lot. I was arriving at school in the morning and someone
(surely not a teacher) got into their car and started to
drive away. And they obviously forgot a box of Timbits
on the roof of their car! What is the maximum
acceleration possible for the car such that the Timbits
don’t slide off the roof? Estimate the quantities
necessary (including the coefficient of static friction) to
calculate the acceleration.
11. A car turns the corner from Bayview onto York Mills.
Estimate quantities related to the motion and
characteristics of the car that allow you to calculate the
acceleration. What is the size of the force responsible for
turning the car?
12. You push your little cousin on a swing until she is
travelling quite high. How heavy does she feel (apparent
weight) at the lowest point in the swinging motion?
Estimate the quantities relating to her motion and
calculate the forces. Show your reasoning and justify any
quantities you estimate.
13. I was with my daughter at the park one day, pushing her
on the swings. I began to wonder: How fast would she
need to be going at the top of her trip in order to go all
the way upside-down (all the way around?)
14. What is the average force a baseball bat exerts on a ball?
Estimate the basic quantities involved and use impulse
and momentum to answer this question.
15. A long-jumper lands in a sand-pit. What is the average
stopping force the jumper experiences? Estimate the
basic quantities involved and use the energy techniques
to answer this question.
16. When I see a traffic light turn red I will sometimes just
let the car glide to a stop instead of using my brakes.
Estimate the quantities involved and make a calculation
using energy techniques to find the size of the force of
friction (the internal friction of the car's mechanical
systems) that brings the car to rest.
17. A billiard ball bounces off the cushion on the edge of the
billiard table. During the collision, the cushion
compresses like a spring. Estimate quantities related to
the ball and its motion. Use these to calculate an
approximate value for the spring constant of the cushion.
© C. Meyer, 2015

19
SPH4U: Fermi Problems
Enrico Fermi is a legend in the world of physics. He had a remarkable ability to
find rough but reliable answers to complex problems use simple reasoning and
skilful estimations. We want to be like Fermi and solve “Fermi Problems”!
A: Feeling Hungry?
Here is your first Fermi problem: What mass of food do Torontonians eat in one year?
1. Reason. Imagine you had a truly smartphone that would allow you to look up the information you need to solve this
problem. What information would be helpful to know for your solution? Record these on your whiteboard. You will
share these with the class.
2. Record. We will call these pieces of information our key ideas for the Fermi problem solution. Record them here.
In Fermi problems, we don’t usually know the values for our key ideas so we will need to estimate them. Because of this, we
won’t have many reliable or significant digits. Use just one digit to write number in scientific notation whenever it is helpful.
You should be able to do all the math without a calculator! When you write the values for the key ideas, assign a variable for
each.
3. Reason. One key idea is the number of days per year. A sample is shown below of how you should write this. Write
the value for this key idea using one digit in scientific notation.
Number of days per year: d = days/year (common knowledge)
Every number you use in a Fermi problem needs to be justified or explained. If a number is well known, indicate it as
common knowledge. If it is not, you need to explain how you come up with it. The starting point for all estimations should be
some number that you do know. You work from that number to get the value of your key idea.
4. Reason. Another key idea is the mass of food eaten by one person each day. You have seen many numbers associated
with the food you eat. Use this to start your estimation. Explain your estimation using words or simple calculations.
Mass of food per person per day: m =
Population of Toronto: p =
5. Calculate. Create an equation using symbols that will give a solution to the problem. Substitute the values (including
units!) into the equation. State a final answer with one digit in scientific notation. Record your final statement on a
whiteboard.
Total mass: mt = m•p•d
**please call your teacher over to check your solution**
Recorder: __________________
Manager: __________________
Speaker: _________________
0 1 2 3 4 5
© C. Meyer, 2015

20
B: More Fermi!
1. How many litres of water are used for drinking purposes each year in Canada?
C: Word Representation Define key ideas with symbols, explain/justify estimations
D: Mathematical Representation Complete equations, substitutions with units, final statement
2. A car travels on the highway and collides with the concrete pillar of an overpass. What is the acceleration of the
passenger (buckled in) during the collision? Estimate the quantities you will need in order to calculate the acceleration.
Show your reasoning and justify any quantities you estimate.
A: Pictorial Representation Sketch, coordinate system, label key ideas with symbols, conversions, describe events
C: Word Representation Explain/justify estimations of key ideas
D: Mathematical Representation Describe steps, complete equations, substitutions with units, final statement
Fermi estimating the size of his bald spot.
Fermi about to press a button

21
t
v
SPH4U: Uniform Acceleration
A: Gotta Love a Physicist in Uniform (Acceleration)
1. Reason. Describe how you could use a stopwatch and a police radar gun to
decide whether a car was moving with uniform acceleration.
2. Explain. Use the idea of “net force” to help explain the condition that is necessary for an object to accelerate uniformly.
3. A cart is on a frictionless incline. Consider the following series of events: (1) The cart is at rest and you begin to exert a
steady force on the cart up the incline. (2) The cart leaves contact with your hand as it rolls up the incline. (3) It reaches
its highest point. (4) The cart returns to the bottom of the incline.
(a) Reason. Albert comments, “The cart is accelerating uniformly from moment (1) until moment (3).” Do you agree?
Explain.
(b) Reason. Marie says, “The acceleration of the cart changes at moment (3). This makes sense because it changes
direction.” Do you agree? Explain.
(c) Predict. Use a dotted line to sketch your prediction
for a v-t graph for the cart’s motion. Label events 1
through 4. As a class we will confirm this using the
motion detector. Move on for now.
B: The BIG 5
The equations in the table to the right are affectionately
known as the “BIG 5” equations of uniform acceleration.
When an object is accelerating uniformly, the five
kinematic quantities, d , iv , fv , a , and t , for that time
interval are related by these equations.
For the BIG 5 to give correct values, you must make sure
that the object is accelerating uniformly during the entire
time interval between the two events you choose –
otherwise you need to choose new events!
d iv fv a t
tavv if
2
21 )( tatvd i
tvvd fi )(21
2
2
1 )( tatvd f
davv if
222
Recorder: __________________
Manager: __________________
Speaker: _________________
0 1 2 3 4 5
© C. Meyer, 2013

22
1. Find a Pattern. Place an “X” in the column of any quantity that is not found in each equation. Describe the pattern you
observe in the chart.
Note that iv and fv are the instantaneous velocities at the initial and final moments of an interval of time. We will always use
a numerical subscript corresponding to an event to help label different velocities and positions (for example v2, v3 for the
velocities at moments 2 and 3). If you ever need to distinguish between two different intervals, you can write Δt12 compared
with Δt23, otherwise we just write Δt (similarly for Δd and a). For displacements in the x- or y-directions, you may write Δx or
Δy instead of Δd.
2. Apply. You have some data for the cart problem we discussed in question A#3. At moment 3, v3 = 0 m/s. During an
interval, a23 = -1.6 m/s2 andx23 = 0.80 m. Is v3 the initial or final velocity for this interval?
3. Apply. Describe how you can use the chart to help choose the best equation to solve a problem where v3 = 0 m/s, a23 =
-1.6 m/s2, x23 = 0.8 m, and t23 is the unknown.
4. Reason. When using the BIG 5 equations, how many quantities (pieces of data) do you need to know in order to be able
to solve for any unknown kinematic quantity?
5. Summarize. (as a class) What is the magic saying for solving problems using the “BIG 5”?
C: The Solution to All Your Problems
Solution writing is like writing an essay: not only must you have the right ideas, but they must be convincingly presented
using proper grammar and form.
The BIG 5 are vector equations. This means they take
into account the direction of the kinematic quantities. A
simple way to handle direction information is to use a
sign convention and write down the BIG 5 as scalar
equations. Each example shown to the right is correct,
but the scalar version is often simpler and quicker to
write down. This will be our preferred notation.
When we work out solutions for our homework, and on tests and quizzes we will use a very careful solution process. The
rationale is this: the more carefully we think about a single problem, the deeper we will understand it. We will learn more by
doing a few problems very carefully than by doing many problems carelessly. This helps us to learn how to explain what is
happening in a problem using many different techniques. On the next page you will find the solution sheet that we will use
for all our problem solving. You must use this process for your homework problem solving.
1. Evaluate. A world’s land speed record was set by Colonel John P. Stapp when in March 1954 he
rode a rocket propelled sled that moved along a track at 1020 km/h. The brakes were activated
and the sled was brought to a stop in 1.4 s. What acceleration, in m/s2 did he experience while
stopping? A sample solution is provided on the next page. Its format is ideal, but there are minor
errors in the math or physics. Circle all the errors, describe the error, and correct each one.
Vector notation
x
= 53 m [E]
1v
= 12.4 m/s[E]
a
= 0.59 m/s2 [W]
t = ? 2
2
11 )( tatvx
Scalar notation
E
+x v1 = 12.4 m/s
x = 53 m
∆t = ?
x = v1t + ½a(t)2
a = - 0.59 m/s2

23
Motion Homework Sheet Problem: Colonel Stapp!
A: Pictorial Representation Sketch, coordinate system, label givens & unknowns using symbols, conversions, describe events
B: Physics Representation Motion diagram, motion graphs, velocity vectors, events
C: Word Representation Describe motion (no numbers), explain why, assumptions
Colonel Stapp is initially moving rapidly and slows down due to the sled’s brakes. He comes to rest. We assume his
acceleration is constant.
D: Mathematical Representation Describe steps, complete equations, algebraically isolate, substitutions with units, final statement
Colonel Stapp is slowing down for a time interval:
t = t2 – t1 = 1.4 s – 0 = 1.4 s
Find his acceleration while slowing down. We know v1, v2 and t.
v2 = v1 + a t. a = v1 /t, since v2 = 0
= (3672 m/s) / (1.4 s)
= 2622 m/s
He slowed down at a rate of 2600 m/s in the backwards direction.
E: Evaluation Answer has reasonable size, direction and units, why?
Since he was travelling very fast and slowed in a very small time interval, we expect his acceleration to be quite large.
His acceleration was negative while his velocity was positive which is correct for an object slowing down.
The units are m/s which are appropriate for acceleration.
1
●
1v
v
2v
●
●
● + x 2
●
●
Event 1 = he begins to slow down Event 2 = he comes to a stop
x1 = 0
v1 = 1020 km/h = 3672 m/s
t1 = 0
x2
v2 = 0
t2 = 1.4 s
+ x
a= ?
v
t
x a
t
t
1
●
1
●
2
● 2
● 2
●
● 1
Hint: Did you find seven
unique errors?

24
SPH4U Homework: Representations of Motion Name:
A cart moves along a straight line track starting at rest at the origin. You only know acceleration information.
1. Interpret. What does the area between an
acceleration graph and the axis represent?
(Hint: the width is a time interval and the
height is an acceleration. For extra hints
look in the text!)
2. Reason. During the first 30 s, what is
happening to the cart? Explain.
3. Reason. According to the acceleration
graph and important event takes place at 30
s? What might have happened?
4. Reason. How will the velocity value just
before and just after the event at 30 s
compare? What does this imply about the
slope of the position graph at those times?
5. Reason. We know the cart started from rest. How can we decide based on the acceleration graph when next it is at rest?
(Hint: Use some simple calculations)
6. Calculate. Complete the calculations necessary to reconstruct the velocity graph. Then complete the calculations
necessary to reconstruct the position graph.
© C. Meyer, 2014

25
SPH4U: Representations of Motion
A: Comparing Velocity Vectors
In grade 11 we have been drawing velocity vectors to provide another way of
understanding motion. Now we will learn a special way to compare two velocity
vectors and find the change in velocity.
1. Reason. A car is travelling west and slowing down. What is the direction of its acceleration? What is the direction of its
change in velocity?
2. Represent. The car was initially moving at 10 m/s [W] and was later travelling at 3 m/s [W]. Draw each velocity vector
and draw a vector representing your guess at the car’s change in velocity.
The change in velocity can be found form the expression: if vvv
. We can draw a vector
diagram to represent this equation. In gr. 11 we learned that when we add vectors we draw them
tip-to-tail. Here, the two vectors are subtracted. We represent this by drawing the vectors tail-to-
tail (the tails of v1 and v2 are roughly at the same location). The change vector is a new vector
going from the tip of the first to the tip of the second vector. This representation will be our
velocity-vector diagram.
3. Explain. How does the direction of the change in velocity compare with the direction of the acceleration?
B: Representations of Motion
A cart travels along a dynamics track in a variety of situations. Use the information provided to complete all the other
representations of motion. For all cases, the positive direction is to the right and the origin is at the left end of the track. The
sample equation is one possible equation that represents the desired motion (the actual values should be reasonable for our
dynamics track). Begin by looking through all the examples shown on these two pages so you have a good sense of the
expectations for each representation.
1 Description of Motion
The cart starts at rest at the origin,
moves in the positive direction
and speeds up with a positive
acceleration.
Motion Diagram
Velocity Vector Diagram
v = v2 – v1.
Sample Equation
x = (0 m/s)t + ½ (0.50 m/s2)t
2
Real-Life Situation
Graphs
x v
t
a
t t
Recorder: __________________
Manager: __________________
Speaker: _________________
0 1 2 3 4 5
+x
© C. Meyer, 2014
2v
1v
v

26
2 Description of Motion
Motion Diagram
Velocity Vector Diagram
Sample Equation
x = ( )t + ½ ( )t2
Real-Life Situation
A car passes a police cruiser and
begins slowing down (1) until the
proper speed limit is reached (2).
Graphs
3 Description of Motion
Motion Diagram
Velocity Vector Diagram
Sample Equation
x = ( )t + ½ ( )t2
Real-Life Situation
Graphs
4 Description of Motion
Motion Diagram
Velocity Vector Diagram
Sample Equation
x = ( )t + ½ ( )t2
Real-Life Situation
Graphs
1v
2v
v
1
●
●
●
2
● +x
x v
t
a
t t
+x
x v
t
a
t t
1 ●
2
●
+x
x v
t
a
t t

27
SPH4U: The First Law in 2-D
We want to understand how forces and acceleration work when an object can
move in two dimensions. Welcome to a bigger world!
A: The Hoverpuck
The hoverpuck creates a cushion of air that lifts it above the ground. When it moves, friction is so small that we can safely
ignore it. Imagine you give the puck a gentle push along the level ground and release it with a velocity 1v
as shown below.
1. Predict. Describe the motion of the puck after it leaves your
hand.
2. Test. (as a class) Describe the motion of the puck along the level ground after it is released. Does this agree with your
prediction?
3. Represent. Draw three images of the puck after you release it after equal intervals of time (much like our motion
diagrams).
4. Reason. Marie says, “The force from your push is carried by the puck as it travels along the floor. That’s why it keeps
moving forwards after your push.” Do you agree or disagree with Marie? Explain.
B: One Tap
Now imagine you release the puck and then your friend gives it one short ‘tap’ in a direction that is perpendicular to its
motion.
1. Predict. Describe the motion of the puck after the tap.
What will the shape of its path be?
2. Predict. Describe how the overall speed of the object will
change.
3. Test. (as a class) Describe the motion of the puck after the tap and describe the shape of its path. Does this agree with
your prediction?
4. Represent. Draw three images of the puck three equal intervals of time after the tap.
5. Explain. Why does the puck gain speed in the y-direction?
6. Speculate. Did the puck gain or lose speed in the x-direction?
tap
+x
+y
Recorder: __________________
Manager: __________________
Speaker: _________________
0 1 2 3 4 5
© C. Meyer, 2015

28
C: Off to the Races!
It is difficult to decide from our previous observations whether
the speed in the x-direction changed after the tap. To find out,
we will have a race between two pucks. Each puck starts with
the same initial velocity in the x-direction. Puck A travels on
an incline tilted to the east. The puck B moves beside puck A
along the level ground.
1. Predict. What is the shape of the path of puck A after it is
released? Explain.
2. Predict. Which puck will reach the finish line first? Explain.
3. Test. (as a class) Describe the motion of Puck A after it is released. Does this agree with your prediction?
4. Evaluate. Did the velocity of Puck A in the x-direction change? Explain how you decided based on your observations of
the race.
5. Represent. Draw three images of each puck after three equal intervals of time after they are released. Explain how you
chose the x- and y-positions for the images of the pucks.
D: Rematch!
Consider another race. Both pucks are on the incline tilted east.
Puck A starts from rest, while puck B has an initial velocity in
the x-direction.
1. Predict. Describe how you think puck A will move when it
is released.
2. Predict. Which puck will reach the bottom of the incline
first? Explain.
3. Test. (as a class) Describe the motion of Puck A after it is released. Which won the race? Do these results agree with
your predictions?
4. Represent. Draw three images of each puck after three equal intervals of time after they are released. Explain how you
chose the x- and y-positions for the images of the pucks.
5. Summary. How does a force in one direction affect the motion of an object in the perpendicular direction?
A 1v
1v
finish line
B
1v
A B
finish line

29
SPH4U Homework: 2-D Motion Name:
When we represent motion in two dimensions, we can imagine we are drawing a
motion diagram that can produce dots anywhere in the x-y plane. Study the
motion diagram for the trip of a very interesting hover puck that is shown to the
right. A few of the positions have been marked with event numbers.
1. Interpret. Is the puck accelerating between moment 1 and 2? Explain how
you can tell.
2. Interpret. Is the puck accelerating between moments 4 and 5? How can
you tell?
When we draw an instantaneous velocity vector, we start at the moment in time
(the dot) we are interested in. Its length corresponds to the speed and its
direction is tangent to the path of dots.
3. Represent. Draw an instantaneous velocity vector for the puck’s motion at
moments 1, 2, 3 and 5. (v4 has been drawn as an example.) Their exact
length is not important, only their relative length.
4. Interpret. Did the puck’s velocity change between events 2 and 3? Did it accelerate between events 2 and 3? Explain
how you can tell.
When vectors are subtracted, we draw them tail-to-tail. The vector that represents the difference goes from the tip of the first
vector to the tip of the second.
5. Interpret. Examine the velocity vector diagram representing the vector equation:
2323 vvv
The vector that represents the difference (the change v23) goes from the
tip of the first vector (v2) to the tip of the second (v3). Use this diagram to help describe the
direction of the force experienced by the puck.
6. Reason. Would you describe the force acting on the puck between events 2 and 3 as a short, sudden force or a long
lasting force? Use the pattern of dots to help explain.
7. Represent and Reason. Draw a vector diagram for the equation: 4545 vvv
. Use the
diagram to help explain the direction of the force acting on the puck between moments 4
and 5. Would you describe this force as a short, sudden force or a long lasting force?
Explain.
1
2
3
5
4
+ x
+ y
Velocity Vector Diagram
2v
3v
23v
© C. Meyer, 2015

30
SPH4U Homework: Vectors and Components Name:
1. Reason. Three vectors are drawn on the grid shown to
the right. Rank the six components of these three
vectors in order of increasing size. For example: |Ay| >
|Bx|
2. Reason. A vector makes a 30o angle with the x-axis.
Which of its two components has the larger size?
Explain.
3. Reason. Two vectors are shown on the grid to the right.
Rank the four components of these two vectors in
increasing order according to size.
4. Represent and Calculate. A vector has the
components: dx = - 46 m and dy = 30 m. Sketch a
component triangle for the resultant vector (not a scale
diagram!). Calculate the complete vector d
including
direction.
5. Represent and Calculate. A plane is travelling with a
velocity of 340 km/h [N40o W]. Sketch a component
triangle and calculate the components of this vector.
(Don’t draw a scale diagram!)
6. Reason. Vector equations have components too! You
were doing this last year without realizing it when you
wrote separate expressions for Fnetx and Fnet y. Imagine
we are adding two force vectors: tfnet FFF
where
fF
= 17 N [E 55o N] and
tF
= 9 N [N 50o W]. (The force
vectors are not drawn to scale!)
(a) Draw a component triangle attached to each of the
three vectors in the diagram above. Calculate the
components of the vectors you know.
(b) The x-component of the net force can be found
from taking the x-component of the entire
equation! Fnet x = Ff x + Ft x. Fill in this equation
and solve for Fnet x.
(c) Do the same for the y-component.
(d) Use the component triangle for Fnet to find netF
.
N(+y)
E(+x)
+ y
+ x
A
B
C
+ y
+ x
A
B
N (+ y)
E (+x)
N (+ y)
E (+x)
© C. Meyer, 2015
fF
tF
netF

31
SPH4U: Vector Components
How do we analyze the curving motion of the puck on the ramp? We need to
develop new vector techniques for two-dimensional motion. Here we go!
A: The Component Triangle
In yesterday’s experiments, careful measurements were made by a student who found that the puck moved through a
displacement of 4.0 m [N 60o E].
1. Represent. Draw this vector on the grid starting from
the image of the puck and label it d
. The grid
represents the position-space of the puck. This means
that the lengths of vectors in this diagram represent the
magnitude of an object’s displacement. Use the scale of
1.0 cm = 1.0 m for the position-space.
2. Represent. During the 2.0 seconds of its motion, the
puck moved both in the x- and y-directions. Draw a
right-angle triangle on the grid with d
as the hypotenuse. Draw the smaller sides using a different colour or dashed
lines. We will call this the component triangle. Draw arrowheads on each side of the triangle.
3. Interpret. What does each side of the component triangle tell us about the displacement of the puck?
A vector is a quantity with two parts: a magnitude (size) and direction. It is usually notated with a vector sign on top ( d
, v
). When we want to refer to the magnitude of the vector only, we write v
in absolute value signs. However, out of
convenience, if it is understood that the quantity involved is a vector, we usually write just v to indicate the magnitude. Note
that the magnitude of a vector is always a positive quantity. A vector can always be determined from the values of its
components. The two small sides of the triangle you drew in question 2 represent the components of that vector which we call
xd and yd . The components are written as scalar quantities without a vector sign. Be sure to use a sign convention to
show the direction of the components: make the values of the components either positive or negative.
4. Measure the side lengths of your component triangle and use the scale to find the two components of d
. Be sure to
include uncertainties!
xd = yd =
B: Constructing Vectors
Now we will draw a different kind of diagram. The grid now represents the velocity-space of the puck. This means that the
lengths of vectors in this diagram represent the magnitude of an object’s velocity. It no longer indicates anything about the
object’s position or displacement.
1. Represent. Draw the velocity vector, v
= 8.0 m/s [W
20oS] on the grid using the scale 1 cm = 2.0 m/s. Label
the vector and construct its component triangle.
2. Measure. Use your diagram to measure the values of the
components of v
. Don’t forget uncertainties!
vx = vy =
3. Reason. Use the Pythagorean Theorem to write an equation that relates the magnitude of v
to its components vx and vy.
Don’t include any numbers yet.
N (+y)
E (+x)
N (+y)
E (+x)
© C. Meyer, 2015
Recorder: __________________
Manager: __________________
Speaker: _________________
0 1 2 3 4 5

32
4. Calculate. Use the measured values of vx and vy to calculate the magnitude of vector v
. Estimate an uncertainty for this
result. Does your calculated magnitude based on your measurements agree with original magnitude you were given?
5. Reason. Use the sine and cosine functions to write an expression for vx and vy when we know v and the angle inside the
component triangle at the tail of the vector v
. You must include a negative sign for the sign convention when
appropriate. (Note: Do not memorize these expressions! Always deduce them from your component triangle.)
6. Calculate. Use the angle at the tail of v
and the given magnitude of v
to calculate the values of vx and vy. How do these
values compare with those you measured directly for vx and vy?
7. Calculate. How we can find the angle θ from the values |vx| and |vy| and the inverse tangent function? Find using your
measured values. Estimate an uncertainty.
8. Reason. Does your calculated value for the angle agree with the original value you were given?
9. Reason. If a vector was reversed – flipped to the opposite direction – how would the values of the components change?
C: Summary
1. Describe. What procedure would to you use to find a complete vector if you were given its two components?
2. Calculate. The same displacement vector d
is shown to the
right along with two different coordinate systems A and B.
Complete the chart below using measurements from the
diagrams. Scale:1.0 cm = 10.0 cm
Coordinate System A Coordinate System B
d
(magnitude +
direction)
x-component
y-component
W E (+x)
N (+y)
S
A
W (+x)
E N (+y)
S
B

33
SPH4U: Projectiles!
Now it’s time to use our new skills to analyze the motion of a golf ball that was
tossed through the air. Let’s find out what is special about the motion of a
projectile.
A: Tracking a Projectile
1. Observe. Choose a convenient reference point on the golf ball to help track its motion. Measure the x- and y-components
of the position of the golf ball at each moment in time. The coordinate system for your measurements is drawn on the
picture. The strobe light for the photo flashed at 10 Hz. Complete the chart below.
B: Horizontal Motion
1. Represent. Plot a graph of x vs. t
2. Interpret. Describe the motion of the projectile in the x-direction.
Explain how the data in the graph supports your interpretation.
When we analyze data graphically, we are looking for a relationship or pattern between the two related quantities. Never
connect the dots on a graph and create a zig-zag pattern. Decide if the relationship fits a straight line or a smooth curve. No
single data point is more important than any other (including 0,0!). A good line of best fit will be as close as possible to as
many data points as possible.
3. Calculate and Interpret. Find the slope of the position graph. State in words the meaning of this result.
Image
No.
t(s) x (cm) y(cm)
1
2
3
4
5
6
7
8
9
10
Recorder: __________________
Manager: __________________
Speaker: _________________
0 1 2 3 4 5
+x
+y
hand
0 0.2 0.4 0.6 0.8 1.0
t (s)
x
(cm)
8.0
6.0
4.0
2.0
0
© C. Meyer, 2015

34
4. Reason. Albert says, “This graph shows that there are no significant forces acting in the horizontal direction”. Do you
agree or disagree? Explain. What can we conclude about the effects of air resistance?
** call your teacher over **
C: Vertical Motion
1. Represent. Plot a graph of y vs. t
2. Reason. Emmy says, “This graph shows evidence of a downwards acceleration.” Do
you agree or disagree with Emmy? Explain.
3. Represent. Sketch a vy-t and an ay-t graph based on the y-t graph. Line up the
graphs’ features with the y-t graph above. Label the regions in time when the ball is
speeding up, slowing down and has a vertical speed of zero.
4. Reason. Marie says, “At its highest point the acceleration of the golf ball is zero
since it’s turning around.” Emmy says, “No. At the top it’s still accelerating.” Who
do you agree with? Explain.
D: Projectile Motion
1. Summarize. Use the observations you have developed to create a model of projectile motion. Your model should begin
by explaining that we treat the object as a point particle. Describe the characteristics of the particle’s vertical and
horizontal motions and mention any assumptions the model relies upon.
Projectile Motion:
2. Apply. According to your model, will the golf ball ever be found falling straight down? Explain.
3. Predict. Two projectiles are launched with the same initial speeds but different angles. Marie launches hers with an
angle of 60o to the horizontal and Albert launches his at an angle of 30
o to the horizontal. According to your model,
whose projectile will spend more time in the air? Explain. When you are ready, test this using your teacher’s computer
simulation.
y
(cm)
6.0
4.0
2.0
0 0 0.2 0.4 0.6 0.8 1.0
t (s)

35
SPH4U Homework: Projectiles! Name:
The Orthogonality Principle: Forces acting in one direction have no effect on an object’s motion in the perpendicular
(orthogonal) direction.
You are using a toy truck to conduct some physics experiments that will explore the relationship between the truck’s speed,
the table’s height and the time it takes the truck to fall and reach the floor. You plan on using the six situations shown in the
diagram below.
1. Reason. Isaac has a hypothesis: “The truck’s speed
affects the time to fall” and his prediction is “The greater
the speed of the truck, the more time it will take to fall.”
Which of the six situations could you use to best test his
prediction? Explain.
2. Evaluate. Your results for the three different situations
using the same height tables are 0.31 s, 0.27 s, 0.29 s
each with an uncertainty of ±0.05 s. Do your results
support or refute Isaac’s prediction? Explain.
3. Explain. Isaac’s hypothesis has been proven wrong. If he understood the orthogonality principle better he would have
realized that his hypothesis didn’t have a chance. Help explain to Isaac why his hypothesis was doomed!
4. Reason. Marie has a hypothesis: “The height of the table affects the time to fall” and she predicts “The greater the
height, the greater the time to fall.” Which of the six situations could you use to best test her prediction? Explain.
5. Evaluate. Your results from the three different situations using the same speed are 0.28 s, 0.35 s and 0.40 s each with an
uncertainty of ±0.05 s. Do your results support or refute Marie’s prediction? Explain.
6. Explain. Use the orthogonality principle to explain why Marie’s hypothesis was correct.
7. Reason. Rank the six situations according to how much time the trucks spend in the air before hitting the ground, from
smallest to largest. Explain your ranking.
© C. Meyer, 2015

36
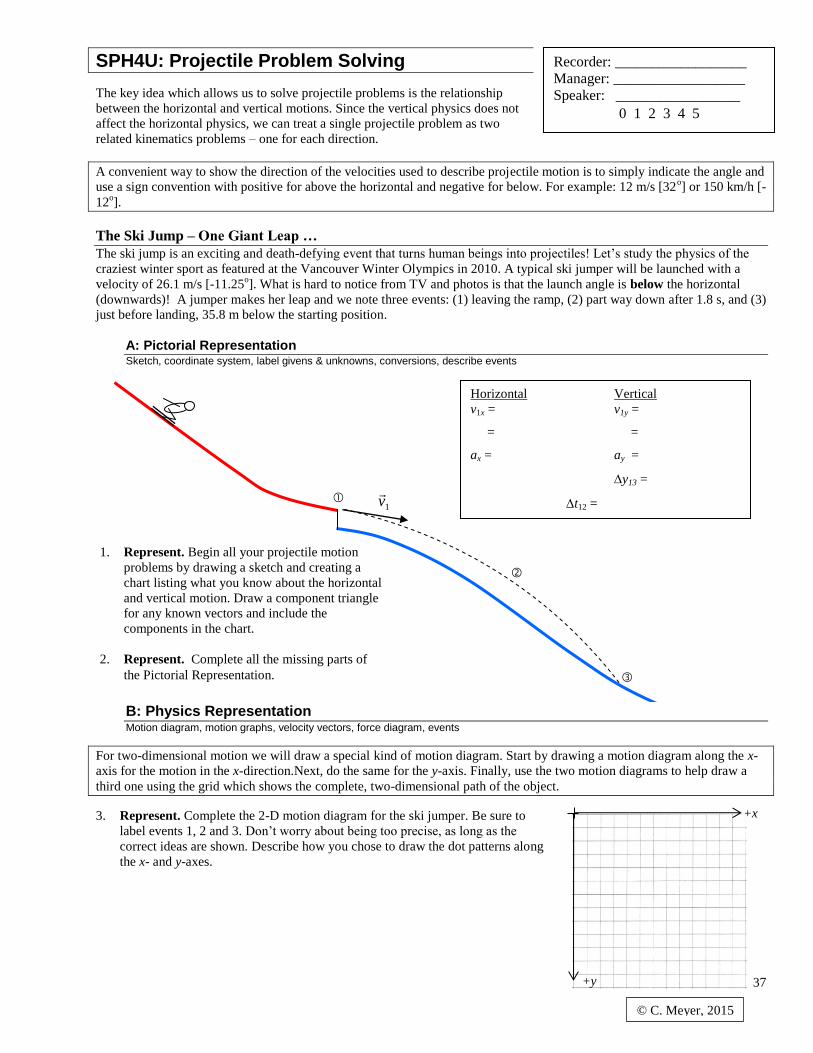
37
SPH4U: Projectile Problem Solving
The key idea which allows us to solve projectile problems is the relationship
between the horizontal and vertical motions. Since the vertical physics does not
affect the horizontal physics, we can treat a single projectile problem as two
related kinematics problems – one for each direction.
A convenient way to show the direction of the velocities used to describe projectile motion is to simply indicate the angle and
use a sign convention with positive for above the horizontal and negative for below. For example: 12 m/s [32o] or 150 km/h [-
12o].
The Ski Jump – One Giant Leap …
The ski jump is an exciting and death-defying event that turns human beings into projectiles! Let’s study the physics of the
craziest winter sport as featured at the Vancouver Winter Olympics in 2010. A typical ski jumper will be launched with a
velocity of 26.1 m/s [-11.25o]. What is hard to notice from TV and photos is that the launch angle is below the horizontal
(downwards)! A jumper makes her leap and we note three events: (1) leaving the ramp, (2) part way down after 1.8 s, and (3)
just before landing, 35.8 m below the starting position.
A: Pictorial Representation Sketch, coordinate system, label givens & unknowns, conversions, describe events
B: Physics Representation Motion diagram, motion graphs, velocity vectors, force diagram, events
For two-dimensional motion we will draw a special kind of motion diagram. Start by drawing a motion diagram along the x-
axis for the motion in the x-direction.Next, do the same for the y-axis. Finally, use the two motion diagrams to help draw a
third one using the grid which shows the complete, two-dimensional path of the object.
3. Represent. Complete the 2-D motion diagram for the ski jumper. Be sure to
label events 1, 2 and 3. Don’t worry about being too precise, as long as the
correct ideas are shown. Describe how you chose to draw the dot patterns along
the x- and y-axes.
1v
Horizontal Vertical
v1x = v1y =
= =
ax = ay =
y13 =
t12 =
1. Represent. Begin all your projectile motion
problems by drawing a sketch and creating a
chart listing what you know about the horizontal
and vertical motion. Draw a component triangle
for any known vectors and include the
components in the chart.
2. Represent. Complete all the missing parts of
the Pictorial Representation.
Recorder: __________________
Manager: __________________
Speaker: _________________
0 1 2 3 4 5
© C. Meyer, 2015
+x
+y
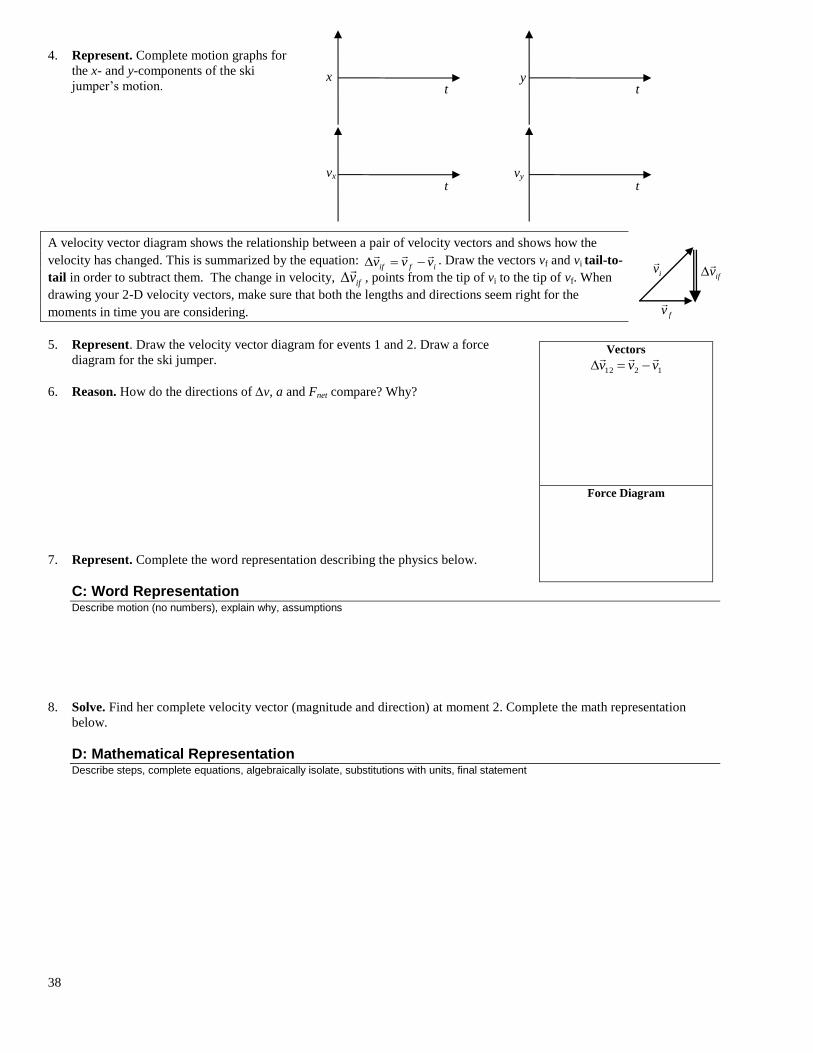
38
4. Represent. Complete motion graphs for
the x- and y-components of the ski
jumper’s motion.
A velocity vector diagram shows the relationship between a pair of velocity vectors and shows how the
velocity has changed. This is summarized by the equation: ifif vvv
. Draw the vectors vf and vi tail-to-
tail in order to subtract them. The change in velocity, ifv
, points from the tip of vi to the tip of vf. When
drawing your 2-D velocity vectors, make sure that both the lengths and directions seem right for the
moments in time you are considering.
5. Represent. Draw the velocity vector diagram for events 1 and 2. Draw a force
diagram for the ski jumper.
6. Reason. How do the directions of v, a and Fnet compare? Why?
7. Represent. Complete the word representation describing the physics below.
C: Word Representation Describe motion (no numbers), explain why, assumptions
8. Solve. Find her complete velocity vector (magnitude and direction) at moment 2. Complete the math representation
below.
D: Mathematical Representation Describe steps, complete equations, algebraically isolate, substitutions with units, final statement
Vectors
1212 vvv
Force Diagram
t vx
x
t
vy
t
t y
iv
fv
ifv

39
9. Evaluate. Imagine you erased all the math in part D above. Would your descriptions of the steps be good enough to help
a struggling student work their way through this problem? If not, go back and improve them! Then complete part E, the
evaluation, below.
E: Evaluation Answer has reasonable size, direction and units? Why?
** Call your teacher over to check your work. Then you are ready to check your results against the simulation**
10. Solve. How far has the skier travelled horizontally between moments 1and 3? Answer this in Part D below.
D: Mathematical Representation Complete equations, describe steps, algebraic work, substitutions with units, final statement
11. Reason. Emmy says, “I was wondering about this. Imagine I toss a blob of playdoh which lands on the floor. When it
hits the floor its final velocity is zero. Do you think I could use v2 = 0 in my BIG 5 equation?” Can she? Explain.
The Great Jumper
Sondre Norheim (1825 – 1897) was a ski jumping champion and the designer of the modern ski used for ski jumping. The
modern ski acts like a wing, providing the jumper with an upwards lift force. In gr. 12, we ignore all effects of the air and this
upwards force. The story goes that Sondre wowed a group of spectators by jumping over a very tall rock. Let’s explore the
physics of this daredevil event. We will suppose that he launched from a ramp with a speed of 18.0 m/s at an angle of 28o
above the horizontal. The edge of the ramp was 1.5 m above the ground level. The tallest point of the rock was located 13.8
m horizontally from the edge of the ramp and was 5.0 m above the ground. The ground in this area is quite level. Complete
the three parts of the solution below.

40
A: Pictorial Representation Sketch, coordinate system, label givens & unknowns, conversions, describe events
1. Reason. Our goal is to determine whether or not he will make it over the rock. What kinematics quantity would it be
helpful to find (and compare with the given information) that would allow you to decide? Explain carefully.
B: Physics Representation Motion diagram, motion graphs, velocity vectors, force diagram, events
Velocity Vector
Diagram
Force Diagram
2. Calculate. Solve this problem in part D below.
D: Mathematical Representation Describe steps, complete equations, algebraically isolate, substitutions with units, final statement
+y
+x
x
t t y
t vx vy
t

41
SPH4U: Representing Forces
Forces make the world go round! They are the real reason you get up in the
morning. To help us understand forces we use a variety of tools which we will
explore today.
An interaction diagram helps us to visualize the interactions between the system objects and the environment. Start by
writing the name (or an abbreviation) for each object involved in the interactions. Draw circle around the system objects to
highlight them. Draw an interaction line between each pair of objects for each interaction. Label these lines with a letter
similar to the ones you use to label forces.
A: The Handy Ball
1. Interpret. What does the interaction diagram tell us about this situation?
2. Represent. The ball is moving downwards and is slowing down. Draw the
motion diagram for the ball.
A force diagram uses our understanding of the interactions to construct a picture of the forces acting on a system. When you
construct a force diagram:
Identify the object or objects of interest – we will call these objects the system. Objects outside the system are parts of
the environment.
Represent the system as a point-particle where we imagine all its mass is compressed into a single point.
Draw a vector arrow representing each force acting on the system associated with each interaction. The force vectors do
not need to be drawn to scale, but should be drawn roughly according to their relative magnitudes.
Include a separate wiggly acceleration vector when appropriate.
Draw a coordinate system with a sign convention. In most cases, it is convenient to choose the direction of the
acceleration as positive; otherwise choose the direction of the velocity as positive.
3. Reason. Examine the force diagram for the system. Do the lengths of the vectors
correctly represent this situation? Explain.
The total effect of all the forces acting on the object is called the net force, Fnet. To calculate the net force, we must add up all
the force vectors found on the FD. To do this, we construct two scalar equations that represent the x- and y-components of
Newton’s second law. Make sure you do this even if the net force is zero. Always write the scalar equation for the 2nd
law
using the force sign convention.
The Force Sign Convention: In gr. 12 we will write scalar equations for forces (no vector arrows!). When we do, all force
symbols, such as Fg, are magnitudes meaning they are positive quantities. Show the directions of the forces by using a sign
convention and adding or subtracting the appropriate force symbol.
4. Explain. Examine the scalar equation for Newton’s 2nd
law in the box above. Explain what the implicit (hidden) positive
sign in front of the Fg and the minus sign in front of the Fn tell us about the two forces.
Sketch
Interaction
Diagram
Motion
Diagram
Force Diagram
Newton’s
2nd Law
Fnet y = may
Fg – Fn = may
gF a
+y nF
●
ball
n
g hand
Earth
Recorder: __________________
Manager: __________________
Speaker: __________________ 0 1 2 3 4 5
© C. Meyer, 2014
+y

42
5. Reason. Consider two similar situations where the ball is (1) at rest and (2)
moving upwards while slowing down. Are the interactions in either of these
situations different compared with the first one above?
6. Represent and Explain. Why are the results (the acceleration) different in these
cases compared with the first one? Draw the force diagram for each situation to
help explain.
Whenever a person touches another object they interact. This interaction can give rise to a normal force or both a normal and
friction force. To keep things simple, when a person pushes on something we often call the resulting force an applied force.
It is important to understand that this applied force may actually be a normal force or a combination of normal and friction
forces. If you include an applied force on a force diagram, be careful that you don’t also include the normal or friction force
which is already includes as part of your applied force.
7. Predict. When you place a heavy object in your hand, you feel pressure against your hand. Which interaction, gravity or
normal is your hand feeling?
8. Test. Place a heavy mass (~1.0 kg) in the flat palm of your hand. How does the sensation change when (i) the mass is at
rest, (ii) when you suddenly accelerate it upwards, and (iii) when you suddenly accelerate it downwards? Match each
sensation to one of the previous FDs.
9. Evaluate. Which force in your three force diagrams above have the same characteristics as the sensation you feel? Which
interaction does your hand actually feel? (Look back to your interaction diagram to confirm!)
B: The Skydiver!
A skydiver is now falling at a constant speed because
her parachute has deployed.
1. Represent. Complete the chart to the right for the
system of the skydiver and parachute.
2. Explain. There is an interaction between the
skydiver and the parachute. (Make sure this is
clear in your ID). Should we include a force on
the FD due to this interaction? Explain.
3. Reason. Emmy says, “Since the skydiver is moving downwards, the net force should be downwards.” Do you agree or
disagree with Emmy? Explain.
FD at rest FD slowing down
Interaction
Diagram
Motion
Diagram
Force
Diagram
Newton’s
2nd Law
+y

43
The Air Resistance Rule: In Gr. 12 physics, we will always assume there is no force due to air resistance unless it is
mentioned or the situation does not make sense without it.
C: The Trampoline
You are bouncing very high
up and down on a trampoline.
We will describe the force the
trampoline exerts on you as
an elastic force (Fe).
1. Represent. Draw a
motion diagram and a
force diagram for each
moment during your
bounce.
2. Reason. Isaac says, “On the force diagram for moment 3 we should draw an upwards force due to
the trampoline since he is still traveling upwards. We should make it smaller than gravity since
that force is running out.” Do you agree or disagree with Isaac? Use an interaction diagram to help
explain.
3. Reason. If there is no upwards force acting on you at moment 3, why do you continue moving upwards? Explain without
using the word inertia.
The Inertia Principle: All objects made of ordinary matter have the property of inertia. This property means that it takes
time (an interval of time) in order for the velocity of any object to change. The time interval in some cases may be very
small, but it is never zero. The amount of inertia is the object’s mass. Inertia is not a force- it is a property of matter.
D: Book Learnin’
A friend is pushing a heavy textbook towards you across the rough surface of a table. While your friend is pushing, you help
to slow it down with your hand before it falls off the table.
When multiple forces point in the same direction, draw those forces tip-to-tail, just like you do when adding vectors in a
vector diagram. That way we can easily see the total force in each direction.
1. Represent. Complete the
chart for the system of the
book while the two of you
are pushing on it.
2. Explain. How did you
decide on the length of
the force vectors in your
force diagram?
(1) Traveling
downwards and
slowing down due to
the trampoline
(2) Travelling
upwards and
speeding up due to
the trampoline
(3) Moving upwards
after leaving contact
with the trampoline
(4) Moving
downwards before
landing back on the
trampoline
Interaction Diagram Force Diagram Newton’s 2nd Law
Motion Diagram
+y +y +y +y
+x
ID

44
SPH4U Homework: Representing Forces Name:
Complete the chart for each situation. Description Sketch Interaction Diagram Force Diagram Newton’s 2
nd Law
1 A ball was thrown
straight upwards and
hits the ceiling.
System = ball
2 A tasty chocolate in
your hand is moving
upwards and is
slowing down as it
approaches your
mouth.
System = chocolate
3
Fnet x = max
Ff = max
Fnet y = may
Fn – Fg = 0
4 A tennis ball is
struck by a racquet.
System = ball
5
6 A book is sitting on
top of a cart. You pull
the cart such that the
cart and the book
move with a constant
velocity.
System = cart + book
7 A book is sitting on
top of a cart. You pull
the cart such that the
cart and the book
move with a constant
velocity.
System = cart only!
● fF
aF
nF
gF
a
book
book
v
© C. Meyer, 2014

45
SPH4U: Forces in 2-D
A: Tilted Forces
A hand pulls on a cart with a force,aF
= 5 N [Left] and a string pulls on the same
cart with a forcetF
which is directed [Right 30o Up]. The cart remains at rest on
a level surface.
1. Represent. Draw the ID and FD for this situation. Construct a component triangle for the force tF
. (Reminder: an ID
only shows the objects and interactions)
ID
FD Component Triangle for tF
2. Explain. How are the forces or components of forces balancing in this situation? 3. Predict. How do you think the magnitude of
tF
compares withaF
? Use a calculation to predict value for F2. Explain your reasoning.
4. Reason. Now it’s time to get two 10-N spring scales, one dynamics cart, and one protractor. What is the readability of
your spring scale? If you make a series of measurements of one quantity with your scale and compute an average value,
what do you think the uncertainly of that result might be? Provide an estimate.
Spring Scale Tips:
1) Hold the scale in the vertical or horizontal position in which it will be used. Calibrate it to read 0 N with no forces applied.
2) Do not twist it when forces are applied. The internal pieces may bind and give a false reading.
5. Test and Evaluate. Create this situation using two spring scales for aF
andtF
, and a protractor. Measure the size oftF
and record it here with its uncertainty. Does this result agree with your prediction?
6. Represent. Write an equation for Newton’s 2nd
Law in the x- and y-directions. Get in to the habit of always showing the
sin or cos functions for your components.
7. Reason. Isaac says, “Finding the size of the normal force is easy! It is the same size as the force of gravity.” Do you
agree or disagree? Explain.
x
y
Recorder: __________________
Manager: __________________
Speaker: _________________ 0 1 2 3 4 5
© C. Meyer, 2015

46
B: Forces on a Tilt
The cart is at rest on a surface inclined at an angle to the horizontal. It is held in place by a force,tF
, which is provided by
your spring scale and is parallel to the incline. Later, you will use the incline set up at the front of the room.
Choosing a coordinate system. Any choice of coordinate system is correct, but some choices make for an easier analysis. In
most cases, the best choice of coordinate system is one that lines up with the acceleration vector for the system. In a case
without acceleration, line up your coordinate system with an important surface or the velocity vector of the system.
Draw the components of a force vector using dashed lines or a different colour so the components won’t be mistaken for
another, new force. Make sure the components are parallel to each axis of the coordinate system.
1. Represent. Draw an ID and FD for the cart. Show the components of
any forces that make an angle with this special choice of coordinate
system. Be sure your components are parallel to the axes.
2. Reason. Which forces, or components of a force, act in each
direction?
+ x - x + y - y
3. Reason. Which forces, or components of a force, balance each other?
How do you know that they must balance?
4. Reason. Which force or component of a force pulls the cart down,
along the incline?
5. Represent. Draw the component triangle for the force of gravitygF
relative
to the tilted coordinate system. Locate the angle of the incline, , in the
component triangle. What are the magnitudes of the components ofgF
?
Write these components using sin or cos.
6. Predict. Measure the angle of the incline and the weight (Fg) of your cart.
Use the x-component of Newton’s 2nd
law to predict the size ofaF
.
7. Test. Use the incline at the front of the class to measure the magnitude ofaF
. How does this compare with your
prediction? (remember the uncertainty!)
8. Predict. How would Ft change if the angle of the incline is increased. Explain.
9. Calculate. Use Newton’s 2nd
law in the y-direction to find the magnitude ofnF
.
10. Reason. Explain how Fn would change if the angle of the incline is increased. The normal force exists because the two
surfaces are being pressed together. What has happened to the amount of pressing as the angle increases?
FD
x
y
ID
y
x

47
SPH4U: Forces in 2-D Homework Name:
A: You Will Learn the Ways of the Forces (and Come with Me to Alderan)
Working with forces is a fundamental skill for the study of physics. Let’s focus on building your skills and your
understanding of our basic techniques. Study the example below carefully.
Situation ID FD 2nd Law components
You drag a sled along
a patch of rough
ground with a constant
speed. The rope for the
sled makes an angle
with the horizontal.
Fnet x = max
Ft cos - Ff = 0
Fnet y = may
Fn + Ft sin - Fg = 0
1. Explain. In the equation: Ft cos - Ff = 0, what kind of quantity does the symbol Ft represent? Does it have a
magnitude, direction or both?
2. Explain. Why is it incorrect to write: 0cos ft FF
?
3. Interpret. How many interactions does the ground participate in? How is this represented in the ID?
4. Explain. Describe what the two dashed arrows tell us about the force of tension.
B: Slides Rule!
1. Represent. Draw an ID for the situation below.
Situation ID Incorrect FD Corrected FD
A child slides down a
slide at the
playground. There is a
small amount of
friction. The slide
makes an angle with
the horizontal. System
= child
2. Explain. Albert has made a first attempt to draw an FD for this situation. You tell him that there are problems, but he
can’t figure out what they are. Explain carefully to Albert the problems with his reasoning that led to the two distinct
errors in the FD. Draw a corrected FD. (Hint: if you need a hint, turn the page – but don’t turn yet!)
(continued on the next page)
sled
hand
ground Earth
t
g
n
f
+x +y
+x
+y
© C. Meyer, 2015

48
(Hint: the dashed arrows and the angle!)
3. Solve. The child has a mass of 21 kg and experienced a friction force of 17 N. The slide is inclined at 38o to the
horizontal. Find the acceleration of the child. Complete Parts C, D and E of the solution process.
C: Word Representation Describe motion (no numbers), explain why (what causes the motion or change in motion), assumptions
D: Mathematical Representation Describe steps, complete equations, algebraically isolate, substitutions with units, final statement
E: Evaluation Answer has reasonable size, direction and units? Explain why
C: Shot Put
An athlete throws a shot put (very heavy ball, 4 kg) in an Olympic competition. She exerts a force of 97 N at an angle of 41o
to the horizontal. Complete the representations in the chart below. Show your work carefully by following the first example.
Situation ID FD 2nd Law components
1. Solve. What is the acceleration of the shot put? (Hint: find the components and then put them together!)

49
SPH4U: Understanding 2-D Forces
A: Rocks on Inclines
For each situation, draw the FD and ID. Write out a complete expression for
Newton’s 2nd
Law in the x- and y-directions. Make sure you show your trig! A rock is sliding without friction.
ID FD Newton’s 2nd
Law
Friction prevents the rock from
sliding.
ID FD Newton’s 2nd
Law
1. Explain. What force or component of a force causes the acceleration in the first example?
2. Explain. How did you choose your coordinate system for these two examples?
B: The Rough Incline
A rock slides up and then down an incline. There is a force of friction with a constant size, but not quite enough to prevent
the rock from sliding back down.
1. Represent. Complete the chart below.
Sketch
Motion Diagram
Force Diagram Newton’s 2nd Law
Sketch
Motion Diagram
Force Diagram Newton’s 2nd Law
2. Predict. Will the magnitude of the rock’s acceleration be the same when it is going up the incline as when it is going
down? Justify your prediction. We will test this as a class – move on for now.
+
+
Recorder: __________________
Manager: __________________
Speaker: _________________ 0 1 2 3 4 5
© C. Meyer, 2014

50
C: The Floating Ball
A ball is tied to a string. Emmy says, “Watch this. I can pull the ball with the string at an angle, like this, so it moves
horizontally through the air.” Isaac replies, “I don’t understand how that’s possible. The forces simply don’t work out
properly.”
1. Reason. Use the
force diagram to
carefully explain
how the ball must
be moving.
D: The Magic Eraser
Albert says, “Look! I can make my eraser stay in place against my vertical hand without me holding on to it!” Marie says,
“Nonsense! Gravity is guaranteed to pull it down.”
1. Reason. Complete the chart above. Who do you agree with? Explain.
C: Washing the Windows
Albert is making a bit of money for university by washing windows. He pushes a sponge upwards along a window to get a
dirty spot that is above his head.
1. Represent. Complete the
chart for the system of
the sponge at the moment
Albert’s arm makes a
30o angle with the
window. The sponge is at
rest. You may assume
friction is small enough
to ignore.
2. Reason. Rank the size of the three forces in this problem. Explain your ranking.
Can the ball travel
horizontally?
ID FD Newton’s 2nd Law
Can the eraser
“stick” to a person’s
hand?
ID FD Newton’s 2nd Law
Sketch
ID FD Newton’s 2nd Law
v

51
SPH4U: Newton’s Third Law
A: Forces as Interactions
When two objects affect one another, we say that they interact. Interactions
involve a push or a pull between objects which we call forces. This brings us to a
very important idea.
Whenever two objects interact, they each exert a force on the other. These two forces are really just two parts of a single
interaction. We will call the two forces a 3rd
law force pair. The forces in a 3rd
law force pair share some important
characteristics:
they have the same magnitude they point in opposite directions
they are the same type of interaction (gravitational, normal, etc.) they arise and act simultaneously
they involve the same pair of objects
This understanding of interactions is known as Newton’s 3rd
Law. Please never use the words action or reaction when
describing forces. To do so is simply wrong.
B: Book Learnin’
One of the exciting things about studying physics is that as your understanding grows, the physics of very simple situations
becomes much more nuanced and subtle. Let’s think about your physics book at rest upon a table.
1. Represent. Draw an ID and FD for the system of the book.
To show better the details of an interaction, we can use a more specific
force notation which we will call 3rd
law notation. For example the earth
interacts with the textbook gravitationally and we can symbolize this as:
BEgF
, which reads: “the force of gravity of the earth acting on the
book”. Using this notation we can write Newton’s 3rd
Law as:
ABBA FF
with the understanding of the characteristics of a force-
pair.
2. Represent. Label the forces in your force diagram using this new
notation.
Note that if you have done this correctly, all the subscripts for the forces on one object will end with the same letter. Double
check this every time you use this notation.
3. Reason. Isaac says, “I think gravity and the normal force make up a third-law pair in this situation. Just look at the size
and direction of the forces.” Do you agree or disagree with Isaac? Explain.
4. Reason. Emmy says, “Do gravity and the normal force always have the same size? Why do they here?” Explain to
Emmy.
5. Reason. Albert says, “So if gravity and the normal force are not members of the same 3rd
-law pair, is there a 3rd
-law
partner forBTnF
?” Explain what it is and why it doesn’t appear on this force diagram.
Sketch Interaction
Diagram
Force
Diagram
book
Recorder: __________________
Manager: __________________
Speaker: _________________ 0 1 2 3 4 5
© C. Meyer, 2015

52
C: The Stack O’ Books
Your homework is piling up – your
slender physics text is sitting on the
table and your massive biology text is
on top.
1. Represent. Draw a single
interaction diagram for this
situation. We will consider the
bio book and physics book as two
separate systems: circle each.
2. Represent. Draw a force diagram
for each book. (Hint: you should
draw five forces in total!)
Whenever we study the forces of
more than one object, use the 3rd
law notation introduced above.
A contact force is one that is evident only when two objects are in contact. A non-contact force is evident even when the two
objects are not in physical contact.
3. Reason. Which forces are contact and non-contact forces?
4. Reason. Are there any 3rd
-law force pairs appearing in the two diagrams? If so, indicate these with a small “” beside
each force vector.
5. Reason. Rank the magnitude of the forces appearing in the two force diagrams from smallest to largest. Explain your
ranking. (Check: do the force diagrams above match your rankings?)
6. Reason. Is the table interacting with the biology text in any important way? Explain.
7. Reason. Compare the force diagram for the physics text from parts B and C. Which forces changed when the biology
text was added and which remained the same? Explain.
8. Test. Isaac says, “In this situation, the weight of the biology text acts on the physics text.” Marie says, “No, the weight is
a force of gravity”. Use a book to test their ideas. Use your hand in the place of the physics text. Lower the “biology
text” onto your hand. Are you feeling a contact force, or a non-contact force?
9. Summarize. How should we find the size of a normal force?
Sketch Interaction Diagram FB Bio text FD Physics text
Biology
Physics

53
SPH4U Homework: Magnets and the Third Law! Name:
Let’s explore our understanding of the third law using a new interaction: magnetism! We can treat magnetic interactions just
like we do gravitational interactions.
A: Two Horseshoes
One magnet is supported by another identical magnet that hangs from a string.
1. Represent. Draw a single interaction diagram that includes the two magnets. Circle each magnet as a separate system.
2. Represent. Draw a FD for each magnet. Make sure you use the complete 3rd
law notation for the forces. Draw an or
to show any third law pairs of forces. (Hint: there should be four forces on the first FD)
3. Reason. Suppose that the two magnets were replaced by stronger magnets of the same mass. Describe any changes to the
ID. Draw revised FDs for each.
4. Reason. Can a magnet exert a non-contact force on an object?
Explain.
5. Reason. Can a magnet exert a contact force on an object?
Explain.
6. Explain. How could you use a magnet to exert both a contact and a non-contact force on another magnet?
ID FD Magnet 1 FD Magnet 2
FD FD
Adapted from McDermott, L. Tutorials in Introductory Physics. Prentice Hall, 2002

54

55
SPH4U: Weight and Acceleration
A: The Elevator
You may have noticed a curious sensation while travelling in an elevator. At
certain times, it feels like your weight is changing. Since you are such a
curious student, you decide to investigate this. You step into an
elevator at the ground floor of a tall building and stand on top of a
bathroom scale that gives readings in newtons. You haven’t pushed
any buttons yet and you look down at the scale.
1. Represent. Draw an ID and FD where you are the system
while the elevator is at rest on the ground floor.
2. Reason. Marie suggests, “There should be another force on
the FD showing the upward effect of the cable.” Do you agree
with Marie? Explain.
In the world of physics, weight is a synonym for the force of gravity: Fg = mg, where the gravitational field strength g = 9.8
N/kg. Our physical sensation of weight corresponds not to the force of gravity, but to the force supporting us (often a normal
force). The reading of a bathroom scale measures this supporting force which we call our apparent weight.
3. Solve. Use Newton’s 2nd
law (Fnet = ma) to determine your apparent weight in this situation. (If you like, assume your
mass is 65 kg).
4. Evaluate. Is your weight different from your apparent weight in this situation?
B: Going Up!
Now you press the button in the elevator and go for a ride! The elevator starts speeding up as it begins your trip to the 20th
floor.
1. Reason. Isaac says, “In this situation we need to add another upwards force to the
force diagram since you are now accelerating upwards.” Do you agree or disagree with
Isaac? Explain and draw a revised ID and FD for this situation.
2. Predict. Will the reading of the scale increase or decrease compared to the when you were at rest? Explain without using
any math.
3. Test. Hang a heavy mass from a spring scale and gently accelerate it upwards. Compare the scale’s reading (apparent
weight) with the weight of the object (force of gravity). Does this agree with your prediction?
Sketch ID FD
ID FD
Recorder: __________________
Manager: __________________
Speaker: _________________ 0 1 2 3 4 5
© C. Meyer, 2013
Scale

56
4. Solve. The elevator is accelerating at a rate of 1.5 m/s2. Use Newton’s 2
nd law to determine your apparent weight. How
does this compare with your weight?
C: The Trip Up
As you are going up, somewhere around the 2nd
floor you notice the scale reading returns to normal.
1. Explain. How has the motion of the elevator changed? Use your spring scale and mass to help explain.
The elevator is near the 19th
floor and continues to move upwards, but you notice another change to the scale reading as the
elevator is slowing down.
2. Reason. Emmy comments, “I think the upwards force must still be larger than the
downwards, or else the elevator would not be moving upwards.” Respond to Emmy
and draw a new ID and FD.
3. Predict and Test. How will the reading of the scale change as the elevator goes from
constant velocity to slowing down? Test this with your mass and spring scale.
Describe your observations.
4. Solve. The elevator slows at a rate of 3.4 m/s2. Determine your apparent weight.
5. Summary. How did the interaction and forces change in the different situations you have explored?
6. Summary. In general, how is apparent weight related to the acceleration of an object?
D: A Strange Elevator
You wake up to find yourself in a very strange elevator with no buttons, lights or windows. You are floating just above the
scale and have lost the sensation of weight. The scale itself reads zero. Offer two possible explanations for this very curious
situation.
1)
2)
ID FD
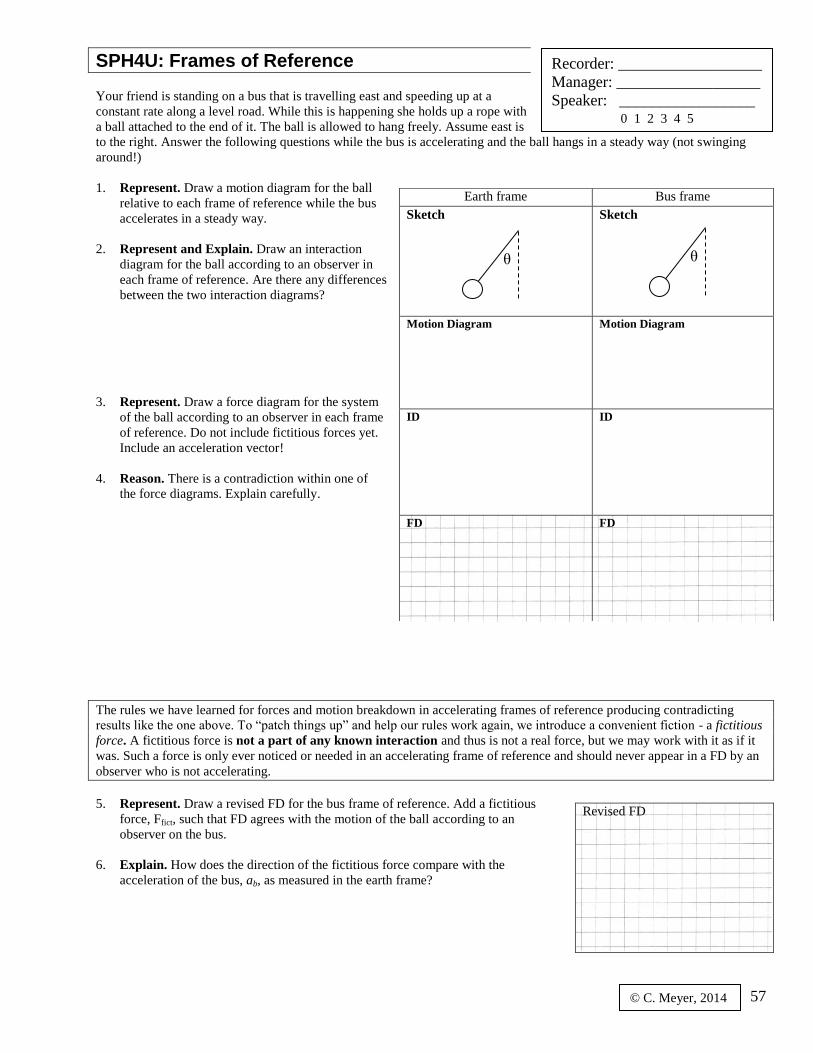
57
SPH4U: Frames of Reference
Your friend is standing on a bus that is travelling east and speeding up at a
constant rate along a level road. While this is happening she holds up a rope with
a ball attached to the end of it. The ball is allowed to hang freely. Assume east is
to the right. Answer the following questions while the bus is accelerating and the ball hangs in a steady way (not swinging
around!)
1. Represent. Draw a motion diagram for the ball
relative to each frame of reference while the bus
accelerates in a steady way.
2. Represent and Explain. Draw an interaction
diagram for the ball according to an observer in
each frame of reference. Are there any differences
between the two interaction diagrams?
3. Represent. Draw a force diagram for the system
of the ball according to an observer in each frame
of reference. Do not include fictitious forces yet.
Include an acceleration vector!
4. Reason. There is a contradiction within one of
the force diagrams. Explain carefully.
The rules we have learned for forces and motion breakdown in accelerating frames of reference producing contradicting
results like the one above. To “patch things up” and help our rules work again, we introduce a convenient fiction - a fictitious
force. A fictitious force is not a part of any known interaction and thus is not a real force, but we may work with it as if it
was. Such a force is only ever noticed or needed in an accelerating frame of reference and should never appear in a FD by an
observer who is not accelerating.
5. Represent. Draw a revised FD for the bus frame of reference. Add a fictitious
force, Ffict, such that FD agrees with the motion of the ball according to an
observer on the bus.
6. Explain. How does the direction of the fictitious force compare with the
acceleration of the bus, ab, as measured in the earth frame?
Earth frame Bus frame
Sketch
Sketch
Motion Diagram Motion Diagram
ID
ID
FD
FD
Revised FD
θ θ
Recorder: __________________
Manager: __________________
Speaker: _________________ 0 1 2 3 4 5
© C. Meyer, 2014

58
7. Summarize. Think of other situations where you have been accelerated. Except when in free fall, we feel as if we are
somehow being pushed. In all these situations, how does the direction of your acceleration compare with the direction of
the sensation you feel?
8. Analyze. From the Earth frame of reference, write an expression for the x- and y-components of Newton’s 2nd
law. Solve
for the acceleration ab in terms of θ and g.
B: Fictitious Forces and Acceleration
1. Summarize. How does the direction of your fictitious force compare with the direction of the acceleration?
2. Summarize. What do the two observers agree on? Consult your table on the first page.
3. Solve. Your friend on the bus measures an angle of 13o with a 127 g ball. What is the size of the fictitious force
according to your friend?
4. Apply. Describe a situation where you have experienced a fictitious force. Explain what was happening with your new
understanding.

59
SPH4U: Strings and Composite Objects
How do strings do their thing? Let’s find out!
A: String Theory
You need three identical spring scales. Connect all three spring scales into a chain. Each hook of the scale represents a piece
of “string material” and the springs inside the scale represent the interaction between the pieces of string material.
1. Observe. Hold on to each end of the chain of scales and stretch them horizontally along your table. How do the
readings of each scale compare? What happens to the readings when you pull harder?
2. Reason. How hard does each end of the string pull on your hands? What law does this sound familiar from?
3. Reason. Pull on just one end of your “string” and describe the force readings. It is possible to have a significant amount
of tension in a real string if we pull on only one end?
Physics String has a few special properties: (1) it is massless, (2) it does not stretch, and (3) it exerts equal and opposite
forces on the objects it connects. Consequently, we can think of a string as producing a single tension interaction between the
two connected objects, an interaction which obeys Newton’s 3rd
law. We will not consider physics string as an independent
object, so we will never write the word “string” in an interaction diagram, we will simply indicate a tension interaction.
B: Composite Objects
Most objects are made up of millions of smaller parts, all interacting together. With so many interactions, why can we
actually do simple physics and not get bogged down? Consider the situation shown below. Three blocks are connected by
strings and pulled along a frictionless table by a steady force from your hand. The masses of the blocks are indicated.
1. Reason. How does the motion of blocks A, B, and C
compare?
A composite object is any object whose parts all move together with the same acceleration.
2. Represent. We will start by considering each
block as a separate system (systems A, B and
C). Complete one interaction diagram for the
three blocks.
3. Represent. Draw a separate FD for each of
systems A, B, and C. Don’t forget to: use the
3rd
law notation, draw an acceleration vector,
and draw the vector lengths carefully!(next
page!)
String R String Q String P
Block C
mass = 2m Block B
mass = 2m Block A
mass = m
Recorder: __________________
Manager: __________________
Speaker: _________________ 0 1 2 3 4 5
Block A Block B Block C
© C. Meyer, 2015

60
System A
mA=
System B
mB=
System C
mC=
4. Reason. Rank in increasing size the magnitudes of the net forces on systems A, B, and C. Explain.
5. Represent and Explain. Use a new colour to draw a new system boundary
(circle) in the interaction diagram consisting of blocks B and C together. Use
the words “internal” and “external” to help explain how to use the interaction
diagram to decide which forces should appear on a new force diagram for the
new system, which we will call system D.
6. Represent. Use another colour to draw another new system in the interaction
diagram on the previous page consisting of blocks A, B and C together. Draw the
force diagram for system E. Indicate the mass of the system.
7. Reason. How does the acceleration of system D and E compare with that of A,
B, and C? Explain.
8. Reason. Which system has the simplest force diagram for the purpose of finding the force of tension in string P? What
about for string Q? for string R?
9. Summary. Why can we do simple physics with complex objects that are made up of many, many parts? (Why aren’t
there millions of forces on our FDs?)
10. Solve. Consider a situation where m = 1.0 kg and the hand exerts a force of 15 N. Find the magnitude of the other tension
forces. (Tip: Always make sure that the mass used in the 2nd
law is the mass of the system you are analyzing!)
System D
mD =
System E
mE =

61
SPH4U: Tension and Pulleys
A: Physics Pulleys
You will need two pulleys, some string, 500 g masses and two spring scales. Set
up your equipment as shown in the diagram. Calibrate your scales!
1. Reason. What is the readability of your spring scale? Estimate the uncertainty in the results you
will get.
2. Observe. Change the angle of the string that passes over the pulley. Describe what you observe.
3. Reason. Devise a rule describing how an ideal physics pulley affects the magnitude and direction of the force of tension
in a string.
Physics Pulleys:
B: Testing String Theory
1. Predict. Don’t set this up yet! Consider the two pulley situation shown in the next
diagram which uses two 500 g masses. Suppose we measure the tension in the string at
the three positions indicated. Predict the values of those three tension measurements.
Provide a rationale for each.
Prediction Rationale
(1)
(2)
(3)
2. Test and Evaluate. Use the equipment set up at the front of the class to test your predictions. Record your results along
with uncertainties. Do your results agree with your predictions? Offer an explanation for the results you found.
Result Explanation
(1)
(2)
(3)
3. Reason. Create a definition of how tension works. It should explain what it means when we say, “there is 4.9 N of
tension in a string”.
Tension
Recorder: __________________
Manager: __________________
Speaker: _________________ 0 1 2 3 4 5
© C. Meyer, 2014
m
m m
1
2
3

62
C: The Atwood Machine
An Atwood machine consists of two masses tied together and suspended over a pulley. For this part
of the investigation, you will use the equipment set up at the front of the class.
1. Predict. The two masses are identical. You give a gentle push to one mass. Predict the motion
of the mass after it leaves contact with your hand. Justify your prediction.
2. Test. Try it out. Describe your observations. Do they agree with your prediction?
3. Predict. The mass of A is now less than B. Predict the motion of mass A after you release it. How will the motion of the
two objects compare? Justify your prediction.
4. Test. Try it out. Describe your observations. Do they confirm your predictions?
5. Represent. Draw a FD for mass A and for mass B. (mA<mB).Choose your sign
conventions so they agree with the acceleration of each object!
6. Reason. For the FDs, do you need to use a different symbol for the magnitude
of the acceleration of mass A and mass B? What about the forces of tension and
gravity acting on each mass? Explain.
7. Predict. How will the magnitude of the force of tension compare with FgA and
FgB? Explain.
8. Represent. Write a complete expression for Newton’s 2nd
Law for each mass. Be very careful with your notation!
9. Solve and Test. Algebraically eliminate FT from the above two equations and solve for the acceleration of the masses.
Use the masses from the Atwood machine set up in the classroom and solve for the acceleration. Then test this result
using the motion detector.
10. Evaluate. Now go back and solve for the force of tension. How does this result compare with your prediction? Explain.
Mass A
Mass B
mA
mB

63
SPH4U: Friction!
We normally think of friction as the force that stops things from moving. This is
in many respects still true, but we must also realize that friction is the force that
is usually responsible for starting things moving too!
A: Rubbing the Wrong Way?
Find a convenient, hand-sized object. Place the object on the flat palm of your hand. Keep your hand completely horizontal
and cause the object to move horizontally and speed up with your hand (no slipping).
1. Reason. Why does the object accelerate?
2. Reason. Marie says, “At first I thought a horizontal normal force causes it to accelerate. But then I remembered that a
normal force is always perpendicular to the surfaces. It doesn’t make sense to have a horizontal normal force here.” Do
you agree with Marie? Explain.
3. Reason. Emmy says, “In this situation a friction force must act in the forwards direction.” Albert responds, “That’s not
right. Friction always opposes an object’s motion. It should point in the backwards direction.” Who do you agree with?
Explain.
4. Predict. What would happen to your object if there was no friction at all between it and your hand? Explain.
5. Test. Try this out with the equipment at the front of the class. Record
your observations. Do they support your prediction? Do you need to
revise any of your earlier answers?
6. Represent. Draw an ID and FD for your object while it is speeding up.
Friction is a contact force that tries to prevent two surfaces from sliding relative to one another. If there is no slipping of the
two surfaces, static friction may be present. If the two surfaces are slipping, kinetic friction is present.
B: Two Kinds of Friction
1. Represent. Use a large pencil case or a phone with a cover as your object. Place
your object on the table. Exert a force on the object using a 5N spring scale such
that it slides at a constant velocity. Draw a FD for it while sliding.
2. Explain. Why does the spring scale reading equal to the force of kinetic friction?
ID FD
FD
Recorder: __________________
Manager: __________________
Speaker: _________________ 0 1 2 3 4 5
© C. Meyer, 2015

64
3. Explain. You might have noticed that reading on the spring scale jerked lower as soon as your object began to slide. (If
you didn’t notice this, apply a small and gradually increasing force or find a heavier object.) What does that higher initial
reading tell us about the friction between your object and the table? (Hint: Remember there is another type of friction!)
The force of friction depends on the characteristics of the surfaces involved (as represented by the coefficient of friction, μ),
and how hard the surfaces are pressed together (the normal force, Fn). The two forces of friction can be found from the two
expressions, Ffk = μkFn and 0 <Ffs ≤Ffsmax, where Ffsmax =μsFn.
4. Calculate. Make measurements and determine the coefficient of kinetic friction for your object on the table.
5. Reason. Imagine you repeat this experiment in an elevator accelerating upwards. Emmy says, “I bet the value for μ will
get smaller since μ depends on Fn”. Albert says, “The equation written as μ = Ff / Fn makes it look like μ depends on Fn,
but is actually doesn’t.” Who do you agree with? Explain.
C: Friction Causing Motion
Place your object in the middle of a dynamics cart (make sure your object doesn’t touch the front or back of the cart). Use the
spring scale to pull on the cart and cause both the cart and object to move together. We will assume there is no friction
between the cart and the table.
1. Observe and Explain. Exert a force on the cart, causing both the cart and object to move together. Describe the motion
of the object. What force was responsible for your object’s motion? Be specific.
2. Represent. Draw an interaction diagram for the cart and object
while you pull on the cart. Don’t circle a system yet.
3. Represent. Now we will draw three FDs while the cart and object
are moving together (no slipping). Use the 3rd law notation for the
forces. Indicate any 3rd
law force pairs that appear.
Your object The cart The cart + object system
ID

65
4. Explain. We are pulling on the cart and the object does not slip. We know (or can quickly measure) the mass of the cart
and object, and find μs. Based on these known quantities, which FD is easiest for finding the acceleration? Explain.
5. Solve. Determine the largest force that we can exert on the cart before the object starts to slip. (Hint: Use your reasoning
from the previous question to start it off. Feel free to use these quantities: mc = 1.1kg, mo = 0.24 kg, s = 0.45)
D: Friction and the Ramp
You need a track and an object that produces about 1-3 N of static friction.
1. Observe and Calculate. Determine the coefficient of static for your
object on the horizontal track surface. Draw an ID and FD for this
situation. There is a lot of uncertainty in this measurement, so record a
high and low possible value for your measurement and calculate a high
and low possible value for the coefficient. Show your work.
2. Reason. Now draw a FD for the box at rest on an incline. Let the x-axis be parallel to the incline. How will each force
change when the angle of the incline increases? Explain.
3.
ID FD
Fgx Fgy
Fn Ffs max
FD
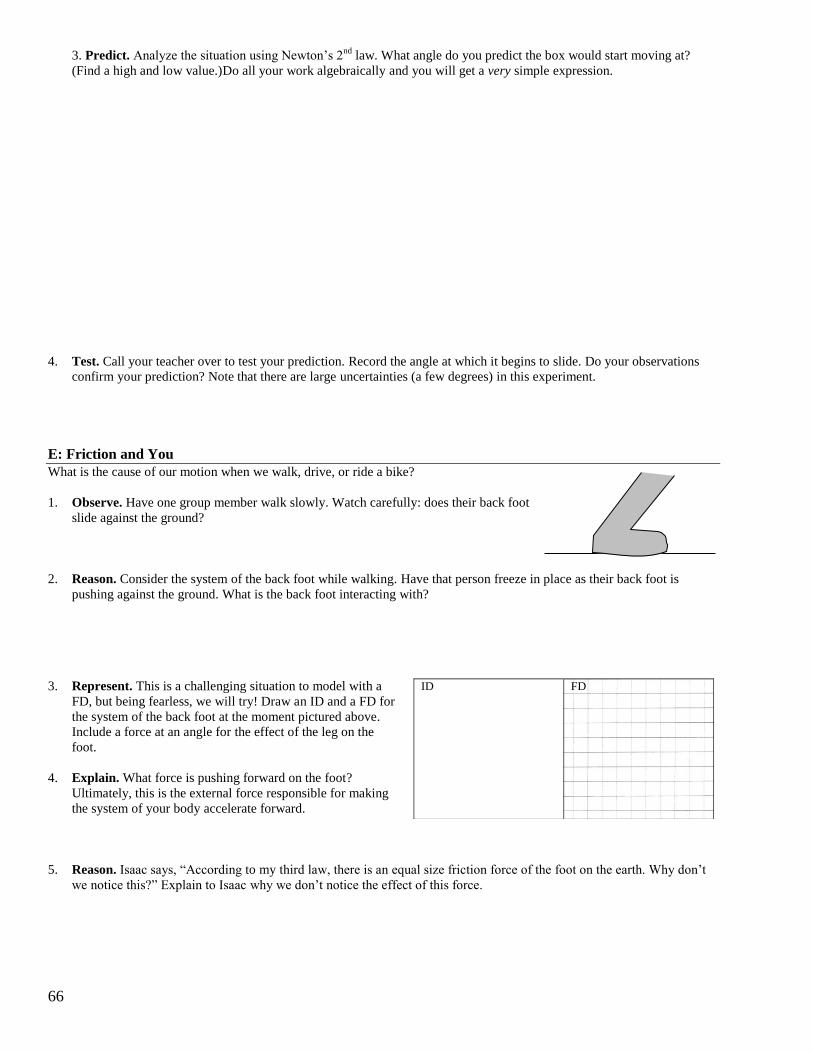
66
3. Predict. Analyze the situation using Newton’s 2nd
law. What angle do you predict the box would start moving at?
(Find a high and low value.)Do all your work algebraically and you will get a very simple expression.
4. Test. Call your teacher over to test your prediction. Record the angle at which it begins to slide. Do your observations
confirm your prediction? Note that there are large uncertainties (a few degrees) in this experiment.
E: Friction and You
What is the cause of our motion when we walk, drive, or ride a bike?
1. Observe. Have one group member walk slowly. Watch carefully: does their back foot
slide against the ground?
2. Reason. Consider the system of the back foot while walking. Have that person freeze in place as their back foot is
pushing against the ground. What is the back foot interacting with?
3. Represent. This is a challenging situation to model with a
FD, but being fearless, we will try! Draw an ID and a FD for
the system of the back foot at the moment pictured above.
Include a force at an angle for the effect of the leg on the
foot.
4. Explain. What force is pushing forward on the foot?
Ultimately, this is the external force responsible for making
the system of your body accelerate forward.
5. Reason. Isaac says, “According to my third law, there is an equal size friction force of the foot on the earth. Why don’t
we notice this?” Explain to Isaac why we don’t notice the effect of this force.
ID FD

67
SPH4U: Going in Circles? What makes the world go ‘round? Let’s find out!
A: Observing Circular Motion
Let’s find out how forces in different directions affect the motion of the intrepid
physics buggy! A reminder - velocity has two parts: a magnitude (speed) and a direction.
1. Observe. Describe the velocity of the buggy when it drives along the level floor with no additional forces.
2. Observe. Attach a piece of string to the buggy – if it tends to flip, adjust the string angle. In the chart below, describe
how the velocity (speed and direction) of the buggy changes when you exert a constant, horizontal force on the buggy in
a direction: (a) parallel to its motion, and (b) perpendicular to the direction of the buggy’s motion.
Forces Parallel Forces Perpendicular
3. Reason. In which case(s) above is the buggy accelerating? Explain.
4. Reason. Create a principle describing the effect of forces on an object’s speed and direction.
Speed and Direction Principle:
5. Observe and Reason. Swirl a marble around inside a roll of masking tape. Once it’s going, hold the roll of tape still and
observe. We will neglect the small amount of friction which slows down the marble after your stop “swirling”.
a) Draw an ID for the system of the
marble.
b) Draw a force diagram for the marble at
two moments in time: when it is
moving towards you and when it is
moving away from you. Draw it from a
head-on point of view (as if your eye
was at table level.
c) What forces or components of forces
balance?
d) What is the direction of the net force experienced by the marble?
ID FD (head-on, towards) FD (head-on, away)
Recorder: __________________
Manager: __________________
Speaker: _________________ 0 1 2 3 4 5
© C. Meyer, 2014

68
6. Observe and Reason. Tie an object to a length of string and swing it in a slow, horizontal circle. (Don’t hit anyone!)
a) Draw an ID and a FD for the system of the object.
b) What forces or components of forces balance?
c) Isaac says, “I think the net force points up at an angle, along the
string.” Marie says, “I think it points horizontally.” Who do you agree
with? Explain.
B: Making Rules and Breaking Rules
1. Reason. Devise a provisional rule for the direction of the net force of an object moving in a circle at a constant speed.
(Provisional means temporary or likely to change.)
Provisional Rule #1:
2. Describe. Think about your experience turning a corner in a car. How does that feel?
Provisional Rule #2: When an object moves in a circle there is a radial force acting outwards, away from the centre.
Provisional Rule #3: When an object moves in a circle, there must be a tangential force forwards, in the direction the
object is moving.
We don’t know yet which of these rules are correct. In science, we make observations, develop theories (rules) and then test
them out. In the following experiment we will look for evidence which supports or refutes these three rules.
3. Predict and Test. In a moment you will attach a hover puck to a
string. The hover puck is given a short push to start it moving. The
end of the string is held fixed on the ground.
(a) Predict how the puck will move after the push.
(b) Test your prediction and describe the motion of the puck.
(c) Draw an ID and a FD for the puck after the push from a top view (from above).
(d) Each rule makes a prediction about this situation (after the push) which is shown below. Based on your observations
or your FD, which rules are confirmed and which are refuted? If you think a force is present, describe the interaction
it is a part of. (next page!)
ID FD
Sketch ID FD (top view)
push

69
Rule #1 Rule #2 Rule #3
Prediction: There is a net force in
the radial inwards direction.
Prediction: There is a force in the
radial outwards direction.
Prediction: There is a force in the
forwards direction.
Conclusion: Conclusion: Conclusion:
4. Reason. Based on your observations, elevate one of the provisional rules to an official rule. Mention what uniform
circular motion means.
Net Force and Uniform Circular Motion:
Centripetal is an adjective that describes any force or component of a force that points towards the centre of curvature of an
object’s path of motion. A centripetal force changes an object’s direction without changing its speed. It is responsible for
keeping an object moving in a circle. There is no special symbol for a centripetal force – never write Fc, anywhere! Your
textbook does use this symbol, but it is a faulty habit – don’t! Centripetal is simply an additional label for already familiar
forces (Ft, Fg, Fn, etc.) and is a helpful term when discussing circular motion.
5. Reason. Which forces in the examples we have studied so far have acted as centripetal forces?
C: Turning a Corner
You are a passenger in the back seat of a car. You placed your water bottle on the seat beside you and then the car makes a
sharp turn to the left. Your bottle slides across the seat (no friction) until it hits the door on the other side of the car. It seems
to be pressed against the door.
1. (as a class) Observe and Explain. Watch the simulation and complete the chart below.
Describe Motion
in Car Frame
Describe Motion
in Earth Frame
ID
System = bottle
FD in Earth Frame
(front view)
While
sliding
across the
seat
While
pressed
against the
door

70
SPH4U Homework: Going in Circles Name:
A: Turning a Corner
1. Reason. Marie says, “When we turn the corner in a car, there must be an outwards force that pushes you across the seat
and presses you against the door. That’s what I feel.” Do you agree or disagree with Marie? Explain.
2. Reason. A car turns a corner. Draw an ID and FD for the car. Which
force acts as the centripetal force in this situation?
3. Reason. Isaac says, “I don’t see how friction could be the centripetal
force in this situation. It just doesn’t seem right.” Explain to Isaac what
would happen if there was no friction interaction. So what force is
responsible for keeping the car moving in a circle?
4. Reason. When we investigated frames of reference a few classes ago, we decided that when we accelerate, we feel as if
we are being pressed in the opposite direction. Is that conclusion valid for circular motion as well? Explain.
5. Reason. Use your new force rule to explain how to cause a hover puck to move in a circle
simply by using gentle taps from a metre stick (no string!) Illustrate the force of your taps in the
diagram.
6. Reason. The hover puck moves in a very mysterious manner due to unknown forces. A motion diagram is shown below
with dots produced after equal intervals of time. Draw a vector that represents the centripetal force at the four moments
in time indicated. Can you guess which net force is greater? Offer a rationale for your answer (our next lesson will help
us clearly decide which is greater).
ID FD
1
2
3
4
© C. Meyer, 2014

71
SPH4U: Radial Acceleration
What is special about the motion of an object moving in a circle? Only vectors
will tell!
When we discuss circular motion, there are often two important directions: (1) the radial direction which points inwards, to
the centre of curvature of the object’s path, and (2) the tangential direction which points forwards, tangent to the object’s
curving path. In many cases it may be convenient to choose one these as our x- or y-directions for our coordinate systems.
A: Instantaneous Velocity and a Curving Path
Attach a piece of string to a hover puck and swing it in a circle.
1. Observe. Release the string when the puck is in the 9 o’clock position. In what direction
will the puck travel? This observation gives us an idea about the puck’s instantaneous
velocity at the moment it was released.
2. Represent. Draw an instantaneous velocity vector for the hover puck at the four
moments in time shown in the diagram. When drawing instantaneous velocity vectors,
they should appear tangent to an object’s path with the tail starting at the position of the
puck.
3. Explain. When an object moves in a circle at a steady rate, does the speed change? Does the velocity change?
B: Velocity Vector Diagrams
The technique explained below will help you estimate the average acceleration of an object during two-dimensional motion.
To find the acceleration, we need to find a change in velocity, v2 – v1. Subtracting two vectors is done by drawing them tail-
to-tail.
Notice that when the velocity vector diagram is complete, it follows our familiar pattern: v2 = v1 + Δv (since Δv = v2 – v1!)
C: Acceleration and Circular Motion
1. Represent. An object moves at a constant speed in a circle. Use the vector subtraction technique to estimate the
acceleration vector at the four moments shown in the diagram. Neatly show your vector work for each example (the first
example is almost complete). Draw a wiggly acceleration vector inside the circle for each moment.
a
The acceleration, a, is in
the same direction as the
change in velocity, v,
and has a magnitude
v/t.
2v
1v
v
Redraw the two velocity
vectors tail to tail. Draw the
change in velocity vector
going from the head of v1 to
the head of v2.
2v
1v
We want to estimate the acceleration for an object
when it passes the middle point (). Draw the initial
velocity vector (v1) just before the point. Draw the
final velocity vector (v2) just after the point.
Adapted from The Physics Active Learning Guide by A. Van Heuvelen, Pearson, 2006
Recorder: __________________
Manager: __________________
Speaker: _________________ 0 1 2 3 4 5

72
An object moving in a circle experiences an acceleration (ar) in the radial direction pointing towards the centre of its circular
path. This acceleration is called the radial acceleration (in the textbook this is called the centripetal acceleration).
2. Reason. How does the pattern for the acceleration vectors compare with the rule you developed for the net force in the
previous investigation? What law of physics is this a result of?
3. Represent. A physics buggy moves at a constant speed across the top
of a circular hill, as shown in the illustration. In the chart below, use the
vector subtraction technique to find the acceleration, draw an ID and
FD, and explain how the two results agree according to Newton’s 2nd
law.
Velocity Vectors
ID FD Agreement?
4. Apply. Have you ever been in a situation similar to the one described above? What was the situation and what did it feel
like?
5. Reason. What would change if the physics buggy was at the bottom of a valley instead of the top of a hill?
D: The Pendulum of Fate
In our classroom we have a 0.50 kg mass hanging on the end of a 1.0 m string. The string is connected to a spring scale.
1. Predict. The mass is at rest, hanging from the scale. Draw a FD. Predict the spring
scale reading. Justify your prediction.
2. Predict. Imagine you pull the mass to the side and release it such that it swings like
a pendulum. Even though the mass does not move in a complete circle, this is still
circular motion! Apply your new understanding of circular motion when the mass is
at its lowest point. Predict how the spring scale reading will change.
3. Test. Perform the experiment. Explain how the result agrees with our understanding of acceleration and force in circular
motion.
FD – Rest FD - Swinging

73
E: Acceleration, Speed and Radius
Two identical physics buggies travel at a constant speed along two identical circular paths. Buggy A moves with a speed v
and Buggy B with a speed 2v. Buggy A completes a ¼ trip in a time ΔtA and experiences a change in velocity vA.
1. Represent. Use the vector subtraction technique to compare the radial accelerations of the two buggies.
Illustration Change in Velocity Time Interval Acceleration
Bu
gg
y A
For a ¼ trip:
ΔtA
aA = ΔvA / ΔtA
Bu
gg
y B
Hint: How does ΔvB
compare with ΔvA?
How does ΔtB
compare with
ΔtA?
2. Reason. How does the magnitude of the acceleration depend on the speed? Write out a mathematical expression for this
relationship. (Use the proportionality symbol “”)
Two identical buggies travel with the same constant speed along two circular paths with different radii. Buggy A moves in a
circle of radius r and buggy B moves in a circle with radius 2r. Buggy A completes a ¼ trip in a time ΔtA.
3. Represent. Use the vectors subtraction technique to compare the radial acceleration of each buggy.
Illustration Change in Velocity Time Interval Acceleration
Bu
gg
y A
For a ¼ trip:
ΔtA
aA = ΔvA / ΔtA
Bu
gg
y B
4. Reason. How does the magnitude of the acceleration depend on the radius? Write out a mathematical expression for this
relationship.
•
•
1v
2v
1v
2v
Av
•
•
1v
2v
•
•
1v
2v
1v
2v
Av
•
•
1v
2v

74
5. Speculate. Combine the two results above and write equation for the magnitude of the radial acceleration during circular
motion.
**Check your result with your teacher **
F: Test the Acceleration Expression
When we experiment it is often simplest to measure the frequency (f) or the period (T) of the circular motion rather than the
speed. We can create two other handy equations for the radial acceleration: ar = 42rf
2 = 4
2r/T
2. Recall that f = 1/T.
1. Derive. Start with your equation for the radial acceleration. Use your knowledge of circles (a distance of 2r and a time
T) to eliminate v from your equation and create the two other equations shown above.
2. Predict. According to our understanding of acceleration and net force, explain what happens to the magnitude of the
centripetal force if an object spins faster with the same radius.
3. Predict. Explain what happens to the magnitude of the centripetal force if the object spins with the same frequency and
the radius increases.
4. Test. Find the circular motion kit: a small tube, string (at least 1 m), rubber
stopper, and spring scale (5 N). Attach the string to the stopper and thread it
through the tube. Have one person hold the tube and another person hold a
spring scale connected to the bottom of the string. Find some space where
you can swing the stopper in a horizontal circle in the air above your heads.
Don’t hit people! Practice swinging it at a steady rate.
5. Test and Evaluate. Test your two predictions above. Note that keeping the
same frequency is quite tricky! Were your predictions consistent with the
observations? Do the new equations work?
spring scale

75
SPH4U: Thinking About Circular Motion A: The Balancing Act?
Marie swings a rock in a vertical circle at a constant speed. The rock reaches the
lowest point in its trip. Emmy says, “I can feel the string pulling down on my
hand. There must be a net force downwards.” Isaac says, “I think at the bottom the forces balance.” Albert says, “Since the
object is moving to the left at this moment, the net force must be to the left.” Who do you agree with? Explain.
Sketch
ID
Velocity
Vectors
FD Explanation
B: Changing Tension?
Now Emmy swings the rock in a vertical circle at a steady rate. Marie says, “I can feel that the tension in the rope is different
when the rock is at the top compared with at the bottom of its trip. I guess the force of tension is changing.” Emmy says, “No,
the force of tension can’t be changing since the speed and acceleration of the rock is constant.” Who do you agree with?
Explain.
Sketch
FD – top
FD - bottom Explanation
Test. Swing a ball in a vertical circle and verify whether you can feel the changing tension force.
C: Rocks at 33½
Albert places a rock on a rotating platform, just like an old fashioned record turntable. It does not slip on the platform
surface. Albert says, “At this moment in time the instantaneous velocity of the rock is downwards, from this point of view, so
friction will act in the opposite direction, upwards.” Marie says, “I’m not sure. Since the rock is moving in a circle, I think the
force of friction must act towards the centre.” Who do you agree with? Explain.
Top view
ID FD (side view) Explanation
Recorder: __________________
Manager: __________________
Speaker: _________________ 0 1 2 3 4 5
© C. Meyer, 2014

76
D: The Ball and the Funnel
Albert is visiting the Ontario Science Centre and sees an exhibit where a marble rolling in a funnel glides around in
horizontal circles with no noticeable vertical motion (friction is negligible). Isaac says, “That is so cool!” Albert says, “But I
don’t understand–shouldn’t gravity pull it down to the bottom pretty quick? I don’t see how it could travel in a circle.”
Explain to Albert how this is possible.
Sketch
ID Newton’s 2nd Law (line up your coordinate system
with the acceleration!)
Explanation
FD
E: Evaluate the Problem
Identify any errors in the solution to the following problem. Provide a corrected solution if there are errors.
Problem: 80-kg Samuel rides at a constant 6.0-m/s speed in a horizontal 6.0-m radius
circle in a seat at the end of a cable. Determine the size of the tension force in the cable.
Proposed Solution: The situation is pictured above. We simplify by assuming that
Samuel, the system, is a particle. A FD for Samuel is shown at the right along with the
acceleration direction.
Ft = m(v2/r)
= (80 kg)(6.0 m/s)2/(6.0 m)
= 480 N
The tension is 480 N.
F: Design a Problem
You are given the second last step in a problem where quantities have been substituted in an equation. Your task is to reverse
engineer the problem from this step. Draw a sketch, a force diagram and describe the situation just like a textbook problem!
Sketch
FD Description
200 N + (50 kg)(9.8 N/kg) =
(50 kg)v2 / (12 m)
ca

77
SPH4U: Universal Gravitation
Good old Sir Isaac Newton created an equation to predict the size of the force of
gravity between two masses (m1 and m2) that have a separation between their
centres of (r):
2
21
r
mGmFg
Where G = 6.67x10⁻¹¹
Nm2/kg
2 is the constant of universal gravitation, which describes the strength of the force of gravity.
A: Your Friend the Astronaut
Your friend, who is now an astronaut (mA = 100 kg), is currently standing on the Earth (mE = 5.98x1024
kg, rE = 6.38 x 10⁶
m).
1. Represent. Your astronaut friend
jumps into the air. Draw a sketch
of your friend and Earth during the
jump. Label the quantity, r. Draw
an ID and a FD for your friend and
Earth.
2. Calculate. Use the new equation
for universal gravitation to find an
algebraic expression for the ratio
of force per unit of mass for the
astronaut (Fg/mA). Substitute the
appropriate values into your
expression and evaluate it.
3. Interpret. The result you found in the previous question from the ratio Fg/mA tells us something important about the
effects of gravity. Explain the meaning of this result.
4. Reason. In your FDs you identified two forces of gravity. Compare the size and direction of these two forces.
5. Reason. Isaac says: “I understand from my third law that the astronaut exerts an upwards force on the earth, but this just
seems strange. How come we never notice this upwards force?” Explain to Isaac.
Sketch ID Astronaut FD
Earth FD
Recorder: __________________
Manager: __________________
Speaker: _________________ 0 1 2 3 4 5
© C. Meyer, 2014

78
6. Explain. Calculate the size of the force of gravity the earth exerts on the astronaut and the force the astronaut exerts on
the earth using the expression for universal gravitation. Even if you never heard of Newton’s Third Law, why is it not
necessary to perform two separate calculations?
7. Calculate. Your friend blasts off and travels away from the earth. Complete the table showing the size of the force of
gravity due to the earth on the astronaut at different distances from the centre of the earth. Plot a graph of Fg vs. r
8. Find a pattern. Describe in words how the size of the force of
gravity varies with the separation of the objects.
9. Reason. How far does Earth’s gravitational force extend into the universe? Explain.
10. Reason. Anything with mass will interact gravitationally with anything else that has mass. This means there is a
gravitational interaction between you and the person sitting beside you. Why don’t we notice this interaction? Use a
sample calculation to support your reasoning.
When we work with the law of universal gravitation, we will usually assume that the mass of the interacting object (like the
earth) is concentrated in a single point. This assumption is valid so long as we don’t enter the interacting object!
11. Reason. Imagine a hole is dug straight through the centre of the Earth. Describe your motion if you
were to fall in. Ignore any air resistance!
Location Distance Fg
Earth’s Surface 6.38 x 10⁶ m
(0.0638 x 10⁸ m)
International
Space Station
6.39 x 10⁶ m
(0.0639 x 10⁸ m)
Cell Phone
Satellite
4.22 x 10⁷ m
(0.42 x 10⁸ m)
Lunar Transfer
Orbit
2.17 x 10⁸ m
Moon’s Orbit 3.85 x 10⁸ m
0
| 2 x 10
8
| 0.5 x 10
8
| 1 x 10
8
| 1.5 x 10
8
distance (m)
500 1
000
|
|

79
SPH4U: Orbits Consider an object (mo) like a satellite or a
moon travelling in a circular orbit around the
earth.
1. Represent. Label the altitude (h), the radius of the circular orbit (ro), the radius of Earth (rE), matching them with the
letters X, Y, and Z.
2. Reason. Which quantity, X, Y, or Z, does r in the expression for universal
gravitation represent? Explain.
2
21
r
mGmFg
3. Reason. Which quantity, X, Y, or Z, does r in the expression for the centripetal
acceleration represent? Explain.
2
24
T
rar
4. Represent. Draw a force diagram for the object at the moment shown.
5. Solve. Start with Newton’s 2nd
Law. Then use universal gravitation and an expression
for centripetal acceleration to create an equation that relates the radius of the orbit and
the period of the orbit. Solve this for T2. Be careful with the labels for the masses!
(Don’t memorize this equation.)
This result is known as Kepler’s law, named after the brilliant mathematician who spent 25 years working out this result.
How long did it take you? (Thanks, Newton!)
6. Solve. Complete the chart below which compares orbital velocities, altitude, radii and periods.
mE = 5.98x1024
kg
rE = 6.38 x 10⁶ m
G = 6.67x10⁻¹¹
Nm2/kg
2
Location Altitude r (m) T (s)
Space Shuttle Orbit 600 km
Geostationary Orbit (satellite
stationary above Earth’s
surface)
24 h =
Moon’s Orbit 27 d =
Earth’s Orbit around Sun
(msun = 1.98 x 1030
kg)
FD
X
Y
Z
Recorder: __________________
Manager: __________________
Speaker: _________________ 0 1 2 3 4 5
© C. Meyer, 2014
mA
mB
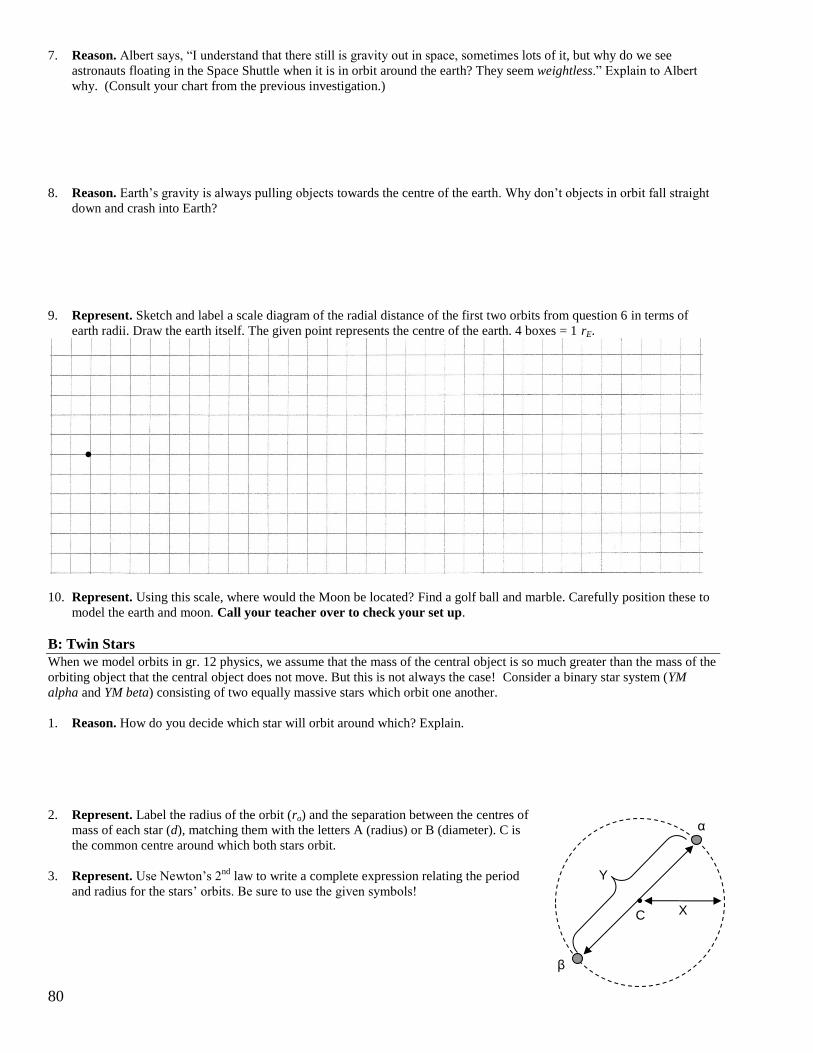
80
7. Reason. Albert says, “I understand that there still is gravity out in space, sometimes lots of it, but why do we see
astronauts floating in the Space Shuttle when it is in orbit around the earth? They seem weightless.” Explain to Albert
why. (Consult your chart from the previous investigation.)
8. Reason. Earth’s gravity is always pulling objects towards the centre of the earth. Why don’t objects in orbit fall straight
down and crash into Earth?
9. Represent. Sketch and label a scale diagram of the radial distance of the first two orbits from question 6 in terms of
earth radii. Draw the earth itself. The given point represents the centre of the earth. 4 boxes = 1 rE.
10. Represent. Using this scale, where would the Moon be located? Find a golf ball and marble. Carefully position these to
model the earth and moon. Call your teacher over to check your set up.
B: Twin Stars
When we model orbits in gr. 12 physics, we assume that the mass of the central object is so much greater than the mass of the
orbiting object that the central object does not move. But this is not always the case! Consider a binary star system (YM
alpha and YM beta) consisting of two equally massive stars which orbit one another.
1. Reason. How do you decide which star will orbit around which? Explain.
2. Represent. Label the radius of the orbit (ro) and the separation between the centres of
mass of each star (d), matching them with the letters A (radius) or B (diameter). C is
the common centre around which both stars orbit.
3. Represent. Use Newton’s 2nd
law to write a complete expression relating the period
and radius for the stars’ orbits. Be sure to use the given symbols!
C
X
Y
α
β

81
SPH4U: “Oomph”
When you catch a heavy object you feel a lot of “Oomph”. What is this
mysterious quantity that we all kind of know? Let’s find out.
A: Figuring Out the Formula for Oomph!
The more oomph something has, the harder it is to stop, and the more ability it has to knock other things over. Let’s figure
out the formula for oomph.
1. Reason. A small pebble and a larger rock are thrown at the same speed.
(a) Which one has more oomph? Why?
(b) The rock is twice as massive as the pebble. Intuitively, how does the rock’s oomph compare to the pebble’s
oomph? Is it twice as big? Half as big? Three times as big?
2. Reason. Picture two identical bowling balls, one of which is rolling faster than the other.
(a) Which ball, the faster or slower one, has more oomph? Why?
(b) The faster ball is exactly 7 times as fast as the slower one. Intuitively, how does the faster ball’s oomph
compare to the slower ball’s oomph?
3. Find a Relationship. The physics concept corresponding to oomph is momentum. Building on your above answers,
create a provisional definition (a formula) for momentum (oomph) in terms of mass and velocity. Explain how the
formula expresses your intuitions from parts A and B above. (For nutty historical reasons, physicists use the letter p for
momentum.).
Provision Definition of Momentum
** check with your teacher at this point **
B: Testing Our Momentous Intuitions
You will need a dynamics track and two carts. In the previous section, your intuitions about
oomph led to a formula for momentum. Now let’s see if your ideas hold true for collisions. Cart
A (1 kg) is rolling with negligible friction at 3 m/s and collides with and sticks with Velcro to
cart B (identical to cart A). So, after colliding, the carts roll together as a single unit.
1. Predict. Don’t do it yet! Using your intuitions, guess the post-collision speed of the two
carts. Briefly explain your reasoning.
Recorder: __________________
Manager: __________________
Speaker: _________________ 0 1 2 3 4 5
© C. Meyer, 2014, adapted from University of
Maryland Physics Education Research Group, Fall 2004
Moment 2 ?
3 m/s
1 kg 1 kg
Moment 1

82
2. Test. Use the carts and dynamics track to test your prediction. Roughly speaking, do your observations agree with your
prediction? Did the first cart gain or lose momentum? What about the second cart? What about the system of two carts,
did it gain or lose momentum?
To help represent the momenta of a system before and after a process like a collision we can construct an impulse-momentum
bar chart. In our notation, we use letters to denote different objects and numbers to indicate different moments in time. We
draw a bar that represents the size and direction of the momentum of each object in the system. The exact heights are not
important, but the bars must clearly show the correct ideas. The change in the momentum of the system is called the impulse
and is represented by the symbol J.
3. Represent and Explain. Complete the momentum-impulse bar chart for the system of
the two carts before and after the collision described above. For convenience, you can
think of the cart A as having 31 = 3 units of momentum. Once complete, explain two
ways in which the graph visually represents the fact that the impulse on the system was
zero.
Here is another situation to consider: in a similar experiment, cart A collides with cart B magnetically. The two carts don’t
actually touch – the magnets act like a perfect spring between the two carts. After the collision, cart A is at rest.
4. Predict. Again using intuitions, predict the post-collision speed of cart B.
5. Test. Use the carts and dynamics track to test your prediction. Roughly speaking do your
observations agree with your prediction? Did the first cart gain or lose momentum? What
about the second cart? What about the system of two carts, did it gain or lose momentum?
Complete the momentum-impulse bar chart.
6. Summarize. Based on your work above, state a general rule about how the total
momentum of a system changes during a collision.
Here is one last situation to try out. The two carts are initially moving at 3 m/s in opposite directions. They collide and stick
using Velcro.
7. Predict and Test. Intuitively, after the collision, how fast do the carts move and in what
direction? Test your prediction.
pA1 + pB1 + J = pA2 + pB2
+
0
-
Moment 2 ?
3 m/s
1 kg 1 kg
Moment 1
stopped
AFTER
?
3 m/s
1 kg 1 kg
BEFORE 3 m/s
pA1 + pB1 + J = pA2 + pB2
+
0
-

83
8. Reason. In all cart collisions explored above, momentum was conserved; it was the same before and after the collision.
Because conserved quantities are useful in problem-solving, it would be cool if we could define momentum in such a
way that it’s always conserved in collisions (between objects that are free to move). Is there some way to modify or
clarify the momentum formula you figured previously so that momentum is conserved in the head-on collision between
the two carts? Explain. (Hint: Maybe oomph “cares” about direction.)
Official Definition of Momentum:
9. Represent. Complete a momentum-impulse bar chart for this collision. Explain how
the idea of direction is visually represented in the chart.
** check with your teacher **
C: The Conservation of Momentum
When we study the momentum of a system, we can construct an impulse-momentum equation to track the momentum of
each system object and any flow of momentum in or out of the system:
Impulse-momentum equation: 2211 BBAABBAA vmvmJvmvm
Problem. Let’s practice using momentum conservation. A 500 g cart moves east at 1.0 m/s and collides with a 1000 g cart
that is at rest. The carts bounce magnetically off each other. After the bounce, the 1000 g car is moving east at 0.65 m/s.
1. Represent. A good, first step in any conservation problem is sketching the initial and final states of the process. These
are two key events. Complete Part A below.
A: Pictorial Representation Sketch showing “before” and “after”, coordinate system, label givens and unknowns with symbols, conversions, describe events
2. Predict. Without doing calculations, make a quick guess for the final direction of motion of the 500 g car. Briefly
explain your reasoning.
3. Reason. Are there any important interactions between the system objects and the external environment? Will these affect
the momentum? Explain.
4. Represent. Complete part B for the process. Draw the diagrams for the two carts during the collision.
pA1 + pB1 + J = pA2 + pB2
+
0
-
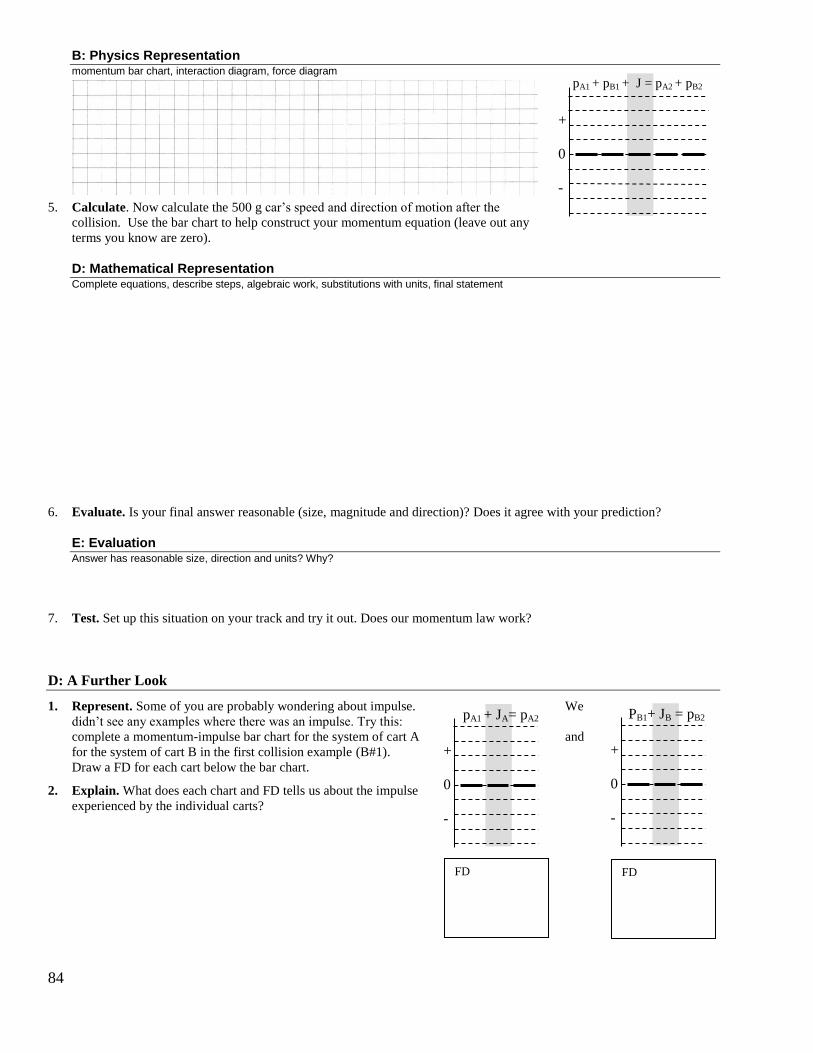
84
+
0
-
pA1 + pB1 + J = pA2 + pB2
pA1 + JA= pA2
+
0
-
FD
PB1+ JB = pB2
+
0
-
FD
B: Physics Representation momentum bar chart, interaction diagram, force diagram
5. Calculate. Now calculate the 500 g car’s speed and direction of motion after the
collision. Use the bar chart to help construct your momentum equation (leave out any
terms you know are zero).
D: Mathematical Representation Complete equations, describe steps, algebraic work, substitutions with units, final statement
6. Evaluate. Is your final answer reasonable (size, magnitude and direction)? Does it agree with your prediction?
E: Evaluation Answer has reasonable size, direction and units? Why?
7. Test. Set up this situation on your track and try it out. Does our momentum law work?
D: A Further Look
1. Represent. Some of you are probably wondering about impulse. We
didn’t see any examples where there was an impulse. Try this:
complete a momentum-impulse bar chart for the system of cart A and
for the system of cart B in the first collision example (B#1).
Draw a FD for each cart below the bar chart.
2. Explain. What does each chart and FD tells us about the impulse
experienced by the individual carts?

85
SPH4U: The Idea of Conservation There are some situations where momentum seems to appear or disappear. Let’s
study one of these situations carefully.
A: The Slowing Block
A 1.0 kg block is initially moving at +1.5 m/s and sliding
along a table. It comes to a stop.
1. Represent. Complete a momentum-impulse chart for the system of the block. How much
momentum did the system lose?
2. Reason. Are there any important interactions between the system objects and the external environment? How does this
help to explain the loss of momentum?
The Momentum Conservation Condition: The momentum of a system is conserved when the net force the system
experiences is zero. The total momentum of a system can change if the system experiences a net force from its environment
(objects outside the system). This change, also known as the impulse, is related to the net force and the amount of time the
force acts: tFJp netsystem
. When Fnet (or J) = 0 the system’s momentum is conserved. Use this as the criteria to decide
whether to use momentum to solve a problem.
3. Represent. Draw an ID and FD for the system of the block.
Write an expression for the net force.
4. Speculate. Consider the force responsible for slowing the block. What is the other force in a 3rd
law pair with that force?
Use that other force to help you guess where the block’s momentum went. Make a guess and move on!
B: The Block on a Track
The block is moving at 1.5 m/s, just like before, and is gently lowered on to
a level track that is supported on wheels and is free to move (no friction).
The track has a mass of 2.3 kg and is initially at rest.
1. Predict. What will happen after the block is released?
2. Test and Observe. Use the equipment at the front of the class to test your prediction and speculation. Describe how your
observations help to confirm or disprove them.
ID FD
Recorder: __________________
Manager: __________________
Speaker: _________________ 0 1 2 3 4 5
p1 + J = p2
+
0
-
© C. Meyer, 2015

86
3. Represent and Reason. Complete a momentum-impulse bar chart for the block-track system.
What is the net force on the block-track system? Explain.
4. Calculate. What is the final velocity of the track?
5. Reason. Imagine the mass of the track was increased enormously to equal that of the earth. Describe what would be
different. How does this relate to the situation of part A?
C: The Process of a Collision
Collisions often occur very quickly and we don’t usually notice what is actually happening during a collision. In this
example, cart A (1.0 kg) collided with a smaller cart B (0.5 kg) using an uncompressed spring. The velocity of each cart was
recorded at 9 moments in time and used to calculate the momentum and kinetic energy. A third line on each graph represents
the total momentum and total kinetic energy of the system of two carts.
Initial
Final
1. Represent. Draw a vertical line on the graph
labelled “A” to indicate the moment in time when
the collision begins and one labelled “C” to indicate
when the collision ends. What is the duration of the
collision?
2. Reason. What happens to the spring at moments
“A” and “C”?
3. Represent. Draw a single
ID and two FDs for each
cart during the collision.
ID FD – Cart A FD – Cart B
Cart A Cart B Cart A Cart B
pA1 + pB1 + J = pA2 + pB2
+
0
-
0
2
4
6
8
10
12
14
16
18
0 0.01 0.02 0.03 0.04 0.05 0.06 0.07 0.08 0.09
Mo
me
ntu
m (
kg
m/s
)
Time (s)
Momentum during a Collision
P A
P B
Ptotal

87
4. Reason. Based on the momentum graph, is there any evidence for a small net force acting on this system? Explain.
5. Find a Pattern. Calculate the impulse and
average net force experienced by each cart
during the collision. How do the impulses
and net forces compare (try to disregard the
small variations due to friction).
The Idea of Conservation: A conserved quantity is one whose total for a system remains the same at every moment in time,
so long at the quantity does not enter or leave the system.
6. Reason. Carefully study the graphs
showing the total momentum and total
kinetic energy of the system. Ignoring the
small losses due to friction, which of these
quantities is a conserved quantity? Explain.
7. Reason. Notice how the total kinetic energy dips down during the collision. This indicates a transfer of energy. Where
has the energy been transferred?
8. Represent. Draw a vertical line on the kinetic energy graph labelled “B” to indicate the moment in time when the spring
was at its maximum compression. Approximately how much energy was stored in the spring at this moment?
D: The Buggy Challenge
1. Predict. Your teacher will turn on a physics buggy, gentle lower it on to the sliding track used earlier today, and release
it. The mass of the buggy is less than the track. How will the buggy and track move? Use appropriate physics diagrams
to support your prediction.
Cart A Cart B
Impulse
Fnet
0
5
10
15
20
25
30
35
40
45
50
0 0.01 0.02 0.03 0.04 0.05 0.06 0.07 0.08 0.09
Kin
eti
c E
ne
rgy (
J)
Time (s)
Kinetic Energy during a Collision
Ek A
Ek B
Ek total

88
SPH4U: Types of Collisions
A collision may roughly fall in to three categories based on how the system’s
total kinetic energy (Ek = ½mv2) before and after the collision compares. If the
total kinetic energy decreases due to the collision, it is called an inelastic
collision. If the total kinetic energy remains is the same, the collision is called elastic. If the total kinetic energy increases, the
collision is called superelastic. Our goal today is to study collisions that fall in to these three categories.
You need a dynamics track and two carts. We will not be making precise measurements. We will simply estimate speeds or
changes in speeds and try to making some decisions based on that. Make sure that carts don’t hit the floor! Turn them
upside-down when you are not using them! Place obstacles at the ends of the track!
A: The “Sticky” Collision
1. Observe and Represent. For the collision below, sketch the before and after situations.
2. Reason. Is the total momentum of the system constant during this collision? Explain.
3. Represent. Complete a momentum-impulse bar chart for the two cart system. Use your understanding of momentum
conservation to help estimate the velocities just before or after the collision (for example, vA1 = 1 unit).
Situation: Sticky Type of Collision:
Before - Moment 1
After - Moment 2
Momentum Bar Chart
Energy Bar Chart
A work-energy bar chart shows the amount of energy stored in different mechanisms of a system (motion, gravitational field,
etc.) at two moments in time. The shaded column represents the flow of energy in or out of the system due to external forces,
also known as the external work. A new column has been included to account for the internal energy: energy stored in other
mechanisms of this system (for example heat, vibrations and many more). The heights of the bars in the graph do not need to
be exact – we typically draw these charts before we make any calculations. What is important is that bars illustrate the correct
ideas.
4. Interpret. What does this bar chart tell us about the amount of kinetic energy in the system before and after the
collision? What about the total energy? Which quantity is conserved?
5. Reason. What type of collision is this an example of: elastic, inelastic, or superelastic? Record this above the chart.
A sticky collision is not the only kind of inelastic collision. Technically, any collision that loses kinetic energy is an inelastic
collision. A sticky collision is special because is produces the greatest loss of kinetic energy for the given starting conditions.
For this reason it is also called a completely inelastic collision.
vA1 = 1 unit vB1 = 0 +
0
-
pA1 + pB1 + J = pA2 + pB2 EkA1 + EkB1+ Wext = EkA2 + EkB2 + Eint
+
0
-
Recorder: __________________
Manager: __________________
Speaker: _________________ 0 1 2 3 4 5
© C. Meyer, 2014

89
B: The “Bouncy” Collision
1. Represent and Reason. For the collision below, sketch the before and after situations. Estimate the speeds involved.
Complete a momentum-impulse bar chart and energy bar chart. Does the system gain or lose kinetic energy? Decide
what type of collision it is.
Situation: Bouncy Type of Collision:
Before - Moment 1
After - Moment 2
Momentum Bar Chart
Energy Bar Chart
C: The Explosion
1. Represent and Reason. Sketch the before and after situations. Estimate the speeds involved (for example, vA1 = 1 unit).
Complete a momentum-impulse bar chart and a new kinetic energy bar chart. Does the system gain or lose kinetic
energy? Decide what type of collision it is.
Situation: Explosion Type of Collision:
Before - Moment 1
After - Moment 2
Momentum-Impulse
Bar Chart
Energy Bar Chart
In this final example energy was stored in the spring (elastic energy, Ee). This could have been counted as another storage
mechanism for internal energy, but since we will soon be able to measure and describe energy stored in springs carefully, we
gave spring energy its own bar.
2. Reason. Isaac drew his bar chart for the previous example with EkA2 as a positive bar and EkB2 as an equal-sized positive
bar. Albert drew EkB2 as an equal-sized negative bar. Who do you agree with? Explain.
3. Reason. Is energy a vector or scalar quantity? Use the bar charts you drew in this investigation to help explain.
+
0
-
pA1 + pB1 + J = pA2 + pB2 EkA1 +EkB1+ Ee1+Wext = EkA2 + EkB2 +Ee2
+
0
-

90
SPH4U: 2-D Momentum Homework Name:
A typical problem involving the conservation of momentum in 2-D is often challenging, but usually due to lack of
organization and careless mistakes. Follow the solution format and these following suggestions carefully! Note that parts B
and C have been omitted here, but continue to do them whenever you can.
Problem Two hover pucks glide towards each other, collide and then glide away. Puck A (5.0 kg) was initially travelling at 2.0 m/s [E
25o N]. Puck B (3.0 kg) was initially travelling at 4.0 m/s [E 30
o S]. After the collision, puck A travelled at 1.6 m/s [E 27
o S].
Determine the velocity of Puck B after the collision.
A: Pictorial Representation Sketch showing “before” and “after”, coordinate system, label given information, conversions, unknowns, key events
D: Mathematical Representation Complete equations, describe steps, algebraic work, substitutions with units, final statement
(1) Use the conservation of momentum to find the x-component of the velocity of puck B after the
collision:
mava1x +
(2)
(3)
E: Evaluation Answer has reasonable size, direction and units?
vA1x = vA1y =
vB1x = vB1y =
vA2x = vA2y =
vB2x = vB2y =

91
SPH4U: Momentum in 2-D Momentum is a vector quantity and the Law of Conservation of Momentum is a
vector equation. An object’s momentum can be broken up into components and
so can the law, meaning that momentum is conserved in each component
direction.
A: The Collision
Consider an example where a small, fast moving hover puck (ma = 2.0 kg) collides with a large stationary hover puck (mb =
4.0 kg). Friction is small enough to be negligible.
1. Predict. Use your intuition to predict the direction mb will travel after the collision. Draw a vector arrow in the diagram
to show this. Briefly explain your reasoning. Do this quickly and move on!
2. Solve. For simplicity we choose a coordinate system that lines up with va1. Determine the x- and y-components of all the
known velocities. Record these in the table above. Indicate which components are unknown. Show your work and be
sure to use the sign convention!
B: The x-Momentum
1. Solve. Find the x-components of all the three momentum vectors we have velocities for. Show your work.
pa1x = pb1x = pa2x =
2. Represent. Draw a bar in the momentum bar chart for the three x-momenta you
calculated above.
3. Reason. Does the system experience a net force from its environment? What does this
imply about Jx?
4. Predict. Draw a fourth bar in the momentum bar chart that represents the x-momentum of puck B after the collision.
Explain your prediction by referring to the bars in your chart.
5. Represent. Write an equation showing the relationship between the momentum values in the bar chart. Use the relevant
symbols in the bar chart.
va1x = va1y =
vb1x = vb1y =
va2x = va2y = ma
va1 = 6.0 m/s
va2 = 2.0 m/s
mb
vb1 = 0
60o
E
x
N y
Recorder: __________________
Manager: __________________
Speaker: _________________ 0 1 2 3 4 5
© C. Meyer, 2014
pa1x + pb1x + Jx = pa2x + pb2x
+
0
-

92
Since there is no net force in the x-direction, the x-momentum is conserved and: pa1x + pb1x = pa2x + pb2x
6. Solve. Use your new equation to explicitly solve for pb2x. How does the result agree with your bar chart?
7. Reason. Isaac remarks that the magnitude of pb2x is quite large compared with the other components. “It must be going
really fast.” Do you agree or disagree? Explain.
C: The y-Momentum
1. Solve. Find the y-components of all the three momentum vectors we have velocities for. Show your work.
pa1y = pb1y = pa2y =
2. Represent. Draw a bar in the momentum bar chart for the three y-momenta you
calculated above.
3. Predict. Draw a fourth bar in the momentum bar chart that represents the y-
momentum of puck B after the collision. Explain your prediction by referring to the
bars in your chart.
Since there is no net force in the y-direction, the y-momentum is conserved and: pa1y + pb1y = pa2y + pb2y
3. Solve. Use the conservation of momentum in the y-direction to explicitly solve for pb2y.
4. Reason. Looking back at your work so far, why was it helpful to choose a coordinate system that lined up with va1?
D: The Final Result
1. Explain. Describe how we can use the results found so far to find the missing momentum 2bp
.
2. Solve. Find the momentum vector 2bp
. Be sure to draw the component triangle.
3. Solve and Test. Find 2bv
. Compare this with your prediction and the simulation, if possible.
4. Summarize. What does it mean to say, “Momentum is conserved in two dimensions”?
pa1y + pb1y + Jy = pa2y + pb2y
+
0
-

93
SPH4U: 2-D Collisions
The collision on the next page has had the path of one object removed! Your
challenge is to reconstruct the path. Examine the collision and read the details
describing it, then follow the steps below.
1. Observe. Label the points where the collision appears to begin and end. Explain how you can tell.
2. Reason. Marie says, “Let’s choose a coordinate system that lines up with the page – that will be the most helpful.”
Emmy says, “I think we should choose one that lines up with the initial velocity of puck A. That will be easiest.” Who
do you agree with? Explain.
3. Observe and Reason. Find va1x on the opposite page and record the result on your whiteboard. Isaac says, “Let’s use
units of cm/s for our result – that will be convenient.” Albert says, “Hmm … maybe we should use m/s, even though the
numbers will be very small – they are S.I. units.” Who do you agree with? Explain.
4. Observe and Calculate. Write an equation for the conservation of momentum in the x-direction where vb2x is the
unknown. Make the necessary measurements from the first page (show these) and record your calculated results in the
chart. Solve the equation for vb2x. Note: the equation will simplify. Explain why.
5. Observe and Calculate. Write an equation for the conservation of momentum in the y-direction where vb2y is the
unknown. Make the necessary measurements from the first page and record these in the chart. Solve the equation for vb2y.
6. Calculate and Test. Determine the vector 2bv
. Carefully draw the vector beginning at the circle under the “B” (Bonus:
draw the circles too!)
** Check this with your teacher! **
7. Calculate and Reason. Use kinetic energy calculations to help explain what type of collision this is.
Recorder: __________________
Manager: __________________
Speaker: _________________ 0 1 2 3 4 5
© C. Meyer, 2014

94
On
th
is p
age
is p
ictu
red p
art
of
a co
llis
ion
bet
wee
n t
wo
dry
-ice
pu
cks
A a
nd
B (
ma
= m
b =
30
0 g
). T
he
coll
isio
n
tak
es p
lace
usi
ng
mag
net
s an
d i
s ca
ptu
red
usi
ng a
str
ob
e
lig
ht
that
fla
shes
10
tim
es a
sec
on
d.
Th
e ce
ntr
e o
f ea
ch
pu
ck i
s in
dic
ated
usi
ng
a s
mal
l ci
rcle
an
d t
he
pat
h o
f p
uck
B h
as b
een
era
sed
. P
uck
B w
as i
nit
iall
y a
t re
st a
nd
was
po
siti
on
ed a
t th
e sm
all
circ
le n
ear
the
lett
er B
. S
ho
w y
ou
r
mea
sure
men
ts a
nd
res
ult
s o
n t
his
pag
e an
d y
ou
r w
ork
on
the
pre
vio
us
pag
e.
B
A
Bef
ore
the
Coll
isio
n
Tota
ls
pt1
x =
pt1
y =
Ekt1
=
Puck
B
Vb
1y =
Pb1
y =
Ek
b1 =
Vb1
x =
Pb
1x =
Puck
A
va1
y =
pa1
y =
Eka1
=
va1
x =
pa1
x =
Aft
er t
he
Coll
isio
n
Tota
ls
pt2
x =
pt2
y =
Ekt2
=
Puck
B
Vb2
y =
Pb2y =
Ekb2 =
Vb2x =
Pb2x =
Puck
A
va2
y =
pa2
y =
Eka2
=
va2
x =
pa2
x =

95
SPH4U: Work and Kinetic Energy
How can the energy of a particle change? When an external force acts on a
particle while it moves through a displacement, energy flows into or out of the
particle. This process is called work and the amount of work done (or energy that
has flowed) due to the force can be found from the equation: W = |F||∆d|cosθ, where θ is the angle between the force and
displacement vectors.
A: The Flow of Energy
Your teacher has a track with two carts set up. A large cart, cart A (1.0 kg) is moving right and a small cart, cart B (500 g) is
at rest. They collide magnetically and travel on a frictionless track.
1. Predict. (individually). Describe how each cart will move after the collision.
2. Observe (as a class). Describe the motion of each cart after the collision.
An energy-flow diagram is similar to an interaction diagram, but with two differences: we only draw the lines connecting
objects if there is a flow of energy between them and if there is an energy flow, we add an arrow showing the direction of the
flow. So keep in mind that an interaction diagram helps us construct a force diagram, while an energy-flow diagram helps us
construct a work-energy bar chart.
3. Reason. Which object has gained energy? Which has lost energy? Is energy lost to the environment? How did you
decide?
4. Represent. Draw an energy flow diagram for the system of the two carts on a whiteboard.
5. Represent. Events 1 and 2 occur at the beginning and end of the collision. Follow the instructions and complete the chart
below for the system of cart A and then for the system of cart B, each of which we imagine as a point particle.
(a) Draw a vector arrow for the displacement of the cart and the force acting on the cart during the collision.
(b) Complete a motion diagram for the cart between moments 1 and 2. Describe its motion: is the cart speeding up,
slowing down, or moving with a constant speed?
(c) What is happening to the energy of the system of the cart? Draw an energy flow diagram for the system of the cart.
(d) According to the equation for work, is the work done by this force positive, negative or zero? Give a sample
“calculation” for the sign including the angle .
(e) Complete the work-energy bar chart for the system of the cart.
System
= Cart A
Displacement of cart Motion Diagram Energy-Flow
Diagram
Work-Energy Bar Chart
Sign of Work Force of B on A Description of Motion
Ek1 Wext Ek2
+
0
-
Recorder: __________________
Manager: __________________
Speaker: _________________ 0 1 2 3 4 5
© C. Meyer, 2015

96
6. Reason. We have been assuming (consciously or not) that the gravity and the normal force do not cause energy to flow
into or out of the system. Use the equation for work to help explain why this was correct. (Hint: )
7. Reason. Does the result of the work equation depend on your choice of sign convention? Is work a scalar or vector
quantity? Explain.
B: Work from Multiple Forces
1. Represent. In a new experiment, two hands push horizontally on the same cart. Hand 1 pushes to the left on the cart and
Hand 2 pushes to the right. The cart is moving to the right and is now speeding up.
(a) Draw a motion diagram for the cart.
(b) Draw a complete force diagram for the system of the cart.
(c) Decide whether the work done by each force is positive, negative, or zero. Indicate this by writing a +, –, or 0 along
side the force vector.
(d) Draw an energy-flow diagram for the cart
(e) Is the net work on the system above positive, negative or zero?
Motion Diagram Force Diagram Energy-Flow Diagram Net Work
When a system has multiple interactions with its environment it may gain or lose energy due to a number of forces. The total
change in energy of the system is the net work. The net work can be found in two different ways: by adding up the work from
the individual forces or by finding the work due to the net force.
Wnet = W= W1 + W2 + … or Wnet = |Fnet||d|cos
A single particle that experiences a net force will accelerate and gain or lose kinetic energy. This idea is called the net work -
kinetic energy theorem, Wnet = Ek. This theorem is closely related to Newton’s 2nd
Law, but only applies to single particles.
2. Represent. Two hands continue to push on opposite ends of the cart, but with different magnitudes than before. The cart
is moving to the left and is slowing down. Complete the chart below like in question #1 above.
3. Summarize. What is the physical significance of positive, negative and zero net work? What happens to a particle?
System
= Cart B
Displacement of cart Motion Diagram Energy-Flow Diagram
Work-Energy Bar Chart
Sign of Work Force of A on B Description of Motion
Motion Diagram Force Diagram Energy-Flow Diagram Net Work
Ek1 Wext Ek2
+
0
-

97
SPH4U: Energy and Coordinate Systems
Gravitational energy (Eg = mgy) is a special kind of energy that depends on an
object’s vertical position. But what happens if we choose coordinate systems
that have different vertical origins for our measurements? Let’s find out!
On a hot day, you look out a third story window and hold in your hands a 2.0 kg water balloon
(a big one!). Your friend walks below the window, not noticing you 10 meters above her. You
release the water balloon. We will analyze what happens next from the frame of reference of
you and also of your friend.
1. Represent. On a whiteboard, draw an energy flow diagram for the Earth-balloon system
while the balloon falls.
A: Coordinate System One
You set the vertical origin at your hand. Calculate the energies involved. Use a kinematics calculation to help find v2. Add
up the total energies at each moment. Complete the work-energy bar chart for the earth-balloon system.
Sketch
Gravitational Energy
Eg1 =
Eg2 =
Kinetic Energy
Ek1 =
Ek2 =
Total Energy
ET1 =
ET2 =
Work-Energy Bar Chart
B: Coordinate System Two
Now you set the vertical origin at your friend’s head. Calculate the energies involved. Use a kinematics calculation to help
find v2. Add up the total energies at each moment. Complete the work-energy bar chart.
Sketch
Potential Energy
Eg1 =
Eg2 =
Kinetic Energy
Ek1 =
Ek2 =
Total Energy
ET1 =
ET2 =
Work-Energy Bar Chart
C: Thinking About Energy
1. Reason. How does Eg, Ek and Et change as measured in each coordinate system?
2. Reason. The two observers do not agree on the total energies, but this is not a problem. What is important in physics are
energy changes. What does each observer conclude about the amount of energy that transfers from gravitational to
kinetic within the system? Explain.
y
y1 = 0
v1 = 0
y2 = - 10.0 m
v2 < 0
Ek1 Eg1 Wext Ek2 Eg2
+
0
-
y
y1 = 10.0 m
v1 = 0
y2 = 0
v2 < 0
Ek1 Eg1 Wext Ek2 Eg2
+
0
-
Recorder: __________________
Manager: __________________
Speaker: _________________ 0 1 2 3 4 5
Adapted from: Laws, P. Workshop Physics Activity
Guide. Module II. John Wiley, 2004
Flow

98
SPH4U: Transfers of Energy Homework Name:
1. Represent. Each row in the chart below gives multiple representations of one situation. Complete the missing parts for
each row – come up with new and interesting situations where appropriate.
Word Description Sketch of Initial and Final States Work-Energy Bar Chart
and Equation
(i) A stunt car has a spring-
powered ejector seat. When the
spring is released, the seat with
its passenger is launched out of
the car and reaches a maximum
height y2 above its starting
position. (The elastic energy
stored in the compression x of
a spring is Ee)
System:
Equation:
(ii) An elevator is initially
moving downwards at speed v1.
It approaches the ground floor
and slows to a stop in a distance
h.
System:
Equation:
(iii)
System:
Equation:
(iv)
System:
Equation:
y
0
y1 = 0
v1 = 0
x > 0
y2 > 0
v2 = 0
x = 0
+
0
-
y
0
y1 > 0
v1 < 0
y2 = 0
v2 = 0
+
0
-
Ek1+ Wext = Ek2
+
0
-
Wext = Eg2 + Eth2
+
0
-

99
SPH4U: Transfers of Energy
Nobody really knows what energy is, but we do know how it behaves. Energy is
a quantity that can be transferred between systems and which can be used to
predict whether some event may occur. By carefully keeping track of where the
energy is located, or stored, we can construct equations to help with our predictions.
A: An Energetic Example
Your teacher has a ramp set up at the front of the class. A block is on top of a cart that will be released and glide down an
inclined track. The cart will collide with a barrier and stop. The block slides across another track until it comes to a stop.
Your challenge is to predict how far your block will slide along the bottom track surface.
1. Reason. There are three important events in this situation. Describe them here and label them on the diagram.
2. Reason. Which objects interact with the block? Which
interactions involve a transfer of energy?
To understand the role of energy in a problem, we need to choose a system, or a collection of objects, whose energies we will
track. We have a freedom to include any objects in our system and, if we do our work properly, everyone should always
agree on the final answer. If an interaction can easily be described using energy (e.g. gravity), include those objects in your
system. If an interaction is more easily described using work (e.g. applied, tension), make one object external. Friction effects
involving transfers to thermal energy are best described as internal energy that is shared between system objects (they each
get warmer). If this is the case, we will keep objects like the ground surface, roads, and tracks inside the system.
3. Reason. Based on the advice above, chose your system. Draw an energy-flow
diagram for the system between moments 1 and 2. Do the same for moments 2
and 3.
System12 = System23 =
The law of the conservation of energy states that the total energy of a system remains constant unless energy flows into or out
of the system. This flow of energy can be due to the work done by an external force. The total energy of the system and its
changes may be expressed by a work-energy equation: ET1 + Wext = ET2.
4. Reason. What is a convenient position for the vertical origin in the situation? Explain how you chose it and label it in the
diagram above.
5. Represent. Complete a work-energy bar chart for
moments 1 and 2. Complete a work-energy bar chart for
moments 2 and 3.
Recorder: __________________
Manager: __________________
Speaker: _________________ 0 1 2 3 4 5
+y
Ek1 + Eg1 + Wext = Ek2 + Eg2
+
0
-
© C. Meyer 2015
Ek2 Eg2 Wext Ek3 Eg3 Eint
+
0
-
ET2 + Wext = ET3
1-2 2-3
ET1 + Wext = ET2

100
6. Represent. The bar charts help you to write the work-energy equations for the system comparing the two moments in
time. Do this using the same symbols as in the chart.
7. Explain. When you practice problems like this in your homework, part C asks for a word explanation. Let’s practice:
describe the motion of the system and use energy transfers and work to explain why it moves the way it does.
To find the amount of thermal energy (which we are calling Eint) due to the sliding block, we need to use the definition of
work to create a simplified equation. W = |F||d|cos. When an object is sliding, the angle between Ff and d is 180o. This
gives W = -Ff d. The amount of thermal energy should be a positive number so we create the equation: Eth = Ff d. We do
not know how much thermal energy is stored in the block or the surface, which is why we include the surface in our system.
8. Measure. Choose a block for your group. Make the measurements you think will be necessary to find all the energies.
Record these in your diagram above with uncertainties.
9. Predict. Use your work-energy equations to predict the sliding distance of the block. Write this up as you would part D
of your homework solutions. (Hint: only substitute in your final step!)
D: Mathematical Representation Describe steps, complete equations, algebraically isolate, substitutions with units, final statement with 20% uncertainty.
10. Evaluate. Is your answer reasonable? Explain why you think so before you test it!
11. Test. Ask your teacher to watch you test your prediction. Does it agree with your prediction? Explain.

101
SPH4U: The Ballistic Pendulum
Here’s a problem for you: how can you determine the speed of a bullet using
only measurements of mass and distance? The answer was found in 1742 by the
English mathematician Benjamin Robbins using his invention, the ballistic
pendulum. Now it’s your turn to repeat his clever work – but since guns are frowned upon in schools, you will launch a blob
of play-doh at our ballistic pendulum.
A: Pictorial Representation Sketch with “before” and “after”, coordinate system, label givens & unknowns, conversions, events
B: Physics Representation Energy / momentum bar chart, flow diagram, events
C: Word Representation Describe motion, energy / momentum transfers, assumptions
Moments 1-2:
Moments 2-3:
Recorder: __________________
Manager: __________________
Speaker: _________________ 0 1 2 3 4 5
pA1 + pB1 + J = pA2 + pB2
+
0
-
Ek2 +Eg2 + Wext = Ek3 + Eg3
+
0
-
© C. Meyer, 2014
Measurements: Do
these later.
Hint: There are three
important events in this
problem (not including
the throw). You may
assume that its velocity
does not change much
while traveling through
the air.
1-2 2-3
Ek1+ Eg1 + Wext = Ek2 + Eg2 +Eint
+
0
-

102
D: Mathematical Representation Describe steps, complete equations, algebraically isolate, substitutions with units, final statement
E: Evaluation Answer has reasonable size, direction and units?
Now try out the pendulum
and make your
measurements. Record
these values in your sketch
for part A.
Hint: Make sure you
consider the geometry of
the swing carefully!

103
SPH4U: Spring Force and Energy
How does the force exerted by a spring change as we stretch it? How much
energy is stored in the spring? In this investigation we will find out.
A: Force and Springs
A few things about springs: Don’t overstretch springs – they can be permanently deformed and damaged. The position of the
end of a spring experiencing no other forces, whether oriented horizontally or vertically, is called the equilibrium position.
Physics springs have no mass.
1. Explain. There is an important difference between the length of a spring and the amount of stretch. Explain this
difference. Which one are you being asked to use?
2. Explain. Describe an experiment to determine how the size of the spring force is affected by the amount of stretch
in a spring. Which quantity is the dependent one? A good experiment will feature many data points to reduce
uncertainties and use consistent intervals to help find patterns.
3. Represent. Draw a sketch of your experiment showing the measurements involved.
4. Observe. Conduct your experiment and make your measurements.
5. Represent. Plot a graph that shows the relationship between your variables.
6. Analyze. Does the data suggest a linear or curved pattern? Use appropriate techniques to analyze the relationship in the
graph. (Always show units!)
7. Represent. Construct an equation using the symbols Fe (the elastic force the spring exerts), Δx (the stretch of the spring),
and k the spring constant (your slope) based on your graphical analysis.
Recorder: __________________
Manager: __________________
Speaker: _________________ 0 1 2 3 4 5
© C. Meyer, 2014

104
8. Predict and Test. A mystery object is at the front of the class. You may only use your spring and meter stick to
determine the mass of the mystery object with an uncertainty. Check your result with your teacher.
9. Interpret. What does the value of the spring constant, k, tell us about the spring itself? What would a large value
indicate? What would a small value indicate? Write your k value on a whiteboard.
The relationship found above was first discovered by Robert Hooke around 1660. Within a certain range of stretch or
compression most springs behave according to Hooke’s Law. Note that the direction of the force the spring exerts is opposite
to the direction of the stretch it experiences.
Vector version: Magnitude only:
B: Energy and Springs
1. Reason. Why do we believe there is a flow of energy when you stretched the spring during your
experiment in part A? Represent this flow with an energy flow diagram.
2. Reason. Isaac has a problem. He wants to calculate the amount of work he did while stretching his spring from 0 to 30
cm. “The force was 4.5 N when it was stretched to 30 cm. I can find the work I did by: W = FΔx = (4.5 N)(0.30m) =
1.35 J” . Emmy says, “I’m not sure, I think your answer will be too high.” Who do you agree with? Why?
3. Reason. The work calculation Isaac suggested can be represented as an area on a force-
displacement graph. What area would this be? Shade Isaac’s area on the graph to the right.
4. Reason. To correctly calculate the work done (Isaac was wrong!), what area on the force-
displacement graph would best represent the work done? Shade your area and calculate the
work value.
** check your answer with your teacher **
4.5
N
30 cm
4.5
N
30 cm

105
Work can be found by calculating the area under a force-displacement graph. This is especially helpful for forces that change
magnitude.
5. Calculate. Complete the chart below.
Calculate the work done during each
increment of stretch based on your force data
from earlier.
6. Represent. Complete a graph of the total work vs.
displacement. What type of pattern does the data
suggest? Linear or a curve?
7. Speculate. Let’s find the work done for any spring that has been stretched by an amount Δx and has a spring constant k.
Write an equation that relates W, Δx and k. Hint: Consider how you computed the area to get the work.
** check your result with your teacher **
Elastic energy stored in a spring:
Ee =
Displacement
(stretch) from
equilibrium (m)
Force (N) Total work done by
your hand (J)
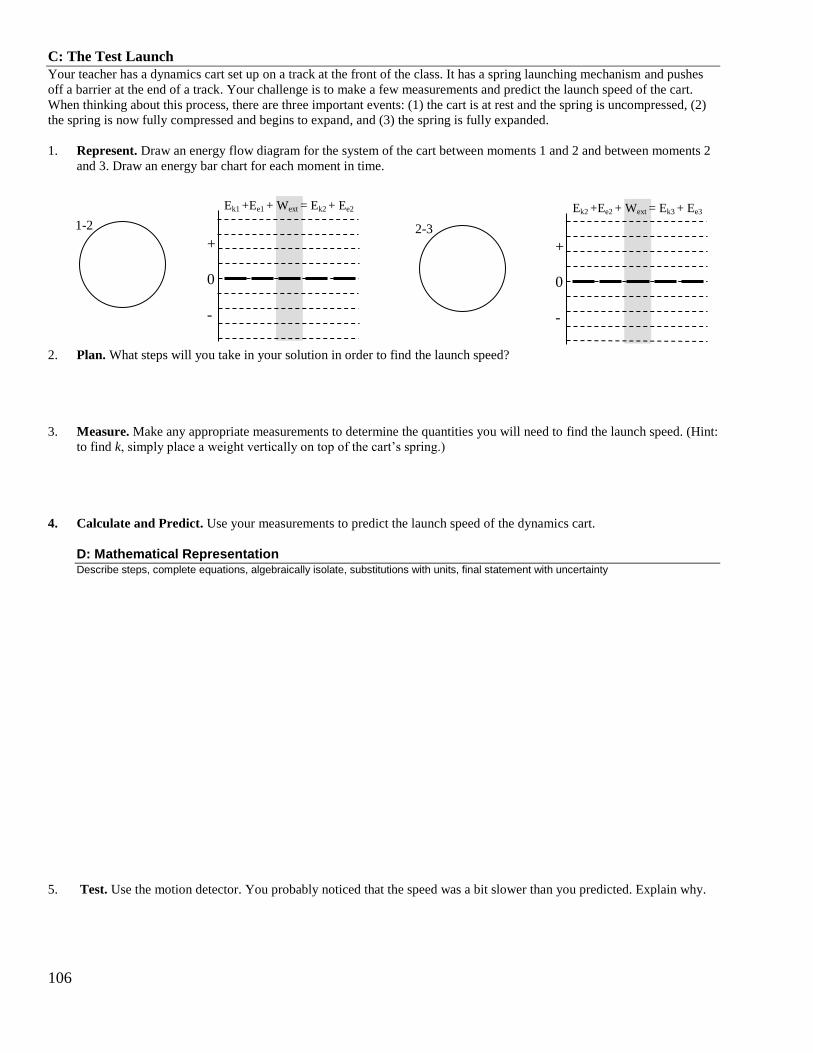
106
C: The Test Launch
Your teacher has a dynamics cart set up on a track at the front of the class. It has a spring launching mechanism and pushes
off a barrier at the end of a track. Your challenge is to make a few measurements and predict the launch speed of the cart.
When thinking about this process, there are three important events: (1) the cart is at rest and the spring is uncompressed, (2)
the spring is now fully compressed and begins to expand, and (3) the spring is fully expanded.
1. Represent. Draw an energy flow diagram for the system of the cart between moments 1 and 2 and between moments 2
and 3. Draw an energy bar chart for each moment in time.
2. Plan. What steps will you take in your solution in order to find the launch speed?
3. Measure. Make any appropriate measurements to determine the quantities you will need to find the launch speed. (Hint:
to find k, simply place a weight vertically on top of the cart’s spring.)
4. Calculate and Predict. Use your measurements to predict the launch speed of the dynamics cart.
D: Mathematical Representation Describe steps, complete equations, algebraically isolate, substitutions with units, final statement with uncertainty
5. Test. Use the motion detector. You probably noticed that the speed was a bit slower than you predicted. Explain why.
1-2 2-3
Ek1 +Ee1 + Wext = Ek2 + Ee2
+
0
-
Ek2 +Ee2 + Wext = Ek3 + Ee3
+
0
-

107
SPH4U: Velocity and Frames of Reference
All physics quantities that we measure depend on the frame of reference of the
observer. Alice is standing on the Earth and watches a train go by with a velocity of
150 km/h [E]. Inside the train stands Bob. Both Alice and Bob are physicists and
make observations about each other’s motion.
1. Complete the chart showing the measured velocity of each object from each reference frame.
Object Frame A (Alice) Frame B (Bob)
Alice
Bob
Earth
Train
2. Bob has a ball and throws it. He measures the velocity of the ball to be 40 km/h [E]. The train keeps going at its usual
speed. Complete the chart showing the measured velocity of the ball from each reference frame. Explain how you found
the velocity of the ball relative to frame A.
Object Frame A (Alice) Frame B (Bob)
Ball
3. Bob throws a second ball and measures the velocity to be 30 km/h [W]. Complete the chart showing the measured
velocity of the ball from each reference frame. Explain how you found the velocity of the ball relative to frame A.
Object Frame A (Alice) Frame B (Bob)
Ball
4. Bob pulls out a flashlight, points it east and turns it on. Using a fancy apparatus he measures the velocity of a particle of
light from his flashlight to be 300 000 000 m/s [E]. Using the previous logic, what is the velocity of the light relative to
Frame A in m/s?
5. Imagine Bob was on an “express” train that travelled at 2 x 10⁸ m/s [E] and turned on his flashlight just as in question 4.
What is the velocity of the light relative to Frame A?
6. Alice now has her flashlight turned on and points it east. Bob’s same express train passes by. What is the velocity of the
light from Alice’s flashlight according to Bob?
B
A
B
A
Recorder: __________________
Manager: __________________
Speaker: _________________ 0 1 2 3 4 5
© C. Meyer, 2012

108
SPH4U: Relativity Problems 1. A cosmic ray (a muon) enters Earth’s atmosphere 60 km above Earth’s surface. It reaches a detector on the ground after
travelling 400 µs (10-6
s) in the atmosphere, as measured by experimenters on the ground. How long does the journey
take according to the muon?
2. You and your friends here on Earth are watching a live video showing a clock onboard a fast moving rocket (more
popular than fireplace videos). At one moment the clock in the video reads 10:23 am and at another moment it reads
10:29 am. You noticed that 12 minutes elapsed on your own clock. What speed was the rocket moving at?
3. An astronaut travels to a star system 4.5 ly away at a speed of 0.9 c. Assume the times needed to speed up and slow
down are negligible.
(a) How long does the journey take according to Mission Control on Earth?
(b) How long does the journey take according to the astronaut?
4. An astronaut travel on a journey to a distant star, leaving Earth at the age of 46 years and arriving at the star when she is
61 years old. Scientists at mission control on Earth measured that the trip takes 120. What was the speed of the rocket?
5. Jill claims that her new rocket is 100 m long. As she flies past your house, you measure the rocket’s length and find that
it is only 80 m. Should Jill be cited for exceeding the 0.5c speed limit?
6. A muon travels 60 km through the atmosphere at a speed of 0.9997c. According to the muon, how thick is the
atmosphere?
7. Our Milky Way galaxy is 100,000 ly in diameter. A spaceship crossing the galaxy measures the galaxy’s diameter to be a
mere 100ly.
(a) What is the speed of the spaceship relative to the galaxy?
(b) How long is the crossing time as measured in the galaxy’s frame of reference?
8. What are the kinetic energy, the rest energy and the total energy of a 1.0 g particle with a speed of 0.8c?
9. At what speed is a particle’s kinetic energy twice its rest energy?
10. In an attempt to reduce the extraordinarily long travel times for voyaging to distant stars, some people have suggested
travelling close to the speed of light. Suppose you wish to visit the red giant start Betelgeuse, which is 430 ly away, and
that you want your 20 000 kg rocket to move so fast (0.999c) that you age only 20 years during the journey.
(a) What is the distance between Earth and Betelgeuse according to an observer in the rocket?
(b) How much energy is needed to accelerate the rocket to this speed?
(c) Compare this amount of energy to the total used by the United States in the year 2010, which was roughly 1.0x10²⁰
J.
11. The nuclear reaction that powers the sun is the fusion of four protons (1.673x10⁻²⁷
kg) into a helium nucleus (6.645x10⁻²⁷
kg). The process involves several steps, but the net reaction is simply: 4p He + energy. How much energy is released
overall in each fusion process? Give your answer in J and MeV.
12. Consider the inelastic collision e- + e
- e
- + e
+ + e
- + e
+ in which an electron-positron pair is produced in a head-on
collision between two electrons moving in opposite directions at the same speed.
(a) What is the minimum kinetic energy each electron must have to allow this process to occur?
(b) What is the speed of an electron with this energy?
1. 347 µs
2. 0.866c
3. (a) 5 yr, (b) 2.18 yr
4. 0.965c
5. Yes
6. 1.47 km
7. (a) 0.9999995c, (b)100 000.05 yr
8. 5.99x10¹³
J, 8.99x10¹³
J, 1.50x10¹⁴
J
9. 0.943c
10. (a) 19.98 ly (b) 1.25x10²²
J, (c) 125 times greater!
11. 4.22x10¹²
J, 26.4 MeV
12. (a) 8.19x10⁻¹⁴
J, (b) 0.866c
From R. Knight, Physics for Scientists and Engineers. A Strategic Approach. Pearson Education, 2013

109
SPH4U: Time and Space
Einstein thought deeply about the train scenario we studied last class and
suggested two ideas that change our understanding of what happens when Bob
turns on his flashlight. Einstein postulated that:
(1) All observers, whether they are moving fast or slow in an inertial frame will observe light to travel at c = 2.998 x 10⁸ m/s
in vacuum, and
(2) the laws of physics are the same for all inertial frames – there are no special rules if you are moving fast or slow.
These suggestions are known as the two postulates of special relativity.
A: The World According to Bob
Bob is travelling in a spacecraft at a velocity v relative to the earth. He is carrying with him a light clock – a special kind of
clock imagined by Einstein. The clock consists of two perfect, smooth mirrors that face each other and are separated by a
small distance ∆d. A particle of light (a photon) reflects back and forth between the mirrors which are lined up carefully so
that the photon always reflects off the same two points on the mirror’s surface. Alice is standing on the Earth watching Bob
and his clock travel by. Both Bob and Alice have a special stopwatch which they use as they observe two events take place:
event 1where the photon leaves the bottom mirror of the light clock and event 2 where the photon reaches
the top mirror.
1. Reason. Use the symbols from the description of this situation to help complete the chart of
measurements from Bob’s frame of reference.
2. Represent. Construct an equation that relates the speed of the photon to the distance and time it travels as measured in
Bob’s frame.
B: The World According to Alice
Alice is standing on Earth watching Bob and his light clock travel by in the rocket ship. She is able to make careful
measurements of the light clock and its photon.
1. Represent. From Alice’s frame, we see the light clock at three moments in time corresponding to three events: the
photon at 1, the photon at 2 and then the photon returning to the bottom mirror. You may assume the rocket is travelling
quite fast! Draw the path of the photon through space. Label the distance between events 1 and 2 as ∆D.
2. Reason. Complete the chart of
measurements from Alice’s
frame of reference. No
calculations are required!
Time interval between events1and2 (one tick) ∆to
Velocity of the light clock
Distance between events1and2
Speed of the photon
Time interval between events 1 and 2 (one tick) ∆t
Velocity of the light clock
Distance between events 1 and 2
Speed of the photon
B
A
+x
2
1
∆d
Recorder: __________________
Manager: __________________
Speaker: _________________ 0 1 2 3 4 5
© C. Meyer, 2015

110
3. Represent. Construct an equation that relates the speed of the photon to the distance and time it travels as measured in
Alice’s frame.
4. Reason. Compare the size of the results from the two frames of reference.
Note that both observers must
agree on the speed of light
according to the first postulate of
special relativity.
5. Speculate. What does your comparison imply about the flow of time on the spacecraft according to Alice?
C: Time Dilation
A direct consequence of Einstein’s two postulates is that the time interval between two ticks of a clock is shortest when the
clock is at rest relative to an observer. This is not an optical illusion, a delay effect, or a mechanical defect of the clock. The
flow of time actually depends on who is observing and their speed. This idea is called time dilation. To help carefully
describe time intervals we introduce two definitions:
Proper time (∆to): The time interval between two events that occur at the same position in space.
Relativistic time (∆t): The time interval between two events that occur at two different positions in space.
The relativistic time interval will always be greater than the proper time interval (∆t > ∆to) as long as there is relative motion
of the two observers. Each observer (and you too!) needs to decide every time, whether the time interval you are studying is
proper or relativistic according to their own frame of reference. Gone are your days of innocence when time intervals were
just time intervals!
1. Explain. Imagine Alice now has a toaster. She puts in a piece of bread and starts the toaster. Bob travels by in his rocket
and measures the time interval for toasting the toast. Alice also measures this time interval. What are the two events
Alice and Bob use to start and stop their clocks? Use these events to explain what type of time interval each is
measuring.
2. Explain. Bob is still traveling on the rocket and is getting hungry. He makes his dinner which takes 17 minutes
according to his measurements. According to Alice, it takes Bob 31 minutes to make his dinner. Explain in two different
ways what type of time interval each of them measures.
The two different time intervals (as measured in different frames) between the same pair of events do not lead to any kind of
logical contradiction. A contradiction in physics only occurs when two observers in the same frame of reference get different
results. Measurements of the same events by different observers in a single reference frame should agree with one another.
This is what we have been assuming all along in our study of physics!
Measurement Comparison
Speed of photon
Distance between 1 and 2 (∆d vs. ∆D)
Time interval between 1 and 2 (∆t vs. ∆to)

111
D: The Flight of the Muon – Ruler’s Frame
Consider a subatomic particle called the muon () which is moving rapidly at a speed v relative to a ruler in the direction of
the ruler’s length. We note two events: event 1 when the muon is at the 0 centimeter mark, and event 2 when the muon is at
30 centimeter mark. You need a ruler, an eraser (muon), and a thumb as your pretend stopwatch for this investigation.
1. Represent. Act out this situation from the frame of reference of the ruler. Pretend to use a stopwatch. Say out loud, “1”
and “2” when events 1 and 2 occur. Demonstrate this for your teacher. Sketch this situation and label the two events.
Indicate the velocity of the muon v and the distance the muon travels between the two events ∆xo.
2. Explain. An observer in the ruler’s frame of reference measures the time interval between the two events. Act this out by
showing when you start and stop your pretend stopwatch. Carefully explain what type of time interval this is. What
symbol should you use to represent it?
3. Represent. Write an equation that relates speed, distance and time of the muon as measured by an observer in the ruler’s
frame.
E: The Flight of the Ruler – Muon’s Frame
1. Represent. Act out this situation from the frame of reference of the muon. Say out loud, “1” and “2” when events 1 and
2 occur. Demonstrate this for your teacher. Sketch this situation and label the two events – clearly show that the ruler
has moved! Indicate the velocity of the ruler v and the distance the ruler travels between events 1 and 2.
2. Reason. An observer in the muon’s frame of reference measures the time interval between the two events 1 and 2. Act
this out by showing when you start and stop your pretend stopwatch. Carefully explain what type of time interval this is.
What symbol should you use to represent it?
3. Represent. What distance does the ruler travel in this frame of reference? Label this as x on the diagram.
4. Represent. Write an equation that relates speed, distance and time for the ruler as measured by an observer in the
muon’s frame.
5. Reason. Compare the size of the results from each frame.
Speed of muon / ruler
Time between events 1 and 2
Distance muon / ruler travels
6. Reason. What can we conclude about the distance measurement of each observer?

112
F: Length Contraction
The second consequence of Einstein’s two postulates is that the spatial interval between two events (the distance) also
depends on the observer! Moving objects (or intervals of space) become smaller along their direction of motion. This is
called length contraction. This is not an optical illusion – space itself (even if it’s empty) contracts. So a ruler moving
towards us contracts. If we travel past Earth, the space between Earth and the moon will contract. We define two different
types of distances or lengths.
Proper length (xo): The distance between two points (ends of an object, positions in space) that are at rest relative to an
observer.
Relativistic length (x): The distance between two points (ends of an object, positions in space) that are moving relative to
an observer.
The relativistic length is always smaller than the proper length (x < xo).
G: Homework
For questions 1-7 on page 104 of the handbook, decide on the type of time or distance interval in each situation. Justify your
determination.
1.
2.
3.
4.
5.
6.
7.

113
SPH4U: The Gamma Factor
A: Why Don’t We Notice?
The consequences of Einstein’s two postulates seem really crazy to us, largely
because we have never noticed these changes to time and length intervals. Why
have we never noticed time slowing down or lengths contracting for drivers on the 401?
To figure out how much larger the relativistic time interval is, we do a mathematical analysis of the light clock and carefully
compare ∆D with ∆d. If we do this (try it – it’s fun!) we get the time dilation equation:
∆t = ∆to, where the greek letter gamma () is the symbol we use for this relationship:2
1
2
2
1
c
v .
A quick calculation gives a related expression for relativistic lengths: x = xo/
In special relativity, it is usually helpful to convert velocities into units of c. For example, v = 1.5 x 10⁸ m/s = 0.5 c. When
you substitute the velocity this way into , the c’s divide out nicely and the math is much friendlier.
1. Calculate and Represent. Convert the first five speeds to units of c. Calculate for each speed. Sketch a graph of vs.
v.
In relativity we often encounter extreme numbers. We need to judge significant digits by the digits which are not zero for
(1.00007 has one useful digit), or which are not 9 for velocities in terms of c (0.9994c has one useful digit).
2. Explain. Should the first five values you calculate be exactly the same?
3. Explain. Based on the chart, offer a simple explanation for why relativistic effects are not noticed in daily life.
4. Describe. What happens to the size of as v approaches the value c?
Speed (m/s) Speed (c)
Fast Runners, 10 m/s
Fast Cars, 40 m/s
Fast Jets, 600 m/s
The Space Shuttle, 7 860 m/s Voyager Space Probe, 17 000 m/s
0.1 c
TV screen electrons 0.3 c
0.5 c
0.7 c
0.9 c
0.99 c
X-Ray Machine Electrons 0.999 c
LHC protons, 0.999 999 999 95 c
Recorder: __________________
Manager: __________________
Speaker: _________________ 0 1 2 3 4 5
| 0.2 c
| 0.4 c
| 0.6 c
| 0.8 c
| 1.0 c
5.0 —
10.0 —
15.0 —
20.0 —
0
© C. Meyer, 2015

114
5. Reason. What does this tell us about the flow of time for a highly relativistic object (speeds close to c)?
6. Apply. Relativistic effects are important for GPS satellites which orbit at a similar speed to the space shuttle relative to
the ground. Precision timing is absolutely essential for determining an object’s location on the earth. For a GPS satellite
observed from the earth, = 1.000 000 000 3.
a) Over the course of one day, how much time in seconds does the GPS clock gain or lose compared to a ground
clock? Watch your math!
b) How far does light travel during that time discrepancy? What would be the implication for the GPS system?
B: Relativity Problem Solving
A: Pictorial Representations
Draw a reference frame (x-y axis) to help illustrate the important events. (Usually one frame is enough)
Attach the given information to the frame in which that value was measured. Carefully label the intervals as proper or
relativistic.
Clearly illustrate the events and describe the events used to define the time intervals.
C: Word Representations
Describe the motion and what types of time or length intervals are involved.
E: Evaluate
Based on your understanding of relativistic or proper intervals, you should know if the results should be larger or
smaller.
Tips: (1) A convenient unit of distance is the light year: 1 ly = c a (speed of light year). (2)When possible, solve for and
calculate first.
1. Solve. An astronaut travels rapidly past Earth in a straight line. She notices the lights in Toronto turn on at night and then
off in the morning and measures the time interval to be 14.3 hours. In this time she measures that Earth moves 5x10⁹ m.
Complete the rest of part A below (or on a separate page) and then solve the problems: What is the speed of the earth?
What is the time interval between lights on and off as measured by a person in Toronto? (Note: we are not interested in
distances in this problem.)
A: Pictorial Representation Sketch, reference frames, label givens & unknowns with symbols, conversions, describe events
C: Word Representation Describe motion (no numbers), describe types of intervals
D: Mathematical Representation Describe steps, complete equations, algebraically isolate, substitutions with units, final statement
E: Evaluation Answer has reasonable size, direction and units? Why?
Astronaut’s Frame
1 = lights on 2 = lights off

115
SPH4U: Relativity and Energy
The consequences of Einstein’s bold suggestion, that the speed of light is
constant for all inertial reference frames, go far beyond just space and time –
they also extend to our notions of energy. Using a clever argument, Einstein created the world’s most famous equation:
E = mc2 where = (1-v
2/c
2)-½
This is usually written, for the general public, as Eo = mc2, where the “o” is carelessly left out! Sometimes physics ideas
stretch beyond our common sense and we begin to rely on equations to help us understand how our universe works. Let’s
explore this equation and try to figure out what it tells us about energy.
A: The Mass-Energy Relationship
1. Reason. Describe carefully how this energy depends on the speed of an object.
2. Reason. What type of energy depends on an object’s speed? What type of energy does Einstein’s equation keep track of?
3. Reason. According to the equation, how much energy does an object have when it is at rest? Explain how the equation
for E becomes the equation for Eo. Is Einstein’s equation still describing kinetic energy?
4. Reason. When at rest, what is the only characteristic of the object that could be changed and affect the amount of energy
Eo? What does this suggest about where this energy might be stored?
An object at rest possesses a form of energy called its rest energy, Eo, Einstein’s complete expression (E = mc2) gives the
total energy of the object, which always includes the rest energy and possibly some kinetic energy depending on the object’s
velocity. To the best of our knowledge, this equation is correct under all circumstances and replaces the ones we have
previously learned.
5. Represent. Write an expression that shows the relationship between E, Eo and Ek.
** check this with your teacher before moving on **
Recorder: __________________
Manager: __________________
Speaker: _________________ 0 1 2 3 4 5
© C. Meyer, 2015

116
B: Relativistic Energy
1. Explain. How can you use Einstein’s equation to find the kinetic energy?
2. Calculate. Consider a 1.0 kg block initially at rest. It experiences a force that eventually causes it to reach an impressive
speed of 0.6 c. Imagine we had learned nothing about relativity - determine the energies for the “Before Einstein”
column in the chart below. Use Einstein’s equation to help find the energies for the “After Einstein” column. Show your
work
Before Einstein (B. E.) After Einstein (A. E.)
Rest Energy zero
Kinetic Energy
Total Energy
3. Reason. The calculations above give two different results for the object’s energy. In science, if two different theories
give two different predictions, how to we decide which is correct?
4. Reason. Under what condition is the expression ½mv2 valid? What should we conclude about the limitations of the
traditional kinetic energy equation?
5. Represent. A powerful gun launched the 1.0 kg block described above. Complete
an energy bar chart for the system of the block before and after its launch.
Accelerating an object to speeds near that of light is extremely challenging and with our
current technology, we can only accomplish this for atoms and sub-atomic particles.
According to Newton, all we need to do is exert a steady force on something for long
enough and the uniform acceleration will eventually cause the object to reach 3.0 x 10⁸
m/s and our science fiction dreams will come true. According to Einstein, things are
different.
6. Reason. How much energy is required to bring the 1.0 kg block to the speed of light? Explain the mathematical
difficulty with performing this calculation. Is it possible for an object to reach or exceed the speed of light?
Eo1 + Ek1+ Wext = Eo2 + Ek2

117
This is the main reason why the latest and greatest particle accelerator, the Large Hadron Collider ($ 9 000 000 000), is such
a colossal engineering feat. A tremendous amount of energy is required to accelerate the collider’s protons to 0.999 999 991
c.
C: Particle Physics
1. Calculate. A proton is a very small particle with a mass of 1.673 x 10⁻²⁷
kg. How much energy is stored in the mass of
the particle?
Subatomic particles usually possess very small quantities of energy. A new unit is needed to conveniently notate these small
energy values. One electron volt (eV) is a unit of energy equivalent to 1.602 x 10⁻¹⁹
J.
2. Calculate. Find the proton’s rest mass energy in terms of MeV (106eV).
3. Explain. Physicists often write the mass of the proton as 938.3 MeV/c2. Use the rest-energy equation to help explain
why this is a valid unit for mass. Explain why these units make it easy to calculate the rest energy.
Is it possible to release the energy stored in a particle’s mass? You may have already studied the process of nuclear fusion or
fission in another course and have learned that, yes, this is possible. In a typical fusion reaction (like in the sun), a deuterium
particle (1876 MeV/c2) fuse with a tritium particle (2809 MeV/c
2) producing a helium nuclei (3729 MeV/c
2) and a neutron
(937 MeV/c2).
D + T He + n
4. Reason. How does the mass of the reactants compare with the mass of the products? What happened to the mass? What
does this imply about the conservation of mass? Speculate on a new, better conservation law.
5. Represent. An improved version of the reaction equation would include energy:
D + T He + n + light energy. Draw a energy bar chart showing how energy is
stored before and after the fusion process. Note that we are drawing one bar for
all the rest energy before or after the process.
6. Calculate. How much energy is released during the fusion process? Give your
answer in joules and electron volts.
The conversion of matter to energy can be total if a matter particle collides with a corresponding anti-
matter particle. This is the raison d’etre of the Large Hadron Collider: to collide protons and anti-
protons, which releases a tremendous amount of energy. This is also the physics behind the medical
imaging technique positron imaging tomography (PET scans), where an electron collides with a
positron (the anti-electron). In the case of the PET scan, radioactive materials are injected into the
blood stream of a patient. The decay process releases a positron (an anti-electron) which collides with
Eo1 + Wext = Eo2 + Elight
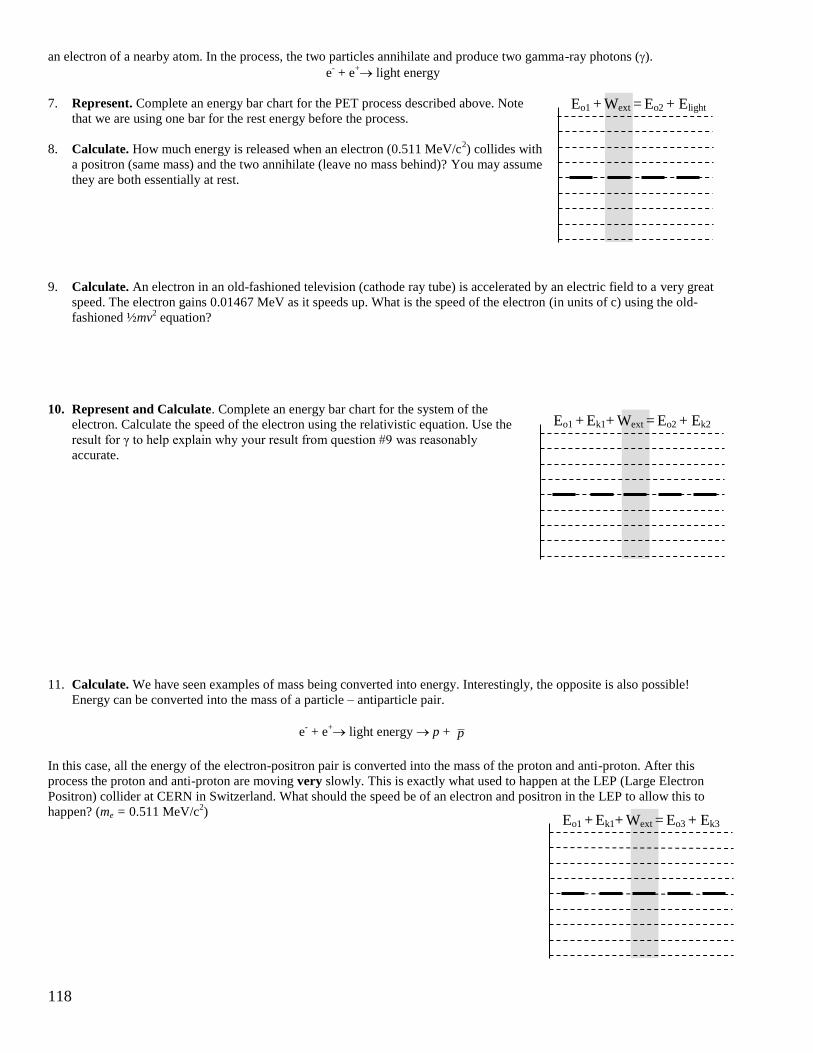
118
an electron of a nearby atom. In the process, the two particles annihilate and produce two gamma-ray photons ().
e- + e
+ light energy
7. Represent. Complete an energy bar chart for the PET process described above. Note
that we are using one bar for the rest energy before the process.
8. Calculate. How much energy is released when an electron (0.511 MeV/c2) collides with
a positron (same mass) and the two annihilate (leave no mass behind)? You may assume
they are both essentially at rest.
9. Calculate. An electron in an old-fashioned television (cathode ray tube) is accelerated by an electric field to a very great
speed. The electron gains 0.01467 MeV as it speeds up. What is the speed of the electron (in units of c) using the old-
fashioned ½mv2 equation?
10. Represent and Calculate. Complete an energy bar chart for the system of the
electron. Calculate the speed of the electron using the relativistic equation. Use the
result for γ to help explain why your result from question #9 was reasonably
accurate.
11. Calculate. We have seen examples of mass being converted into energy. Interestingly, the opposite is also possible!
Energy can be converted into the mass of a particle – antiparticle pair.
e- + e
+ light energy p + p
In this case, all the energy of the electron-positron pair is converted into the mass of the proton and anti-proton. After this
process the proton and anti-proton are moving very slowly. This is exactly what used to happen at the LEP (Large Electron
Positron) collider at CERN in Switzerland. What should the speed be of an electron and positron in the LEP to allow this to
happen? (me = 0.511 MeV/c2)
Eo1 + Ek1+ Wext = Eo2 + Ek2
Eo1 + Ek1+ Wext = Eo3 + Ek3
Eo1 + Wext = Eo2 + Elight

119
SPH4U: A New Kind of Interaction
A: Observe and Find a Pattern
You will need: 2 ebonite rods, a sheet of acetate and a watch glass. Carefully
balance one ebonite rod (rod A) on the watch glass. Keep it in place with a small ball of
tape – see the diagram to the right. Now you are ready to investigate how the ebonite rod
interacts with other materials.
1. Observe. Vigorously rub the objects as described below. Bring them close and look for an interaction. Sometimes the
watch glass gets stuck and needs a little tap. Record your observations. (Hint: all three are different!)
Rod A unrubbed Rod B unrubbed A:
Rod A rubbed with acetate Rod B rubbed with acetate B:
Rod A rubbed with acetate The acetate that rubbed rod A C:
2. Interpret. According to your observations, how do similarly charged objects interact? How do differently charged
objects interact? How to uncharged objects interact?
We model ordinary, uncharged matter as a substance consisting of very large, but equal, quantities of
positively and negatively charged particles. Careful physics experiments indicate that only the negatively
charged particles are able to move in solid materials. Therefore, when an object is rubbed, negatively
charged particles (the valence electrons) can either be added to or removed from the material. When a
valence electron leaves, the remaining atom (the ionic core) is positively charged. We can represent these
two parts (the electron and the ionic core) with charge-pairs represented by a positive and negative
charge. A charge diagram shows a selection of these many charge pairs in the material and illustrates
movement of the negative charges. Note that the pairs are drawn with the “+” and “-”symbols
overlapping. This indicates a neutral atom in the material.
Ordinary Matter
3. Reason. A student draws a charge diagram of the object shown above after is was rubbed on the left-hand side and
gained some negative charge. Explain the errors in the diagram and draw a correct
one.
4. Explain. Use the charge-pair model to explain the patterns observed in the previous experiment. Complete the charge
diagrams below to help illustrate situations B and C from question A#1 above. Draw a vector for the force each object
experiences. The ebonite rod exerts a stronger pull on electrons than the acetate.
Recorder: __________________
Manager: __________________
Speaker: __________________
0 1 2 3 4 5
A: neutral rod
B C
Rod A
Rod B
Rod A
Acetate
© C. Meyer, 2015

120
B: The Unrubbed Rod
1. Observe. Place a fresh, unrubbed rod (rod A) on the watch glass. Rub one end of another rod (rod B) with acetate. Bring
the rubbed end of rod B near rod A. Describe the interaction you observe.
The atoms and molecules in an insulator (ebonite, a plastic, is an insulator) hold electrons close to the atoms (including any
added electrons) and do not allow them to move freely throughout the material. When there is an electric interaction with
another object, the valence electrons of the insulator shift around the atoms in response, but don’t travel away from the
atomic nuclei. To show that the valence electrons shift and are still bound to the ionic cores, we draw a small circle around
the charge pair . We say that the material is now polarized (still neutral, but with a small separation of charges).
2. Explain. Why do the rods interact as you observed? Complete a charge diagram for each rod
during their interaction.
3. Predict and Test. You are curious to know what will happen if you rub rod B with acetate and bring the acetate near the
unrubbed rod. (If this doesn’t work, try rubbing the acetate on the table.)
Prediction
Explain your prediction + Draw charge diagram Observations
C: The Two Spheres
Your teacher has set up two Styrofoam spheres hanging side by side from the edge of a table. One sphere is covered with
aluminum foil.
1. Observe. Note: This experiment work best the first time – once the spheres touch the rod a new
effect takes place. Rub a rod with acetate. Very slowly bring the rod closer to both spheres. Try to
keep the rod parallel to the table edge. Describe the interaction between the spheres and the rod.
The electrons of conductors (the foil, a metal, is a conductor) are not bound to the atomic nuclei. The conduction electrons in
a metal are free to move any distance throughout the material. The conduction electrons repel one another, so they don’t all
bunch up in one location. Due to the mobility of the conduction electrons, a metal will become polarized when it interacts
with a charged object.
2. Explain. Why are the strengths of the interactions different? Draw charge diagrams showing these differences.
3. Reason. Based on your observations, which sphere was polarized the most strongly? What do we mean by saying
“polarized most strongly”?
+ −
sphere
before
Styrofoam
sphere
after
foil sphere
after

121
D: Party Time - Confetti
You are throwing a party for a friend and happen to have two kinds of confetti – the traditional paper kind and confetti made
from aluminum foil (you though it might be nice and sparkly). Since your friend is late, you decide to try an experiment. You
rub a rod with acetate and hold it close above a little pile of each type of confetti. Don’t do it yet! Complete the chart below.
The piles of confetti are set up at the front of the room.
Predict what you
will observe
Explain your prediction Do the experiment and
record your
observations
Revise your explanations, if
necessary
Pap
er C
on
fett
i
Alu
min
um
Co
nfe
tti
5. Explain. Explain in three steps what happens to the charges of an aluminum confetti particle during this experiment.
Draw a charge diagram and show the electrostatic forces for the rod and confetti particle in each step.
The confetti on the table before the rod
is charged.
The confetti travels upwards towards
the charged rod.
The confetti has touched the rod and is
travelling downwards
E: Apply Your Understanding!
1. Predict. What will happen if you place a charged rod near a falling stream of water from a tap? Explain your prediction
using a charge diagram for a droplet of water and rod. You may assume that the water droplet is neutral. Draw a second
illustration the path of the entire stream of water.
2. Test. Try it out and describe any changes that might be necessary to your explanation above.

122
SPH4U: A New Kind of Interaction Homework Name:
A: Annoying Sticky Packing Foam
Have you every unpacked a box that was filled with packing foam (small pieces of white Styrofoam)? If you have, you surely
noticed that these little pieces of foam easily stick to your hands, the box, walls and many other surfaces.
1. Represent and Explain. When the foam pellets are transported in a box, they rub against the box itself or the objects
inside and gain a net positive charge. Draw a charge diagram for the foam pellet before and after it was rubbed. Explain
the differences between the two diagrams.
Before After
2. Represent and Explain. In this situation, your hand behaves as an electrically neutral insulator. The charged foam pellet
sticks to your hand - even when you hold your hand horizontally, it sticks underneath. Draw a charge diagram for your
hand and the foam pellet while the pellet is stuck underneath your hand. Draw an interaction diagram and force diagram
for the system of the foam pellet (use the symbols e and Fe for the electrostatic interaction and forces). Explain what
happens to the charges in your hand.
Charge Diagram
Interaction Diagram Force Diagram
3. Calculate. You try to shake the foam pellet (0.5 g) off you hand. While doing this, your hand and the foam pellet
accelerate upwards (it stays attached!) at 12.9 m/s2. In this situation, the normal force is small enough to be ignored.
What is the size of the electrostatic force?
hand
pellet

123 Adapted from Van Heuvelen, Physics Union Mathematics, Rutgers University, 2010
SPH4U: The Strength of Electrostatic Interactions
In 1785 Charles Coulomb used a torsion balance to measure the force that one
charged sphere exerts on another charged sphere to find how the force between two
electrically charged objects depends on the magnitudes of the two charged objects
and on their separation. Coulomb could not measure the absolute magnitude of the electric
charge on the metal spheres. However, he could divide the charge in half by touching a charged
metal sphere with a third identical uncharged metal sphere.
A: Looking for Patterns
1. Explain the mechanism behind his method of dividing the charge and provide an illustration.
Why did he have to use metal spheres? Would plastic spheres work?
2. Look at the variables in the chart. Which quantity is the dependent variable? Which are the independent variables?
3. The table to the right provides data that resembles what
Coulomb might have collected. Let’s say you want to
find the data that demonstrate how the size of the force
is affected by the charge q2. Explain how you choose
this data from the table. Note that all the quantities are
measured in generic “units”.
4. Find patterns in the data and construct three graphs showing how size of the force is affected by the other quantities in
this experiment.
5. Describe how the strength of the electrostatic force depends on your chosen variables.
Experiment Charge
q1
Charge
q2
Distance
r
Force
Fq1 on q2
1 1 1 1 1
2 ½ 1 1 1/2
3 ¼ 1 1 ¼
4 1 ½ 1 ½
5 1 ¼ 1 ¼
6 ½ ½ 1 ¼
7 ¼ ¼ 1 1/16
8 1 1 2 ¼
9 1 1 3 1/9
10 1 1 4 1/16
1 – ¾ -- ½ -- ¼ --
Recorder: __________________
Manager: __________________
Speaker: __________________
0 1 2 3 4 5
1 – ¾ -- ½ -- ¼ --
1 – ¾ -- ½ -- ¼ --

124
B: Coulomb’s Law
Two point-like objects with a net charge exert a force upon one another along a line from the centre of one object to the
centre of the other. The magnitude of the electrostatic force that object 1, with electric charge q1, exerts on object 2, with
electric charge q2, when they are separated by a center-to-center distance r is given by the expression below. Note that this is
also the equal magnitude electric force that object 2, with electric charge q2, exerts on object 1, with electric charge q1:
2
21
1221 r
qqkFF qonqqonq
where k = 9.0 x 10⁹ Nm
2 /C
2. We assume that the objects are much smaller than their separation r (i.e. point-like objects).
The number of electric charge, q, is measured in units of coulombs (C) where 1 C = 6.24x10¹⁸
electrons or protons.
1. The diagrams show two charged objects and their separation. Rank the size of the force that the left object exerts on the
right object from the strongest to the weakest force. Explain how you made the ranking.
A B
C
Ranking:
Why:
A B
C
Ranking:
Why:
A B
C
Ranking:
Why:
A B
C
Ranking:
Why:
2. For each of the cases in the previous activity, compare the force that the left object exerts on the right object to the force
that the right object exerts on the left object. Explain how you know.
3. In each diagram below small charged particles are fixed on a grid. All particles have a charge which is a multiple of q.
Draw a force diagram particles A, B and C. Rank the magnitudes of the net electrostatic force experienced by particles
A, B and C. Perform a simplified calculation to help explain your ranking.
d
+2q +2q
d
+3q +q
d
+4q +q
d
-q -q
d
+q +q
d
+q -q
d
+q +q
2d
+q +q
½ d
+q +q
d
+q +q
2d
+2q +q
2d
+3q +q
+3q
2 +q
A
+q
1 +9q
B
+q
-2q +2q
C

125 Adapted from Van Heuvelen, Physics Union Mathematics, Rutgers University, 2010
SPH4U: Analyzing Electrostatic Forces
A: Gravity vs. Electricity – Fight!
1. Represent and Reason. Imagine two point-like charged objects of mass m1 and m2 that have electric charges q1 and q2,
respectively. Complete the table below that compares their electric and gravitational interactions.
What property of the
objects determines
whether they
participate in the
interaction?
What is the direction
of the force between
the interacting
objects?
Write an expression
for the magnitude of
the force that one
object exerts on the
other.
How does the
magnitude of the
force depend on
properties of
the objects?
How does the
magnitude of the
force depend on the
distance between the
objects?
Gra
vit
atio
nal
It is an attractive
force.
It is directly
proportional to the
masses m1 and m2.
Ele
ctri
c
The electric charge
determines whether
they will interact.
B: Combinations of Interactions
1. Represent and Reason. Two equal-mass stationary spheres are attached to a ceiling by two
strings, as shown at the right. The sphere on the left has an electric charge of +5C and the
sphere on the right has an electric charge of +1 C. Each string makes an angle less than 45o
with respect to the vertical. Fill in the tables below.
ID
FD – left sphere FD – right sphere
Which angle is bigger, θ1 or θ2? Explain. Write down the components for
the 2nd law for the right sphere.
Rank the FT, Fe, and Fg, from largest to
smallest. Explain.
Recorder: __________________
Manager: __________________
Speaker: __________________
0 1 2 3 4 5
+ +
θ1 θ2

126
2. Equation Jeopardy. A friend of yours has completed the “substitution with units” step of part D for a homework
problem. That step is shown below. Work backwards from this step to complete the parts of the solution in the chart
below.
xakgm
CC
m
CCCNm )0.4(
)0.3(
)100.3)(100.9(
)0.2(
)100.3)(100.2()/100.9(
2
54
2
54229
D: Mathematical Representations (algebraic
equation just before the substitution)
B: Physics Representations (FD) A: Pictorial Representations (sketch, label
givens & unknowns, coordinate system)
3. Reason. Three positive charges +Q are placed a distance, s, away from another positive
charge +q as shown below. Fe is the strength of the interaction between one charge +Q
and +q. Two students discuss the situation:
Albert: “In this situation the net force on the +q charge is three times Fe, since
there are now three positive charges exerting a force on it.”
Marie: “I don’t think so. The force from the +Q charge on the left will cancel the
force from the +Q charge on the right. The net electric force will be the same as the
force of one interaction.”
Emmy: “That doesn’t sound right. Maybe it’s something in between three times and
one times Fe.”
(a) Draw a force diagram for the charge q.
(b) Who do you agree with? Explain.
4. Apply. In the previous example the three identical charges were positioned such that there is a 45o angle between
adjacent force vectors in the force diagram above. Create a simplified expression for the net force experienced by the
charge +q using the symbol Fe.
Force Diagram

127
SPH4U: Picturing Electric Forces
One of the reasons why electrostatic forces seem so mysterious is that they have
an effect at a distance, without any objects being in contact. We are familiar with
one other force that also has this property.
One way of explaining how gravity can have an effect on objects far away is with the idea of a field. We say that the earth has
a gravitational field that extends throughout space and that the earth is the source of the field. The earth acts on distant
objects through its gravitational field.
A: In Search of the Electric Field
For this investigation you will need an electroscope, an ebonite rod, an acetate strip, and a piece of aluminum foil. An
electroscope can be used as an electric field detector. If there is a fairly strong electric field at the location of the metal sphere
atop the electroscope, the metal leaves inside will repel each other.
1. Observe. Charge the rod and move the electroscope in the region of space around the rod. Always be careful with the
glass electroscope. Don’t let the rod and sphere touch! Describe what you observe.
2. Reason. Based on your observations, where is the electric field in that region of space strongest? What happens to its
strength further away? What is the source of this field?
The sphere of the electroscope acts as a test particle in the rod’s electric field. A test particle is a small, point particle whose
charge is much less than that of the source. As a result, the presence of the test particle does not affect the field of the source.
3. Observe. Place the electroscope on a table and bring the charged rod nearby. Place the piece of paper between the rod
and sphere – don’t let them touch! Describe your observations. Next, place the aluminum foil between the rod and
sphere – don’t let them touch! Observe. What effect do different materials have on an electric field?
4. Apply. How would you protect sensitive electronics from unwanted electric fields?
5. Predict and Test. What would happen if there is aluminum foil around your cell phone? How many bars do you think
you will get? Try phoning the foiled phone. Describe your observations.
B: Picturing the Electric Field
1. Represent and Reason. For each situation pictured below, represent with arrows the gravitational force or the electric
force that a test particle would experience due to the sources at the points shown. In the study of electricity we will
always choose all test particles (test charges) to have a positive charge.
The planet Earth
An object with a large positive charge
An object with a large negative charge
Earth
● ●
● ● +
● ●
● ● -
● ●
● ●
Recorder: __________________
Manager: __________________
Speaker: __________________ 0 1 2 3 4 5

128 © C. Meyer, 2015
2. Reason. In the diagrams on the previous page, explain how you decided on the lengths of the vectors you drew.
A force field (a field representing forces) is a way of representing the force vectors from an interaction at every point in
space. This would require many, many vectors so instead we draw field lines. To do this we use a set of rules for
electrostatic (constant) fields:
(1) Any field line follows the “path” of the vectors. The vector is always tangent to the field line.
(2) Electrostatic field lines start at positively charged objects and end at negatively charged objects.
(3) The strength of the field at a point is represented by the density or concentration of the lines near that point.
(4) A corollary to this idea is that the number of lines leaving or terminating on a charged object is proportional to the
magnitude of its electric charge.
1. Interpret. The diagrams to the right show the field
vectors and field lines for a particle with charge +2q.
Use the dashed circles to explain how the field line
diagram shows regions of space with different strengths.
How does this agree with the field vector representation?
2. Represent. A new particle is presented with a charge of
–q. Explain how the field vector diagram and the field
line diagram will be different from the two in the
previous question. Draw these diagrams.
3. Apply. A region of space has a strange looking electric field as shown to the right. Note
that we do not know the location of the sources of this field. Four particles are placed in
the field. The particles have the same size of charge but different signs.
(a) Draw the force vectors experienced by each particle.
(b) Rank the size of the electric force each particle experiences. Explain your ranking in
terms of the field line density.
4. Reason. We replace particle C with a similar particle that has twice the charge. How would the size of the force acting
on particle C change? Explain.
Electric Field Vectors Electric Field Lines
Electric Field Vectors Electric Field Lines
● +
●
●
● ●
● ●
● ●
●
●
●
● ●
● ●
+
● -
●
●
● ●
● ●
● ●
●
●
●
● ●
● ●
-
A
B
D -
C -

129
SPH4U: The Field Concept
The idea of the field is fundamental to modern physics. An object or a system
of objects is the source of the field. An additional object, much smaller than
the sources, can be placed in the field without affecting the field. Depending
on the properties of the object, it may experience a force from the field due to the sources.
A: It Was a Windy Day
To help us get used to the ideas behind a field, we will think about an analogy with
wind. A very large, industrial strength fan creates a wind pattern as shown in the
diagram to the right. Someone holds a small kite at point A. Then the person holds a
larger kite at that same point. In both cases, the kite directly faces the fan and therefore
catches the wind.
1. Reason. In what sense is the wind stronger on the large kite than it is on the small
kite?
2. Reason. In what sense is the wind equally strong at both kites? What could you
measure about the wind to illustrate this point?
As a convenient catchphrase, let’s define the wind field as the strength and direction of the wind itself at a given point
(whether or not an object is held there). So, the wind field at point A stays the same whichever kite you put there; but that
same wind field produces a different wind force on kites of different sizes. Now you’ll figure out a way to define the wind
field more precisely.
3. Reason. The smaller kite has cross-sectional area 0.50 m2. When held at point A, it feels a wind force of 3.0 N. The
larger kite has exactly twice the cross-sectional area (1.0 m2) of the smaller kite. What wind force would you expect the
larger kite feel at point A? Explain.
4. Reason. Now a kite of cross-sectional area 2.0 m2 is held at point A. What wind force do you expect it to feel? Why?
Complete the chart showing all your results and describe the pattern.
5. Evaluate. Below are two possible mathematical definitions of a wind field. Which of these, if either, better captures the
pattern you found above? Comment on the validity of each one.
wind field = wind force cross-sectional area wind field = wind force cross-sectional area
6. Reason. Based on the better definition you found above, what are the units of the wind field?
Surface Area (m2) Force (N)
0.50 m2 3.0 N
1.0 m2
2.0 m2
Adapted 2015 by C. Meyer from Tutorials in Physics Sense-Making, University of Maryland Physics Education Research Group
Recorder: __________________
Manager: __________________
Speaker: __________________ 0 1 2 3 4 5

130
7. Summarize. Does the wind force depend on the fan, the kite, or both? What about the wind field? Explain.
** call your teacher over to check your results **
B: The Electric Field
We just saw that the wind field is the strength and direction of the wind, independent of whether the wind acts on anything.
In general, a field is the strength and direction of something, independent of whether that something acts on an object. Let’s
apply these ideas to electric fields.
A ebonite rod is given a positive charge by rubbing it with acetate. You hold a bead with a small
charge at point A. Then you pull it away and hold a bead with a larger charge at that same point.
1. Reason. When we place a bead with a greater charge at the same position near the rod it
experiences a greater “effect”. Does that “effect” correspond to a larger electric force, a larger
electric field, or both? What law explains this greater effect?
2. Reason. There is another sense in which both beads feel the same “electric effect” at point A. Does that sense
correspond to the same electric force, the same electric field, or both? Explain.
3. Reason. As we saw with kites, the property of an object that determines how much it responds to a given wind field is
its cross-sectional area. What property of an object determines how much it responds (how much force it feels) to a
given electric field?
4. Summarize. Does the electric field experienced by a bead at point A depend on the charge of the rod, the charge of the
bead or both? Explain.
The Field Assumption: When we work with fields, we will assume the charge of the source of the field is much greater than
the charge of the test particles we place in the field. If this assumption is valid, we can say that the source produces the field
and the field of the test particle is so small that it can be ignored. If this assumption is not valid, then we must consider
multiple charged objects as the sources of the field.
C: Defining the Electric Field
When held at point A, a bead of charge 2.0 nC (nanocoulombs, n = 10-9
) is repelled by the rod with a force of 0.1 N. The
charge on that bead is now doubled, to 4.0 nC, and the bead is again held at point A.
1. Reason. What force do you expect the bead now feels from the rod? Explain.
A

131
2. Reason. Now a bead of charge 5.0 nC is held at B. What electric force do you expect it feels from the rod?
3. Reason. So, the 2.0, 4.0, and 5.0 nC beads feel different electric forces at point B. But the electric field at B is the same
no matter which bead you hold there, just as the wind field at a given point in front of the fan doesn’t depend on which
kite you hold there. Is there some number having to do with electric force and bead charge that’s the same for all three
beads at point B and could therefore formalize the concept of electric field?
4. Reason. Let’s explore the meaning of the number and equation you just chose. What are the units of that number?
Explain what that number means, and why it corresponds to the notion of electric field.
5. Reason. You’ll now “translate” these concepts into an equation. Let E denote the electric field created by a rod or other
collection of charges; let q denote the charge of a bead or other particle placed in the field; and let F denote the electric
force felt by that particle. Write an equation relating E, q, and F.
** call your teacher to check your results **
5. Summarize. Now let’s compare three similar examples of fields: wind, gravitational and electric. Summarize the
comparisons in the chart below.
Wind Gravitational Electric
Property of an object that
determines how much force
it experiences.
Units of field
Definition of the Electric Field.
An electrostatic field describes the electrical effects throughout space of a charged source object S on a charged test particle
T. A test particle is any object whose electric charge is much smaller than that of the source. If this is true (qT << qS) then we
say that the source object creates the electric field and the test object does not affect that field.
The strength and direction of the electric field depend on only the charges of the source and the position in space. To measure
the electric field we need to use a charged test particle T. The value of the electrostatic field due to a source S at a point in
space (for example, 10 N/C) means that if we place test particle T at that position, it will experience 10 N of force for each
coulomb of its charge, qT.
Gr. 12 version: T
TSe
Sq
FE
Full Version: T
TSe
Sq
FE
Use the gr. 12 version of the equation to find the magnitude of the electric field. Use diagrams and your understanding of
fields to reason about the directions. Use a sign convention to show the directions, just like you do with forces, when using
Newton’s 2nd
law.

132
SPH4U: Field Concept Homework
You rub a balloon against your head giving the balloon a large negative charge of qballoon = -6.3x10⁻⁷
C. The balloon is now
the source for an electric field. Two positions in space are labeled: position X which is 5 cm away from the balloon and
position Y which is 10 cm away. We will use two different test particles to explore the balloon’s electric field. Particle 1 has
a charge q1 = +2.5 x 10⁻¹⁰
C and particle 2 has a charge of q2 = +5.0 x 10⁻¹⁰
C.
1. Represent. Draw a charge diagram for the balloon using
the illustration to the right.
2. Reason. We place particle 1 at position X as part of our
first experiment. Rewrite the equation for the electric
field:
T
TSe
Sq
FE
using the subscripts appropriate for the
objects in this situation. Explain how you decided which
charge goes in the denominator of this expression.
3. Calculate. At position X, we measure an electrostatic force of 1.8x10⁻⁵
N acting on particle 1. What is the size and
direction of the electric field particle 1 experiences at that point?
4. Reason. Next we place particle 2 at position X. How does the size of the electrostatic force on particle 2 compare with
particle 1? How does the size of the electric field particle 2 experiences at that point compare with particle 1?
5. Reason. Now we place particle 1 at position Y. How does the electrostatic force on particle 1 at position Y compare with
position X? How does the electric field strength at position Y compare with position X? Explain and be as precise as
possible.
6. Calculate. You place a new and mysterious test particle at position X and observe that it experiences an electrostatic
force of 2.1 x 10⁻⁵
N in a direction away from the balloon. What is the charge of this mysterious particle?
7. Reason. When the source of an electric field is spherical, or a point particle, we can find the strength of the electrostatic
interaction using Coulomb’s Law. Use Coulomb’s Law and the definition equation for electric fields to find a simplified
expression for the electric field strength around a spherical source object with charge qS using a test particle with charge
qT.
● X ● Y
© C. Meyer, 2015

133
SPH4U: The Superposition of Fields A: Two Sources and Only One Field, Ja!
This is a class demonstration that your teacher will lead.
1. Observe. (as a class) Rub the acetate against paper and hold the negatively charged acetate near the electroscope.
Remove the acetate and hold the paper near the electroscope. Describe your observations.
2. Reason. (as a group) Is there anything different about what’s happening to the charges inside the electroscope when the
acetate or paper is brought near? Explain.
3. Predict. (as a group) Your teacher will hold the freshly rubbed paper very close to the electroscope. Then, starting from
far away, slowly bring the acetate close. What will initially happen to the electroscope leaves as the acetate gets closer?
4. Observe and Reason. (as a class) Observe as the paper and then acetate are brought close to the electroscope. What can
we say about the combined effect of the two objects on the electroscope? What is the strength of the electric field at that
position in space? Explain.
Electric field vectors are related to electric force vectors (they are the force per unit charge). When there are multiple
sources, we can construct a type of force diagram for electric fields which shows the individual electric field vectors at a
point in space due to each source. Just like with forces, we can then find the total or net electric field: ...21 EEEnet
In
fact, we can work with field vectors using all the same techniques as force vectors (force diagrams, sign conventions, etc.)
5. Represent. The acetate and paper are positioned such that the electroscope leaves are vertical (not deflected). We
represent the acetate, paper and electroscope as point-like particles (or small spheres). (a) Complete the charge diagram
below for each object. (b) Draw a force diagram for a positive test particle in the electroscope. (c) Draw an electric field
vector diagram showing the electric field vectors of the two source objects at the position of the electroscope. (d) Write
a complete equation for the net force experienced by the test particle. (e) Write a complete expression for the net field
vector at the position of the test particle. What are these equations equal to?
Diagram Charge Diagram Force Diagram E-Field
Vector Diagram
Net Force Equation
Net Field Equation
** check with your teacher before continuing **
paper acetate
‘scope
acetate
‘scope
paper
Recorder: __________________
Manager: __________________
Speaker: __________________
0 1 2 3 4 5
© C. Meyer, 2014

134
B: Let’s See Opposites Attract
Imagine that we position two equal but opposite charges along a line.
This configuration is called an electric dipole.
1. Represent and Reason. Imagine we place a small test particle
with positive charge at each of the points shown to the right.
Draw a force diagram at each point for the electric field due to
the individual sources– simply estimate their magnitudes. With a
different colour, draw a vector to represent the net field at each
point (if you are familiar, use the parallelogram trick).
2. Predict. Review the rules for electric field lines. Use the net field
vectors you found to help construct the field lines for the two
charges on the grid below.
3. Observe. Use the applet: http://www.falstad.com/vector3de/
Select “dipole” for the field selection and select “Display: Field
Lines”. Make any changes to your prediction if necessary.
4. Apply. What are some realistic examples of systems with the
field of a dipole (think of chemistry examples!)
5. Predict. What will happen to the net electric field if the distance between the positive and negative charge becomes very
small (small enough we can’t notice it)? Explain your prediction.
6. Test. Test your prediction using the simulation. Gradually decrease the charge separation and describe what happens to
the total field. What is a realistic example of a system like this?
C: Charged Plates
Another important electrostatic field example is the field that exists between two parallel
metal plates that have opposite electric charges. Use the applet and set the field to “charged
plate pair”. Make the sheet size as large as possible and increase the field line density.
1. Observe. Draw the field lines. How do the directions of the field lines near the middle
of the plate compare with one another?
2. Interpret. An idealized field between two oppositely charged parallel plates
is uniform, as shown in the diagram to the right. This is the field we will
consider when working with parallel plates. Rank the strength of the field in
each indicated region. Explain your ranking.
+ - ●
●
●
● ●
●
● ●
+ -
top plate
Bottom plate
A
B C
-
+

135
SPH4U: Moving Charges in an Electrostatic Field
Aside from particles accelerating due to gravity, pretty much all other particle
motion that we experience can ultimately be explained (usually at a microscopic
level) by electric fields. This is especially important in the areas of molecular
biology and chemistry where electric fields rule the day and explain everything that happens.
The strength of the electric field (the total field) between two oppositely charged parallel plates depends on the voltage
applied across the plates and the distance between the plates. E = |V|/d
A: The Simplest Field
The simplest field to explore is a uniform electrostatic field like the one we came across last class. This type of field is a good
model for the fields present in old cathode ray tube TVs, in the massive particle accelerator at CERN, in simple wires
connected to a battery, or in ion channels through a cell membrane. Below is illustrated a pair of oppositely charged parallel
metal plates.
1. Interpret. Use the field lines to determine the sign of the charge on
the metal plates. Explain.
2. Reason. Emmy says, “I think the force on a particle at point 1 is stronger than the force on the same particle at point 3.
It’s closer to the top plate.” Marie says, “I think the forces at point 1 and 3 are the same.” How do the fields lines help
you to decide who is correct?
3. Reason. A positively-charged particle is placed at point 1. A negatively charged particle is placed at point 3. Explain
how you find the direction of the electric force experienced by each particle. Draw a force diagram for each particle.
4. Represent. A negatively charged particle is at rest at point 2 and is released. Draw a motion diagram for the particle
after its release. Explain how it moves and why.
5. Represent. A positively charged particle is launched downwards from point 1. It doesn’t hit the bottom. Draw a motion
diagram for the particle after its release. Describe the motion of the particle.
6. Represent. An electron is launched horizontally from point 3. Draw a motion diagram for the particle after its release.
Describe the motion of the particle.
* Check your results using your teacher’s simulation
Recorder: ________________
Manager: ________________
Speaker: ________________
0 1 2 3 4 5
1
4
2 3
© C. Meyer, 2014

136
7. Calculate. The separation between the two metal plates on the previous page is 7.3 cm. A high voltage power supply is
connected to the plates producing a voltage of 1.7x10³ V between the two plates. An electron, a proton and a neutron are
separately released at point 3 in the electric field. Determine the net force acting on each particle and its acceleration.
|qp|=|qe|=1.60x10⁻¹⁹
C, me = 9.91x10⁻³¹
kg, mp = mn = 1.67x10⁻²⁷
kg
D: Mathematical Representation Complete equations, describe steps, algebraic work, substitutions with units, final statement
8. Evaluate. In your work above, you probably ignored the force of gravity acting on the particles. Was this a valid
assumption? Provide a quick calculation to help justify your choice.
B: Electrostatic Field Summary
1. Describe. Where do electrostatic field lines start and end? Draw an illustration.
2. Describe. What particles do electric fields affect? Do they affect all particles?
3. Explain. You know the charge of a particle and the direction of the electric field. How do you find the direction of the
electric force acting on the particle? Draw an illustration.
4. Explain. When examining the picture of an electric field, how can we find the regions where the field is strong? Where
it is weak? Draw an illustration.

137
SPH4U: Magnetostatic Fields
Fields can describe the force of any interaction that has an effect throughout
space. Another force you have no doubt played with is magnetism. We need to
develop some new rules and ideas to describe magnetic effects. For example,
with magnetism we won’t use test particles we will use test-compasses!
A: Searching for a Field
You need a bar magnet and a compass.
A compass is a special device whose north end points in the direction of the magnetic field at that position in space.
1. Observe. Check that your compass works – it should jiggle at the slightest touch. Place the compass at each point in the
region around the bar magnet as shown below. Draw an arrow showing the magnetic field vector ( B
) at that position in
space.
2. Observe. Use the applet: http://falstad.com/vector3dm/. Set the field selection to “solenoid”. Set the display to “Field
Vectors” and then “Field Lines”. It may be easier to see if you choose “Show Y Slice”. We can’t examine the field inside
the bar magnet with a compass, but we can study it using a solenoid. A solenoid is a coil of wire whose field is very
similar to that of a bar magnet. Sketch the magnetic field lines around and inside the bar magnet. Add arrows to the field
lines to match your field vectors above.
3. Explain. Point out two regions where the field strength is particularly strong and weak. How can you tell?
Recorder: __________________
Manager: __________________
Speaker: __________________
0 1 2 3 4 5
© C. Meyer, 2014

138
B: The Birds and the Bees of Magnetism
You need an alligator wire, a compass and a 9V battery. WARNING: Never clip both ends of the wire to the battery – it will
overheat!
1. Observe. Clip only one end of the wire to the battery. Move the middle of the wire above the compass. Describe your
observations. Is there any evidence for a magnetic interaction between the compass and the wire?
Reminder: The conventional current flows from the positive terminal to the negative terminal of the battery. We can imagine
positive charges flowing through the wire in a direction opposite to that of the actual electron flow. We understand that it is
only electrons that flow in most electrical circuits, but we are stuck with using the conventional current for historical reasons.
2. Observe. Place the wire over the top of the compass such that it is parallel to the needle.
Briefly touch the second alligator clip to the other battery terminal – DO NOT CLIP IT ON!
Hold the wire in place only long enough for the needle to stabilize. Record your
observations. Illustrate the direction of the conventional current flow and the compass needle.
Is there any evidence for the existence of a new magnetic field?
3. Observe. Now hold the compass just above the wire. Repeat your observations.
Magnetic fields ( B
) are created by moving electric charges. Charges at rest (static charges) do not create magnetic fields.
To illustrate the motion of the charges and the magnetic fields, we need a new set of symbols. For a vector pointing out of a
page draw: For a vector pointing into a page draw:
4. Observe and Explain. Use the applet: http://falstad.com/vector3dm/. Set the field selection
to “current line”. Set the display to “Field Vectors”. Select “Show Z Slice”. Sketch a
sample of the field vectors around the wire. Is the current flowing into or out of the page?
Does this representation agree with your compass observations? Explain.
5. Observe. Now set the display to “field lines”. Sketch the field lines and the current in the
box to the right. Which way should the arrows on the field lines point? Now draw them!
The Right Hand Rule for the Magnetic Field of an Electric Current relates the motion of
positive charges (conventional current) and the magnetic field they create. When the thumb of
your right hand points in the direction of the conventional current, your fingers curl in the
direction of the magnetic field lines.
6. Predict Imagine the wire is oriented across our page as shown below. It is difficult to draw
the field lines from this point of view. We can simply show the direction of the field vectors
as they pass through the page surface. Explain whether the field lines will point
into or out of the page in the region around the wire.
7. Test. Switch back to field vectors and choose “Show X Slice”. You may need to
rotate the image to understand what you are seeing. Explain any differences with
your prediction. Draw field vectors illustrating your observations using and .
Field Vectors
Field Lines
wire current
Field Lines

139
SPH4U: Magnetic Forces on Charges
A: Charges at Rest
This is a class demonstration. We want to study the interaction between a
magnetic field and a charged object that is stationary. An electromagnet will
create the magnetic field and rubbing a balloon will create a static electric charge.
1. Observe. For each situation, record your observations in the chart below.
Charged balloon, magnet turned on Charged balloon, magnet current reversed Charged balloon, magnet turned off
2. Reason. Is there any evidence from your observations for the existence of a magnetic interaction between a charged
object at rest and a magnetic field? Justify your answer using your observations.
B: Charges on the Move
This is a class demonstration. We want to study the interaction between a magnetic field and moving charges. An
oscilloscope tube and high tension power supply will produce moving charges. A permanent magnet will provide the
magnetic field.
1. Observe. The bar magnet is held perpendicular to the beam with the north pole beside
the tube. To a good approximation the magnetic field points straight out from the end of
the bar magnet. Record your observations. Complete the diagram showing the velocity
of the current, the magnetic field and the force acting on the charges.
2. Observe. The bar magnet is held perpendicular to the beam with the north pole above the tube.
Record your observations and complete the diagram.
3. Observe. The bar magnet is held parallel to the tube with the north pole pointing towards
you. Record your observations and complete the diagram. Why do the field lines look so
different in this example?
4. Reason. (as a group) Two conditions must be met in order for magnetic fields to exert a force on a charged object. From
your observations in parts A and B, what are these two conditions?
The force that results from the movement of a charged object in a magnetic field is given by: sinBvqFm , where q and v
are the charge and speed of the object, B is the strength of the magnetic field the object is moving through and θ is the angle
between the magnetic field lines and the velocity. The direction of the force is determined by the Right Hand Rule for the
Magnetic Force on Positive Charges: The thumb points in the direction of the velocity of the charged object, the fingers in
the direction of the magnetic field lines. The palm of your hand points in the direction of the force on a positive charge. If the
object has a negative charge, just reverse you answer from the right-hand rule.
Recorder: __________________
Manager: __________________
Speaker: __________________
0 1 2 3 4 5
B v
B
v
B v
© C. Meyer, 2014

140
5. Reason. Use the equation for the magnetic force to verify your conditions from the previous question. Explain.
6. Predict. Use the right hand rule to predict how the beam will deflect when the bar magnet is held
perpendicular to the beam with the south pole on the left side of the tube. Draw a picture to
illustrate your prediction. We will try this out as a class. Move on for now.
C: The Motion of Charges in a Magnetic Field
Consider an electron traveling with an initial velocity v moving through a magnetic
field that is oriented into the page as shown to the right.
1. Reason. What is the direction of the force acting on the electron? Explain and
draw the force on the diagram.
2. Reason. A short moment later, where might the electron be located? Draw it and
its new velocity vector. At this later moment, what will the direction of the force
be? Draw this on the diagram. Explain.
3. Predict. Assume the electron never leaves the magnetic field. What will the complete path of the electron look like?
How will the directions of the velocity and force vectors compare? What type of motion results? Explain.
4. Reason. How much work does the magnetic field do on the electron? How does the electron’s speed and kinetic energy
change? Explain.
D: Bubbles, Tiny Bubbles
The image to the right shows the paths of particles
travelling through a bubble chamber, a chamber of
superheated fluid. A charged particle travelling through
the fluid causes a bubble to form. This leaves a bubble
trail behind the particle. A strong magnetic field passes
through the bubble chamber and is oriented out of the
page. The trails of five particles are labeled.
1. Apply. Indicate the charge of the particle that
produced each trail. Explain how you can tell.
2. Apply. Use Newton’s 2nd
law, radial acceleration, and
our new expression for magnetic force. Rank the
momentum of the particles that produced each trail.
Explain.
A
B
C D
E
prediction
● v
B

141
SPH4U: Electromagnetic Disturbances
We have studied both electro- and magneto-static fields up to this point. Now we
will combine these fields and begin to change them so they are no longer static.
Something truly remarkable happens.
A: The Physics of a Wire
Consider a wire connected between the negative and positive
terminals of a power supply. A steady current travels through the
wire. The diagram to the right illustrates this situation and shows two
sets of field lines.
1. Represent. Choose a colour to represent the conventional
current. Draw an arrow that represents the flow of conventional
current.
2. Represent and Explain. Choose a colour to represent the
electric field. Explain how you decide which lines are the electric
field lines. Label and colour code these lines. Add arrows
showing the direction of the field lines.
3. Represent and Explain. Choose a colour to represent the magnetic field. Explain how you decide (as if you haven’t
done question #2) which lines are the magnetic field lines.
B: A Closer Look
Now imagine that we zoom in to a small region of space located above the middle of the wire. The diagram below illustrates
this along with the electric and magnetic field lines. Note that one field points in or out of the page and is represented with
the circles.
1. Represent. Complete the diagram by: (a) labeling and colour
coding the electric and magnetic field lines and (b) showing the
direction of all the field lines and current
2. Reason. How do the directions of the electric and magnetic field
lines compare in this region of space?
3. Explain. A positive test charge is placed at rest in this region of space. In this investigation, we will ignore the effects
of the magnetic field since they are relatively small. What will happen to the positive charge which is initially is at
rest? Explain and draw vectors representing any forces.
Below is a third diagram showing the same region of space as above. But for this example, we have switched the polarity of
the power supply, reversing the positive and negative terminals shown in the first diagram.
- +
wire
Recorder: __________________
Manager: __________________
Speaker: _________________ 0 1 2 3 4 5
© C. Meyer, 2012

142
4. Represent and Explain. Complete the diagram as you did in
question #4. Describe the how the fields have changed due to the
reversed terminals.
5. Explain. What will happen to the positive test charge which is
initially at rest?
C: Shaking Things Up
Now imagine that we continuously vary the polarity of each terminal of the wire from positive to negative.
6. Reason. Describe the motion of the charges in the wire.
7. Reason. Describe the motion of the positive test charge as the polarity varies.
8. Observe. When the polarity of the wire changes, the fields don’t change everywhere immediately. They begin to change
closest to the wire and then spread outwards through space. Use the simulation: http://falstad.com/emwave1. Describe
what this changing pattern looks like.
9. Observe. Freeze the simulation. Static electric or magnetic fields drop off in a steady way at positions farther from the
sources. Is this happening in this situation? Explain.
An alternating current produces a changing pattern of electric and magnetic fields that spreads outwards from the wire
through space. In 1864, James Clerk Maxwell studied these phenomena in detail and mathematically described the wave-like
motion of these oscillating fields. From his calculations he determined the outwards speed of the rippling fields to be given
by:
Where k is Coulomb’s constant (k = 8.99 x 10⁹ Nm
2/C
2) and o is a similar constant for magnetism (o = 1.257 x 10
-6 Tm/A).
10. Predict. Determine the velocity of this wave including units (1A = 1C/s) (1T = 1 kg/Cs). What are the implications of
this result?
Rules for Electromagnetic Waves.
What we have discovered is an electromagnetic wave which works according to these ideas:
1) An EM wave is created by the acceleration of electrical charges (our varying current in this case).
2) An EM wave might cause a distant charged particle to acceleration if the properties of the wave match properties of the
particle.
3) When an EM wave accelerates a charged particle, some of the wave’s energy is absorbed which might stop the wave.
wire
o
kv
42

143
SPH4U: Understanding EM Waves
A genuine, real-life EM wave is very tricky to visualize – it has much more
detail than a simple water wave. To help us picture what takes place when an EM
wave travels through space we will use the line model of an EM wave.
A: The Line Model of an Electromagnetic Wave
To the rightis a screen capture from the
simulation we used in our previous
investigation. It represents a two-
dimensional slice in space and the field
values along that slice. To help us talk
about this image we will define the
vertical direction as the y-direction and the
x- and z-directions as the horizontal plane.
The wire is positioned along the y-axis
with its middle at the origin. This image
represents the field values in the xy-plane.
1. Represent. Imagine we draw a line along the x-axis starting at the surface
of the wire. Remember that the simulation does not show the field strength
using the arrow lengths. Sketch a graph of the electric field vs. position
along the +x-axis (the white line). Do the same for the magnetic field.
Upwards is positive for the E-field and outwards (red) is positive for the B-
field.
We can put these two graphs together and illustrate the field vectors to give us
the line model of an electromagnetic wave. This is a picture of the electric and
magnetic field vectors along one line through space at one moment in time. One
extraordinary feature of an EM wave is the fact that the amplitude of the peaks
decreases very, very little allowing EM waves to travel extremely far through
space - even across the entire universe!
2. Reason. Examine
the line model of an
EM wave shown to
the right. Rank the
magnitude of the
electric field at
points A, B, C and D
in space. Explain.
3. Reason. In what direction is the EM-wave propagating (travelling)? Draw an arrow on the diagram above.
4. Reason. How do the directions of the electric and magnetic fields compare with the direction of propagation?
5. Reason. An electron is located at point C in the diagram above and is at rest. In what direction will it experience a force?
Recorder: __________________
Manager: __________________
Speaker: _________________ 0 1 2 3 4 5
x
y
z
G G G R R R
+
E
-
+
B
-
x
x
A
B
C
E
B
D
© C. Meyer, 2015

144
In this example, we noticed that along the line through space that we chose, the electric field vectors point along one axis (the
y-axis in this case). An electromagnetic wave with its electric field vectors pointing along one axis in space is a linearly
polarized EM wave. We call the direction the electric field points in the direction of polarization of the EM wave.
B: Wave, Meet Conductor. Conductor, Meet Wave.
Imagine that the EM wave depicted above in question #2 is a radio wave. It is polarized in the y-direction. As it travels
outwards, it passes by a long, thin conducting wire that is oriented along the y-axis.
1. Reason. As the wave propagates (travels) past the wire, would the electric field due
to the radio wave cause the charges in the wire to move? If so, would the charges
move in a direction along the wire? Explain.
2. Reason. Imagine a very sensitive light bulb is connected to two halves of the same wire in the middle. The
bulb and wire are again placed in the path of the previous radio wave and with the wire oriented parallel to
the y-axis. Would the bulb glow? Explain.
3. Reason. Would it glow if the wire was oriented parallel to the z-axis? Explain.
4. Reason. Would it glow if the wire was oriented parallel to the x-axis? Explain.
An antenna is a conductor designed to capture the energy from an electromagnetic wave. The electric field of the wave causes
charges in the antenna to accelerate, transferring electromagnetic energy from the wave into kinetic energy of the moving
charges. An electric current is created or induced and this current can be used in an electric circuit to do many things! We say
the EM wave is the signal which is picked up by the antenna and used by the circuit. This is how a radio station signal, a
Bluetooth signal, a Wi-Fi signal, a TV signal, and a cellphone signal all work!
5. Predict. In order to best detect the oncoming radio wave (that is, to maximize the induced current in the circuit), how
should the antenna be oriented relative to the direction of polarization of the wave? Explain.
6. Test. Use the signal generator and oscilloscope set up at the front of the room to test your predictions. Describe your
observations and the results.
wire
wire
Adapted from McDermott and Shaffer, Tutorials in Introductory Physics. Prentice Hall, 2002

145
SPH4U: Polarization
When a light wave is received by our eyes, we cannot tell which direction the
electric field vectors point in – but some creatures can! Certain materials react
differently to electric or magnetic field vectors in different directions.
A: Through the Polarizing Glass
You will need a pair of polarizing filters. Be careful since some of them are glass!
1. Observe. Look at the room lights through one of the polarizing filters. Describe how the filter affects what you see. Does
rotating the filter have any effect?
2. Observe. Hold a second polarizing filter in front of the first, and look at the room lights again. Describe how the filter
affects the light you see. How does rotating one of the filters with respect to the other affect what you see?
A light beam is linearly polarized when the electric field vectors
throughout the beam point along a single axis. An unpolarized beam is
made up of many rays of light, each of which has the electric field
pointing in different, random directions.
The EM wave that is transmitted from a polarizing filter (or polarizer)
has its electric field vectors pointing parallel to the polarizer’s axis of
polarization. A polarizer absorbs the parts of an EM wave that have
electric field vectors perpendicular to the filter’s axis of polarization.
The axis of polarization is a property of the material the filter is made
from (usually long chains of plastic polymers). The axis is often
marked by a line on the filter. A polarization diagram represents the
direction of the E-field of the wave and the filter’s axis.
3. Interpret. Describe what is happening according to the polarization
diagram to the right. Compare the brightness of the light at moments 1
and 2.
4. Reason. Do the room lights produce polarized light? Explain how you can tell from your observations.
5. Represent. Draw a polarization diagram for the situation of minimum intensity you found using the room lights and two
filters. Describe the intensity of the light at each moment.
Recorder: __________________
Manager: __________________
Speaker: _________________ 0 1 2 3 4 5
y
z
E
x E
x
polarized beam unpolarized beam
y
z
filter with horizontal
axis of polarization
filter with vertical
axis of polarization
y
z
x 1E
2E
x

146
Front view
E vector
Incident
light
Polarizer
Side View
When two polarizers are oriented with respect to one another such that the light is at a minimum intensity, the polarizers
are said to be crossed and all the light has been absorbed.
6. Observe. What are other sources of polarized light from around the classroom or amongst your belongings?
7. Reason. Suppose that you had a polarizer with its direction of polarization marked. How could you use this polarizer to
determine the direction of polarization of another unmarked polarizer? Explain your reasoning.
8. Reason. A beam of polarized light is incident on a
polarizer, as shown in the side view diagram. The
direction of E-field of the light makes an angle
with respect to the polarizer’s direction of
polarization (see front view diagram). The
amplitude of the electric field of the incident light is
E1. Write an expression for the amplitude of the
transmitted component of the electric field, E2.
Represent this in a polarization diagram.
9. Predict. A beam of unpolarized light travels through a pair of crossed filters – no light is transmitted from the last filter.
What will happen when a third filter, whose axis of polarization makes a 45o angle with both filters, is placed between
two crossed filters? Draw a polarization diagram. Describe the light intensity. Test your prediction – we will also try this
as a class.
Adapted from McDermott and Shaffer, Tutorials in Introductory Physics. Prentice Hall, 2002
x
E
x
147
SPH4U: Exam Preparation
Careful preparation for an exam helps you demonstrate the understanding you
have gained through the hard work you have done during an entire course.
Effective preparation depends on knowing your own strengths and weaknesses,
using careful time management and employing the best studying strategies.
A: Know Thyself
Let’s begin by thinking about what you currently do to prepare for a typical test.
1. Reflect. (individually) How much time in total do you typically spend perparing for a physics test? When do you do your
preparations?
2. Reflect. (individually) When preparing for a test, what proportion of time do you spend on each of the following:
Summarization Reviewing homework solutions
Highlighting/ underlining Solving problems for practice
Rereading textbook or handbook sections Other:
3. Reason. (as a group) How effective have these strategies been for you? Rank the strategies listed above from most
effective (1) to least effective (6). Record your ranking in front of each description above. Provide a rationale explaing
why you think your top ranked and lowest ranked strategies are the best and worst for you.
B: Performance Anxiety
There are many occasions in life when we are faced with one shot at accomplishing a particular goal. Most people feel some
level of stress or anxiety when performing under pressure.
1. Reflect. Describe a few situations that don’t involve a test or exam in which you or other people you know have faced a
high pressure situation.
2. Reason. High performance athletes and professional musicians are examples of people who routhinely perform under
high pressure situations. How would such a person prepare in the days leading up to a crucial performance?
3. Reason. What strategies do you think a high-pressure performer uses during the performace itself to deal with stress and
anxiety?
Recorder: __________________
Manager: __________________
Speaker: _________________ 0 1 2 3 4 5

148
4. Reason. Describe some strategies you could realistically make use of for the upcoming exams.
C: Evaluating Study Strategies
Research has been done to measure the effectiveness of different strategies in student leaning and studying. Here are some
results from: Psychological Science in the Public Interest 14(1) 4–58
Technique Effectiveness Rationale
Highlighting
Low
Summarizing
Low
Rereading
Low
Self-explanation
(explain aspects of the
process to yourself while
studying)
Medium
Practice testing
(practicing your
understanding in a
testing situation)
High
Distributed Practice
(spreading practice over
a number of days)
High
1. Reason. In the chart above, provide a rationale for the rating of each technique.
2. Plan. Which techniques would you like to include in your upcoming exam preparations? Explain how you might
incorporate them.

149
SPH4U: Modeling 2-D Waves
A: Picturing Two-Dimensional Waves
So far when we have described light waves, we have
pictured waves travelling along a single line in space. But
let’s look at them another way now. We can draw pictures
resembling the surface of water. Consider the illustration
from the simulator www.falstad.com/ripple/. We can
easily sketch this wave by drawing lines of constant phase
such as crests or troughs. These represent the wave fronts
and in this example, the wave fronts are fairly straight
lines and are called planar waves.
To understand how a 2-D wave works, we use an idea proposed by Christian Huygens in 1690. The fundamental wave
motion is circular – imagine a pebble dropped in water and a circular wave rippling outwards. Huygens proposed that each
point along a wave front can be considered to be a point source of circular waves or wavelets. When these circular waves
travel outwards their wave fronts join together and form the future wave front of the present wave.
Use a penny and draw a dot
every penny radius along the
present wavefront. Be sure to
centre the penny at the two ends
as well! Next, trace the outline of
the penny when centred on each
dot. Form the future wavefront
by drawing a new surface
tangent to the foreword edges of the wavelet circles. You can smooth this out, understanding that there are many more
wavelets that we did not draw in between the ones we did.
1. Reason. What does the radius of the penny represent about the wave?
2. Represent. We will use
this technique to model
what happens when a wave
passes through the wide
opening. Find the next
three future wavefronts. Be
sure to use points at the
two ends of the previous
wavefront!
3. Represent. Now try a really narrow opening.
Construct the next three wave fronts.
4. Describe. What happens to the shape of the
original wavefront after it passes through an
opening?
past wavefront
present wavefront
Recorder: __________________
Manager: __________________
Speaker: _________________ 0 1 2 3 4 5
present wavefront
future wavefront
© C. Meyer, 2013
present wavefront

150
When a wave front changes shape as it travels through an opening or around a barrier we say it diffracts.
5. Observe. In which example above was the diffraction of the wave greatest (greatest change in shape)? Explain.
6. Reason. Compare the width of the opening with the wavelength. Speculate on the condition necessary for strong
diffraction to occur.
B: The Eye!
1. Represent. Back in gr. 10 you studied light
using the model of rays. Based on the ray
model, predict where light would strike the
retina of your eye. Decide what region would
be bright and what region would be dark. Do
the same based on your understanding of
wavefronts and diffraction.
2. Test. (as a class) Describe and sketch what happens to the light from a bulb at the front of the class as you gradually
close your eyes until there is only a tiny, tiny opening.
3. Test. Keep your eyes mostly closed. Describe what happens when you tilt your head.
C: Special Effects
1. Predict. This is not related directly to the eye, but what happens when a wave meets an obstacle? In particular we want
to study the region behind the obstacle. Find the next three wave fronts by making an educated guess (don’t worry about
the penny technique now).
2. Test. (as a class) Observe the results in the simulation. Describe what happens in the region behind the barrier.
Geometrical Optics (light as rays) Wave Optics (light as wavefronts)
rays
retina
wavefronts
past wavefront
present wavefront