Embed Size (px)
Citation preview

0
Spending Review 2018
Comparative Levels and Efficiency of Irish Public Spending
KEVIN MEANEY, VICTORIA OYEWOLE AND JACOPO BEDOGNI
CENTRAL EXPENDITURE POLICY SECTION
JULY 2018
This paper has been prepared by IGEES staff in the Department of Public Expenditure & Reform. The views presented in this paper do not represent the official views of the Department or the Minister for Public Expenditure and Reform.

1
Key Findings
1. Irelands expenditure comparisons are more volatile than other EA countries The volatility of economic output measurements, such as GDP and GNI*, are significantly
higher in Ireland than all the GDP figures of other countries in the sample. This makes it quite
difficult to compare expenditure and causes Ireland’s comparative position to vary significantly
over time.
2. Ireland’s overall spending is close to the Euro-Area average when age and GNI* are
accounted for
On first glance, spending as a percentage of GDP is well below EA norms. However, taking
account of certain differences between Ireland and other EA countries, this gap in spending
tends to shrink. Firstly, using GNI* for Ireland the gap in total spending decreases from 20% of
GDP to 5% of GNI*. Secondly, accounting for the differing age structures across EA countries,
the gap as a percentage of GNI* falls further to only -0.6%.
3. However, the differences in sectoral spending are notable
The two notable gaps that persist are over time are in the health and social protection sectors. Based
on GDP, health is at or slightly under the average spending across the EA. However, this changes when
using a GNI* base and accounting for age, where it is shown that Irish health expenditure is well above
average. The spending on social protection is well below average using all economic output bases and
even after adjusting for age. This is driven by much lower than average spending on ‘old-age’ compared
with the EA average, which likely reflects different social security and state pension systems across the
EA.
4. Ireland is relatively efficient in Education and Social Protection expenditure
The results of the DEA analysis indicates overall, that there could be savings to be made for
expenditure, as well as gains on outcomes. Ireland is relatively efficient in education. Ireland spends
less on education than most of its EU peers and achieves relatively efficient outcomes. However, this
is less true when age adjustments are made to expenditure, where it appears that improvements in
outcomes could be achieved. Likewise the DEA analysis indicates that overall, Ireland is relatively
efficient in social protection expenditure in reducing poverty, but proves to be less true when spending
is adjusted for age profiles.
5. Inefficiencies in Ireland’s public health expenditure
Ireland has a relatively high level of health expenditure in comparison to it EU peers. Ireland is not
achieving the greatest level of efficiency from inputs. Inefficiency in health expenditure is more
pronounced when age adjustments are made to expenditure in GDP, GNI and GNI* terms. The DEA
analysis estimates that there could be considerable savings to be made on inputs as well as possible
gains on possible outputs/outcomes.

2
1. Introduction This paper will compare public spending across sectors using Classification of the Functions
of Government (COFOG) data, namely in areas such as Health, Education, Social Protection
and Housing. Similar work has been carried out recent years, see McDonnell (2017)1, but this
analysis will look at comparisons over time, using different peer countries, using a range of
economic output bases (GDP, GNI and GNI*) and finally adjusting for differing age profiles
across the EA. In particular, the analysis will compare the spending in Ireland against peer
countries that form the Euro-Area (EA) over the 2001 to 2015 period. The analysis will use a
range of economic output bases in order to compare across countries given the distortions
caused by the multinational sectors within Ireland. The analysis will also apply an age-
adjusting technique to factor for the differing population structures across the EU countries.
In addition to overall comparisons, the paper will estimate the efficiency of public spending
in the three specific areas of Education, Health and Social Protection (in particular on
poverty). This will update work previously carried out by the IMF (Chailloux, 2016)2, but will
expand on the metrics used in that analysis. The analysis will compare inputs (i.e. expenditure
as % of GDP, as % of GNI/GNI* and on an age adjusted basis) with a range of
outputs/outcomes in these sectors. The paper will make use of Data Envelopment Analysis
(DEA) to estimate the levels to which efficiency could be improved versus frontier countries.
The DEA technique can estimate how much inputs can be reduced to get a similar
output/outcome or how much more outputs/outcomes can be delivered for the same inputs.
The remainder of the paper is structured as follows:
Section 2 details the data and methodology underpinning the analysis.
Section 3 provides a comparison of spending across the EA over the 2001-2015 period on a
headline basis and an age-adjusted basis.
Section 4 provides estimates of the efficiency of public expenditure in the areas of Education,
Health and Social Protection.
Section 5 provides a conclusion for the analysis and some key findings.

3
2. Data and Methodology Age-Adjusted Expenditure
Ireland has a relatively young population in comparison to EA countries, as shown in the
graphs below. The youth ratio classified below is the percentage of the population aged 20 or
less, while the older-age ratio is the percentage of the population over 65 in 2015. In both
cases Ireland is at the end of the scale, with the highest proportion of young people and the
lowest proportion of older-age people. The composition of the population has an important
impact on how resources are allocated and should be factored into an analysis of comparative
spending across sectors. For example, in Ireland it should be expected that spending on
pensions and healthcare should be lower than other countries and conversely, spending on
items such as education and family & child supports should be higher.
Figure 7: Comparison of Youth and Older-Age Ratios across the EU, 2015
Source: Eurostat COFOG database; DPER calculations
While older-age dependency rates in Ireland are beginning to increase, Ireland has a much
younger demographic profile in comparison to other EU countries. This can be reflected in
cross-country comparisons by extending a methodology applied to adjust health spending or
demographic outcomes (Redmond, 2012)3 and used in the Mid-Year Expenditure Report
20164. This allows for the calculation of a demographic adjustor to apply to age-related
expenditures, mainly health, pensions and education. In this analysis, all health expenditure
and old-age expenditure in social protection will be adjusted to reflect the lower cohort of
1 Tom McDonnell (2017); Public spending levels: How does Ireland Compare?; NERI 2 Alexandre Chailloux (2016); Public Expenditure Efficiency in Ireland; IMF 3 Redmond, Paul (2012). Expenditure and Outputs in the Irish Health system: A cross country comparison 4 Department of Public Expenditure and Reform (2016). Mid-Year Expenditure Report. Figure 2.6, pp 14

4
older-age people. The pre-primary, primary, secondary and post-secondary sectors in
education and the expenditure on family and child supports in social protection will be
adjusted to reflect the increased cohort of younger people (further detail on the functions
adjusted is contained in Appendix 1). For the age-adjusted analysis below, spending in all the
EA countries within the sample have been adjusted to reflect the differing age structures using
the following formula:
𝐴𝑔𝑒 − 𝐴𝑑𝑗𝑢𝑠𝑡𝑒𝑑 𝑆𝑒𝑐𝑡𝑜𝑟𝑎𝑙 𝐸𝑥𝑝𝑒𝑛𝑑𝑖𝑡𝑢𝑟𝑒
= 𝐸𝐴 𝑠ℎ𝑎𝑟𝑒 𝑜𝑓 (𝑦𝑜𝑢𝑛𝑔/𝑜𝑙𝑑) 𝑝𝑜𝑝𝑢𝑙𝑎𝑡𝑖𝑜𝑛
𝐶𝑜𝑢𝑛𝑡𝑟𝑦 𝑠ℎ𝑎𝑟𝑒 𝑜𝑓(𝑦𝑜𝑢𝑛𝑔/𝑜𝑙𝑑) 𝑝𝑜𝑝𝑢𝑙𝑎𝑡𝑖𝑜𝑛∗ 𝑆𝑒𝑐𝑡𝑜𝑟𝑎𝑙 𝐸𝑥𝑝𝑒𝑛𝑑𝑖𝑡𝑢𝑟𝑒
Data Envelopment Analysis (DEA)
The main analytical methodologies used in this paper include a trend analysis to analyse
public expenditure in Ireland and across the EA over a period of time and Data Envelopment
Approach to assess the degree of efficiency of public spending.
Source: Coelli, 1996
In order to assess the degree of efficiency with which inputs are turned into
outputs/outcomes we utilise the Data Envelopment Analysis (DEA). The DEA approach is built
on the idea of constructing an efficiency frontier represented by the best performing
countries and then assessing how distant a specific country is from the frontier. Distances
proxy for a measure of inefficiencies or efficiency gains that are potentially achievable.
Inefficiencies can be analysed either from an input or from an output perspective. A country

5
X is more efficient than another country Y in terms of input if X is able to produce the same
output by using less input. Conversely, X is more efficient than Y in terms of output if X is able
to more output by employing the same amount of input. The frontier is calculated directly
from the data using mathematical linear programming methods. Efficiency is measured from
a scale of 0 to 1. Where 0 represents the most inefficient country and 1 represents the most
efficient country.
DEA is a commonly used approach in assessing the efficiency of inputs (Chailloux, 2016; Dutu
et al., 20165). It is important to note that DEA approach is sensitive to the size of the sample,
choice of inputs and outputs indicators and the presence of outliers. Where outliers are
present efficiency estimates are likely to be biased. To avoid this, ad hoc adjustments were
made to remove possible outliers from the sample. Another quality adjustment we made was
the removal of countries whose health systems are not primarily funded by the government.
Data used in this study are derived from the following data sources: Eurostat, OECD and World
Health Organisation. The following outputs used in this study to measure the efficiency of
public spending are: Pisa Scores, Participation Rates in Education, Life Expectancy, Healthy
Life Years (HALE), Non-communicable disease, Disability and Unemployment Poverty and Risk
of Poverty.
5 Richard Dutu and Patrizio Sicari; Public Spending Efficiency in the OECD: Benchmarking Health Care, Education and General Administration; OECD Working Papers No. 1278, 2016

6
3. Comparison of Government Expenditure across the EU and the Euro-Area
Key Findings
1. Ireland’s expenditure comparisons are more volatile than other EA countries
The volatility of economic output measurements, such as GDP and GNI*, are significantly higher
in Ireland than all the GDP figures of other countries in the sample. This makes it quite difficult to
compare expenditure and causes Ireland’s comparative position to vary significantly over time.
2. Ireland’s overall spending is close to the Euro-Area average when age and GNI* are accounted
for
On first glance, spending as a percentage of GDP is well below EA norms. However, taking account
of certain differences between Ireland and other EA countries, this gap in spending tends to shrink.
Firstly, using GNI* for Ireland the gap in total spending decreases from 20% of GDP to 5% of GNI*.
Secondly, accounting for the differing age structures across EA countries, the gap as a percentage
of GNI* falls further to only -0.6%.
Snapshot of 2015 gap between Ireland and Euro-area average expenditure (%)
Total Expenditure Non Age-Adjusted Age-Adjusted
GDP base -19.7 -16.9 GNI base -11.5 -7.9 GNI* base -4.9 -0.6
3. However, the differences in sectoral spending are notable
The two notable gaps that persist are over time are in the health and social protection sectors.
Based on GDP, health is at or slightly under the average spending across the EA. However, this
changes when using GNI* and accounting for age, where it is shown that Irish health expenditure
is well above average. The spending on social protection is well below average using all economic
output bases and even after adjusting for age. This is driven by much lower than average spending
on ‘old-age’ compared with the EA average, which likely reflects different social security and state
pension systems across the EA.
Snapshot of 2015 gap between Ireland and Euro-area average expenditure (%) Non Age-Adjusted Age-Adjusted
Health Expenditure as a % of GDP -1.67 1.18 GNI -0.08 3.58 GNI* 1.21 5.52
Social Protection Expenditure as a % of
GDP -10.71 -10.02 GNI -8.01 -7.13 GNI* -5.84 -4.80

7
Governmental expenditure has experienced periods of rapid growth and decline during the
boom and subsequent recession. At the start of the 2000s (the ‘Celtic Tiger’ years), Ireland
was spending comparatively low amounts as a percentage of GDP, due to modest growth in
expenditure while large increases in nominal GDP were materialising. From 2002 onwards,
Ireland’s comparative expenditure ranking steadily increased until 2008, where expenditure
was almost 42% of GDP. This was as a result of successive years of expenditure growth, well
in excess of nominal GDP growth. In more recent years, Ireland has fallen back down the
rankings, with spending the lowest as a percentage of GDP in 2015. This is due to reductions
in expenditure following the crisis and rapid GDP growth in recent years.
Using the new national income metric, modified GNI (GNI*)6, Ireland’s comparative ranking
improves in all years, but the single largest increase of 15 percentage points (pp) occurs in
2015. This larger increase in 2015 illustrates the distortion to GDP caused by the re-domiciling
of foreign owned assets to within Ireland, which the GNI* specifically adjusts for. Using GNI*
shifts Ireland from being at the bottom of the international league table in 2015 to within a
middle grouping of countries, but still somewhat below the Euro-area average.
Figure 1: General Government Expenditure as a % of GDP; 2001, 2008 and 2015
Source: CSO; OECD; DPER calculations
6 This adjusted level indicator adjusts Gross National Income (GNI) for the retained earnings of re-domiciled firms and depreciation on foreign-owned domestic capital assets in the GNI figures, to provide a more accurate measure of national income.

8
3.0.1 Complexity of International Comparisons As discussed above, Ireland’s expenditure position has varied significantly since the beginning
of this century and can partly explain changes in comparative rankings over these years.
However, the larger impact on the change in Government spending, as a percentage of GDP,
has been as a result of the large variations in GDP and GNI* itself (the base effect). Looking
back over the past sample, the figures below decomposes the impact of expenditure and
GDP/GNI* annual growth on the annual change in the expenditure/base ratio. The relatively
large negative impacts of economic growth have caused large reductions in the spending ratio
in certain years, particularly 2014 and 2015.
Figure 2: Decomposition of annual change of expenditure as a % of GDP and GNI*
Decomposition of annual change of General Government Expenditure as a % of GDP
Decomposition of annual change of General Government Expenditure as a % of GNI*
Source: AMECO database; DPER calculations
The impact of GDP changes are significantly higher in Ireland than most other countries in the
EU, with figure 3 showing the volatility of nominal GDP growth rates for a number of euro-
area countries. This is also the case for the new GNI* metric calculated by the CSO, where the
volatility is higher than all the other countries GDP figures in the sample. This makes it quite
difficult to target levels of expenditure as a percentage of GDP and causes Ireland’s
comparative position to change very significantly over time.

9
Figure 3: Volatility of nominal GDP growth since 2001 for Euro-Area countries (st. dev. %)
Source: AMECO database; DPER calculations
Noting the difficulty in comparing spending across countries and across sectors, the following
section will outline how comparisons change depending on the base used (the analysis will
include GDP, GNI and GNI*) and accounting for the demographic profile of countries across
the Euro-Area. The analysis will use COFOG (Classification of the Functions of Government)
data sourced from the OECD and Eurostat, which allows for a cross-country comparison of
not only the overall spend by Governments but also the sectors in which that spending occurs.
The sectors focussed on in this analysis are Economic Affairs; Housing and Community
Amenities; Health; Education; Social Protection; and ‘Others’. The ‘Others’ section is a catch-
all group which includes General Public Services; Defence; Public Order and Safety;
Environmental Protection; and Recreation, Culture and Religion.
The next section aims to provide a picture for how spending in certain sectors differs between
Ireland and other Euro-Area (EA-19) member states, and also to include an element of age-
adjustment for expenditure in order to factor in the differing demographic profiles across the
EA.
3.1 Comparison of headline spending in selected sectors
There are a number of means to compare spending across countries and bases with which to
compare against. NERI (2017) compared Ireland with a group of 10 comparator countries on
the basis of spending per capita, depending on the sector. They provide some critique of the
use of economic output metrics such as GDP, GNI and GNI* to compare spending “given the
pollution of the Irish national accounts by the tax planning activities of foreign
multinationals”. The cut-off point, of €30,000 in GDP per capita, put Ireland close to the

10
lowest spending country (slightly above the UK) in the sample of 11 countries, and well below
the average. The rationale was to ensure that nominal spending per capita could be compared
across countries that are similarly wealthy. However, this is a large assumption given the
wealth differences, size differences, economic model difference and differences in currencies
of the countries in the sample. The subsequent breakdowns by sector then found that Ireland
was a comparatively low spending country.
This paper would argue that spending comparisons against economic output metrics will
provide a more reasonable basis with which to compare spending across countries, despite
the issues with measuring economic output. In this analysis Ireland will be compared against
the average expenditure in the Euro-Area (EA) in each of the sectors of interest, using a base
of the economic output in Ireland and the EA. This will allow for a better comparison for Irish
Government expenditure against advanced peers with whom we share membership of the
EU, a united currency and monetary policy, and more stringent fiscal monitoring under the
revised Stability and Growth Pact.
3.1.1 Comparison of expenditure as a percentage of GDP
Ireland’s expenditure as a % of GDP has been consistently below the EA average since 2001.
From 2001 to 2005, this gap remained consistent at around 14% of GDP. While there were
large increases in expenditure in these year, there were also proportionally large increases in
GDP.
In 2006 and 2007, the growth in expenditure significantly exceeded GDP growth which caused
the gap with the EA average to close somewhat (to a negative gap of 9.5% of GDP in 2007).
The much lower gap levels between 2008 and 2012 can be explained by both the falling GDP
levels in 2008 and 2009 and the automatic stabilisers kicking in on the onset of the global
financial crisis. In particular, the negative gap in social protection spending reduced
significantly between 2008 and 2012 due to the significant increases in spending on
unemployment. Following the immediate years after the global financial crisis, Ireland started
to grow significantly once again, with growth in GDP in excess of expenditure growth. The
overall negative gap had increased back to 11.8% of GDP by 2014, but due to the

11
unprecedented nominal growth of c.32% in 2015 the gap further deteriorated to almost 20%
of GDP.
On a sectoral basis, the graph identifies that social protection and ‘others’, in particular, are
at expenditure levels well below the EA norm and these have been the persistent key drivers
of the gap over time. Within these sectors, the key drivers of the gaps have been spending on
‘old age’ and ‘survivors’ in social protection, and ‘public debt transactions’ up until 2008 and
‘defence’ throughout in ‘others’. The gap in ‘old age’ spending could reflect the different state
pensions systems that operate across the EA. Ireland tends to levy relatively low amounts of
Social Security Contributions in comparison to other EA countries and pays a flat benefit
irrespective of the total contributions made, once the minimum qualifying weekly
contributions are made. Other EA member states pay back a percentage of in-work income
which reflects the total social contributions made.
Spending on health and housing & community services have been amongst the sectors most
commonly above the EA average. This picture alters when considering 2015, where the large
increase in the GDP base has caused all sectors to spend below the EA average.
Figure 4: Expenditure as a % GDP – Ireland versus euro-area average
Source: Eurostat COFOG database; DPER calculations
3.1.2 Comparison of expenditure as a percentage of GNI and GNI*
Ireland’s expenditure as a % of GNI has been oscillated above and below the EA average as a
percentage of GNI. In the earlier years of the 2000’s and again following the return to growth
from 2013, expenditure has been below the EA average. This follows a similar pattern to the

12
GDP graph above, and the sharp gap increase in 2015 once again captures the unprecedented
growth seen in the economic activity figures, which also impacted GNI.
Between 2008 and 2012, expenditure as a percentage of GNI was above the EA average on
the basis of the falling GNI levels in 2008 and 2009 and the automatic stabilisers kicking in on
the onset of the global financial crisis. In particular, the large negative gap detailed for social
protection in the GDP graphs almost get to zero using the GNI base, again due to the
significant increases in spending on unemployment.
On a sectoral basis, the graph finds similar results to those in the GDP graphs. Social
protection and ‘others’ tend to be at or below the EA norm, while spending on health and
housing & community services remain above the EA average. The positive gap for health has
grown using this metric, with the spending on health getting to 3% of GNI over EA norms
during the crisis period. The main sectoral shift from the GDP figures has been education,
where as a percentage of GNI can be seen to be above EA norms across this period.
Figure 5: Expenditure as a % GNI – Ireland versus euro-area average
Source: Eurostat COFOG database; DPER calculations
The main differences in using the GNI* base are beyond 2007, with the earlier years largely
unaffected. Beyond 2007, the positive gaps seen in 2008 to 2012 are more positive while the
negative gaps following tend to be less negative. Between 2008 and 2015, above average
expenditure as a percentage of GNI* was driven primarily by expenditure in health and
education. Expenditure on social protection has acted as the main underperformer in
comparison with the EA average. The largest impact can be seen in the metric for 2015, where
overall expenditure is 4.9% below the EA average using GNI* as the base.

13
Figure 6: Expenditure as a % of GNI* for Ireland versus euro-area average as a % of GNI
Source: Eurostat COFOG database; DPER calculations
3.2 Comparison of age-adjusted spending in selected sectors
In this section, the analysis aims to go bring these comparisons a step further by adjusting the
expenditure ratios for the demographic composition across the EA.
3.2.1 Age-adjusted comparison of expenditure as a percentage of GDP
On an age-adjusted basis, Ireland’s expenditure as a % of GDP mostly remains below the EA
average but for 2008 and 2009. As explained earlier, this can be explained by both the falling
GDP levels in 2008 and 2009 and the automatic stabilisers kicking in on the onset of the global
financial crisis. However, the gaps are significantly lower than in the non-age adjusted
scenarios.
The more distinct differences occur in the sectoral areas, particularly in relation to health and
education. The spending on health now appears to be significantly above average across all
the years, with a peak between 2008 and 2012. For education, in non-age adjusted terms
spending tended to oscillate above and below average. However, it is clear that education
expenditure has remained below average across the sample when accounting for age.

14
Figure 8: Age-adjusted expenditure as a % GDP – Ireland versus euro-area average
Source: Eurostat COFOG database; DPER calculations
3.2.2 Age-Adjusted comparison of expenditure as a percentage of GNI and GNI*
On an age-adjusted basis, there has been an increasing amount of years where Ireland’s
expenditure as a % of GNI or GNI* have been above the EA average, between 2017 and 2014.
In the years where expenditure has been below average, the gaps are reduced, particularly
when using the GNI* base. The use of GNI* assists in countering the unprecedented growth
seen in other economic activity figures in 2015. This results in the negative gap in 2015 being
in the region of 0.6% of GNI*, considerably lower than the 19% of GDP gap measured in figure
4 above.
The higher than average spending on health is even more pronounced in these graphs, with
the spending gap peaking at 9% of GNI or 10% of GNI* in 2009. This positive gap has remained
throughout the sample. Apart from 2009 and 2010, social protection spending and others
have remained below average. The negative gap is in the range of 7% of GNI or 4.8% of GNI*
in 2015 for social protection, and this is primarily caused by lower than average spending in
‘old age’ even after accounting for the age profile of the state.

15
Figure 9: Age-adjusted expenditure as a % GNI – Ireland versus euro-area average
Source: Eurostat COFOG database; DPER calculations
Figure 10: Age-adjusted expenditure as a % of GNI* for Ireland versus euro-area average as a % of GNI
Source: Eurostat COFOG database; DPER calculations

16
4. Efficiency of Public Spending
Key Findings
1. Ireland is relatively efficient in Education and Social Protection expenditure
The results of the DEA analysis indicates overall, that there are savings to be made for
expenditure as well as gains on outcomes. Ireland is relatively efficient in education. Ireland
spends less on education than most of its EU peers and achieves relatively efficient
outcomes. However, this is less true when age adjustments are made to expenditure in
GDP, GNI and GNI* terms, so it appears that improvements in outcomes could be achieved.
Likewise the DEA analysis indicates that overall, Ireland is relatively efficient in social
protection expenditure in reducing poverty, but proves to be less true when spending is
adjusted for age profiles.
2. Inefficiencies in Ireland’s public health expenditure
Ireland has a relatively high level of health expenditure in comparison to it EU peers.
Ireland is not achieving the greatest level of efficiency from input in comparison with other
EA countries. Inefficiency in health expenditure is more pronounced when age adjustments
are made to expenditure in GDP, GNI and GNI* terms. The DEA analysis estimates that there
are considerable savings to be made on inputs, as well as gains on outputs/outcomes.
This section examines efficiency results of public spending by using a range of economic
output bases (in the areas of Education, Health and Poverty). We first analyse average
government expenditure as a percentage of GDP in per capita terms from 2005 to 2014. To
ensure adequate results for the efficiency of public spending across countries, public spending
is altered to reflect the differing population structure across the EA. Age adjustments are
made to expenditure on the following output bases (GDP, GNI and GNI*). When age
adjustments are made to GDP, GNI and GNI*, we observe differing results. Data Envelopment
Approach (DEA) is utilised to provide numerical illustrations of possible efficiency gains for
Ireland’s public expenditure.
We utilise average government expenditure as a percentage of GDP, GNI and GNI* in per
capita terms from 2005 to 2014, in order to capture sustained government investment over
the period of years leading to that output/outcome in 2015.

17
4.1.1 Education Indicators and Spending
PISA Scores and Participation Rates in education are used to measure the efficiency of public
spending on education.
PISA Scores
PISA scores are used to measure the efficiency of government spending on education. PISA
scores allows us to “evaluate education systems worldwide by testing the skills and knowledge
of 15-year-old students” in basic skills of mathematics, reading, problem solving and scientific
literacy (OECD, 2018). PISA scores is a useful output indicator to utilise in terms of
comparisons across countries as it has a wide scope and is not based on a specific school
program of an individual country (Mandle et al., 2008).
Figure 11: Plot of Public Expenditure and Pisa Scores
Source: OECD and Eurostat database; DPER calculations
The result of the DEA analysis shows that Public Expenditure in Education (PEE) in Ireland
when examined under GDP is relatively efficient as Ireland is in close proximity to the
efficiency frontier. Ireland achieves the current output of 509 PISA score and spent an average
of 3.5% of GDP on education from 2005 to 2014. As seen in Table 1, it is estimated that Ireland
could achieve the current output of 509 (PISA score) by spending only 0.5% less of GDP.
Austria Belgium
Czech Republic
Denmark
EstoniaFinland
France
Germany
Greece
Hungary
Iceland
Ireland
Italy LatviaLuxembourg
NetherlandsNorwayPoland
Portugal
Slovakia
Slovenia
Spain
Sweden
United Kingdom
455
465
475
485
495
505
515
525
2.0 3.0 4.0 5.0 6.0
Pis
a Sc
ore
s 2
01
5
Public Education Expenditure % of GDP (2005-2014)

18
Ireland is assessed to be the most efficient country when estimated in age adjusted
expenditure in education in GDP terms (Figure 12). Ireland achieves an efficient outcome of
509 (Pisa Score) and spends 4.9% age adjusted expenditure as a % of GPD on education.
Figure 12: Plot of Age Adjusted Public Education Expenditure (PEE) as a % of GDP and Pisa Scores 2015
Source: OECD and Eurostat database; DPER calculations
However, when age adjusted expenditure is estimated in GNI terms Ireland becomes
relatively efficient as seen in Figure 13 down below.
Figure 13: DEA Analysis of Age Adjusted Public Education Expenditure (PEE) as a % of GNI/GNI* and Pisa Scores 2015
Source: OECD and Eurostat database; DPER calculations
Austria Belgium
Czech Republic
Denmark
EstoniaFinland
France
Germany
Greece
Hungary
Ireland
Italy LatviaLuxembourg
NetherlandsNorway Poland
Portugal
Slovakia
Slovenia
SpainSweden
United Kingdom
455
465
475
485
495
505
515
525
3.5 4 4.5 5 5.5 6 6.5 7
Pis
a Sc
ore
20
15
Age-Adjusted Public Education Expenditure % of GDP (2005-2014)
Austria Belgium
Czech Republic
Denmark
EstoniaFinland
France
Germany
Greece
Hungary
Ireland Ireland GNI*
Italy LatviaLuxembourg
NetherlandsNorway Poland
Slovakia
Slovenia
Spain
Sweden
United Kingdom
455
465
475
485
495
505
515
525
3.50 4.00 4.50 5.00 5.50 6.00 6.50 7.00
Pis
a Sc
ore
20
15
Age-Adjusted Public Education Expenditure % of GNI (2005-2014)

19
Table 1: DEA Analysis of Public Education Expenditure (PEE) as a % of GDP and Pisa Scores 2015
Original Value Projected Value
Output: PISA Score 509 509 Input: PEE/GDP 3.5% 2.87% Output: PISA Score 509 509 Input: Age Adjusted PEE/GDP 4.9% 4.9% Output: PISA Score 509 512 Input: Age Adjusted PEE/GNI 4.83% 4.83% Output: PISA Score 509 514.51 Input: Age Adjusted PEE/GNI* 5% 5%
The result of the DEA analysis shows that Public Expenditure in Education (PEE) in Ireland
when examined under GDP is relatively efficient as Ireland is in close proximity to the
efficiency frontier. Ireland achieves the current output of 509 PISA score and spent an average
of 3.5% of GDP on education from 2005 to 2014. As seen in Table 1, it is estimated that Ireland
could achieve the current output of 509 (PISA score) by spending only 0.5% less of GDP.
Ireland is assessed to be the most efficient country when estimated in age adjusted
expenditure in education in GDP terms (Figure 12). Ireland achieves an efficient outcome of
509 (Pisa Score) and spends 4.9% age adjusted expenditure as a % of GPD on education.
Although Ireland is relatively efficient. The DEA analysis indicates that Ireland can increase its
PISA Score outcome to 512 by spending the same amount of input of 4.8% of GNI (Table 1).
When the efficiency of age adjusted public spending is viewed in GNI* terms Irelands
proximity to the efficiency frontier changes slightly. It is estimated that Ireland can achieve a
potential output of 514.5 PISA Score by spending the same amount of input of 5% of GNI*.
Participation Rate in Education
In this analysis the participation rate in education includes Pre-primary, primary and
secondary education. Tertiary education is excluded as there is no firm distinction between
government expenditure and private/personal expenditure. Romania and Slovakia are
excluded from the sample as their results indicate they are outliers.

20
Figure 14: Plot of Public Education Expenditure and Participation Rates
Source: Eurostat database; DPER calculations
Table 2: DEA Analysis of Public Education Expenditure (PEE) as a % of GDP and Participation Rate 2015
Original Value Projected Value
Output: Participation Rate 21% 22.4% Input: PEE/GDP 3.5% 3.5% Output: PISA Score 21% 21% Input: Age Adjusted PEE/GDP 4.09% 4.09% Output: PISA Score 21% 22.52% Input: Age Adjusted PEE/GNI 4.83% 4.83% Output: PISA Score 21% 22.67% Input: Age Adjusted PEE/GNI* 5% 5%
As seen in Figure 12 Ireland is very close to the efficiency frontier. Ireland achieves an
outcome of 21% participation rate in education and spends 3.5% of average GDP on
education. The DEA analysis estimates that Ireland can achieve 1.4% more than the current
outcome of (21% participation rate) by spending the same input of 3.5% of average GDP on
education (Table 2).
Austria
Belgium
Bulgaria
Croatia
CyprusCzech Republic
Denmark
Estonia
Finland
France
Germany
Greece
Hungary
Iceland
Ireland
ItalyLatvia
LithuaniaLuxembourg
Malta
Netherlands
Norway
Poland Portugal Slovenia
Spain
Sweden
United Kingdom
12
14
16
18
20
22
24
26
28
2 2.5 3 3.5 4 4.5 5 5.5
Par
tici
pat
ion
Rat
e 2
01
5
Public Education Expenditure % of GDP (2005-2014)
21
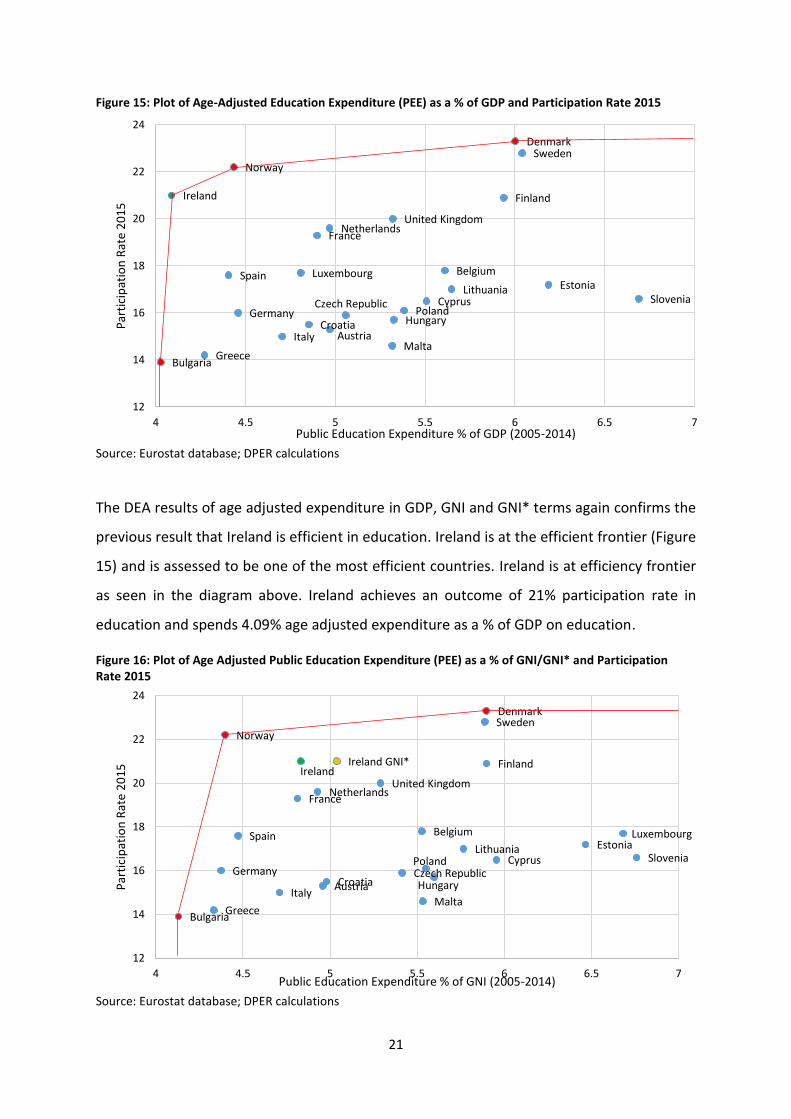
Figure 15: Plot of Age-Adjusted Education Expenditure (PEE) as a % of GDP and Participation Rate 2015
Source: Eurostat database; DPER calculations
The DEA results of age adjusted expenditure in GDP, GNI and GNI* terms again confirms the
previous result that Ireland is efficient in education. Ireland is at the efficient frontier (Figure
15) and is assessed to be one of the most efficient countries. Ireland is at efficiency frontier
as seen in the diagram above. Ireland achieves an outcome of 21% participation rate in
education and spends 4.09% age adjusted expenditure as a % of GDP on education.
Figure 16: Plot of Age Adjusted Public Education Expenditure (PEE) as a % of GNI/GNI* and Participation Rate 2015
Source: Eurostat database; DPER calculations
Austria
Belgium
Bulgaria
Croatia
CyprusCzech Republic
Denmark
Estonia
Finland
France
Germany
Greece
Hungary
Ireland
Italy
Lithuania
Luxembourg
Malta
Netherlands
Norway
PolandSlovenia
Spain
Sweden
United Kingdom
12
14
16
18
20
22
24
4 4.5 5 5.5 6 6.5 7
Par
tici
pat
ion
Rat
e 2
01
5
Public Education Expenditure % of GDP (2005-2014)
Austria
Belgium
Bulgaria
Croatia
CyprusCzech Republic
Denmark
Estonia
Finland
France
Germany
Greece
Hungary
IrelandIreland GNI*
Italy
Lithuania
Luxembourg
Malta
Netherlands
Norway
Poland Slovenia
Spain
Sweden
United Kingdom
12
14
16
18
20
22
24
4 4.5 5 5.5 6 6.5 7
Par
tici
pat
ion
Rat
e 2
01
5
Public Education Expenditure % of GNI (2005-2014)

22
However, when age adjusted expenditure is estimated in GNI terms Ireland becomes
relatively inefficient. From the diagram above it can be seen that Ireland has moved away
from the efficiency frontier. The DEA analysis indicates that Ireland can increase its current
participation rate of 21% to 22.5% by spending the same amount of input of 4.8% of GNI. The
result of the DEA analysis show similar results when the efficiency of age adjusted public
spending is estimated in GNI* terms.
4.1.2 Health Indicators and Spending
The following indicators are used to determining the efficiency of public spending in health:
Healthy Life Years and Non-communicable diseases. It is important to note that other factors
affect health outcomes (lifestyle, genetics, etc.) and not just spending, however the methods
applied in this paper are consistent with prior analysis on efficiency of public spending.
For health indicators the sample is restricted to countries whose health system is mostly
publicly funded. This will allow us to adequately capture the efficiency of public spending.
Countries such as Greece, Hungary, Latvia, Lithuania and Portugal are excluded from this
sample as they are mostly privately funded. Furthermore countries who are outliers in both
input and output terms are excluded as to not distort the results of the DEA analysis. Outliers
can have a significant impact on efficiency scores. Countries that are excluded from the
sample based on being outliers are Switzerland, Bulgaria, Cyprus, Luxembourg, Malta, Poland,
Estonia and Romania.
Healthy Life Years (HALE)
To measure efficiency we link the 10 year average of in GDP terms and age adjusted Public
Health Expenditure in GDP, GNI and GNI* terms to the outcome (HALE) in 2015. The DEA
results indicates that Ireland’s public spending in health is inefficient in GDP terms and
inefficient in age adjusted public spending in GDP, GNI and GNI* terms.
The efficiency of health spending is determined utilising healthy life years at birth as a proxy
of the health systems. Healthy Life Years at birth (HALE) is defined as: “average number of
years that a person can expect to live in "full health" by taking into account years lived in less
than full health due to disease and/or injury” (Eurostat, 2018). Healthy life years has the

23
benefit of being a very wide-ranging measure of population health and is correlated with
other indicators of health. The sample is restricted to countries whose health system is mostly
publicly funded and who are not outliers. Healthy Life Years is a widely used indicator to
determine the efficiency of public spending on health (Alexandre et al., 2016). Healthy Life
Years is a widely used indicator to determine the efficiency of public spending on health
(Alexandre et al., 2016).
Figure 17: Plot of Public Health Expenditure and Health Life Years
Source: Eurostat database; DPER calculations Table 3: DEA Analysis of Public Health Expenditure (PHE) as a % of GDP and Health Life Years 2015
Original Value Projected Value
Output: HALE 71.5 72.8 Input: PHE/GDP 7.6% 7.1% Output: HALE 71.5 72.8 Input: Age Adjusted PHE/GDP 12.21% 6.34% Output: HALE 71.5 72.8 Input: Age Adjusted PHE/GNI 14.44% 6.35% Output: HALE 71.5 72.8 Input: Age Adjusted PHE/GNI* 15% 6.35%
Ireland is quite distant from the efficiency frontier as seen in Figure 17 above. Ireland at 71.5
years of life expectancy does not achieve a more efficient outcome than most of its European
Austria
Belgium
Croatia Czechia
DenmarkFinland
France
Germany
Iceland
Ireland
Italy
Lithuania
Malta
NetherlandsNorway
Slovakia
Slovenia
Spain
Sweden
United Kingdom
66
67
68
69
70
71
72
73
74
5.5 6.0 6.5 7.0 7.5 8.0 8.5
Hea
lth
y Li
fe Y
ears
20
15
Public Health Expenditure % of GDP (2005-2014)

24
peers. Malta, Germany and United Kingdom show a similar age expectancy but spend
considerably less on health than Ireland. Ireland currently achieves an outcome of 71.5 HALE
years and spends 7.6% of GDP on public health. It is estimated that Ireland could achieve an
efficiency outcome of 72.8 HALE years by spending only 7.1% of GDP instead of 7.6% (0.5%
less of GDP).
Figure 18: Plot of Age Adjusted Health Expenditure (PHE) as a % of GDP and Health Life Years 2015
Source: Eurostat database; DPER calculations
Ireland’s inefficiency in health is more pronounced when age adjustments are made to health
expenditure and estimated in GDP, GNI and GNI* terms. Amongst the EA countries, Ireland
spends the most of age adjusted public expenditure as % of GDP on health. Ireland achieves
a current outcome of 71.5 years and spends 12.21% of age adjusted expenditure as a % of
GDP on health. The DEA analysis estimates that Ireland could achieve an outcome of 72.8
healthy life years by significantly decreasing age-adjusted expenditure by spending only
6.34% of GDP instead of 12.21% (5.87% less of GDP).
Austria
Belgium
Croatia Czechia
DenmarkFinland
France
GermanyIreland
Italy
Lithuania
Malta
NetherlandsNorway
Slovakia
Slovenia
Spain
Sweden
United Kingdom
66
67
68
69
70
71
72
73
74
6.00 7.00 8.00 9.00 10.00 11.00 12.00 13.00
Hea
lth
y Li
fe Y
ears
20
15
Public Health Expenditure % of GDP (2005-2014)

25
Figure 19: Plot of Age Adjusted Health Expenditure (PHE) as a % of GNI/GNI* and Healthy Life Years
Source: Eurostat database; DPER calculations
Again we see that Ireland is inefficient when age adjusted public health expenditure is
estimated in GNI and GNI* terms. In Figure 26 above it can be seen that Ireland achieves the
most inefficient result compared to it EA peers. Ireland achieves a current outcome of 71.5
years and spends 14.44% of age adjusted public health expenditure as a % of GNI. When
viewed in GNI* terms Ireland achieves a current outcome of 71.5 years and spends 15% of
GNI* on age adjusted public health. The DEA analysis estimates that Ireland can increase its
current HALE of 71.5% to 72.8% by decreasing spending from 14.44% to 6.35% of GNI (8.09%
less of GDP). And likewise decrease spending from 15% to 6.35% of GNI*(8.65% less of GDP).
Again, Ireland is inefficient when age adjusted public health expenditure is estimated in GNI
and GNI* terms. In Figure 19 above, Ireland achieves the most inefficient result compared to
it EA peers. Ireland achieves a current outcome of 71.5 years and spends 14.44% of age
adjusted public health expenditure as a % of GNI. When viewed in GNI* terms Ireland achieves
a current outcome of 71.5 years and spends 15% of GNI* on age adjusted public health. The
DEA analysis estimates that Ireland can increase its current HALE of 71.5% to 72.8% by
decreasing spending from 14.44% to 6.35% of GNI (8.09% less of GDP). And likewise decrease
spending from 15% to 6.35% of GNI*(8.65% less of GDP).
Austria
Belgium
Croatia Czechia
DenmarkFinland
France
Germany IrelandIreland GNI*
Italy
Lithuania
Malta
NetherlandsNorway
Slovakia
Slovenia
Spain
Sweden
United Kingdom
66
67
68
69
70
71
72
73
4.00 6.00 8.00 10.00 12.00 14.00 16.00
Hea
lth
y Li
fe Y
ears
20
15
Public Health Expenditure % of GDP (2005-2014)

26
Non – Communicable Diseases
Like the healthy life years indicator, the non-communicable disease indicator, can be used
as a measure of population health and the effectiveness of the health system. This indicator
tells us the “probability (%) of dying between age 30 and exact age 70 from any non-
communicable diseases: cardiovascular disease, cancer, diabetes, or chronic respiratory
disease” (Eurostat, 2018). For the purposes of this analysis, the probability of not dying
between age 30 and 70 from non-communicable diseases is used, so a higher percentage
represents a better outcome for a country.
Figure 20: Plot of Public Health Expenditure as a% of GDP and Non-Communicable Disease
Source: Eurostat and WHO database; DPER calculations
Table 4: DEA Analysis of Public Health Expenditure as a % of GDP and Non-Communicable Diseases 2015
Original Value Projected Value
Output: Non-Communicable Disease 89.7% 91.7% Input: PHE/GDP 7.6% 7.5% Output: Non-Communicable Disease 89.7% 90.9% Input: Age Adjusted PHE/GDP 12.21% 6.79% Output: Non-Communicable Disease 89.7% 90.9% Input: Age Adjusted PHE/GNI 14.44% 6.62% Output: Non-Communicable Disease 89.7% 90.9% Input: Age Adjusted PHE/GNI* 15.06% 6.62%
AustriaBelgium
Croatia
Czechia
Denmark
Finland
France
Germany
Iceland
Ireland
Italy
Netherlands
Norway
Slovakia
Slovenia
Spain
Sweden
United Kingdom
82
83
84
85
86
87
88
89
90
91
92
6.0 6.5 7.0 7.5 8.0 8.5
No
n-C
om
mu
nic
able
Dis
ease
20
15
Public Health Expenditure % of GDP (2005-2014)

27
To measure efficiency of Public Health Expenditure (PHE) in a comparative way the diagram
above links the 10 year average of PHE over 2005-2014 to its outcome: probability of not
dying from a non-communicable disease in 2015. The result of the DEA analysis shows that
public expenditure in health in Ireland is not efficient. As seen in the diagram above, Ireland
is not in close proximity to the efficiency frontier, meaning that Ireland is not achieving the
most possible level of efficiency from inputs. Ireland currently achieves an efficiency of 89.7%
probability of not dying from non-communicable disease and spends an average of 7.6% of
GDP on public health. It is estimated that Ireland could achieve an efficient outcome of 91.7%
probability by spending 0.1% less of GDP.
Figure 21: DEA Analysis of Age Adjusted Health Expenditure (PHE) as a % of GDP and Non-communicable
disease 2015
Source: Eurostat and WHO database; DPER calculations
To measure efficiency we link the 10 year average of age adjusted Public Health Expenditure
in GDP, GNI and GNI* terms to the output/outcome – probability of not dying from a non-
communicable disease in 2015. The DEA results indicate that Ireland’s age adjusted public
spending in health is inefficient, in GDP, GNI and GNI* terms. Once again Ireland achieves the
most inefficient result amongst its EA peers. Amongst its EA peers Ireland spends the most of
age adjusted public expenditure as % of GDP on health. Ireland achieves a current outcome
of 89.7% years and spends 12.21% of age adjusted expenditure as a % of GDP on health. The
AustriaBelgium
Croatia
Czech Republic
Denmark
FinlandFrance
Germany
Ireland
Italy
Netherlands
Norway
Slovakia
Slovenia
Spain
Sweden
United Kingdom
82
83
84
85
86
87
88
89
90
91
92
6 7 8 9 10 11 12 13
No
n-C
om
mu
nic
able
Dis
ease
20
15
Age-Adjusted Public Health Expenditure % of GDP (2005-2014)

28
DEA analysis estimates that Ireland could achieve an outcome of 90.9% instead of 89.7% (not
dying from a non-communicable disease). This can be achieved by spending 6.79% of age
adjusted expenditure instead of 12.21% of GDP.
Figure 22: Plot of Age Adjusted Health Expenditure (PHE) as a % of GNI and Non-communicable disease 2015
Source: Eurostat and WHO database; DPER calculations
Once again Ireland achieves the most inefficient result amongst its EA peers. Amongst its EA
peers Ireland spends the most of age adjusted public expenditure as % of GNI on health.
Ireland achieves a current outcome of 89.7% and spends 14.44% of age adjusted expenditure
as a % of GNI on health. In GNI terms, Ireland achieves a current outcome of 89.7% and spends
15.06% of age adjusted expenditure as a % of GNI* on health. The DEA analysis estimates that
Ireland can increase its current outcome (not at risk of dying from non-communicable disease)
of 89.7% to 90.9% by decreasing spending from 14.44% to 6.62% of GNI. And likewise
decrease spending from 15.06% to 6.62% of GNI*.
4.1.3 Poverty Indicators and Spending
The following poverty indicators will be used to estimate public spending efficiency in Social
Protection: Disability Poverty, and Unemployment Poverty.
AustriaBelgium
Croatia
Czech Republic
Denmark
Finland
France
Germany
Ireland Ireland GNI*
Italy
Netherlands
Norway
Slovakia
Slovenia
Spain
Sweden
United Kingdom
82
83
84
85
86
87
88
89
90
91
5 6.5 8 9.5 11 12.5 14 15.5
No
n-C
om
mu
nic
able
Dis
ease
20
15
Age-Adjusted Public Health Expenditure % of GNI (2005-2014)

29
Disability Poverty
This measure views the % of those with a disability who are not at risk of being in poverty.
The following countries are removed from the sample as the results indicate that they are
outliers: Iceland, Czech Republic, Cyprus, Slovakia and Romania. To measure efficiency we link
the 10 year average of Public expenditure in social protection over 2005 to 2014 to the
output/outcome (% of those with a disability who are not at risk of being in poverty). To
measure efficiency we link the 10 year average of age adjusted Public Social Protection
Expenditure in GDP, GNI and GNI* terms to the output/outcome - those with a disability who
are not at risk of being in poverty in 2015. The DEA results indicate that Ireland’s age adjusted
public spending in social protection is relatively efficient, in GDP, GNI and GNI* terms.
Figure 23: Plot of Public Social Protection Expenditure and Risk of not being in Disability Poverty
Source: Eurostat database; DPER calculations Table 5: DEA Analysis of Social Protection Expenditure (SPE) as a % of GDP and Disability Poverty 2015
Original Value Projected Value
Outcome: Disability Poverty 77.22% 78.138% Input: SPE/GDP 13.35% 13.35%
Outcome: Disability Poverty 77.22% 78.89%
Input: Age Adjusted SPE/GDP 14.63% 14.63%
Outcome: Disability Poverty 77.2% 87.3%
Input: Age Adjusted SPE/GNI 17.31% 16.84%
Outcome: Disability Poverty 77.2% 86.99%
Input: Age Adjusted SPE/GNI* 16.42% 16.42%
Austria
Belgium
Bulgaria
Croatia
Denmark
Estonia
FinlandFrance
Germany
Greece
Hungary
Ireland
Italy
Latvia Lithuania
Luxembourg
Malta
Netherlands
NorwayPoland
Portugal
Slovenia
Spain
Sweden
United Kingdom
65.00
70.00
75.00
80.00
85.00
90.00
10 12 14 16 18 20 22 24
% N
ot
in D
isab
ility
Po
vert
y
Public Social Protection Expenditure % of GDP (2005-2014)

30
Public Expenditure in Social Protection in Ireland is relatively efficient. Ireland is in close
proximity to the efficiency frontier, meaning that Ireland is achieving the most possible level
of efficiency from inputs. Ireland currently achieves an outcome of 77% probability of not
being at risk of poverty with a disability and spends an average of 13.35% of GDP on social
protection from 2004 to 2015. It is estimated that Ireland could achieve an outcome of 78%
probability of not being at risk of poverty with a disability by spending the current input of
13.35% of GDP on social protection.
Figure 24: Plot of Age Adjusted Social Protection Expenditure (SPE) as a % of GDP and not in Disability Poverty 2015
Source: Eurostat database; DPER calculations
Ireland is relatively efficient as seen in the diagram above. Ireland achieves a current outcome
of 77.2 and spends 14.63% of age adjusted expenditure as a % of GDP on social protection.
The DEA analysis estimates that Ireland could achieve an outcome of 78.89% instead of
77.22% (those with a disability not at risk of being in poverty). This can be achieved by
spending the same current output of 14.63% of age adjusted social protection expenditure of
GDP.
Austria
Belgium
Bulgaria
Croatia
Denmark
Estonia
FinlandFrance
Germany
Greece
Hungary
Ireland
Italy
Lithuania
Luxembourg
Malta
Netherlands
NorwayPoland
Portugal
Slovenia
Spain
Sweden
United Kingdom
65
70
75
80
85
90
12 14 16 18 20 22 24 26
% N
ot
in D
isab
ility
Po
vert
y
Age-Adjusted Public Social Protection Expenditure % of GDP (2005-2014)

31
Figure 25: Plot of Age Adjusted Social Protection Expenditure (SPE) as a % of GNI and not in Disability Poverty 2015
Source: Eurostat database; DPER calculations
When efficiency is estimated in GNI and GNI* terms we see that Ireland shifts away from the
efficiency frontier and becomes relatively inefficient. Ireland achieves a current outcome of
77.2 and spends 17.31% of age adjusted expenditure as a % of GNI on social protection. When
estimated in GNI*, Ireland achieves an outcome of 77.2 and spends 16.42% of age adjusted
expenditure as % of GNI* on social protection. The DEA analysis estimates that Ireland can
increase its current outcome (those with a disability not at risk of being in poverty) of 77.2%
to 87.3% by decreasing spending from 17.31% to 16.84% of age adjusted expenditure as % of
GNI on social protection. When estimated in GNI* term, Ireland can increase its current
outcome of 77.2% to 86.99% by spending the current input of 16.42% of age adjusted
expenditure as % of GNI* on social protection.
Not At Risk of Unemployment Poverty
This indicator views the % of those not in unemployment poverty. To measure efficiency we
link the 10 year average of Public expenditure in social protection over 2005 to 2014 to the
output/outcome % of those not in unemployment poverty).
To measure efficiency there is a comparison of the 10 year average of age adjusted Public
Social Protection Expenditure in GDP, GNI and GNI* terms to the output/outcome - those not
Austria
Belgium
Bulgaria
Croatia
Denmark
Estonia
Finland
France
Germany
Greece
Hungary
Ireland
Ireland GNI*
Italy
Lithuania
Luxembourg
Malta
Netherlands
NorwayPoland
Portugal
Slovenia
Spain
Sweden
United Kingdom
65
70
75
80
85
90
5 10 15 20 25 30
% N
ot
in D
isab
ility
Po
vert
y
Age-Adjusted Public Social Protection Expenditure % of GNI (2005-2014)

32
at risk of being in of unemployment poverty in 2015. The DEA results indicate that Ireland’s
age adjusted public spending in social protection is relatively efficient, in GDP, GNI and GNI*
terms.
Figure 26: Plot of Public Social Protection Expenditure and Risk of not being in Unemployment Poverty
Source: Eurostat database; DPER calculations
Table 6: DEA Analysis of Social Protection Expenditure (SPE) as a % of GDP and Unemployment Poverty 2015
Original Value Projected Value
Output: Unemployment Poverty 32.9% 49.5% Input: SPE/GDP 13.35% 12.7%
Output: Unemployment Poverty 32.9% 33.04%
Input: Age Adjusted SPE/GDP 14.63% 14.63%
Output: Unemployment Poverty 32.9% 41.97%
Input: Age Adjusted SPE/GNI 17.31% 17.31%
Output: Unemployment Poverty 32.9% 41.49%
Input: Age Adjusted SPE/GNI* 16.42% 16.42%
Ireland achieves an outcome of 33% probability of not being in unemployment poverty and
spends 13.35% of average GDP on social protection. The DEA analysis estimates that Ireland
could achieve the level of efficiency to that of Switzerland. Ireland can achieve 10.3% more
than the current outcome of (32.9% probability of not being unemployed and in poverty) by
spending 12.7% of GDP instead of 13.35%.
Austria
Belgium
Bulgaria
Denmark
FinlandFrance
Germany
Greece
Hungary
IrelandItalyLatvia
Lithuania
Luxembourg
Malta
NetherlandsNorway
PolandPortugal
Romania
Slovakia
Spain
Sweden
Switzerland
United Kingdom
15
20
25
30
35
40
45
50
55
10.0 12.0 14.0 16.0 18.0 20.0 22.0 24.0
% N
ot
in U
nem
plo
ymen
t P
ove
rty
Public Social Protection Expenditure % of GDP (2005-2014)

33
Figure 27: Plot of Age Adjusted Social Protection Expenditure (SPE) as a % of GDP and Unemployment Poverty 2015
Source: Eurostat database; DPER calculations
Ireland is relatively efficient as seen in the diagram above. Ireland achieves a current outcome
of 32.9 and spends 14.63% of age adjusted expenditure as a % of GDP on social protection.
The DEA analysis estimates that Ireland can increase the current outcome of 32.9% to 33.04%
(those not at risk of poverty) while spending the current input of 14.63% of age adjusted social
protection expenditure as % of GDP.
Figure 28: Plot of Age Adjusted Social Protection Expenditure (SPE) as a % of GNI and Unemployment Poverty 2015
Source: Eurostat database; DPER calculations
Austria
Belgium
Bulgaria
Denmark
Finland
France
Germany
Greece
Hungary
Ireland
Italy
Lithuania
Luxembourg
Malta
Netherlands Norway
Poland
PortugalSlovakia
Spain
Sweden
United Kingdom
15
20
25
30
35
40
45
50
12 14 16 18 20 22 24
% N
ot
in U
nem
plo
ymen
t P
ove
rty
Age-Adjusted Public Social Protection Expenditure % of GDP (2005-2014)
Austria
Belgium
Bulgaria
Denmark
FinlandFrance
Germany
Greece
Hungary
IrelandIreland GNI*
Italy
Lithuania
Luxembourg
Malta
Netherlands Norway
Poland
PortugalSlovakia
Spain
Sweden
United Kingdom
15
20
25
30
35
40
45
50
5 10 15 20 25 30
% N
ot
in U
nem
plo
ymen
t P
ove
rty
Age-Adjusted Public Social Protection Expenditure % of GDP (2005-2014)
34
Ireland is relatively efficient in achieving a current outcome of 32.9% and spends 17.31% of
age adjusted expenditure as a % of GNI on social protection. When estimated in GNI*, Ireland
achieves an outcome of 32.9 and spends 16.42% of age adjusted expenditure as % of GNI* on
social protection. The DEA analysis estimates that Ireland can significantly increase its current
outcome (those not at risk of unemployment poverty) of 32.9% to 41.97% by spending the
same input of 17.31% of age adjusted expenditure as % of GNI on social protection. When
estimated in GNI* term, Ireland can increase its current outcome of 32.9% to 41.49% by
spending the current input of 16.42% of age adjusted expenditure as % of GNI* on social
protection.
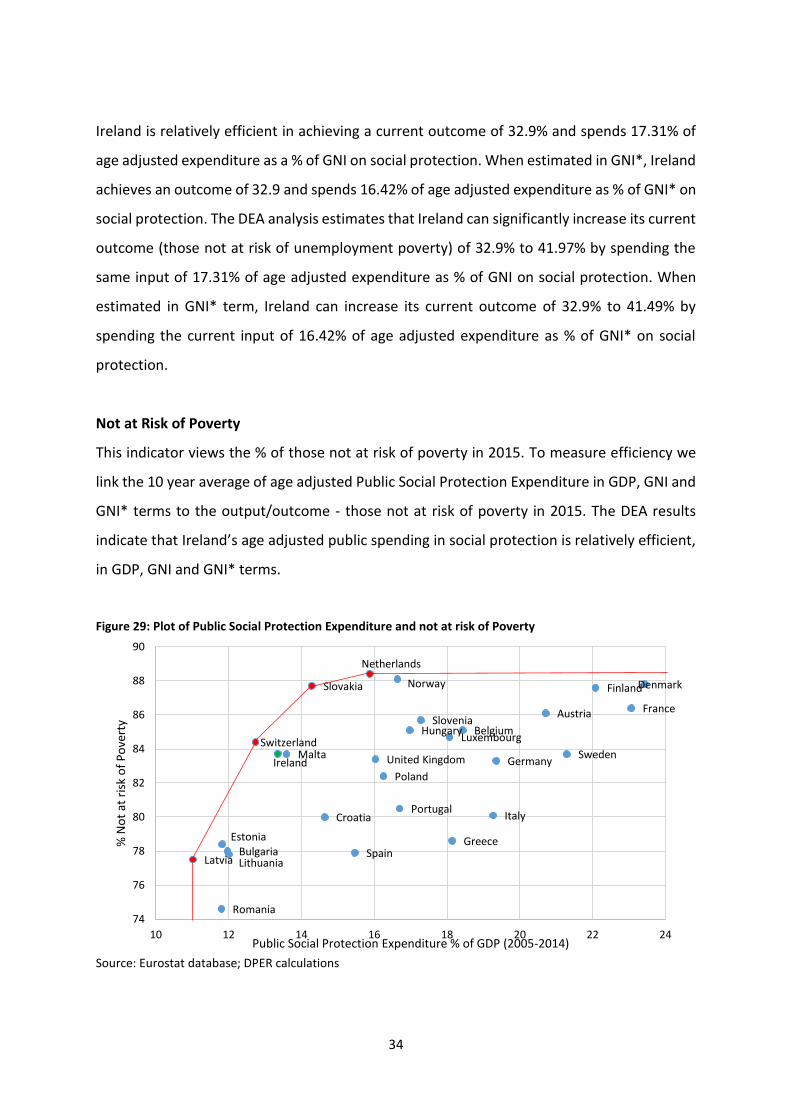
Not at Risk of Poverty
This indicator views the % of those not at risk of poverty in 2015. To measure efficiency we
link the 10 year average of age adjusted Public Social Protection Expenditure in GDP, GNI and
GNI* terms to the output/outcome - those not at risk of poverty in 2015. The DEA results
indicate that Ireland’s age adjusted public spending in social protection is relatively efficient,
in GDP, GNI and GNI* terms.
Figure 29: Plot of Public Social Protection Expenditure and not at risk of Poverty
Source: Eurostat database; DPER calculations
Austria
Belgium
Bulgaria
Croatia
Denmark
Estonia
Finland
France
Germany
Greece
Hungary
Ireland
Italy
Latvia Lithuania
Luxembourg
Malta
Netherlands
Norway
Poland
Portugal
Romania
Slovakia
Slovenia
Spain
SwedenSwitzerland
United Kingdom
74
76
78
80
82
84
86
88
90
10 12 14 16 18 20 22 24
% N
ot
at r
isk
of
Po
vert
y
Public Social Protection Expenditure % of GDP (2005-2014)

35
Ireland is not far from the efficiency frontier. Ireland achieves an outcome of 83.7%
probability of not being in poverty and spends 13.35% of average GDP on social protection.
The United Kingdom and Germany achieve the same outcome as Ireland but spend more on
social protection. The DEA analysis estimates that Ireland can achieve 1% more than the
current outcome of (83.7% probability of not being in poverty) by spending the same input of
13.35% of GDP on social protection.
Table 7: DEA Analysis of Social Protection Expenditure (SPE) as a % of GDP and Not at Risk of Poverty 2015
Original Value Projected Value
Output: Not At Risk Of Poverty 83.7% 84.77% Input: SPE/GDP 13.35% 13.35%
Output: Not At Risk Of Poverty 83.7% 83.7%
Input: SPE/GDP 14.63% 14.63%
Output: Not At Risk Of Poverty 83.7% 88.4%
Input: PEE/GNI 17.32% 16.84%
Output: Not At Risk Of Poverty 83.7% 88.21%
Input: PEE/GNI* 16.42% 16.42%
Figure 30: Plot of Age Adjusted Social Protection Expenditure (SPE) as a % of GDP and not at Risk of Poverty 2015
Source: Eurostat database; DPER calculations
Austria
Belgium
Bulgaria
Croatia
Denmark
Estonia
Finland
France
Germany
Greece
Hungary
Ireland
Italy
Lithuania
Luxembourg
Malta
Netherlands
Norway
Poland
Portugal
Slovakia
Slovenia
Spain
SwedenUnited Kingdom
76
78
80
82
84
86
88
90
12 14 16 18 20 22 24
% N
ot
in P
ove
rty
Age-Adjusted Public Social Protection Expenditure % of GDP (2005-2014)

36
Ireland achieves an efficient outcome of 83.7% and spends 14.63% of age adjusted
expenditure as a % of GDP on social protection. Estonia achieves an efficient outcome of
78.4% while spending 12.09% of age adjusted expenditure as a % of GDP on social
protection. The DEA analysis estimates that Ireland achieves the most efficient outcome for
the current output.
Figure 31: Plot of Age Adjusted Social Protection Expenditure (SPE) as a % of GDP and not at Risk of Poverty 2015
Source: Eurostat database; DPER calculations
Ireland is relatively efficient. Ireland achieves a current outcome of 83.7% and spends 17.32%
of age adjusted expenditure as a % of GNI on social protection. When estimated in GNI* term,
Ireland achieves an outcome of 83.7 and spends 16.42% of age adjusted expenditure as % of
GNI* on social protection. The DEA analysis estimates that Ireland can increase its current outcome
(those not at risk of t poverty) of 83.7% to 88.4% by decreasing input of 17.31% to 16.84% of age
adjusted expenditure as % of GNI on social protection. When estimated in GNI* term, Ireland can
increase its current outcome of 83.7% to 88.21% by spending the current input of 16.42% of age
adjusted expenditure as % of GNI* on social protection.
4.2 Key Findings of DEA Efficiency Analysis
The results of the DEA analysis indicates overall, that there are savings to be made for
expenditure as well as gains on outcomes. Ireland is relatively efficient in education. Ireland
spends less on education than most of its EU peers and achieves a relatively efficient
outcome. This holds to be true when age adjustments is made to expenditure in GDP, GNI
Austria
Belgium
Bulgaria
Croatia
Denmark
Estonia
Finland
France
Germany
Greece
Hungary
IrelandIreland GNI*
Italy
Lithuania
Luxembourg
Malta
NetherlandsNorway
Poland
Portugal
Slovakia
Slovenia
Spain
SwedenUnited Kingdom
76
78
80
82
84
86
88
90
5 10 15 20 25 30
% N
ot
in P
ove
rty
Age-Adjusted Public Social Protection Expenditure % of GDP (2005-2014)

37
and GNI* terms. The DEA analysis suggest that there are possible small savings and gains to
be made. Likewise the DEA analysis indicates that overall, Ireland is relatively efficient in social
protection expenditure in reducing poverty. There are possible gains that can be made on
outcomes analysed in this study.
Table: DEA Efficiency Scores of Input and Output/Outcomes
GDP Age-Adjusted
GDP Age-Adjusted
GNI Age-Adjusted
GNI*
Education Pisa Scores 0.821 1 0.993 0.989 Participation Rate 0.937 1 0.993 0.926 Health Life Expectancy 0.803 0.982 0.982 0.982 Healthy Life Years 0.982 0.982 0.982 0.982 Non-Communicable Disease 0.978 0.987 0.987 0.987 Social Protection Disability Poverty 0.988 0.979 0.884 0.887 Unemployment Poverty 0.655 0.996 0.784 0.793 Risk of Poverty 0.987 1 0.947 0.949
Public spending on health in Ireland needs to be reviewed and evaluated. The results of DEA
indicates that there are inefficiencies in Ireland’s public health expenditure. Ireland has a
relatively high level of health expenditure in comparison to it EU peers. Ireland is not
achieving the most possible level of efficiency from input. Inefficiency in health expenditure
is more pronounced when age adjustments is made to expenditure in GDP, GNI and GNI*
terms. The DEA analysis estimates that there are considerable savings to be made on input as
well as gains on outputs/outcomes.

38
5. Key Findings
1. Irelands expenditure time-series comparisons are more volatile than other EA countries
The impact of economic output measurements are significantly higher in Ireland than most
other countries in the EA. This is also the case for the new GNI* metric calculated by the CSO,
where the volatility is higher than all the other countries GDP figures in the sample. This
causes Ireland’s comparative position to vary significantly over time.
2. Ireland’s overall spending is close to the Euro-Area average when age and GNI* are
accounted for
On first glance, spending as a percentage of GDP is well below EA norms. However, once
taking account of certain differences between Ireland and other EA countries, this gap in
spending tends to shrink. Firstly, comparing against GNI across all countries, and then using
GNI* for Ireland the gap in total spending decreases from 20% of GDP to 5% of GNI*. Secondly,
accounting for the differing age structures across EA countries, the gap as a percentage of
GNI* falls further to only -0.6%.
3. However, the differences in sectoral spending are notable
In terms of the key sectors, the two that stand out persistently over time are health and social
protection. Health appears to be at or slightly under the average spending across the EA as a
% of GDP. However, this picture changes when using other economic output bases and
accounting for age, where it is shown that Irish health expenditure is well above average. The
spending on social protection is well below average using all economic output bases and even
after adjusting for age. This is driven by lower than average spending on ‘old-age’ compared
with the EA.
4. Ireland is relatively efficient in Education and Social Protection expenditure
The results of the DEA analysis indicates overall, that there are savings to be made for expenditure as
well as gains on outcomes. Ireland is relatively efficient in education. Ireland spends less on education
than most of its EU peers and achieves a relatively efficient outcomes. However, this is less true when
age adjustments are made to expenditure in GDP, GNI and GNI* terms, so it appears that
improvements in outcomes could be achieved. Likewise the DEA analysis indicates that overall, Ireland

39
is relatively efficient in social protection expenditure in reducing poverty, but proves to be less true
when spending is adjusted for age profiles.
5. Inefficiencies in Ireland’s public health expenditure
Ireland has a relatively high level of health expenditure in comparison to it EU peers. Ireland
is not achieving the most possible level of efficiency from input. Inefficiency in health
expenditure is more pronounced when age adjustments is made to expenditure in GDP, GNI
and GNI* terms. The DEA analysis estimates that there are considerable savings to be made
on input as well as gains on outputs/outcomes.

40
Appendix 1: Functions of Government Spending (COFOG)
Green cells age-adjusted to reflect older-age cohorts and blue cells for younger-age
cohorts.
Code Name (Heading in bold) Code Name (Heading in bold)
Total Total GF 6 Housing and community amenities
GF 1 General public services GF 6.1 Housing development
GF 1.1 Executive and legislative organs, financial and fiscal affairs, external affairs
GF 6.2 Community development
GF 1.2 Foreign economic aid GF 6.3 Water supply
GF 1.3 General services GF 6.4 Street lighting
GF 1.4 Basic research GF 6.5 R&D Housing and community amenities
GF 1.5 R&D General public services GF 6.6 Housing and community amenities n.e.c.
GF 1.6 General public services n.e.c. GF 7 Health
GF 1.7 Public debt transactions GF 7.1 Medical products, appliances and equipment
GF 1.8 Transfers of a general character between different levels of government
GF 7.2 Outpatient services
GF 2 Defence GF 7.3 Hospital services
GF 2.1 Military defence GF 7.4 Public health services
GF 2.2 Civil defence GF 7.5 R&D Health
GF 2.3 Foreign military aid GF 7.6 Health n.e.c.
GF 2.4 R&D Defence GF 8 Recreation, culture and religion
GF 2.5 Defence n.e.c. GF 8.1 Recreational and sporting services
GF 3 Public order and safety GF 8.2 Cultural services
GF 3.1 Police services GF 8.3 Broadcasting and publishing services
GF 3.2 Fire-protection services GF 8.4 Religious and other community services
GF 3.3 Law courts GF 8.5 R&D Recreation, culture and religion
GF 3.4 Prisons GF 8.6 Recreation, culture and religion n.e.c.
GF 3.5 R&D Public order and safety GF 9 Education
GF 3.6 Public order and safety n.e.c. GF 9.1 Pre-primary and primary education
GF 4 Economic affairs GF 9.2 Secondary education
GF 4.1 General economic, commercial and labour affairs
GF 9.3 Post-secondary non-tertiary education
GF 4.2 Agriculture, forestry, fishing and hunting GF 9.4 Tertiary education
GF 4.3 Fuel and energy GF 9.5 Education not definable by level
GF 4.4 Mining, manufacturing and construction GF 9.6 Subsidiary services to education
GF 4.5 Transport GF 9.7 R&D Education
GF 4.6 Communication GF 9.8 Education n.e.c.
GF 4.7 Other industries GF 10 Social protection
GF 4.8 R&D Economic affairs GF 10.1 Sickness and disability
GF 4.9 Economic affairs n.e.c. GF 10.2 Old age
GF 5 Environment protection GF 10.3 Survivors
GF 5.1 Waste management GF 10.4 Family and children
GF 5.2 Waste water management GF 10.5 Unemployment
GF 5.3 Pollution abatement GF 10.6 Housing
GF 5.4 Protection of biodiversity and landscape GF 10.7 Social exclusion n.e.c.
GF 5.5 R&D Environmental protection GF 10.8 R&D Social protection
GF 5.6 Environmental protection n.e.c. GF 10.9 Social protection n.e.c.

41
Quality assurance process To ensure accuracy and methodological rigour, the author engaged in the following quality assurance process.
Internal/Departmental Line management Spending Review Steering group Other divisions/sections
Peer review (IGEES network, seminars, conferences etc.)
External
Other Government Department
Steering group
Quality Assurance Group (QAG)
Peer review (IGEES network, seminars, conferences etc.)
External expert(s)
Other (relevant details)