Embed Size (px)
Citation preview

Based on research by Pedro Cerdan-Infantes, Yulia Makarova, Samer Al-Samarrai, Dandan Chen, Yus Medina, Imam Setiawan and Steisianasari Mileiva.The Government of the Kingdom of the Netherlands and the European Union have provided grants for the Basic Education Capacity Trust Fund (BEC-TF) with the purpose of supporting the Government of Indonesia in improving the delivery of decentralized basic education. Managed by the World Bank, the BEC-TF supports analytical work and thematic dialog in education between the Government and development partners at the national level. At local government level, it supports capacity development and strengthening of systems for planning, budgeting, fi nancial and information management in the education sector.
The fi ndings, interpretations and conclusions expressed in this publication do not necessarily refl ect the views of the Government of Indonesia, the Government of the Kingdom of the Netherlands, or the European Union.
For more information, please contact:Human Development Sector
World Bank Offi ce Jakarta
Indonesia Stock Exchange Building,Tower 2, 12th FloorJl. Jenderal Sudirman Kav. 52-53Phone: (021) 5299 3000Fax: (021) 5299 3111www.worldbank.org/id/education printed on recycled paper
5
Phot
o cr
edit:
Wor
ld B
ank
March 2013
Spending more or Spending Better: Improving Education Financing in Indonesia
EUROPEAN UNION
Policy Brief
1. The Government of Indonesia’s “20 percent rule,” which allocates 20 percent of government spending to education, has provided a signifi cant increase in education resources
Indonesia has made a clear commitment to education, passing a constitutional mandate to allocate at least 20 percent of the total government budget to education.1 This has led to a large increase in resources -- more than a doubling of education spending in real terms since the passage of the constitutional amendment in 2002, with the largest jump occurring in 2009, after the rule was defi ned and clarifi ed by the Constitutional Court. Between 2008 and 2009, the education budget increased by 17 percent in real terms, the equivalent of an additional 6 percent of the national budget (Figure 1).
Figure 1: Public Expenditure on Education, 2001-2010
11.4
15.0 15.914.4 14.5
14.5
16.3
16.4
21.9 21.1
15.6
21.7 20.9
0
5
10
15
20
25
0
70
140
210
280
350
2001 2002 2003 2004 2005 2006 2007 2008 2009 2010
PercentIDR trillion
Real spending,
2009 prices (LHS)
Nominal spending (LHS)
realized education expenditure
as % total national expenditure
planned education expenditure
as % total national expenditure
Source: World Bank staff estimates based on MoF, APBD and BPS data.
1 The 20 percent rule requires the allocation of minimum 20 percent of the total state budget (central government expenditure and transfers to regions) to education (Ministry of Finance Decree 86, 2009).
This policy note summarizes the fi ndings and recommendations from the recent Indonesia Education Public Expenditure Review (PER)2, which examines in detail how these additional resources were spent and the extent to which they have translated into outcomes, with the ultimate objective of providing recommendations to improve outcomes by improving the quality of spending.
2. The signifi cant increase in spending has been accompanied by important progress in access and equity of education, but quality remains an issue
The biggest payoff for this increase in spending has been in terms of access and equity in basic education; however access to senior secondary and especially tertiary education remains low, especially for the poor. There has been rapid progress in access and equity over the last 5 years, with children from poor families enrolling earlier and staying in school longer. The share of 15 year olds from the poorest consumption quintile who enrolled in school increased from 60 to 80 percent between 2006 and 2010. However, beyond the age of 15, the share of children enrolled from the poorest quintile drops dramatically, and by higher education, falls to less than 2 percent. Only 40 percent of 19 year olds from the richest quintile were enrolled in school in 2010, a share that, worryingly, did not change since 2006.
Figure 2: Share of children enrolled in school by age and quintile, 2006 and 2010
Age
Sh
are
in
Sch
oo
l
0
90%
100%
Poorest Quintile
2006
201080%
70%
60%
50%
40%
30%
20%
10%
Sh
are
in
Sch
oo
l
Age
0%
10%
20%
30%
40%
50%
60%
70%
80%
90%
100%
Richest Quintile
2006
2010
Source: Own calculations using Susenas, 2006 and 2010
2 World Bank (2013), Spending more or spending better: Improving education fi nancing in Indonesia.
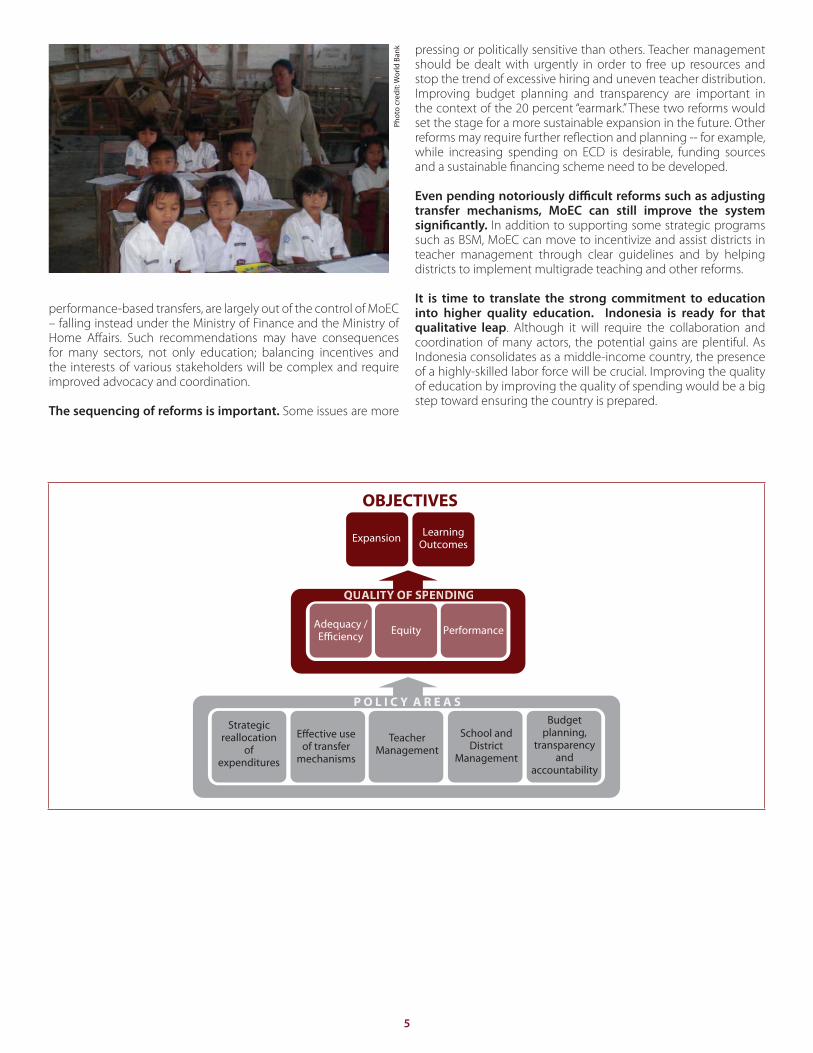
performance-based transfers, are largely out of the control of MoEC – falling instead under the Ministry of Finance and the Ministry of Home Aff airs. Such recommendations may have consequences for many sectors, not only education; balancing incentives and the interests of various stakeholders will be complex and require improved advocacy and coordination.
The sequencing of reforms is important. Some issues are more
pressing or politically sensitive than others. Teacher management should be dealt with urgently in order to free up resources and stop the trend of excessive hiring and uneven teacher distribution. Improving budget planning and transparency are important in the context of the 20 percent “earmark.” These two reforms would set the stage for a more sustainable expansion in the future. Other reforms may require further refl ection and planning -- for example, while increasing spending on ECD is desirable, funding sources and a sustainable fi nancing scheme need to be developed.
Even pending notoriously diffi cult reforms such as adjusting transfer mechanisms, MoEC can still improve the system signifi cantly. In addition to supporting some strategic programs such as BSM, MoEC can move to incentivize and assist districts in teacher management through clear guidelines and by helping districts to implement multigrade teaching and other reforms.
It is time to translate the strong commitment to education into higher quality education. Indonesia is ready for that qualitative leap. Although it will require the collaboration and coordination of many actors, the potential gains are plentiful. As Indonesia consolidates as a middle-income country, the presence of a highly-skilled labor force will be crucial. Improving the quality of education by improving the quality of spending would be a big step toward ensuring the country is prepared.
OBJECTIVES
Expansion LearningOutcomes
Adequacy / Equity Performance
QUALITY OF SPENDING
P O L I C Y A R E A S
Strategic reallocation
of expenditures
of transfer mechanisms
Budget planning,
transparency and
accountability
Teacher Management
School and District
Management
Strategic reallocationof expenditure
Towards ECD, Senior Secondary, HETowards scholarships
Towards non-salary spendingTowards supporting schools
MoEC
District
transfer mechanism
Incentives for districts
DAU reformPerformance Based Transfer
MoEC
MoF - MoHA
Teacher Management:
GuidelinesRegulations
Redistribute before hiringIncentives for teachers
MoEC
District
DAU reformJoint Decree
MoF - MoHA - MenPAN - MoRA
School and DistrictManagement
MoEC
District
Expand BOSDAExperiment with equity and performance-based formulas.
Provide incentives for BOSDAProvide support for low capacitydistricts
Budget planning, transparency and
accountability
MoEC
District
Improve budget reporting:more timely, more complete
Increase transparency in theuse of budget “windfalls”Increase amount in "education endowment fund"
MoF
Guidelines for "education endowment fund"Reformating district reporting
Phot
o cr
edit:
Wor
ld B
ank
Pub
lic D
iscl
osur
e A
utho
rized
Pub
lic D
iscl
osur
e A
utho
rized
Pub
lic D
iscl
osur
e A
utho
rized
Pub
lic D
iscl
osur
e A
utho
rized
Pub
lic D
iscl
osur
e A
utho
rized
Pub
lic D
iscl
osur
e A
utho
rized
Pub
lic D
iscl
osur
e A
utho
rized
Pub
lic D
iscl
osur
e A
utho
rized

2 3 4
On the quality side, learning outcomes are still low and there are worrisome trends in math and science. The share of top performers is extremely low. Indonesia generally scores at the bottom on international tests (TIMSS, PIRLS and PISA3) including when compared to other countries in the region. On PISA, the test with the most recent result and a longer time trend, the scores are mixed. While reading has shown steady improvement since 2000, math and science have not. Moreover on both TIMSS and PIRLS, the share of top performers is extremely low: on PISA, no student performed at the highest level in math or science in 2009. Given recent evidence linking PISA scores and the percentage of top performers with GDP growth4, it is clear that increasing the quality of education must be a top priority.
Figure 3: Indonesia PISA scores in mathematics, reading and science, average scores, 2000-2009
Subjects
Indonesia's score on PISA
330
340
350
360
370
380
390
400
410
Mathematics Reading Science
PIS
A s
core
s
2000
2003
2006
2009
Source: PISA, OECD
3. Ineffi cient spending, particularly on teachers, helps to explain why increased resources have not translated into suffi cient improvements in learning outcomes
Between 2008 and 2009, spending on education increased by 17 percent in real terms but basic education still received most of the additional budget. The composition of spending by level of education changed slightly, with senior secondary and higher education receiving slightly higher shares of the total budget. Comparing Indonesia to other countries in the region it
3 TIMSS: Trends in International Mathematics and Science Study; PIRLS: Progress in International Reading Literacy Study; PISA: Program for International Student Assessment.
4 Hanushek and Wößmann (2007), Education Quality and Economic Growth; Pritchett (2009), Long-Term Global Challenges in education: Are There Feasible Steps Today? Pritchett and Viarengo (2009), Producing Superstars for the Economic Mundial: The Mexican Predicament with Quality of Education.
is clear that this composition will have to change in the future. The share of the budget going to non-basic education will likely increase more rapidly in the near future.
Figure 4: Distribution of the budget by level of education, 2008-2009
58 56
9 10
8 11
23 21
0.0
10.0
20.0
30.0
40.0
50.0
60.0
70.0
80.0
90.0
100.0
2008 2009
pe
rce
nt
ECD Basic Education
Senior Sec. education Universities
other program
0
10
20
30
40
50
60
70
80
90
100
Pe
rce
nt
of
ed
uca
tio
n b
ud
ge
t b
y l
ev
el
Source: World Bank calculations using MoF, SKID for Indonesia; Edstats for international comparisons
More important is the destination of these funds: more than half of the additional resources went to teacher salaries and teacher certifi cation. The increase in spending on teacher salaries was driven mostly by increases in the total number of teachers, but the “regularization” of contract teachers to civil servant status also played a part. Indonesia already had one of the lowest student teacher ratios in the world in 2005 but the number of teachers has outgrown the number of students every year since 2004.5 Given this rate of growth, what keeps the salary bill sustainable is the high reliance on contract teachers (40 percent of the teaching body) with substantially lower salaries than civil servants. Therefore the increase in regularization is worrisome. We estimate that converting all teachers to civil servants would increase the salary bill by at least 50 percent, while providing certifi cation allowances would more than double the salary bill. Given the current number of teachers, both of these goals would be fi scally unfeasible.
The problem with spending on increasing the number of teachers is that given the current levels of student teacher ratios, adding new teachers does not lead to better learning outcomes. At the school level, there is no correlation between additional teachers and learning outcomes in basic education, either in Bahasa or in math (fi gure 6, math not shown). Similarly, per student spending at the district level (which is largely driven by teacher salaries and certifi cation) is not correlated with results on national exams. Both graphs suggest that adding teachers will not result in better learning outcomes.
5 World Bank. 2010b. “Transforming Indonesia’s Teaching Force.” World Bank, Jakarta, Indonesia
Meanwhile, as currently implemented, the teacher certifi cation program (which absorbs 9 percent of the education budget), has shown no signifi cant impact on learning outcomes. Initially intended to improve teacher competencies and attract the best and the brightest to the profession, the program may have been weakened by the option of a simplifi ed procedure for certifi cation called “portfolio certifi cation”. With this option, teachers became eligible for certifi cation by providing evidence of past training and experience, without the need for further training or testing. An early evaluation shows that while the program improved the livelihoods of teachers, it did not lead to improvements in learning outcomes for students.6 Indeed, when looking at scores in math and Bahasa Indonesia, there is no signifi cant diff erence between students of certifi ed and of non-certifi ed teachers. Thus the eff ects of certifi cation on learning do not seem commensurate with the high cost of the program.
6 De Ree (2012), Teacher certifi cation in Indonesia: A doubling of salary, or a way to improve learning?
4. Indonesia needs to spend better to ensure that resources are translated into improved effi ciency (adequacy), equity and performance in education.
The amount of resources available for education in Indonesia is largely adequate -- the key is to ensure that the resources are well spent. Judging by international comparisons, after the 20 percent rule, Indonesia’s spending on education is largely adequate. Relative to its level of income, Indonesia still spends slightly less than other middle-income countries, especially in secondary education, but relative to its overall government spending Indonesia is at the higher end of the distribution. Few countries spend more than 20 percent of their budgets on education. However, the distribution of resources can be improved.
Some decisions can be directly made at the central level: reallocating resources across levels of education and improving important central government programs, including scholarships. Early childhood education, senior secondary and higher education are underfunded by international standards, and scholarships received only 1 percent of the total budget in 2009. Increasing funding for these levels will require
more effi cient spending in other areas, such as basic education and especially teacher management.
Expanding and improving the Scholarships for the Poor program (Bantuan Siswa Miskin, BSM) will increase equity of access to education. Increasing the scholarship amounts, expanding coverage, improving targeting, aligning the disbursement of the benefi t with the timing of the expenditures and possibly providing an incentive “transition” bonus when children make the leap to the next level of schooling, would greatly improve equity in spending. The ideal scenario would cover 100 percent of the cost for all poor students from SD to SMA. This would ensure that cost is not a reason for dropping out.
The teacher certifi cation program needs to be reassessed, since it is not delivering the expected results. While certifi ed teachers are less likely to hold second jobs, students of certifi ed teachers do not perform signifi cantly better on tests. The introduction of compulsory competency tests to be eligible for certifi cation and a recertifi cation requirement may improve the impact of the program. A promising step is the inclusion in 2012 of a competency-test to determine eligibility before a teacher starts the certifi cation process.
5. The central government must provide the right incentives for district governments when it comes to improving teacher management and budget planning. The central government can also better support districts in managing and funding schools.
Districts are responsible for over 60 percent of the total education budget and manage two of the most important inputs in basic education: schools and teachers. However districts rely on central government transfers to pay for teacher salaries. The central government, therefore, can play a stronger role in district decision-making, including through a more eff ective use of transfer mechanisms, providing the right incentives for district governments to improve teacher management, spend less on teachers and more on managing and funding schools.
Districts face incentive to overstaff from two central government sources: i) the sub-national transfer formulas (DAU) and ii) the guidelines for teacher distribution. The basic allocation component of the DAU formula (the main transfer from central to sub-national governments) is based partly on the number of civil servants in a district, which provides an incentive to hire teachers rather than redistribute them when needed. In addition, the guidelines for teacher allocation7 tend to support high teacher numbers, especially in small schools, as they are based on teaching groups as opposed to student-teacher ratios. By tackling these two issues, and expanding the performance-based component of its spending, the central government can improve the effi ciency of education spending.
Reallocating teachers across schools would improve equity and effi ciency; however the sheer size of the reallocation required makes it diffi cult in the short term. Despite the low overall STRs, there are massive diff erences in the availability and qualifi cations of teachers across schools and regions, with a clear disadvantage for rural and remote areas. One way to address the issue of equity is through the reallocation of teachers. However,
7 Joint Decree between Five Ministries – Ministry of Education and Culture, Ministry of Religious Aff airs, Ministry of Home Aff airs, Ministry of Finance and Ministry of Sate Apparatus and Bureaucracy Reform; issued in October 2011.
using the latest government teacher allocation guidelines, we estimate that about 340,000 teachers, or 17 percent of the teaching force, would need to be transferred to ensure all schools have the minimum number of teachers. While most of this reallocation could occur within districts, there is still a need to shift teachers across districts and even provinces. The size of the reallocation and the lack of clear mechanisms for these transfers make realizing these effi ciency and equity gains diffi cult to achieve in the short period of time of validity of the decree.
There is also a need to revisit school planning, particularly when it comes to dealing with the high share of small schools. Dealing eff ectively with small schools through the reallocation of teachers should be considered a medium-term strategy, but there are more immediate measures that can be expanded. Multigrade and cluster teaching (whereby teachers teach more than one grade level or more than one subject) can be eff ective models for small schools, but districts need support in their implementation. In addition, existing incentives for teaching in remote areas could be clarifi ed and expanded, though the evidence on the eff ectiveness of these types of incentives is mixed. Contract teachers should be used to deal with shortages more strategically.
Improving district support and funding to schools. More than half of local governments support schools by providing (small) discretionary funds directly through the BOSDA program. A majority of these provide top-up funds using the same per student formula as the central government’s BOS program, and a few are experimenting with alternative formulas (per school, per teacher, equity-based formulas and even some performance-based formulas). The Indonesia Education PER report demonstrates that these additional discretionary funds are associated with better learning outcomes. BOSDA also has the potential to improve district management by allowing districts to allocate resources more equitably and introducing more active district involvement in school management.
Improved budget reporting is needed to ensure accountability and transparency in the planning and allocation of resources. The 20 percent rule makes holding spending agencies accountable more challenging because the pressure to show results at the time of budgetary decision-making is now diminished (the 20 percent is “guaranteed.”) In order to ensure that the additional resources are spent in a transparent manner, linked to long-term development objectives and specifi c program needs, it is important to improve education budget reporting at the sub-national level and to develop and report budget priorities for mid-year windfalls at the national level. Other important areas include improving the Ministry of Education and Culture (MoEC)’s monitoring and evaluation and moving towards performance-informed budgeting. In addition, the existing National Education Development Fund, which receives a proportion of the windfalls, can benefi t from clear guidelines and a mid-term expenditure framework.
6. Better cooperation between multiple stakeholders and the right sequencing of reforms can help Indonesia improve the quality of education spending.
Implementing all these reforms will be challenging due to the complex political economy. Reforms that involve one stakeholder can be relatively easy to implement; expanding BSM or increasing funding for higher education are relatively straightforward. However, reforms that involve multiple stakeholders can prove impossible if interests are not aligned. Some policy recommendations, such as improving the use of transfer mechanisms and increasing
Figure 5: Distribution of additional funds from the 20 percent rule by program, 2009
a) Distribution of additional funds b) Growth in number of students and number of teachers by level of education, 2004-2010
911
1
2
1
2
2
25
6
0
5
10
15
20
25
2006-08 2009
% o
f To
tal
Sta
te B
ud
ge
t
Other programs and
BOS
Universities
PrimaryKindergartenJunior
SecondarySenior
Secondary
20
04
20
06
20
08
20
10
20
04
20
06
20
08
20
10
20
04
20
06
20
08
20
10
20
04
20
06
20
08
20
10
20
04
20
06
20
08
20
10
VocationalSchool
Number of teachers
Number of student
80
100
120
140
160
180
200
Index (2004-100)
80
100
120
140
160
180
200
Source: a) World Bank elaboration using MoF, SIKD. b) MoEC, TK: kindergarten/pre-school, SD: primary school, SMP: junior secondary school, SMA: senior secondary school, SMK: vocational senior secondary school
F igure 6: Student-teacher ratio, per-student spending and test scores in public schools
a) Student-Teacher Ratio vs Bahasa scores b) District Spending vs National Exams
0
10
20
30
40
50
60
70
80
-20
0
20
40
60
cha
ng
e in
Na
tio
nal
exa
m s
core
in S
MP
%
-100 0 100 200 300 change in real education expenditure %
Change of SMP UN score & Education Expenditure
Fitted Line
Source: School Based Management Survey, World Bank-RAND (2010)
Phot
o cr
edit:
Rat
na K
esum
a
Based on research by Pedro Cerdan-Infantes, Yulia Makarova, Samer Al-Samarrai, Dandan Chen, Yus Medina, Imam Setiawan and Steisianasari Mileiva.The Government of the Kingdom of the Netherlands and the European Union have provided grants for the Basic Education Capacity Trust Fund (BEC-TF) with the purpose of supporting the Government of Indonesia in improving the delivery of decentralized basic education. Managed by the World Bank, the BEC-TF supports analytical work and thematic dialog in education between the Government and development partners at the national level. At local government level, it supports capacity development and strengthening of systems for planning, budgeting, fi nancial and information management in the education sector.
The fi ndings, interpretations and conclusions expressed in this publication do not necessarily refl ect the views of the Government of Indonesia, the Government of the Kingdom of the Netherlands, or the European Union.
For more information, please contact:Human Development Sector
World Bank Offi ce Jakarta
Indonesia Stock Exchange Building,Tower 2, 12th FloorJl. Jenderal Sudirman Kav. 52-53Phone: (021) 5299 3000Fax: (021) 5299 3111www.worldbank.org/id/education printed on recycled paper
5
Phot
o cr
edit:
Wor
ld B
ank
March 2013
Spending more or Spending Better: Improving Education Financing in Indonesia
EUROPEAN UNION
Policy Brief
1. The Government of Indonesia’s “20 percent rule,” which allocates 20 percent of government spending to education, has provided a signifi cant increase in education resources
Indonesia has made a clear commitment to education, passing a constitutional mandate to allocate at least 20 percent of the total government budget to education.1 This has led to a large increase in resources -- more than a doubling of education spending in real terms since the passage of the constitutional amendment in 2002, with the largest jump occurring in 2009, after the rule was defi ned and clarifi ed by the Constitutional Court. Between 2008 and 2009, the education budget increased by 17 percent in real terms, the equivalent of an additional 6 percent of the national budget (Figure 1).
Figure 1: Public Expenditure on Education, 2001-2010
11.4
15.0 15.914.4 14.5
14.5
16.3
16.4
21.9 21.1
15.6
21.7 20.9
0
5
10
15
20
25
0
70
140
210
280
350
2001 2002 2003 2004 2005 2006 2007 2008 2009 2010
PercentIDR trillion
Real spending,
2009 prices (LHS)
Nominal spending (LHS)
realized education expenditure
as % total national expenditure
planned education expenditure
as % total national expenditure
Source: World Bank staff estimates based on MoF, APBD and BPS data.
1 The 20 percent rule requires the allocation of minimum 20 percent of the total state budget (central government expenditure and transfers to regions) to education (Ministry of Finance Decree 86, 2009).
This policy note summarizes the fi ndings and recommendations from the recent Indonesia Education Public Expenditure Review (PER)2, which examines in detail how these additional resources were spent and the extent to which they have translated into outcomes, with the ultimate objective of providing recommendations to improve outcomes by improving the quality of spending.
2. The signifi cant increase in spending has been accompanied by important progress in access and equity of education, but quality remains an issue
The biggest payoff for this increase in spending has been in terms of access and equity in basic education; however access to senior secondary and especially tertiary education remains low, especially for the poor. There has been rapid progress in access and equity over the last 5 years, with children from poor families enrolling earlier and staying in school longer. The share of 15 year olds from the poorest consumption quintile who enrolled in school increased from 60 to 80 percent between 2006 and 2010. However, beyond the age of 15, the share of children enrolled from the poorest quintile drops dramatically, and by higher education, falls to less than 2 percent. Only 40 percent of 19 year olds from the richest quintile were enrolled in school in 2010, a share that, worryingly, did not change since 2006.
Figure 2: Share of children enrolled in school by age and quintile, 2006 and 2010
Age
Sh
are
in
Sch
oo
l
0
90%
100%
Poorest Quintile
2006
201080%
70%
60%
50%
40%
30%
20%
10%
Sh
are
in
Sch
oo
l
Age
0%
10%
20%
30%
40%
50%
60%
70%
80%
90%
100%
Richest Quintile
2006
2010
Source: Own calculations using Susenas, 2006 and 2010
2 World Bank (2013), Spending more or spending better: Improving education fi nancing in Indonesia.
performance-based transfers, are largely out of the control of MoEC – falling instead under the Ministry of Finance and the Ministry of Home Aff airs. Such recommendations may have consequences for many sectors, not only education; balancing incentives and the interests of various stakeholders will be complex and require improved advocacy and coordination.
The sequencing of reforms is important. Some issues are more
pressing or politically sensitive than others. Teacher management should be dealt with urgently in order to free up resources and stop the trend of excessive hiring and uneven teacher distribution. Improving budget planning and transparency are important in the context of the 20 percent “earmark.” These two reforms would set the stage for a more sustainable expansion in the future. Other reforms may require further refl ection and planning -- for example, while increasing spending on ECD is desirable, funding sources and a sustainable fi nancing scheme need to be developed.
Even pending notoriously diffi cult reforms such as adjusting transfer mechanisms, MoEC can still improve the system signifi cantly. In addition to supporting some strategic programs such as BSM, MoEC can move to incentivize and assist districts in teacher management through clear guidelines and by helping districts to implement multigrade teaching and other reforms.
It is time to translate the strong commitment to education into higher quality education. Indonesia is ready for that qualitative leap. Although it will require the collaboration and coordination of many actors, the potential gains are plentiful. As Indonesia consolidates as a middle-income country, the presence of a highly-skilled labor force will be crucial. Improving the quality of education by improving the quality of spending would be a big step toward ensuring the country is prepared.
OBJECTIVES
Expansion LearningOutcomes
Adequacy / Equity Performance
QUALITY OF SPENDING
P O L I C Y A R E A S
Strategic reallocation
of expenditures
of transfer mechanisms
Budget planning,
transparency and
accountability
Teacher Management
School and District
Management
Strategic reallocationof expenditure
Towards ECD, Senior Secondary, HETowards scholarships
Towards non-salary spendingTowards supporting schools
MoEC
District
transfer mechanism
Incentives for districts
DAU reformPerformance Based Transfer
MoEC
MoF - MoHA
Teacher Management:
GuidelinesRegulations
Redistribute before hiringIncentives for teachers
MoEC
District
DAU reformJoint Decree
MoF - MoHA - MenPAN - MoRA
School and DistrictManagement
MoEC
District
Expand BOSDAExperiment with equity and performance-based formulas.
Provide incentives for BOSDAProvide support for low capacitydistricts
Budget planning, transparency and
accountability
MoEC
District
Improve budget reporting:more timely, more complete
Increase transparency in theuse of budget “windfalls”Increase amount in "education endowment fund"
MoF
Guidelines for "education endowment fund"Reformating district reporting
Phot
o cr
edit:
Wor
ld B
ank


![Are You Spending Your PPC Budget Wisely [Webinar]](https://img.dokumen.tips/doc/110x75/5481229eb4af9fef158b5f84/are-you-spending-your-ppc-budget-wisely-webinar.jpg)