Embed Size (px)
Citation preview

Stephen F. Austin State UniversitySFA ScholarWorks
Electronic Theses and Dissertations
Spring 5-12-2018
Speleogenetic Evolution and Geological RemoteSensing of the Gypsum Plain, Eddy County, NewMexicoJessica [email protected]
Follow this and additional works at: https://scholarworks.sfasu.edu/etds
Part of the Environmental Studies Commons, Geology Commons, Natural Resources andConservation Commons, Natural Resources Management and Policy Commons, Oil, Gas, andEnergy Commons, Speleology Commons, and the Water Resource Management CommonsTell us how this article helped you.
This Thesis is brought to you for free and open access by SFA ScholarWorks. It has been accepted for inclusion in Electronic Theses and Dissertationsby an authorized administrator of SFA ScholarWorks. For more information, please contact [email protected].
Repository CitationShields, Jessica, "Speleogenetic Evolution and Geological Remote Sensing of the Gypsum Plain, Eddy County, New Mexico" (2018).Electronic Theses and Dissertations. 155.https://scholarworks.sfasu.edu/etds/155

Speleogenetic Evolution and Geological Remote Sensing of the GypsumPlain, Eddy County, New Mexico
Creative Commons License
This work is licensed under a Creative Commons Attribution-Noncommercial-No Derivative Works 4.0License.
This thesis is available at SFA ScholarWorks: https://scholarworks.sfasu.edu/etds/155
Speleogenetic Evolution and Geological Remote Sensing of the Gypsum
Plain, Eddy County, New Mexico
By
JESSICA SHIELDS, Bachelor of Science
Presented to the Faculty of the Graduate School of
Stephen F. Austin State University
In Partial Fulfillment
Of the Requirements
For the Degree of
Master of Science
STEPHEN F. AUSTIN STATE UNIVERSITY
May 2018

Speleogenetic Evolution and Geological Remote Sensing of the Gypsum
Plain, Eddy County, New Mexico
By
JESSICA SHIELDS, Bachelor of Science
_____________________________ Pauline Sampson, Ph.D. Dean of Research and Graduate Studies
APPROVED:
_____________________________ Dr. Kevin Stafford, Thesis Director
_____________________________ Dr. Melinda Faulkner, Committee Member
_____________________________ Dr. Liane Stevens, Committee Member
_____________________________ Dr. Kenneth Farrish, Committee Member

i
ABSTRACT
Permian evaporites of the Gypsum Plain region of the Delaware Basin
host extensive karst phenomena, as well as unique diagenetic alterations of host
strata. Because of the complex, poorly understood hydrogeologic system, little
has been established concerning the relation and evolution of the overprinted,
modern and ancient karst manifestations within the Gypsum Plain, as a whole.
Through a combination of traditional field studies and the development of
improved remote sensing methodologies, this study established the
speleogenetic evolution of the Gypsum Plain in relation to the greater tectonic,
stratigraphic, hydrogeologic and climatic history of the Delaware Basin.
Emphasis was focused on a 100 square kilometer area of the Gypsum Plain in
Eddy County, New Mexico, for the presence of all characteristic evaporite karst
manifestations previously reported for the region, including epikarst, epigene
caves, hypogene caves, intrastratal brecciation, calcitization and sulfur oxidation.
Late Miocene uplift and tilting of the Delaware Basin tectonic block
initiated development of dissolution and collapse of Castile strata, inducing an
early phase of hypogene karsting. Renewed uplift and tilting during the latest
Miocene, combined with increasing regional geothermal gradients, enabled
hydrocarbon maturation, evaporite calcitization and additional hypogene porosity

ii
development. Pleistocene climate fluctuations increased denudation and
exposed Castile evaporites to epigene development, while migration of the
Pecos River across the area during the late Eocene enhanced karst processes.
Karsting slowed with the Holocene shift to the current warm, arid climate, but
solutional processes remain active with the general eastward migration of the
hydrogeologic system.
Traditional karst studies such as this are often costly and require months,
if not years, of physical fieldwork. Preliminary identification of areas of interest
through the careful evaluation of geologic maps offers a more efficient approach.
However, published geologic maps of the Gypsum Plain feature little to no detail
of lithologic variability, a vital attribute when dealing with phenomena dm2 to tens
of m2 in area. Therefore, 50 centimeter spatial resolution geologic maps were
created through the classification of reflectance values of color infrared imagery
of the study area in order to better constrain spatial variability in karst processes.
Multispectral data was used for this purpose due to the high spatial resolution
commercially/publicly available over that of hyperspectral sensor’s higher
spectral resolutions and band combinations, deemed unnecessary because of
the contrasting reflectance values of surface strata across the Gypsum Plain.
Coupling of an improved speleogenetic evolution of the area with more accurate
geologic mapping enables the development of better land management practices
for karsted terrains such as the Gypsum Plain.

iii
ACKNOWLEDGMENTS
First, I would like to thank my thesis advisor, Dr. Kevin W. Stafford for the
unending support and guidance that he has provided over the course of my time
at Stephen F. Austin State University. I sincerely appreciate all that he has done
to help make this thesis a reality and the opportunity he has given me to pursue
a field that I truly enjoy. Additionally, I would like to thank the Stephen F. Austin
State University Student-Faculty Collaborative Research Program for providing
the support and funding necessary to complete this research, as well as each
member of my thesis committee: Dr. Melinda Faulkner, Dr. Liane Stevens and
Dr. Kenneth Farrish A special thank you goes to those friends and colleagues
who took the time out of their own work in order to travel to New Mexico and help
me complete my field studies: Lillian O’Shay, Sarah Zagurski, Jacob Meinerts,
Jonah Morris and Bobby Schoen. I could not have completed this study without
each and every one of you! To my parents, Mike and Kennea Shields: thank you
for all of your support and encouragement, as well as listening to me endlessly
talk about caves for the past few years. I would have never made it this far
without you.

iv
TABLE OF CONTENTS
ABSTRACT ......................................................................................................... i
ACKNOWLEDGMENTS ..................................................................................... iii
TABLE OF CONTENTS ..................................................................................... iv
LIST OF FIGURES ........................................................................................... viii
LIST OF TABLES ............................................................................................. xiv
PREFACE.......................................................................................................... xv
THE COMPLEX SPELEOGENETIC EVOLUTION OF THE GYPSUM PLAIN: EDDY COUNTY, NEW MEXICO ............................................................ 1
ABSTRACT .............................................................................................. 1
INTRODUCTION ..................................................................................... 3
GEOLOGIC AND HYDROLOGIC SETTING ............................................ 6
KARST MANIFESTATION ..................................................................... 10
SURFICIAL KARST .................................................................... 10
EPIGENE CAVES ....................................................................... 16
HYPOGENE KARST ................................................................... 23
SPELEOGENETIC EVOLUTION ........................................................... 31
CONCLUSIONS .................................................................................... 43
REFERENCES ...................................................................................... 46

v
A NOVEL APPROACH TO DELINEATING LITHOLOGIC VARIABILITY OF A KARSTED LANDSCAPE UTILIZING CIR IMAGERY AND GIS ANALYSES, EDDY COUNTY, NEW MEXICO ................................................. 54
ABSTRACT ............................................................................................ 54
INTRODUCTION ................................................................................... 56
GEOLOGIC SETTING ........................................................................... 61
MULTISPECTRAL IMAGERY DATASET AND CHARACTERIZATION .......................................................................... 68
IMAGE CLASSIFICATION ..................................................................... 71
CONCLUSIONS .................................................................................... 80
REFERENCES ...................................................................................... 83
APPENDIX (A) DETAILED LITERATURE REVIEW ......................................... 86
INTRODUCTION ................................................................................... 87
GEOLOGIC HISTORY ........................................................................... 89
GUADALUPIAN SERIES STRATIGRAPHY ............................... 92
CHERRY CANYON FORMATION ................................... 93
BELL CANYON FORMATION .......................................... 95
OCHOAN SERIES STRATIGRAPHY ......................................... 98
CASTILE FORMATION .................................................... 98
SALADO FORMATION .................................................... 99
RUSTLER FORMATION ................................................ 100
DEWEY LAKE RED BEDS ............................................. 102

vi
POST-OCHOAN STRATIGRAPHY ........................................... 103
KARST AND SPELEOLOGY ............................................................... 104
REMOTE SENSING ............................................................................ 110
REFERENCES .................................................................................... 112
APPENDIX (B) DETAILED METHODOLOGY ................................................ 119
IMAGE ANALYSES ............................................................................. 120
KARST SURVEY ................................................................................. 129
REFERENCES .................................................................................... 134
APPENDIX (C) CAVE AND KARST ............................................................... 135
CAVE INVENTORY ............................................................................. 136
BRIDGE CAVE.......................................................................... 136
DEATH CRACK AND BIG ROOM CAVES ............................... 139
FIREBALL CAVE ...................................................................... 142
GREEN MOSS CAVE ............................................................... 143
HORSESHOE CAVE ................................................................ 145
JB HOLE ................................................................................... 147
K-HILL PIT ................................................................................ 149
LOST CAVE .............................................................................. 150
NICHOLL’S CAVE ..................................................................... 152
QUILL SOIL CAVE .................................................................... 153
RED HAMMER CAVE ............................................................... 155

vii
VB HOLE .................................................................................. 156
ZOMBIE CAVE.......................................................................... 159
VITA ..................................................................................................... 161

viii
LIST OF FIGURES
Figure 1.1: Location of the study area in relation to the surrounding Gypsum Plain (comprised of Rustler and Castile formations) and the greater Delaware Basin, delineated by the subsurface Capitan Reef that outcrops in the various mountain ranges (from Stafford, 2008a) ........................................................................................ 4 Figure 1.2: Major lithologic units of the Delaware Basin deposited during the middle- to late-Permian (modified from Scholle et al., 2004) .......................................... 7 Figure 1.3: Location of features of interest within this study that correspond to the greater characteristic features of the Gypsum Plain and their relationship to the overall surface geology delineated across the site (Shields et al., submitted)… ......................................................................................... 11 Figure 1.4: Surficial karst manifestations across the study area: A) gypsic crust found across most of the study area; B) rillenkarren on exposed Castile gypsum; C) small sinkhole manifesting as a closed depression within gypsic soil; D) spitzkarren developed on gypsum breccia boulder; E) sinkhole formed in gypsum bedrock of the Castile containing the entrance to Green Moss Cave; and F) grass filled sinkhole formed within gypsite, filled by Quaternary Alluvium ......... 13 Figure 1.5. Karst mounds and areas exhibiting secondary calcitization: A) karst mounds (delineated with dashed white lines) primarily consisting Rustler strata; and B) K Hill, the largest karst mound in the study area consisting of the Rustler, Dewey Lake Red Beds and Cox strata ........................................................................ 14 Figure 1.6: Classic examples of epigene morphological features associated with gypsum caves: A) scallops lining the floor and ceiling (white circle) as well as visible dissolution within the ceiling exhibiting strong fracture control; B) Example of rapid decrease in aperture of epigene cave passage seen by the extreme drop in ceiling height over only a few meters; C) Example of visible meandering of passage created by fluid flow and entrenchment along dashed lines on the lower portion of the wall .................................................................................................................... 16 Figure 1.7: Lost Cave: A) sinkhole and entrance to Lost Cave (Eddy County, New Mexico); B) simplified map of Lost Cave ...................................................................... 18 Figure 1.8: Horseshoe Cave, Eddy County: A) entrance to Horseshoe Cave and associated residual collapse; B) narrow, entrenched epigene passage forming the first half of Horseshoe Cave; C) large block of bedrock rotated in passage as result of undercutting during floor entrenchment; D) rapid decrease in passage

ix
diameter at the back of Horseshoe Cave; and E) simplified map of Horseshoe Cave ............................................................................................................................ 19 Figure 1.9: Big Room and Death Crack caves, Eddy County: A) main room of Big Room Cave showing the soil floor and collapse breccia walls and ceiling; B) main room of Big Room Cave showing the relation of the entrance to the soil floor and brecciated walls of the cave; C) vertical, mud-draped drain within the floor of Big Room Cave formed completely within loosely consolidated collapse breccia by flow of waters into the cave primarily by large-scale rain events; and D) simplified map of Big Room Cave and Death Crack Cave ................... 21 Figure 1.10: Soil caves, Eddy County: A) simplified map of Quill Soil Cave; B) simplified map of Nicholl’s Cave .................................................................................. 22 Figure 1.11: Simplified line map of Black Dog Cave (Eddy County, New Mexico) ........................................................................................................................ 25 Figure 1.12: Features associated with dissolution breccias that have undergone calcitization: A) exposed area of secondary calcite as a blanket breccia; B) small Castile Buttes within the study area; C) zone of calcitization intersected during epigenic formation of Green Moss Cave; and D) calcitized zone of brecciation in Green Moss Cave .................................................................................................... 28
Figure 1.13: Diagram depicting the uplift and tilting experienced by the Delaware Basin tectonic block due to tectonic activity originating at the Rio Grande Rift during the early late Miocene. ................................................. 32
Figure 1.14: Diagram depicting the second pulse of uplift and tilting experienced by the Delaware Basin tectonic block during the late Miocene. ........................................................................................................... 33
Figure 1.15: Diagram depicting the beginning of epigene cave formation and denudation of the Gypsum Plain induced by the higher moisture contents of glacial periods occurring during the Pleistocene. ........................... 39
Figure 1.16: Diagram depicting the present day state of the Gypsum Plain through the Holocene. ...................................................................................... 41
Figure 2.1: Traditional geology map of the study area created on a small-scale of 1:500,000 (adapted from Green and Jones, 1997) .................... 57
Figure 2.2: Location of the study area in relation to the surrounding Gypsum Plain comprised of the Rustler and Castile formations, and the greater Delaware Basin, delineated by the subsurface extent of

x
the Capitan Reef and associated outcrops in various mountain ranges. Study area outlined in red (modified from Stafford, 2008a). ................ 59
Figure 2.3: Major lithologic units of the Delaware Basin deposited during the middle- to late-Permian with the dominant karst-bearing unit, the Castile Formation, highlighted in grey (adapted from Scholle et al.,2004) ........ 62
Figure 2.4: Common surficial karst manifestations within lithologies of interest across the study area: A) gypsic crust precipitate commonly deposited across a large portion of the study area; B) example of rillenkarren formed within exposed bedrock of the Castile gypsum; C) small-scale closed sinkhole formed due to subsurface collapse within alluvium; D) example of spitzkarren formed on an exposed surface of a gypsum breccia boulder of the Castile Formation; E) open sinkhole containing the entrance to Green Moss Cave formed within bedrock of the Castile gypsum; and F) closed sinkhole formed within alluvium acting as host to a dense cluster of grasses native to the Gypsum Plain.................... 64
Figure 2.5: Karst mounds and areas exhibiting secondary calcitization: A) karst mounds (delineated with dashed white lines) primarily consisting of Rustler strata; B) K Hill, the largest karst mound in the study area consisting of Rustler, Dewey Lake Red Beds and Cox strata; C) laterally extensive calcitized blanket breccia; and D) small Castile butte located within the study area consisting of brecciated Castile gypsum that has been calcitized .................................................................................................. 66
Figure 2.6: Location of each control point identified and field checked for nine of the 10 classes used for later classification of the color-infrared data set (control points were not established for “Vegetation”). Chart (top left) details the number of control points across the landscape corresponding to each class identified in the field ............................................ 73
Figure 2.7: Color-infrared imagery of selected sites of interest evaluated, including: A) relative location of three sites within larger study area (see figure 1 for reference location of Figure 8A); B) clustered area of exposed calcitized breccia and one of the two Castile buttes located in the study area; C) K Hill karst mound remnant of paleocavern breccia infilling; and D) clustered area of karst mounds composed of Rustler collapse strata ................................................................................................................ 75
Figure 2.8: Final Maximum Likelihood Classification rasters produced for each of the three areas of interest from figure 2-7: A) relative
xi
location of three sites within larger study area (see figure 1 for reference location of Figure 8A); B) clustered area of exposed calcitized breccia and one of the two Castile buttes located in the study area; C) K Hill karst mound remnant of paleocavern breccia infilling; and D) clustered area of karst mounds composed of Rustler collapse strata. ..................................................................................... 77
Figure 2.9: Final lithologic surface map of the study area based on the maximum likelihood classification performed.................................................... 78
Figure 2.10: Graph displaying the mean reflectance value of each band for the corresponding class’ training samples. Note distinct reflectance values for most sample classes ........................................................................ 79
Figure A1: Extent and location of the Delaware Basin in the Trans- Pecos Region (MB-Midland Basin: VB-Val Verde Basin) (from Stafford, 2015) ........................................................................................ 87
Figure A2: Location and relationship of major sedimentary basins associated with study (from Pioneer Natural Resources, 2016) ....................... 90
Figure A3: Lithologic units of the Delaware Basin and associated cross-section (adapted from Scholle et al., 2004)............................................. 93
Figure A4: Example of the spatial distribution of karstic depressions within the Castile Formation (from Stafford, 2015) ......................................... 104
Figure A5: Diagram illustrating the formation of blanket-dissolution breccias through the dissolution of halite. Arrows represent fluid movement (from Stafford, 2015) ..................................................................... 108
Figure A6: Diagram illustrating the formation of breccia pipes through the dissolution of halite. Arrows represent fluid movement (from Stafford, 2015) ...................................................................................... 108
Figure B1: Index map of study area showing WorldView-2 CIR imagery ....... 121
Figure B2: Location of each control point identified and field checked for nine of the 10 classes used for later classification of the color-infrared data set (Not including control points established for “Vegetation”). Chart (top left) details the number of control points across the landscape corresponding to each class identified in the field ................................................................................................................. 122

xii
Figure B3: Graph displaying the mean reflectance value of each band for the corresponding training samples, calculated and assigned within the Create Signatures File tool ....................................................................... 124
Figure B4: Final lithologic surface map of the study area based on the maximum likelihood classification performed ............................................ 128
Figure B5: Location map of control grids walked to identify cave and karst features. Caves that were surveyed are marked by a star symbol ..................................................................................................... 130
Figure B6: Example of field sketches containing morphological features from JB Hole ..................................................................................... 131
Figure B7: Example of Walls input file containing field measurements of point locations and their corresponding length, inclination, and azimuth .................................................................................................... 132
Figure B8: Plan view line plot generated by Walls from data collected in the Field ...................................................................................................... 132
Figure C1: Map of the study area detailing cave and control grid locations ......................................................................................................... 137
Figure C2: Drafted cave map of Bridge Cave ................................................. 138
Figure C3: drafted cave map of Death Crack and Big Room caves ............... 140
Figure C4: drafted cave map of Fireball Cave ................................................ 143
Figure C5: drafted cave map of Green Moss .................................................. 144
Figure C6: drafted cave map of Horseshoe Cave ........................................... 146
Figure C7: drafted cave map of JB Hole. ........................................................ 148
Figure C8: drafted cave map of K-Hill Pit ....................................................... 150
Figure C9: drafted cave map of Lost Cave ..................................................... 151
Figure C10: drafted cave map of Nicholl’s Cave............................................. 152
Figure C11: drafted cave map of Quill Soil Cave ............................................ 154

xiii
Figure C12: drafted cave map of Red Hammer Cave ..................................... 155
Figure C13 :drafted cave map of VB Hole ...................................................... 158
Figure C14: drafted cave map of Zombie Cave .............................................. 159
xiv
LIST OF TABLES
Table 1.1: Members of the Castile Formation and their corresponding variable thickness as estimated based on present day values (adapted from Kirkland, 2014). ........................................................................... 8
Table 2.1: Primary satellite sensors offering commercially-available imagery data and corresponding relevant technical specifications (adaptedfrom Harriset al., 2011) ....................................................................... 58

xv
PREFACE
Karstic development of the Gypsum Plain is the result of various complex
and extensive dissolutional and diagenetic processes induced by the tectonic,
stratigraphic, hydrogeologic and climatic history of the Delaware Basin. While
previous studies have attempted to identify the origin and formation of karst
phenomena present across the basin, little has been established concerning the
speleogenetic evolution of the region as a whole. This, and other such
characterizations of karsted terrains, is generally a costly, time consuming
endeavor, made more efficient by preliminary site evaluations for the presence of
karst phenomena through the careful study of geologic maps. Often, only small
scale geologic maps are available, which are useless for the evaluation of
features that range in area from a few dm2 to tens of m2, such as karst
manifestations of the Gypsum Plain. Remote sensing methodologies are actively
being pursued in order to offer an alternative source of geologic maps through
the classification of surface reflectance values derived from satellite imagery.
The following research established the formational history of karst of the
Gypsum Plain, as well as a novel approach to the development of new and
improved methodologies for the creation of geologic maps using multispectral
satellite data. This study aims to aid in the development of improved best
management practices of water and karst natural resources by entities such as

xvi
the Bureau of Land Management, as well as improve the efficiency of similar
studies. In addition to multiple sections focused on the previously outlined
research, a supplementary in-depth literature review, detailed methodologies
employed in both evolution and satellite imagery analyses and a complete
inventory of all caves surveyed throughout the course of this study are included
as Appendices A, B and C, respectively.

1
The Complex Speleogenetic Evolution of the Gypsum Plain:
Eddy County, New Mexico
ABSTRACT
The Permian evaporites of the Gypsum Plain of southeastern New Mexico
and West Texas host an extensive array of karst features, including epigene and
hypogene manifestations, as well as complex diagenetic alteration of strata
within a complex, poorly understood hydrogeologic system. This study attempted
to characterize and relate these manifestations within the greater tectonic,
stratigraphic, hydrogeologic and climatic regime of the Delaware Basin since
deposition of host strata in order to delineate a speleogenetic evolution of the
Gypsum Plain. Late Miocene uplift and tilting of the Delaware Basin tectonic
block initially incited development of dissolution and collapse within salt members
of the Castile Formation by initiating upward migration of fluids from underlying
formations. Brecciated zones began to form within the Castile Formation as well
as hypogene cave features. Continued uplift and tilting during the late Miocene,
combined with increasing regional thermal gradients enabled maturation of
hydrocarbons, promoted continued dissolution/collapse of strata and enabled
hydrocarbon migration to fuel sulfate reduction coupled with evaporite

2
calcitization. Climate change associated with Pleistocene glacial/interglacial
fluctuations largely sculpted the modern geomorphic landscape and formed the
majority of epigene caves within the Gypsum Plain. Additionally, migration of the
Pecos River across the Gypsum Plain during the late Eocene enhanced both
hypogene and epigene karst development, including intense localized dissolution
associated with solution-subsidence trough formation. Karst processes slowed
with a Holocene shift to the warm, arid climate experienced across the region
today, but speleogenesis remains active with the general eastward migration of
the hydrogeologic system as updip portions of the Gypsum Plain become more
heavily eroded.

3
INTRODUCTION
A wide variety of karst features characterize Permian evaporite facies of
the Gypsum Plain of southeastern New Mexico and West Texas. The region is
the site of extensive epigene and hypogene cave development, accompanied by
widespread surficial karst manifestations and related occurrences of secondary
mineralization, all of which are formed within a highly complex and poorly
understood heterogeneous hydrogeologic system. While previous studies have
attempted to identify the origin and formation of different types of karst features
present, little has been established concerning the relation and evolution of all
forms of manifestations as a whole, due to the complex nature of the system.
This study characterized and related the karst manifestations of the Gypsum
Plain to the greater tectonic, stratigraphic and hydrogeologic history of the area in
order to establish a speleogenetic evolution. The theorized model incorporates
the complexly overprinted region containing both modern and ancient karst
phenomena as well as extensive diagenetic alteration of host rock. Individual
manifestations include: epikarst, epigene caves, hypogene caves, intrastratal
brecciation, sulfate reduction and sulfur oxidation associated with an evolving
hydrogeologic system, as well as probable hydrothermal alteration associated
with basaltic dike emplacement.

4
Figure 1.1: Location of the study area in relation to the surrounding Gypsum Plain (comprised of Rustler and Castile formations) and the greater Delaware Basin, delineated by the subsurface Capitan Reef that outcrops in the various mountain ranges (from Stafford, 2008a).
The study area used to unravel the speleogenetic complexity in this study
(Figure 1.1), is an approximately 100 km2 area located along the northwestern
edge of the Gypsum Plain of
southeastern New Mexico and West
Texas, adjacent to the eastern face
of the Guadalupe Mountains and
Black River Valley. The entire
Gypsum Plain is an area of
approximately 2,800 km2 of Permian
age evaporites along the western
margin of the Delaware Basin,
primarily consisting of the Castile
Formation in outcrop. The basin is
located within the northern portion of
the semiarid Chihuahuan Desert in
the Great Plains Province (Hill,
1996). The area receives an average
annual precipitation of 26.7 cm of
rainfall, while temperatures average
approximately 17oC, with an average minimum of 9oC and maximum of 25oC
(Stafford, 2008b). The portion of the Gypsum Plain in which the study area
5
resides is commonly referred to as the Yeso Hills area, located along the Texas
border in Eddy County, New Mexico, and was selected as the primary area of
emphasis due to the concentrated presence of numerous unique karst
manifestations representing the total diversity of karst reported across the
Gypsum Plain. Specific karst phenomena include the Yeso Hills Selenite Mine, K
Hill, Black Dog Cave, basaltic dikes, artesian mineralized springs, paleokarst
erosional remnants, intrastratal breccia, calcitized evaporites and other notable
features discussed below.

6
GEOLOGIC AND HYDROLOGIC SETTING
During the mid to late Paleozoic, the Delaware Basin was formed as an
intracratonic, deep marine basin due to assimilation of Pangea and resulting
Ouachita Orogeny (Hill, 1996; Dickenson, 1981; Stafford, 2017). During
Guadalupian time, the Delaware Mountain Group siliciclastic formations were
deposited in the basin while Capitan Reef carbonates rapidly formed along the
basin margin and a series of interfingering evaporites, carbonates and clastics
were deposited as fore- and back-reef facies. Thick sequences of evaporites
were deposited within the basin during Ochoan time, following basin restriction to
open marine circulation through the closing of the Hovey Channel, which induced
a transition to a density-stratified, hypersaline inland sea (Scholle et al., 2004;
Stafford, 2017). The Castile Formation was deposited as a series of seven
alternating members of laminated to massive anhydrite/gypsum and halite
(Henrickson and Jones, 1952) directly overlying the Delaware Mountain Group
as a result of basin restriction, followed by evaporites of the Salado and Rustler
formations and Dewey Lake Continental Red Beds that cap the Delaware Basin
and extend onto the surrounding Guadalupian shelfal deposits (Figure 1.2) (Hill,
1996). Dehydration/hydration processes associated with burial/exposure of the
Castile sulfates have caused variable sulfate textures within strata, including

7
laminated, massive, nodular and selenitic fabrics (Machel and Burton, 1991;
Stafford et al., 2008c; Dean et al., 1975; Stafford, 2008b). Alternating Castile
anhydrite and halite members vary in thickness across the Gypsum Plain, as well
as solubility (Table 1.1).
From the early Mesozoic to the beginning of the late Miocene, the
Delaware Basin was a tectonically quiescent area experiencing sporadic
deposition by fluvial sediments, including the interbedded sandstone and
conglomeratic facies of the Cretaceous Cox Formation (Kirkland, 2014; Hill,
1996). A short period of volcanism occurred due to crustal shortening as regional
tectonics shifted from Laramide compression to Basin and Range extension in
the late Eocene to mid-Oligocene, coupled with emplacement of a series of
Figure 1.2: Major lithologic units of the Delaware Basin deposited during the middle- to late-Permian (modified from Scholle et al., 2004).

8
northeast trending basaltic dikes across the
basin (Price and Henry, 1985; Hill, 1996). Uplift
and tilting of the Delaware Basin tectonic block
associated with western extension along the Rio
Grande Rift during the late Miocene, as well as a
renewed pulse during the latest Miocene to early
Pliocene, acted to initiate most speleogenesis
evident today within the basin. From the end of
the Pliocene until the beginning of the Quaternary, the climate within the
Delaware Basin was that of a hot and arid desert (Hill, 1996; Thomas, 1972). A
shift in climate occurred during the Pleistocene, fluctuating between glacial
periods of higher moisture and dryer, interglacial periods; followed by a final shift
during the Holocene to the warm, arid environment present today (Bachman,
1980; Hill, 1996; Thomas, 1972).
Formations of the Delaware Mountain Group are the primary groundwater
source of the Delaware Basin, recharging from flow originating in proximal
mountain ranges, especially the Guadalupe Mountains and Delaware Mountains
along the western uplifted portion of the basin, to ultimately discharge to the
northeast as flow entering the Pecos River or the Capitan and San Andres
aquifers (Hill, 1996). Waters generally flow down-dip along the potentiometric
surface of basin strata, causing dissolution of adjacent areas (Hill, 1996;
Table 1.1: Members of the Castile Formation and their corresponding variable thickness as estimated based on present day values (adapted from Kirkland, 2014).
Member Thickness (m)
Casti
le F
orm
ati
on
Anhydrite IV 90-180
Halite III ~120
Anhydrite III ~90
Halite II ~60
Anhydrite II ~30
Halite I ~125
Anhydrite I ~50

9
Kirkland, 2014). The ancestral Pecos River migrated across the Delaware Basin
multiple times during the early Paleogene to late Neogene, creating a persistent
potentiometric low influencing groundwater flow (Thomas, 1972; Stafford, 2009).
Surface flow across the basin generally migrates along surface dip until entering
the groundwater system through open conduits and subsequently flowing down
dip along the basin or entering the Delaware Mountain Group aquifer.
10
KARST MANIFESTATIONS
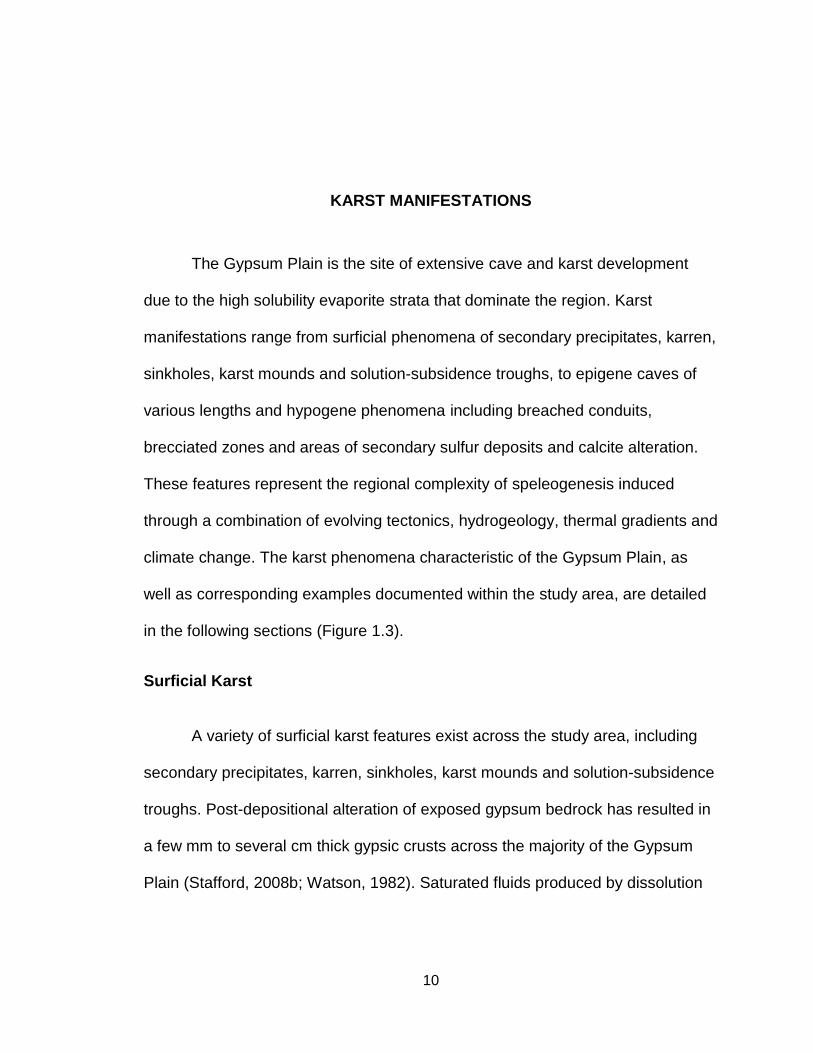
The Gypsum Plain is the site of extensive cave and karst development
due to the high solubility evaporite strata that dominate the region. Karst
manifestations range from surficial phenomena of secondary precipitates, karren,
sinkholes, karst mounds and solution-subsidence troughs, to epigene caves of
various lengths and hypogene phenomena including breached conduits,
brecciated zones and areas of secondary sulfur deposits and calcite alteration.
These features represent the regional complexity of speleogenesis induced
through a combination of evolving tectonics, hydrogeology, thermal gradients and
climate change. The karst phenomena characteristic of the Gypsum Plain, as
well as corresponding examples documented within the study area, are detailed
in the following sections (Figure 1.3).
Surficial Karst
A variety of surficial karst features exist across the study area, including
secondary precipitates, karren, sinkholes, karst mounds and solution-subsidence
troughs. Post-depositional alteration of exposed gypsum bedrock has resulted in
a few mm to several cm thick gypsic crusts across the majority of the Gypsum
Plain (Stafford, 2008b; Watson, 1982). Saturated fluids produced by dissolution
11
Fig
ure
1.3
: Locatio
n o
f fe
atu
res o
f in
tere
st
within
th
is s
tud
y th
at corr
espon
d to
the
gre
ate
r ch
ara
cte
ristic f
eatu
res o
f th
e G
ypsum
P
lain
an
d th
eir r
ela
tionsh
ip t
o th
e o
vera
ll surf
ace g
eolo
gy d
elin
eate
d a
cro
ss the
site (
Sh
ield
s e
t al., subm
itte
d).

12
of exposed Castile bedrock surfaces are retained as surface fluids by lichens and
microbial colonies, which subsequently produce gypsic crusts (Figure 1.4A) as
precipitates. By similar means, gypsite is formed at the interface between
gypsum bedrock and gypsic soils, as it can extend several m deep and host a
variety of karst phenomena. The process of gypsite formation results in poorly
consolidated, indurated soils with particles bound together by secondary gypsum
precipitates derived from saturated fluids (Canton et al., 2003; Stafford, 2008b).
Exposed surfaces of Castile gypsum not mantled by secondary gypsic
precipitates often exhibit a variety of well-developed karren, including rillenkarren
(Figure 1.4B), spitzkarren (Figure 1.4D) and kamenitzas (Stafford, 2008b).
The most common surficial karst expressions are closed depressions or
sinkholes formed either by collapse of subsurface voids (Figure 1.4C) or
dissolution by descending fluids. Open and filled sinkholes exist, with open
sinkholes culminating in solutional conduits or cave entrances at the terminus of
multi-hectare watersheds (Figure 1.4E), while collapsed sinkholes often feature
steep walls of bedrock and, in plan view, a circular to elliptical shape with limited
to no surface catchment. Depths and diameters of sinkholes vary across the
study area from a few cm to tens of m, and filled versions commonly contain thick
soil deposits which retain a higher moisture content than the surrounding areas,
thus supporting more dense vegetation (Figure 1.4F) (Stafford, 2008b).
13
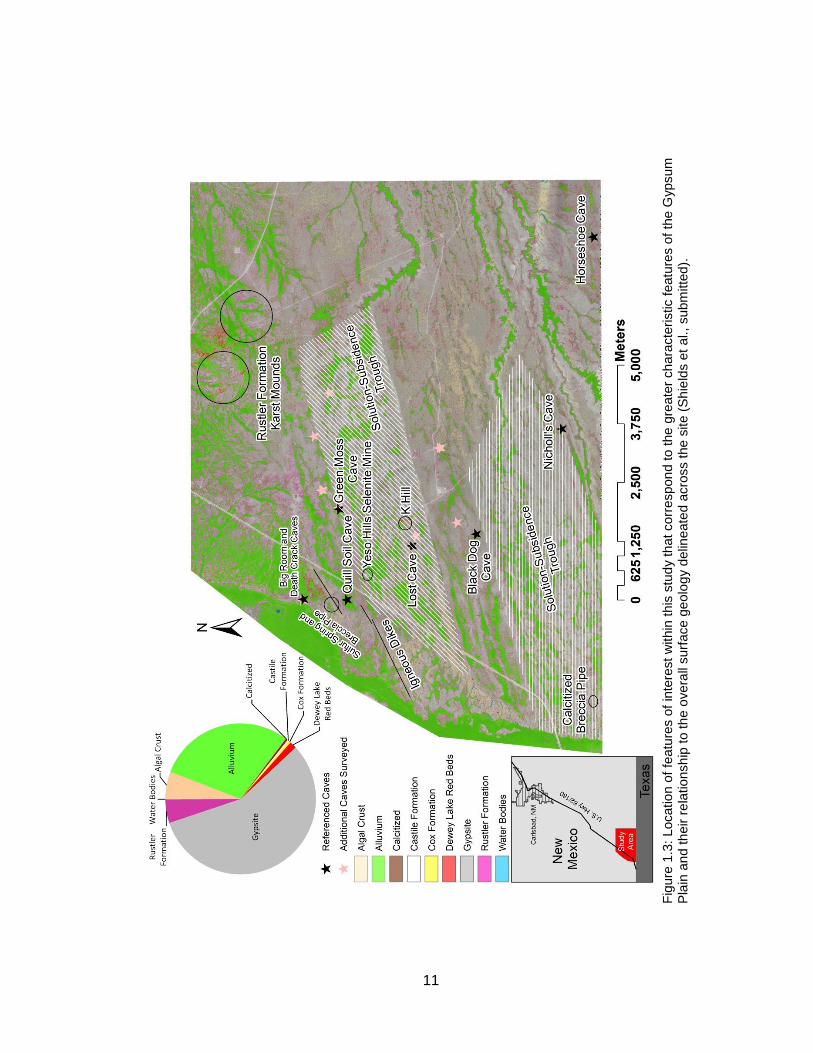
Figure 1.4: Surficial karst manifestations across the study area: A) gypsic crust found across most of the study area; B) rillenkarren on exposed Castile gypsum; C) small sinkhole manifesting as a closed depression within gypsic soil; D) spitzkarren developed on gypsum breccia boulder; E) sinkhole formed in gypsum bedrock of the Castile containing the entrance to Green Moss Cave; and F) grass filled sinkhole formed within gypsite, filled by Quaternary Alluvium

14
Residual
hills of dissolution-
collapse breccia
known as karst
mounds form
roughly circular to
elliptical positive
relief structures
across the
Gypsum Plain.
These hills usually stand less than 10 m in height and tens of m in diameter,
often forming a series of disconnected masses more than a km long (Bachman,
1980), which have been described as “structure-less heaps of insoluble residue”
(Hill, 1996). The filling of collapsed subsurface voids and sinkholes by
dissolution-collapse breccia of overlying strata an
d subsequent exposure due to surface denudation has formed these resistant
paleokarst erosional remnants (Crawford, 1993; Hill, 1996; Vine, 1963).
Several karst mounds exist within the study area primarily consisting of
residual Rustler strata capped by gypsic crust precipitates (Figure 1.5A). Rustler
mounds tend to consist of more erosion resistant members of the formation, the
Culebra and Magenta dolomites, with steeply sloping sides and relatively level
Figure 1.5. Karst mounds and areas exhibiting secondary calcitization: A) karst mounds (delineated with dashed white lines) primarily consisting Rustler strata; and B) K Hill, the largest karst mound in the study area consisting of the Rustler, Dewey Lake Red Beds and Cox strata.

15
tops. K Hill (Figure 1.5B) is an anomalous karst mound located in the central
portion of the study area that is much more complex, consisting mainly of upper
Rustler and Salado formations, including matrix-supported, cobble- to boulder-
size breccia clasts of Culebra and Magenta members of the Rustler. The eastern
portion of K Hill is an adjacent, rotated and down-dropped karst block preserving
the Dewey Lake Formation in contact with the Cox Formation. At 17 m tall, K Hill
is significantly larger than other erosional remnants in the area (Crawford, 1993)
and is located within one of multiple solution-subsidence troughs across the
study area that form straight depressions ranging in length from 80 m to 16 km
and 100 m to 1.6 km wide.
Solution-subsidence troughs are sites of localized subsurface dissolution
where subsequent collapse has diverted and captured surface streams, allowing
for further dissolution of adjacent areas and formation of large topographic lows,
as evident today (Olive, 1957). Troughs of this type are common across the
Gypsum Plain and form along northeast trending joint sets and graben fault
boundaries consistent with regional Basin and Range deformation (Crawford and
Wallace, 1993; Hentz and Henry, 1989). Olive (1957) postulated that the source
of subsurface dissolution was the nearby aquifer of the reef escarpment, the
Delaware Mountain Group aquifer, or a subsurface paleostream. Cave and karst
features are common along trough scarp boundaries, as well as the occurrence

16
of calcitization, native sulfur and selenite bodies (e.g. Yeso Hills Selenite Mine)
discussed later.
Epigene Caves
Epigene caves exist as numerous, isolated, well-developed yet laterally-
limited groundwater recharge features manifesting as solutional conduits
connected to incised sinkholes within the Castile outcrop. Massive, nodular and
laminated gypsum fabrics have been identified to host epigene caves, as well as
surficial gypsite deposits. Due to the low permeability of gypsum, fluids
preferentially migrate along preexisting joint and fracture planes, resulting in
strong structural passage control (Figure 1.6A) (Klimchouk, 2000a; Stafford,
Figure 1.6: Classic examples of epigene morphological features associated with gypsum caves: A) scallops lining the floor and ceiling (white circle) as well as visible dissolution within the ceiling exhibiting strong fracture control; B) Example of rapid decrease in aperture of epigene cave passage seen by the extreme drop in ceiling height over only a few m; C) Example of visible meandering of passage created by fluid flow and entrenchment along dashed lines on the lower portion of the wall.

17
2008b). Due to the high solubility and near-linear solution kinetics of gypsum,
meteoric fluids quickly approach saturation during overland flow events across
the Gypsum Plain. Therefore, fluids are often highly saturated upon entering the
subsurface, thus limiting further dissolution potential and resulting in a rapid
decrease in cave passage aperture/cross-sectional area (Figure 1.6B) away from
cave entrances (Stafford, 2015). Rapid narrowing of passages often prevents
exploration and survey of more than a few tens of m in length. Common
morphological features of epigene caves include well-developed, small-scale
scallops on bedrock surfaces (Figure 1.6A) and vertical entrenchment of passage
floors (Figure 1.6C); indicating that formation dominantly occurs during large-
scale rain events transmitting high flow volumes (Stafford, 2008b; White, 1988).
Typical examples that display the variability of epigene caves within the study
area include Lost Cave, Horseshoe Cave, Big Room Cave, Death Crack Cave,
Quill Soil Cave and Nicholl’s Cave.
Lost Cave is a typical small epigene recharge feature located within a
shallow soil and bedrock sinkhole (Figure 1.7A) in the central portion of the study
area, with a surveyed length and depth of 12 and three m, respectively (Figure
1.7B). The cave features extreme fracture control with a classic epigene
decrease in passage size over a very short distance. In contrast, Horseshoe
Cave is one of the more complex epigene caves. The entrance is formed within a
massive soil and bedrock sinkhole connected to a large bedrock entrance of

18
residual collapse (Figure 1.8A). The first half of the cave is classic entrenched
epigene passage of relatively constant dimensions (Figure 1.8B) with regions of
floor entrenchment that have undercut to induce wall collapse (Figure 1.8C),
while later portions of the cave rapidly decrease in size to less than one m in
diameter (Figure 1.8D) and were sumped at the time of exploration (Figure 1.8E).
Separating the Guadalupe Mountains and the Gypsum Plain is the Black
River Valley (a major tributary of the nearby Pecos River), forming a gravel plain
along which the solutional margin of the Castile Formation outcrop has
developed. Within this gypsum escarpment, a series of epigene cave passages
occur that have undergone recent catastrophic failure, today manifesting as
unstable mounds of collapse, hosting extensive breakdown and unstable residual
caves. These solutional margin karst features include Big Room Cave and Death
Crack Cave, which form an interconnected system proximal to the escarpment
where overland flow is focused as epigene recharge through the escarpment to
Figure 1.7: Lost Cave: A) sinkhole and entrance to Lost Cave (Eddy County, New Mexico); B) simplified map of Lost Cave.
19
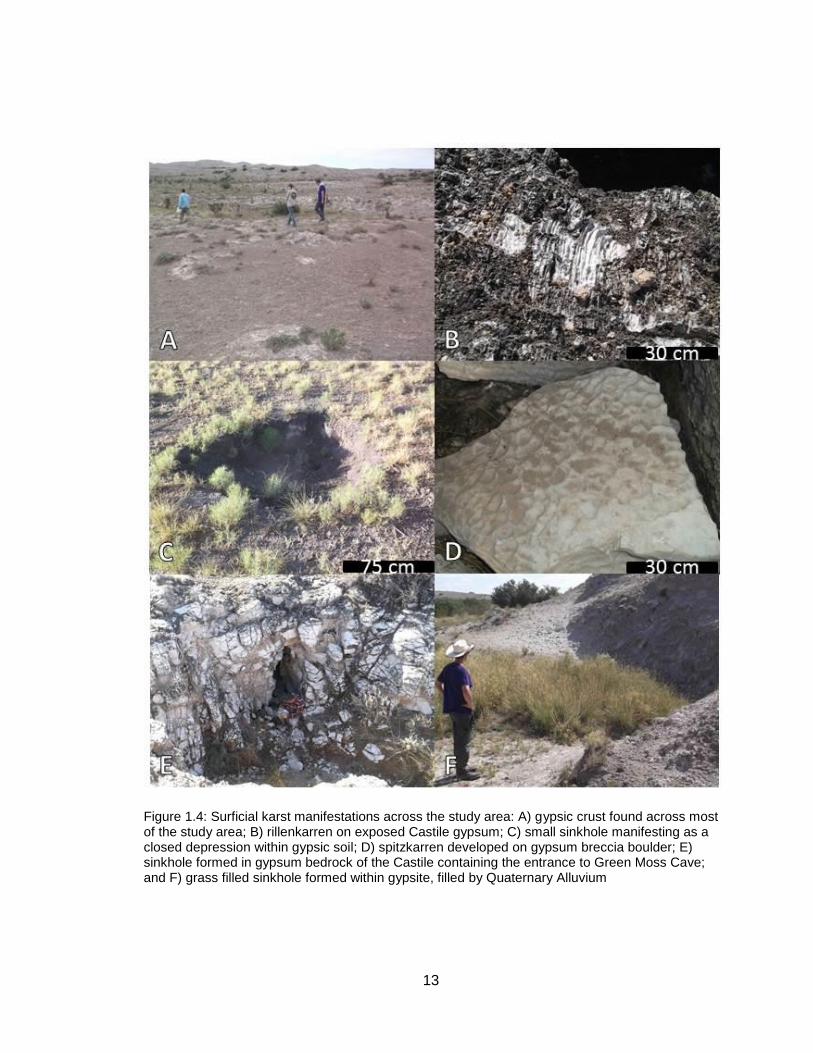
Figure 1.8: Horseshoe Cave, Eddy County: A) entrance to Horseshoe Cave and associated residual collapse; B) narrow, entrenched epigene passage forming the first half of Horseshoe Cave; C) large block of bedrock rotated in passage as result of undercutting during floor entrenchment; D) rapid decrease in passage diameter at the back of Horseshoe Cave; and E) simplified map of Horseshoe Cave.

20
the topographic low of the Black River Valley. The entrance to Big Room Cave is
approximately 100 m distal from the solution collapse scarp and formed 15 m
below its crest, with a five-m-tall headwall within a large, multi-hectare
watershed. The entrance area is heavily modified by collapse but within 10 m it
connects to a seven-m-diameter room approximately five m tall. The cave is
formed within gypsum bedrock collapse (Figure 1.9A, B) while gypsite forms the
majority of the main room’s ceiling. The floor is composed of collapse material
mantled with organic-rich soil excluding an unstable central floor opening through
breakdown that acts to drain intense recharge events (Figure 1.9C). 35 m
northwest of Big Room Cave, approximately mid-way to the scarp margin, is the
entrance to Death Crack Cave (Figure 1.9D), a vertical, multi-level, solutionally-
widened fracture complex located within the ridge of the gypsum escarpment.
Death Crack Cave is the product of multiple episodes of collapse, with minor
solutional widening as scarp erosion proximal to the Black River Valley continues
to erode and destabilize the scarp margin. Sound is easily carried between the
two caves through collapse material, confirming connectivity but unstable
breakdown prevents physical connection.
Suffosion processes are often responsible for the creation of pseudokarst
within gypsite and gypsic soil throughout the Gypsum Plain where fluid migration
has produced piping features and tubular cave passages (Halliday, 2004;
Palmer, 2009). Gypsite caves are often similar in scale to classic epigene

21
Fig
ure
1.9
: B
ig R
oom
and D
eath
Cra
ck c
aves, E
dd
y C
ounty
: A
) m
ain
room
of
Big
Room
Cave s
ho
win
g the
soil
flo
or
an
d
colla
pse b
reccia
wa
lls a
nd c
eili
ng;
B)
main
room
of
Big
Room
Cave s
ho
win
g t
he r
ela
tio
n o
f th
e e
ntr
ance to
th
e s
oil
floor
and
bre
ccia
ted w
alls
of
the c
ave; C
) vert
ica
l, m
ud-d
raped
dra
in w
ithin
th
e f
loor
of
Big
Room
Cave f
orm
ed c
om
ple
tely
with
in loose
ly
consolid
ate
d c
olla
pse b
reccia
by f
low
of
wa
ters
in
to t
he c
ave p
rim
arily
by larg
e-s
cale
ra
in e
vents
; and
D)
sim
plif
ied m
ap o
f B
ig
Room
Cave a
nd D
eath
Cra
ck C
ave.

22
Figure 1.10: Soil caves, Eddy County: A) simplified map of Quill Soil Cave; B) simplified map of Nicholl’s Cave.
gypsum bedrock features, generally being small and laterally-limited, although
usually shorter because of matrix instability—gypsite caves commonly terminate
in collapse. Often, entrances are relatively small compared to typical epigene
caves, and are formed adjacent to shallow sinkholes filled primarily by similar
indurated gypsic soil. Quill Soil Cave (Figure 1.10A) is the largest of several
gypsite caves surveyed within the study area, at 49 m long and four m deep. The
cave is largely horizontal with sections approximately 10 m long that are
interrupted by small collapse chambers—the cave likely extends beyond the
more extensive collapsed zone at the
end of the surveyed limits in a similar
fashion. Generally, gypsite caves
appear to transport shallow groundwater
laterally above the contact with
underlying gypsum bedrock and are
usually associated with bedrock caves
at depth (Stafford, 2008b), as illustrated
by Nicholl’s Cave. Nicholl’s Cave
(Figure 1.10B) exhibits a small entrance
and associated room within gypsite that
is connected to an epigene conduit
23
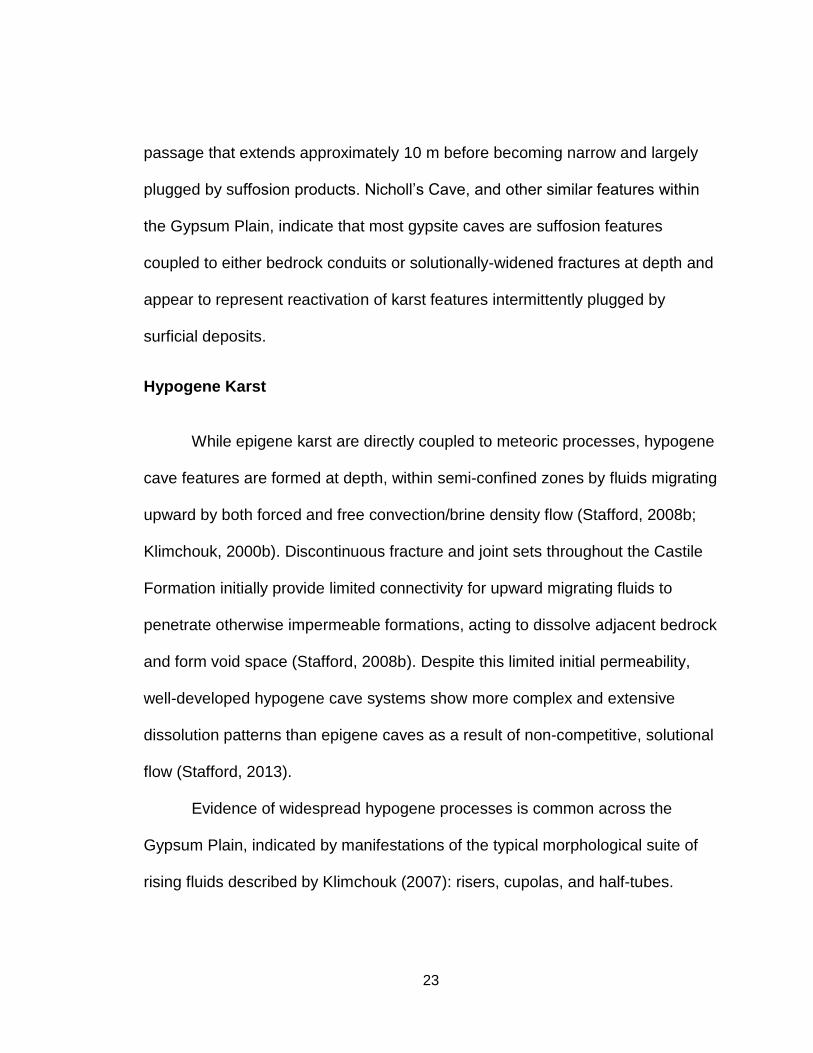
passage that extends approximately 10 m before becoming narrow and largely
plugged by suffosion products. Nicholl’s Cave, and other similar features within
the Gypsum Plain, indicate that most gypsite caves are suffosion features
coupled to either bedrock conduits or solutionally-widened fractures at depth and
appear to represent reactivation of karst features intermittently plugged by
surficial deposits.
Hypogene Karst
While epigene karst are directly coupled to meteoric processes, hypogene
cave features are formed at depth, within semi-confined zones by fluids migrating
upward by both forced and free convection/brine density flow (Stafford, 2008b;
Klimchouk, 2000b). Discontinuous fracture and joint sets throughout the Castile
Formation initially provide limited connectivity for upward migrating fluids to
penetrate otherwise impermeable formations, acting to dissolve adjacent bedrock
and form void space (Stafford, 2008b). Despite this limited initial permeability,
well-developed hypogene cave systems show more complex and extensive
dissolution patterns than epigene caves as a result of non-competitive, solutional
flow (Stafford, 2013).
Evidence of widespread hypogene processes is common across the
Gypsum Plain, indicated by manifestations of the typical morphological suite of
rising fluids described by Klimchouk (2007): risers, cupolas, and half-tubes.

24
Additionally, hypogene cave passages generally feature smooth walls or
common pendent structures due to sluggish formational fluid flow. Hypogene
caves exhibit small drainage areas compared to passage length, further
indicating that passage development predates surficial breaching. Passages are
often elliptical, rarely entrenched and increase, rather than decrease, in average
aperture diameter away from entrances. Access to hypogene features requires
that they must be breached by surface denudation and meteoric flow, inevitably
resulting in a variable epigenic overprinting often acting to complicate
speleogenetic interpretations. Overall morphological features, spatial patterns
and cave extent, in relation to drainage area, are used to confidently classify
features as either originating as epigenic or hypogenic, despite the degree of
epigene overprinting (Stafford, 2008b).
Numerous hypogene caves have been reported across the Gypsum Plain,
but Black Dog Cave, a hypogene feature in the focus areas of this study, is one
of the largest and most complex that has been documented in the region, with a
surveyed length of 684 m and 34 m deep. Black Dog Cave (Figure 1.11) is
located at the base of a large sinkhole, filled by quaternary alluvium, and formed
entirely within laminated gypsum. The cave is split into multiple levels with two
dominant passage trends (northeast/southwest and northwest/southeast). The
cave features numerous prominent diagnostic hypogene features, including
spherical tube-like passages with ceiling half-tubes, risers and pendent
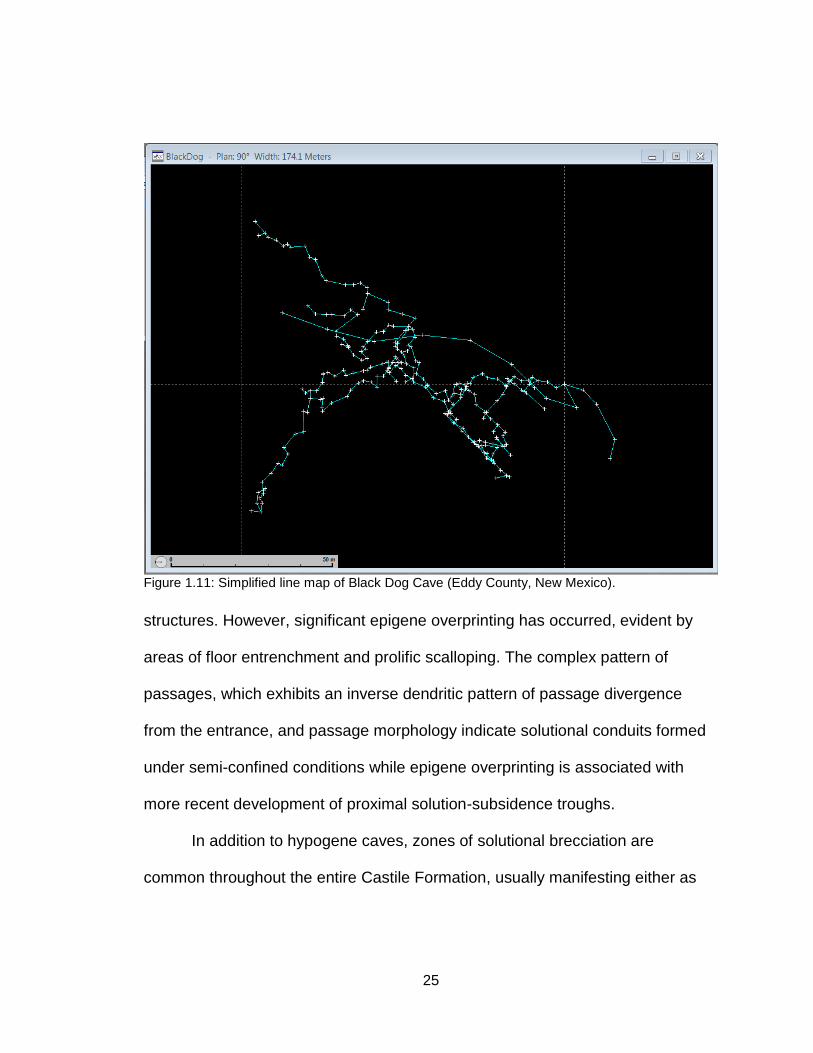
25
structures. However, significant epigene overprinting has occurred, evident by
areas of floor entrenchment and prolific scalloping. The complex pattern of
passages, which exhibits an inverse dendritic pattern of passage divergence
from the entrance, and passage morphology indicate solutional conduits formed
under semi-confined conditions while epigene overprinting is associated with
more recent development of proximal solution-subsidence troughs.
In addition to hypogene caves, zones of solutional brecciation are
common throughout the entire Castile Formation, usually manifesting either as
Figure 1.11: Simplified line map of Black Dog Cave (Eddy County, New Mexico).
26
vertical breccia pipe structures or horizontal blanket breccias (Stafford et al.,
2008a). Vertical breccia pipes are columnar bodies often penetrating hundreds of
m through the subsurface within Castile, Salado, and Rustler formations across
the Delaware Basin (Stafford, 2008a; Bachman, 1980; Anderson and Kirkland,
1980). Pipes may be identified at the surface either as negative relief features
due to subsurface collapse or as positive relief features of previous collapse that
have been heavily recemented and altered to form erosionally-resistant remnants
(Bachman, 1980; Adams, 1944). These brecciated zones are paleokarst
remnants where original hypogene voids at depth, most commonly originating at
the basal contact of the Castile Formation with the underlying Bell Canyon
aquifer, have collapsed and stoped upwards. Similarly, blanket breccias
developed when undersaturated fluids migrated laterally through halite deposits
inducing intrastratal dissolution to produce brecciated, residual, subangular clasts
suspended in an impure matrix of anhydrite, calcite and organic matter, which
was further enhanced by additional sulfate dissolution adjacent to halite horizons
(Anderson et al., 1978; Anderson et al., 1972). Generally, resulting blanket
breccias are usually dm to c m thick but may represent several m of vertical
collapse (Stafford, 2008a).
Across the Delaware Basin, ascending fluids necessary for hypogene
speleogenesis and formation of brecciated zones are commonly associated with
hydrocarbon migration paths. Methane derived from the lower Delaware

27
Mountain Group has been found to migrate in conjunction with brine waters
through Ochoan strata throughout the Delaware Basin. Formational crosscutting
of faults and zones of brecciation enabled hydrocarbons to penetrate evaporite
strata and supply light hydrocarbons that fueled sulfate reduction. As a
byproduct, evaporites are variably calcitized and hydrogen sulfide byproducts
often formed deposits of native sulfur (Kirkland and Evans, 1976; Stafford et al.,
2008d); economically viable native sulfur bodies have been exploited across the
Delaware Basin, usually filling vugs within brecciated, calcitized zones (Wallace
and Crawford, 1992).
Calcitized zones have been attributed to bacterial sulfate reduction (BSR)
(Hill, 1996) and thus are commonly termed bioepigenic limestone. It is also
possible that calcitization is the product of thermal sulfate reduction (TSR) or a
combination of sulfate reduction processes—current data is not conclusive as to
the dominant mechanism of sulfate reduction (Stafford et al., 2008d). Calcitized
zones can form lateral sheets (Figure 1.12A) or vertical structures most often
associated with breccia zones. Kirkland and Evans (1976) documented calcitized
breccia pipes as “Castile Buttes” forming positive surficial erosional remnants,
while Adams (1944) documented subsurface calcitized

28
Figure 1.12: Features associated with dissolution breccias that have undergone calcitization: A) exposed area of secondary calcite as a blanket breccia; B) small Castile Buttes within the study area; C) zone of calcitization intersected during epigenic formation of Green Moss Cave; and D) calcitized zone of brecciation in Green Moss Cave.

29
breccia pipes as “Castile Masses”. Stafford et al. (2008d) documented more than
1,000 individual calcitized zones across the Gypsum Plain, and several of these
manifest as small Castile Buttes within the focus area of this study (Figure
1.12B). Occasionally, calcitized zones are found in association with cave
development, as seen in Green Moss Cave, where the main passage intersects
a Castile Mass, resulting in abrupt changes in passage architecture (Figure
1.12C, D), but clearly demonstrating that much, if not most, cave development
within the Gyspum Plain post-dates major calcitization.
Large selenite bodies have been characterized as hypogene sulfur ore
bodies that were subsequently oxidized by oxygen-rich groundwater migration.
The Yeso Hills Selenite Mine, located along the northern boundary fault of the
solution-subsidence trough containing K Hill, features “high-purity, complexly
interlocking, cleavable masses of selenite exposed sporadically” (Hill, 1996).
Generally, areas of large accumulations of selenite crystals are in close relation
to native sulfur deposits and calcitization, as is the case at Yeso Hills Selenite
Mine, where significant calcitized zones and minor native sulfur are proximal,
suggesting that these selenite masses are alteration products of native sulfur
oxidation (Yushkin, 1969; Hill, 1996).
Along the western edge of the study area, adjacent to the Black River
Valley, sulfide-rich, artesian discharge exhibits a strong fetid odor and hosts
extensive white, filamentous microbial masses. The spring is located near a large

30
calcitized mass and selenite body and proximal to a series of basaltic dikes
emplaced through Castile evaporites. The spring is located approximately 20 m
above and 300 m away from the Black River Valley and features persistent, low
discharge that does not appear to fluctuate in response to seasonal precipitation
changes. This spring and others across the Gypsum Plain indicate that
ascending fluid flow remains common within the area indicating hypogene
processes remain active within the current geomorphic setting.

31
SPELEOGENETIC EVOLUTION
The speleogenetic evolution of the Gypsum Plain, as evidenced by
analyses in this study and previous investigations of the region, is the result of
multiple, complex episodes of solutional enhancement and diagenetic
modification of bedrock which continues in the current climatic regime. A variety
of epigene and hypogene karst features have been produced over time, as well
as features that represent aspects of both processes. These karst phenomena
are the result of a long and extensive history of Mesozoic burial diagenesis,
Laramide compression, magmatic emplacement, Basin and Range extension
and Quaternary climate change.
The collision of Gondwana and Laurasia to form Pangea, or Ouachita
Orogeny led to the formation of the Delaware Basin as an intracratonic, deep
water basin for Permian deposition. Series of shales, siltstones, sandstones and
limestone beds were deposited within the basin during the early to mid-Permian,
followed by the organic-rich siltstone to fine-grained sandstones, under- and
overlain by dark limestone units, of the Guadalupian Delaware Mountain Group.
Late Ochoan deposition consisted of anywhere from several hundred to 1,000 m
of Castile evaporites within the Delaware Basin, followed by additional
evaporites, carbonates and continental red beds of the Salado, Rustler and

32
Dewey Lake formations, respectively (Hill, 1996). Post-Castile deposition
covered basinal facies, as well as the surrounding marginal carbonates of the
fore-reef, reef and shelf for most of the following 250 million years (Kirkland,
2014), effectively isolating this region from major karst processes throughout the
Mesozoic.
Major sedimentation within the basin ceased after the Permian with thin,
sporadic deposition of limestones, sandstones and conglomerates associated
with transgression and regression of shallow seas and fluvial processes (Hill,
1996). During periods of exposure, it is probable that erosion of exposed upper
Ochoan strata occurred, but no definitive evidence has been documented
indicating that this was extensive enough to penetrate Castile strata. Beyond
minor solutional porosity associated with endokinetic fissuring during early burial
Figure 1.13: Diagram depicting the uplift and tilting experienced by the Delaware Basin tectonic block due to tectonic activity originating at the Rio Grande Rift during the early late Miocene.

33
and associated sulfate fabric alteration (Dean et al., 1975; Klimchouk and
Andrejchuk, 1996; Stafford, 2008b), speleogenetic phenomena observed across
the Gypsum Plain today most likely did not form until the late Miocene.
Uplift and tilting of the Delaware Basin tectonic block, due to Basin and
Range deformation of the Rio Grande Rift west of the Delaware Basin, is thought
to have begun in the early late-Miocene (Figure 1.13), with an additional intense
pulse occurring again 6-4 million years ago (Figure 1.14), during the latest
Miocene-earliest Pliocene (Kirkland, 2014; Lueth et al., 2005; Lindsay, 1998;
DuChene and Cunningham, 2006). These value s are based on radiometric
dating of alunite (40Ar/39Ar) from a series of major caves within the adjacent
Guadalupe Mountains corresponding to episodes of cave enlargement at these
times (Polyak et al., 1998; Polyak and Provencio, 2000; Kirkland, 2014).
Figure 1.14: Diagram depicting the second pulse of uplift and tilting experienced by the Delaware Basin tectonic block during the late Miocene.

34
Episodes of increased regional speleogenesis are the byproduct of rapid
uplift, allowing for correlation of similar results obtained through the same
radiometric dating of alunite deposits along the southern Rio Grande Rift (Lueth
et al., 2005; Seager and Morgan, 1979). Tilting induced the flow of groundwater
down-dip to the east-northeast, originating from the uplifted Guadalupe
Mountains area along the western margin of the basin and resulting in recharge
of artesian aquifers located in pre-Ochoan strata, including the Delaware
Mountain Group (King, 1948; Kirkland and Evans, 1976; Kirkland, 2014; Lindsay,
1998; DuChene and Cunningham, 2006). Free convection due to differences in
brine density, as well as high aquifer pressure heads, promoted the upward
migration of fluids from the Delaware Mountain Group aquifer along fractures and
joint sets within the overlying Castile’s basal Anhydrite I Member (fracturing and
joint sets are largely due to the Cenozoic uplift and tilting of the basin and reef
margin). Fluid migration resulted in caverns formed by extensive, localized,
hypogene dissolution at the lower Castile contact that became large enough to
collapse and stope upwards to create vertical dissolution pipes through Castile
strata (Anderson, 1981; Kirkland, 2014; Anderson and Kirkland, 1980). Rising,
unsaturated fluids moved along fractures and joints, dissolved adjacent host
rock, became saturated by salt dissolution and the resultant density increase
forced fluids to sink back down into lower clastic strata beneath the Castile

35
Formation to be replaced by unsaturated, rising fluids (Anderson and Kirkland,
1980).
Eventually, rising hypogene fluids completely penetrated the Anhydrite I
Member to contact the Halite I Member of the Castile Formation. The higher
solubility of the sodium chloride led to an increase in dissolution rates and free
convection, allowing rapid acceleration of upward migration. The overlying
Anhydrite II Member of the Castile was virtually impermeable, except by
migration along similar joint sets as seen in the Anhydrite I Member, and in most
areas acted to block further vertical migration. Rising fluids were forced to
migrate laterally along the base of the Anhydrite II Member, forming horizontal
chambers as fluids convected up dip to the west before growing saturated with
respect to sodium chloride, too dense for continued dissolution, and returned to
deeper levels through density convection via flow down dip to the east (Kirkland,
2014; Anderson and Kirkland, 1980). Hypogene dissolution, intrastratal blanket
breccias and vertical dissolution pipes continued to develop and stope upwards
repeatedly to encounter subsequent Halite and Anhydrite Members of the Castile
over time (Anderson and Kirkland, 1980; Kirkland and Evans, 1976; Stafford,
2008b; Stafford, 2008d).
Large scale collapse has been recorded along dissolution horizons
between Castile members, due to extensive localized dissolution, such as Big
Sinks depression, 55 km northeast of the study area. Big Sinks has been
36
characterized as an “eastward-advancing dissolution front where down dip-
moving water has produced extensive dissolution at horizons in the Castile and
Salado formations (Hill, 1996; Anderson, 1982). Vertical collapse pipes extensive
enough to incorporate late Ochoan rock (e.g. Rustler strata) into Castile breccia
zones have been identified, indicating extensive, repetitive collapse structures.
Due to the presence of Cretaceous Cox strata and the vast size of K Hill, it is
likely that collapse associated with breccia pipes in the Gypsum Plain began to
occur soon after, or penecontemporaneously with, uplift and tilting which initiated
upward migration of fluids. Multiple, discontinuous episodes of collapse and
subsidence associated with upward breaching of Castile anhydrite members
were induced over time. Rustler karst mounds that are less extensive than K Hill
likely formed at the same time but represent smaller-scale, vertical, pipe
structures. As collapse material associated with breccia pipes, and the residual
hills evidenced in the Gypsum Plain today, continued, further dissolution
dissolved intermediate evaporite strata within the Rustler Formation allowing
Magenta dolomite to lie directly above Culebra dolomite in contact with lower
Castile gypsum (Hill, 1996), as seen at the Rustler karst mounds.
The period of volcanism, coincident with the shift from Laramide
compression to Basin and Range extension during the late Eocene to mid-
Oligocene marked an increase in the regional geothermal gradient (Price and
Henry, 1985; Hill, 1996). Crustal thinning allowed plutons to rise to the surface,

37
evident today as northeast trending dikes across the northwestern portion of the
basin. The emplacement of dikes thermally altered the surrounding area and
likely influenced subsurface fluid flow as a barrier or drainage structure and likely
introduced juvenile waters into the system (Custodio, 2007; Ernst, 2014; Comte
et al., 2017). Evidenced by alteration of igneous dikes in outcrop, they most likely
became fluid migration pathways due to fracturing of host rock during
emplacement and cooling (Singhal and Gupta, 1999; Bromley et al., 1994; Sami
and Hughes, 1996; Wilkes et al., 2004; Vittecoq et al., 2015; Comte et al., 2017).
Transient heating further increased due to Basin and Range extension until it
reached latest Miocene peak values, coincident with a second major phase of
uplift and tilting (Kirkland, 2014; Hill, 1996). Increased late Neogene geothermal
gradients are widely considered as the source of methane generation associated
with calcitization of Castile Buttes/Masses and brecciated zones, as well as sulfur
ore emplacement (Kirkland and Evans, 1976; Stafford, 2008d; Kirkland, 2014;
Hill, 1996). Castile Buttes, massive selenite deposits and a sulfur mineral spring
are located proximal to the series of igneous dikes, suggesting TSR may have
been more dominant that BSR processes associated with calcitization within the
Gypsum Plain.
A second phase of hypogene karstification would have also been initiated
with peak heat values and the second pulse of uplift and tilting, as well as
hydration of shallow anhydrite and oxidation of near surface sulfur deposits to

38
form large concentrations of selenite in outcrop. As more oxygen-rich
groundwater recharged surficial exposures of clastics within the Delaware
Mountains, higher pressure heads were induced and introduced into the western
portions of the Delaware Basin, further occluding pore structures within calcitized
regions and promoting additional hypogene cave development.
It is likely that Black Dog Cave was formed during this second episode of
renewed hypogene activity due to the largely intact nature of the cave. Most
largely intact hypogene caves within the Gypsum Plain commonly have portions
of passage development that cut across calcitized zones and often through
selenetic masses. This suggests that the second pulse of hypogene cave
formation likely occurred during the Pliocene, as permeability decreases induced
by extensive calcitization within older hypogene-induced brecciated zones began
to occlude vertical and lateral permeable zones previously established through
the Castile Formation.
The Pleistocene was a time of major surface denudation and epigene
cave development across the Gypsum Plain (Figure 1.15). The climate
transitioned from semi-arid to arid conditions of middle to late Miocene to a
fluctuation between colder, wetter glacial periods and warmer, drier interglacial
periods, evidenced by various isotope data (Bachman, 1980; Hill, 1996; Hill,
1987; Harris, 1985; Van Devender, 1980). Glacial periods resulted in rapid
erosion and dissolution of Permian strata, with the middle Pleistocene (during the

39
Kansan glacial, ~600,000 to 800,000 ybp) being the most humid period and likely
time of greatest surface denudation (Hill, 1996). Epigene cave features, such as
Lost Cave, Horseshoe Cave and Green Moss Cave, began to form with
denudation of the Gypsum Plain and increased overland flow coupled with
shallow vadose dissolution. Pleistocene timing of major epigene cave
development is further evidenced by development of passages through
brecciated/calcitized zones, as in Green Moss Cave and similar to that observed
in hypogene caves. Most of the hypogene caves currently documented across
the Gypsum Plain were likely intercepted at this time by surface denudation and
epigene overprinting began.
Migration of the Pecos River across the Delaware Basin from early
Paleogene to today resulted in concentrated fluid flow toward this potentiometric
Figure 1.15: Diagram depicting the beginning of epigene cave formation and denudation of the Gypsum Plain induced by the higher moisture contents of glacial periods occurring during the Pleistocene.

40
low (Thomas, 1972; Stafford, 2008d). Solution-subsidence troughs across the
basin likely formed as a result of directional flow towards the migrating
potentiometric low of the Pecos River during the late Pleistocene, causing
intense areas of localized dissolution, leading to collapse and infilling by
Quaternary sediments (Stafford, 2009; Malley and Huffington, 1953; Olive, 1957),
contemporaneous with epigene karst development. The solution troughs of K Hill
and Yeso Hills Selenite Mine began to experience increased dissolution as the
Pecos River migrated east across the Gypsum Plains. Once the Pecos River was
established within its current location by the end of the Neogene (Thomas, 1972)
and the Black River began to develop as a tributary along the base of the
Guadalupe Mountains, caves and associated collapse structures found along the
escarpment delineating the solutional edge of the Gypsum Plain evolved with
continued degradation of the updip margin of Castile strata.
During the last 10,000 years (Figure 1.16), Holocene climate in the
Delaware Basin has shifted to arid/semiarid conditions (Hill, 1996), with
associated infilling of many Pleistocene-formed sinkholes with alluvium/gypsic
soil. Heavy precipitation events, such as those experienced during modern
monsoonal seasons, produce karren within the current landscape on exposed
bedrock surfaces as well as aiding in the development of gypsic crusts.
Pseudokarst/gypsite caves have formed most recently in association with these
intense storm events that induce soil piping and re-activation of soil-

41
plugged/buried karst features. Sulfide-rich springs indicate that localized
hypogene processes are still active in the Gypsum Plain, while epigene, and
breached hypogene, caves continue to evolve.
The prominence of hypogene diagenetic patterns and manifestations
across the Gypsum Plain indicates that hypogene speleogenesis is the dominant
process that has affected the speleogenetic evolution of the area (Stafford,
2008a; 2008b). Continued migration of fluids along the dip of the Gypsum Plain
allow for further hypogene dissolution and sulfate diagenesis to continue to form
today with the migration of the Castile dissolution front to the east (Stafford,
2008d). Precipitation events, erosion and eolian processes have caused infilling
of many voids and sinkholes with sediments during the Holocene; however,
many of these features appear to be ephemerally active as soil/sediment
obstructions at surficial interfaces are intermittently opened and closed. Many
Figure 1.16: Diagram depicting the present day state of the Gypsum Plain through the Holocene.

42
features are undergoing various stages of fill, while subsequent remobilization of
sediments is allowing for equilibration of the systems and reopening of previously
blocked flow paths. Holocene processes are still active across the Gypsum Plain
today, experiencing increasing and decreasing rates depending on the level of
moisture and precipitation experienced and resulting in the formation or karren,
gypsic crusts, gypsite, suffosion caves, epigene caves and variable solutional
overprinting at a slower pace than wetter climates of the Pleistocene.

43
CONCLUSIONS
The large variety of karst features evident across the Gypsum Plain today
are the result of a combination of complex hydrogeologic, tectonic and climate
related processes primarily occurring within the last 10 million years. The
speleogenetic system continues to evolve today, but based on current analyses
of karst phenomena, major speleogenetic processes began in the Miocene,
associated with the following speleogenetic sequence.
Crustal extension due to the shift from Laramide compression to
Basin and Range extension allowed for the rise of plutons to upper
crustal levels across the Gypsum Plain during the mid-Oligocene,
with brittle deformation and increased geothermal heating (e.g.
igneous dike emplacement).
Major uplift and tilting of the Delaware Basin tectonic block began
as a result of Basin and Range deformation of the Rio Grande Rift
in the early-late Miocene exposing updip portion of the far western
Delaware Basin to surficial processes (Figure 1.13).
Tilting induced migration of unsaturated water from the Delaware
Mountain Group Aquifer upward via joints/faults within members of
the Castile strata resulting in dissolution of salt beds to form early

44
phases of hypogene caves as well as vertical and lateral breccia
zones (e.g. K Hill, Rustler karst mounds) (Figure 1.13).
The regional geothermal heat gradient reached peak values
(originally spurred by emplacement of Oligocene dikes and
increased due to transient heating associated with Basin and
Range deformation) during the latest Miocene, promoting
maturation of hydrocarbons.
A second intense pulse of uplifting and tilting in the latest Miocene-
earliest Pliocene resulted in renewed karstification accompanied by
light hydrocarbon (methane) migration that fueled calcitization and
sulfur ore emplacement largely within calcitized zones (e.g. Castile
Buttes, calcitized breccia blankets) (Figure 1.14).
Pliocene exposure of clastics within the Delaware Mountains
introduced oxic waters into the Delaware Mountain Group that
induced oxidation of shallow sulfur ore deposits to selenite and a
second phase of hypogene cave development induced by porosity
occlusion of previous permeable breccias during calcitization (e.g.
Black Dog Cave).
Pleistocene shifts to more humid climates induced significant
surface denudation, epigene cave development and breaching of
hypogene caves (e.g. Lost Cave, Horseshoe Cave) (Figure 1.15).

45
Pecos River migration during the Neogene created intense areas of
localized dissolution and collapse due to preferential fluid flow
toward the potentiometric low of the river (e.g. solution-subsidence
troughs).
Development of the Black River Valley along the western margin of
the study area, induced karst development through destabilization
and collapse along the solutional margin of the Castile outcrop area
throughout the Holocene (e.g. Big Room Cave, Death Crack Cave
and associated epigene features).
Holocene shift to the warm, arid climate of the Delaware Basin
today led to continued, although reduced, epigene karst
development and denudation coupled with significant infilling of
Pleistocene sinkholes with alluvium/gypsic soil (e.g. karren, gypsic
crusts, gypsite, Quill Soil Cave, Nicholl’s Cave) (Figure 1.16).
Karst processes initiating in the Miocene in the Gypsum Plain are likely
occurring with the central Delaware Basin today while hypogene cave breaching
and epigene karst development continue slowly with eastward migration of
surface denudation throughout the Delaware Basin. Future studies in the region
will continue to refine and restrain the timing of speleogenetic processes within
the Gypsum Plain as this complex hydrogeologic system is better characterized.

46
REFERENCES
Adams, J. E. (1944). Upper Permian Ochoa Series of Delaware Basin, West Texas and southeastern New Mexico. Am. Assoc. Petroleum. Geol. Bull., 28, 1596-1625.
Anderson, R.Y. (1981). Deep seated salt dissolution in the Delaware Basin. In Wells, S.G. and Lambert, W. (eds.), Environmental geology and hydrology in New Mexico. New Mexico Geological Society.
Anderson, R.Y. (1982). Deformation- dissolution potential of bedded salt, Waste Isolation Plant site, Delaware Basin, New Mexico; in Lutze, W. (ed.), Scientific Basis for Radioactive Waste Management. New York, New York: Elsevier Science Publ. Co.
Anderson, R. Y., Dean, W. E., Kirkland, D. W. and Snider, H. I. (1972). Permian Castile varved evaporite sequence, West Texas and New Mexico. Geological Society of America, 83, 59-85.
Anderson, R. Y., Kietzke, K. K. and Rhodes, D.J. (1978). Development of dissolution breccias, northern Delaware Basin and adjacent areas. Socorro, New Mexico: New Mexico Bureau of Mines and Mineral Resources. 47-52.
Anderson, R. Y. and Kirkland, D. W. (1980). Dissolution of salts by brine density flow. Geology, 8, 66-69.
Bachman, G. O. (1980). Regional geology and Cenozoic history of Pecos Region, Southeastern New Mexico. U.S. Geol. Surv., Open-file Rept. 116, 80-1099.

47
Bromley, J., Mannstrom, B., Nisca, D. and Jamtlid, A. (1994). Airborne geophysics: Application to a ground-water study in Botswana. Ground Water, 32(1), 79–90.
Canton, Y., Sole-Benet, A. and Lazaro, R. (2003). Soil geomorphology relations in gypsiferous materials of the Tabernas Desert (Almeria, SE Spain). Geoderma. 115(3-4), 193-222.
Comte, J-C., Wilson, C., Ofterdinger, U. and González-Quirós, A. (2017). Effect of volcanic dykes on coastal groundwater flow and saltwater intrusion: A field-scale multiphysics approach and parameter evaluation. Water Resources Research, 53(3), 2171-2198.
Crawford, J.E. (1993). K Hill and Yeso Hills selenite occurrence. In Love, D.W., Hawley, J.W., Kues, B.S., Adams, J.W., Austin, G.S., and Barker, J.M. (Eds.), Carlsbad Region. New Mexico Geol. Society. 8-10.
Crawford, J.E. and Wallace, C.S. (1993). Geology and mineralization of the Culberson sulfur deposit. In Love, D.W. et al. (eds.), Carlsbad region, New Mexico and West Texas. New Mexico Geological Society Guidebook, 44th Annual Field Conference, 301-316.
Custodio, E. (2007), Groundwater in volcanic hard rocks. In Krasny, J. and Sharp Jr, J.M. (eds.) Groundwater in Fractured Rocks, IAH Selec. Pap. Ser., 9. London, United Kingdom: Taylor and Francis.
Dean, W.E., Davies, G.R. and Anderson, R.Y. (1975). Sedimentological significance of nodular and laminated anhydrite. Geology, 3, 367-372.
Dickenson, W.R. (1981). Plate tectonic evolution of the southern Cordillera. Arizona Geological Society Digest, 14, 113-135.
Du Chene, H.R. and Cunningham, K.I. (2006). Tectonic influences on speleogenesis in the the Guadalupe Mountains, New Mexico and Texas. In Land, L., Lueth, V.W., Raatz, W., Boston, P. and Love, D.L. (eds.),
48
Caves and karst of southeastern New Mexico. Midland, Texas: New Mexico Geological Society.
Ernst, R. E. (2014). Large Igneous Provinces. Cambridge, U. K.: Cambridge Univ. Press.
Halliday, W. R. (2004). Piping caves and badlands pseudokarst. In J. Gunn (Ed.), Encyclopedia of caves and karst science. New York, New York: Fitzroy Dearborn. 589-593.
Harris, A.H. (1985). Late Pleistocene vertebrate paleoecology of the west. Austin, Texas: University of Texas Press.
Henry, C.D. and Price, J.G. (1985). Summary of the tectonic development of Trans-Pecos Texas. Bur. Econ. Geol.,
Hentz, T.F. and Henry, C.D. (1989). Evaporite-hosted native sulfur in Trans-Pecos Texas: relation to the late phase Basin and Range deformation. Geology, 17, 400-403.
Hendrickson, G.E. and Jones, R.S. (1952). Geology and groundwater resources of Eddy County, New Mexico. New Mexico Bureau of Mines and Mineral Resources, Groundwater Report 3.
Hill, C.A. (1987). Geology of Carlsbad Caverns and other caves in the Gudalupe Mountains, New Mexico and Texas. In New Mexico Bureau of Mines and Mineral Resources Bulletin 117.
Hill, C. A. (1996). Geology of the Delaware Basin, Guadalupe, Apache, and Glass Mountains: New Mexico and West Texas. Midland, Texas: Permian Basin Section of the SEPM.
King, P.B. (1948). Geology of the Southern Guadalupes, Texas. United States Geological Survey. Professional Paper 215. 183.

49
Kirkland, D. W. and Evans, R. (1976). Origin of limestone buttes, Gypsum Plain, Culberson County, Texas: American Association of Petroleum Geologists Bulletin, 60, 2005-2018.
Kirkland, D.W. (2014). Role of hydrogen sulfide in the formation of cave and karst phenomena in the Guadalupe Mountains and western Delaware Basin, New Mexico and Texas. National Cave and Karst Research Institute, special paper 2.
Klimchouk, A. (2000a). Speleogenesis in gypsum. In: Klimchouk, A., Ford, D. C., Palmer, A. N. & Dreybrodt W. (Eds.) Speleogenesis: evolution of karst acquifers. Huntsville: National Speleological Society.
Klimchouk, A. (2000b). Speleogenesis under deep seated and confined conditions. In Klimchouk, A., Ford, D. C., Palmer, A. N. and Dreybrodt W. (Eds.), Speleogenesis: evolution of karst acquifers. Huntsville, Texas: National Speleological Society. 244-260.
Klimchouk, A. (2007). Hypogene Speleogenesis: Hydrogeological and Morphogenetic Perspective. Carlsbad: National Cave and Karst Research Institute.
Klimchouk, A. and Andrejchuk, V. (1996). Breakdown development in cover beds, and landscape features induced by intrastratal gypsum karst. International Journal of Speleology, 35(3-4), 127-144.
Lindsey, R.F. (1998). Meteoric recharge, displacement of oil columns and the development of residual oil intervals in the Permian Basin. In DeMis, W.D. and Nelis, M.K. (eds.), The search continues into the 21st century. Midland, Texas: West Texas Geological Society.
Lueth, V.W., Rye, R.O. and Peters, L. (2005). “Sour gas” hydrothermal jarosite: ancient to modern acid-sulfate mineralization in the southern Rio Grande Rift. Chemical Geology, 215, 339-360.

50
Machel, H.G. and Burton, E.A. (1991). Burial-diagenetic sabkha like gypsum and anhydrite nodules. Journal of Sedimentary Petrology, 61(3), 394-405.
Maley, V.C. and Huffington, R.M. (1953). Cenozoic fill and evaporite solution in the Delaware Basin, Texas and New Mexico. Geological Society of America, 64, 539-546.
Olive, W.W. (1957). Solution-subsidence troughs, Castile Formation of Gypsum Plain, Texas and New Mexico. Geol. Soc. Am., Bull., 68, 351-358.
Palmer, A. (2009). Cave Geology. R. A. Watson (Ed.) Lawrence, KS: Cave Books.
Polyak, V.J. and Provencio, P.P. (2000). Summary of the timing of sulfuric-acid speleogenesis for Guadalupe caves based on ages of alunite. Journal of Cave and Karst Studies, 62(2), 72-74.
Polyak, V.J., McIntosh, W.C., Guven, N. and Provencio, P. (1998). Age and origin of Carlsbad Caverns and related caves from 40Ar/39Ar of alunite. Science, 249, 1919-1922.
Price, J.G. and Henry, C.D. (1985). Summary of Tertiary stress orientation and tectonic history of Trans-Pecos Texas. In Dickerson, P.W. and Muehlberger, W.R. (eds.), Structure and tectonics of Trans-Pecos Texas.Texas: West Texas Geological Society. Guidebook Publ. 85(81).
Sami, K. and Hughes, D.A. (1996). A comparison of recharge estimates to a fractured sedimentary aquifer in South Africa from a chloride mass balance and an integrated surface- subsurface model. Journal of Hydrology, 179(1), 111-136.
Scholle, P.A., Goldstein, R.H. and Ulmer-Scholle, D.S. (2004). Classic upper Paleozoic reefs and bioherms of west Texas and New Mexico. New Mexico Institute of Mining and Technology.

51
Seager, W.R. and Morgan, P. (1979). The Rio Grande Rift in southern New Mexico, west Texas and northern Chihuahua. In Riecker, R.E. (ed.), Rio Grande Rift, tectonics and magmatism. Washington, D.C.: American Geophysical Union.
Singhal, B. B. S. and Gupta, R. P. (1999). Applied Hydrogeology of Fractured Rocks. Dordrecht, Netherlands: Kluwer.
Stafford, K. W. (2013). Evaporite Karst and Hydrogeology of the Castile Formation: Culberson County, Texas and Eddy County, New Mexico. National Cave and Karst Research Institute. 13th Sinkhole Conference. Symposium 2.
Stafford, K.W. (2015) Evaluation of Existing Geologic Conditions along RM 652: Initial Characterization of Karst Geohazards Associated with RM 652 in Culberson County, Texas. TxDOT Rep.1–71.
Stafford, K.W., Brown, W.A., Ehrhart, J.T., Majzoub, A.F. and Woodard, J.D. (2017). Evaporite karst geohazards in the Delaware Basin, Texas: review of traditional karst studies coupled with geophysical and remote sensing characterization. International Journal of Speleology, 46(2), 169-180.
Stafford, K. W., Land, L., & Klimchouk A. (2008a). Hypogenic speleogenesis within Seven Rivers Evaporites: Coffee Cave, Eddy County, New Mexico. Journal of Cave and Karst Studies, 70(1), 47-61.
Stafford, K. W., Nance, R., Rosales-Lagarde, L. and Boston, P. J. (2008b). Epigene and hypogene gypsum karst manifestations of the Castile Formation: Eddy County, New Mexico and Culberson County, Texas, USA. International Journal of Speleology. 37(2). 83-98.
Stafford, K. W., Rosales-Lagarde, L. and Boston, P. J. (2008c). Castile evaporite karst potential map of the Gypsum Plain, Eddy County, New Mexico and Culberson County, Texas: A GIS methodological comparison. Journal of Cave and Karst Studies, 70(1). 35-46.

52
Stafford, K. W., Ulmer-Scholle, D. & Rosales-Lagarde, L. (2008d). Hypogene calcitization: Evaporite diagenesis in the Western Delaware Basin. Carbonates and Evaporites, 23(2), 89-103.
Thomas, R.G. (1972). The geomorphic evolution of the Pecos River system. Baylor Geological Studies, 22, 1-40.
Van Devender, T.R. (1980). Holocene plant remains from Rocky Arroyo and Last Chance Canyon, Eddy County, New Mexico. The Southwestern Naturalist, 25, 361-372.
Vine, J. D. (1963). Surface geology of the Nash Draw Quadrangle, Eddy County, New Mexico. U.S. Geol. Surv., Bull., 1141-B, B1 to B46.
Vittecoq, B., Reninger, P.A., Violette, S., Martelet, G., Dewandel, B. and Audru, J.C. (2014). Heterogeneity of hydrodynamic properties and groundwater circulation of a coastal andesitic volcanic aquifer controlled by tectonic induces faults and rock fracturing—Martinique Island (Lesser Antilles –FWI). Journal of Hydrology, 529, 1041-1059.
Watson, A. (1982). The Origin, Nature and Distribution of Gypsum Crusts in Desert. D.Phil, Univ. of Oxford.
Wallace, C.S. and Crawford, J.E. (1992). Geology of the Culberson Ore Body. In Wessel, G.R. and Wimberly, B.H. (Eds.), Native sulfur—Developments in geology and exploration. Phoenix, Arizona: Society of Mining and Metallurgy Exploration.
White, W. B. (1988). Geomorphology and hydrology of karst terrains. New York, New York: Oxford University Press.
Wilkes, S.M., Clement, T.P. and Otto, C.J. (2004). Characterization of the hydrogeology of the Augustus River catchment, Western Australia. Hydrogeology Journal, 12(2), 209-223.

53
Yushkin, N.P. (1969). The metastomatic type of native sulfur deposits and its place in the general scheme of catagenesis. Izdatel’stvo “Nedra”. 36-64.

54
A Novel Approach to Delineating Lithologic Variability of a Karsted Landscape Utilizing CIR Imagery and GIS Analyses,
Eddy County, New Mexico
ABSTRACT
Traditional characterization of karsted terrains involves costly field studies
that require months, if not years, of physical field mapping and data collection in
order to complete, which can be made more efficient by the preliminary
identification of areas of interest through careful analysis of geologic maps. Karst
features of the Gypsum Plain of southeastern New Mexico and West Texas
range from dm to tens of m in scale, requiring highly detailed maps in order to be
of use. However, maps of the area currently available feature little to no detail of
lithologic variability or mineralization. Advances in remote sensing technologies
allow for the production of geologic maps from satellite imagery, most often
based on hyperspectral data, due to an increased ability in mineral identification.
However, commercially available hyperspectral sensors offer extremely low
spatial resolution compared with the 50 cm resolution multispectral data
available, as well as being more costly and difficult to process. The following
novel approach to delineating detailed lithologic variability of a landscape may be
employed through the performance of a maximum likelihood classification of

55
color infrared imagery. WorldView-2 satellite imagery was used in this study for
its high 50 cm spatial resolution, in order to provide a more efficient and cost
effective method of karst identification and lithologic characterization for use in
research and natural resource management. Based on comparison with control
points acquired in the field and extensive a priori knowledge of the study area,
results were deemed highly accurate and are currently being used to aid in
ongoing karst studies.

56
INTRODUCTION
Traditional characterization of karsted terrains entails the costly, time-
consuming process of physical field mapping in order to identify and collect data
concerning landscape features. Consequentially, remote sensing methodologies
are actively being pursued as a more cost effective means of resource
management. The Gypsum Plain of southeastern New Mexico and West Texas
is the site of extensive karst development within Permian evaporite facies,
hosting variable karst manifestations ranging in scale from mm to km (Stafford,
2008a). Specific features are often associated with unique lithologies or
topographic features, allowing for preliminary identification through the use of
surficial geologic maps. However, existing geologic maps of the area have poor
resolution, featuring the general expected lithology with little detail and no
variation in mineralogy (Figure 2.1). Advances in satellite imaging technology
have allowed for the possibility of land mapping and feature extraction to be
performed by image classification of raster cells based on their corresponding
radiometric properties, often reducing the need for extensive groundwork while
allowing for coverage of greater areas (Hamideh, 2014).
Commonly, hyperspectral data is used in studies concerning the
delineation of surface geologic materials due to increased spectral resolution and

57
number of channels with extremely narrow bandwidths, allowing for greater
accuracy in the identification of specific mineral types (Harris et al., 2011).
However, commercially-available hyperspectral sensors lack refined spatial
resolutions necessary in the identification of small karst features and lithologic
variability (less than a few m2 in size) across a landscape, while commercially-
available, multispectral sensors offer increased spatial resolutions of 50 cm or
less (Table 2.1). The Gypsum Plain consists primarily of evaporite and carbonate
facies with little vegetation as it is located in the semi-arid, southwestern United
States. Top-of-atmosphere reflectance values of the main lithogroups (e.g.
sulfates, carbonates and siliciclastics) present exhibit significant enough variation
that increased spectral ranges and concentrated values of the hundreds of bands
Figure 2.1: Traditional geology map of the study area created on a small-scale of 1:500,000 (adapted from Green and Jones, 1997).

58
comprising hyperspectral data are not required for the basic discrimination of
major features across the study area.
This study is a novel approach to the production of classified satellite
imagery displaying surface geologic features using WorldView-2 color-infrared
imagery products of the visible and near-infrared spectrum due to the commercial
Table 2.1: Primary satellite sensors offering commercially-available imagery data and corresponding relevant technical specifications (adapted from Harris et al., 2011).
Sensor Name Type Spectral RangeSpectral
Resolution
Spatial
Resolution
LANDSAT 7
Optical-
Multispectral;
Satellite-borne
0.4 to 2.35 µm and
10.4 to 12.5 µm
65 to 260 nm
and 380 nm
(pan)
30 m (60 m TIR;
15 m Pan)
ASTER
Optical-
Multispectral;
Satellite-borne
0.52 to 0.86 µm;
1.60 to 2.43 µm;
8.125 to 11.65 µm
60 to 100 nm;
40 to 70 nm;
350 nm
15, 30 and 90 m
QuickBird
Optical-
Multispectral;
Satellite-borne
0.45 to 0.90 µm0.60 m Pan;
2 and 44 m Mss
WorldView-2
Optical-
Multispectral;
Satellite-borne
Pan. 0.45-0.8;
VNIR 0.4 to 1.0 µm0.5 m
HYPERION
Optical-
Hyperspectral;
Satellite-borne
0.35 to 2.5 µm ~ 15 nm 30 m
CASI
Optical-
Hyperspectral;
Airborne
0.4 to 1.1 µm ~ 20 nmup to 1.23 m
(crosstrack)
HyMap
Optical-
Hyperspectral;
Airborne
0.4 to 2.5 µm ~ 20 nm 3 to 10 m
PROBE-1
Optical-
Hyperspectral;
Airborne
0.4 to 2.5 µm ~ 20 nm 3 to 10 m

59
Figure 2.2: Location of the study area in relation to the surrounding Gypsum Plain comprised of the Rustler and Castile formations, and the greater Delaware Basin, delineated by the subsurface extent of the Capitan Reef and associated outcrops in various mountain ranges. Study area outlined in red (modified from Stafford, 2008a).
availability of 50 cm spatial resolution. Computer assisted processing of color-
infrared (CIR) satellite imagery was performed in order to produce a surface
geology map through a supervised maximum likelihood classification of surface
reflectance values for the entire study area in order to delineate lateral variations
in lithology less than one m wide and aid in
the identification of corresponding karst
features across the Gypsum Plain. This
study is the first of its kind to use WorldView-
2 high-resolution multispectral satellite
imagery to map the lithologic variability of the
Gypsum Plain and based on published
literature review, the first to be attempted in
any evaporite karst terrain.
The study area is located in
southeastern Eddy County, New Mexico and
encompasses approximately 100 km2 of land
managed by the U.S. Department of the
Interior, Bureau of Land Management (BLM).
The area is commonly referred to as the
Yeso Hills area of the Gypsum Plain in the
60
northwestern portion of the Delaware Basin (Figure 2.2) and is situated along the
northern edge of the Chihuahuan Desert, along the southwestern margin of the
Great Plains physiographic region. The Gypsum Plain is dominated by evaporites
of the Ochoan Castile Formation, as well as residual remnants of the Salado and
Rustler formations and minor secondary limestones (Hill, 1996). Annual
precipitation in the region ranges from 150 to 400 mm, with an average
temperature of 24◦C, resulting in sparse, drought-tolerant vegetation (Stafford,
2015). Evaporite karst features, including surficial karren, sinkholes, and caves
are abundant within the Castile Formation due to the high solubility of gypsum
which results in a complex karst system that presents unique land management
concerns.

61
GEOLOGIC SETTING
The assimilation of Pangea during the late-Paleozoic led to the division of
the Permian Basin and formation of the intracratonic Delaware Basin (see Figure
2.2 inset) with limited connection to the open marine sea (Dickenson, 1981; Hill,
1996). The Gypsum Plain is developed within the northwestern portion of the
Delaware Basin and consists primarily of varved, laminated to massive
anhydrite/gypsum, interbedded with halite, of the late Permian (early Ochoan)
Castile Formation (Dietrich et al., 1995; Hill, 1996; Stafford 2008b). The Castile
represents a classic deep-water deposit within a large, stratified, brine-water
basin (Adams, 1944) formed following marine disconnectivity at the end of
Guadalupian time (Adams, 1972). The Castile overlies the sandstone/siltstone of
the Bell Canyon Formation, and was deposited beneath the Salado and Rustler
evaporite formations of the basin (Figure 2.3). Residual remnants of the
continental Dewey Lake Red Beds, subsequently deposited above the Rustler
Formation at the end of the Permian, mark the end of Permian marine deposition
within the Delaware Basin and the transition to a combination of sabkha to delta-
eolian like environmental fluctuations until subaerial exposure dominated
throughout the Mesozoic.

62
Cretaceous deposition of siliciclastics within the basin included the
interbedded sandstone/conglomerate of the Cox Sandstone, anomalously
located within the study area (Hill, 1996). Until the late Cenozoic, the basin
experienced little tectonic activity and limited, sporadic deposition of sediments,
followed by a period of aerial exposure, uplift and erosion of the late-Miocene
associated with the formation of the western Rio Grande Rift (Kirkland, 2014).
Therefore, surface exposures within the Gypsum Plain consist of the following
lithologies: gypsum, calcite (limestone), dolomite (dolostone), siliciclastics
(sandstone and conglomerates), gypsic soils and weathering byproducts of all
lithologies.
Figure 2.3: Major lithologic units of the Delaware Basin deposited during the middle- to late-Permian with the dominant karst-bearing unit, the Castile Formation, highlighted in grey (adapted from Scholle et al., 2004).

63
Gypsum, the most common bedrock in the study area, promotes extensive
karst development due to its high solubility (2.53 g/L) combined with near-linear
solution kinetics. While most bedrock in the study area is covered by a thin,
secondary gypsic crust (Figure 2.4A), a variety of surficial karren occurs in areas
of exposed bedrock, including: rillenkarren (Figure 2.4B), spitzkarren (Figure
2.4D), kamenitzas, and tumuli. Karren may crop out across a few mm2 to m2 in
area but is generally limited in size. Sinkholes are prolific, appearing as the
dominant geomorphic karst manifestation and ranging in average size from dm to
tens of m in diameter. Filled sinkholes, formed either by collapse of subsurface
features or transport of sediment manifest as closed depressions (Figure 2.4C).
Open sinkholes (Figure 2.4E) are generally connected to solutional conduits or
cave entrances and may range from shallow, elliptical depressions to laterally
elongated, incised arroyos. Sinkholes are commonly associated with partial to
complete infilling by alluvium deposits and associated dense vegetation due to
the higher moisture content available in these unconsolidated fill materials
(Figure 2.4F). Caves and solutional conduits are widespread and often fracture
controlled, ranging from small isolated features to complex forms that may
significantly extend, both laterally and vertically, beneath the land surface
(Stafford, 2008a). For a general review of hydrologically active karst
manifestations within the Gypsum Plain, see Stafford et al. (2008a).

64
Figure 2.4: Common surficial karst manifestations within lithologies of interest across the study area: A) gypsic crust precipitate commonly deposited across a large portion of the study area; B) example of rillenkarren formed within exposed bedrock of the Castile gypsum; C) small-scale closed sinkhole formed due to subsurface collapse within alluvium; D) example of spitzkarren formed on an exposed surface of a gypsum breccia boulder of the Castile Formation; E) open sinkhole containing the entrance to Green Moss Cave formed within bedrock of the Castile gypsum; and F) closed sinkhole formed within alluvium acting as host to a dense cluster of grasses native to the Gypsum Plain.

65
Karst mounds, paleokarst erosional remnants formed by the collapse and
infill of strata overlying subsurface karst voids (Bachman, 1980), sporadically
occur across the Gypsum Plain, including several mounds that have been
identified in the eastern portion of this study area. Karst mounds represent areas
of cavernous porosity within the Castile gypsum and overlying Salado salts that
underwent collapse in the past and experienced infilling by overlying strata that
subsequently created topographic highs by differential weathering of surrounding
gypsum during more recent surface denudation (Bachman, 1980; Hill, 1996).
Karst mounds are generally less than 100 m in diameter with a low relief of 3 to 9
m (Hill, 1996). Steep sided hills composed of Rustler strata (Figure 2.5A) are
found clustered along the periphery of the eastern half of the study area, at an
average height and diameter of five m. K Hill (Figure 5B) provides a more
complex example of this paleokarst phenomena and consists of karstic slump
debris from the Rustler Formation, in addition to rotated and down dropped
blocks of the Dewey Lake and Cox formations, creating an erosional positive
relief structure approximately 18 m high in the central portion of the study area
(Crawford, 1993). The Cox, Dewey Lake Red Beds, and Rustler formations
within the study area solely manifest as karst mounds and have not been
identified in situ at any localities.
Areas of the Gypsum Plain have undergone significant mineralogic
diagenesis resulting in calcitized evaporites, which generally manifest as isolated
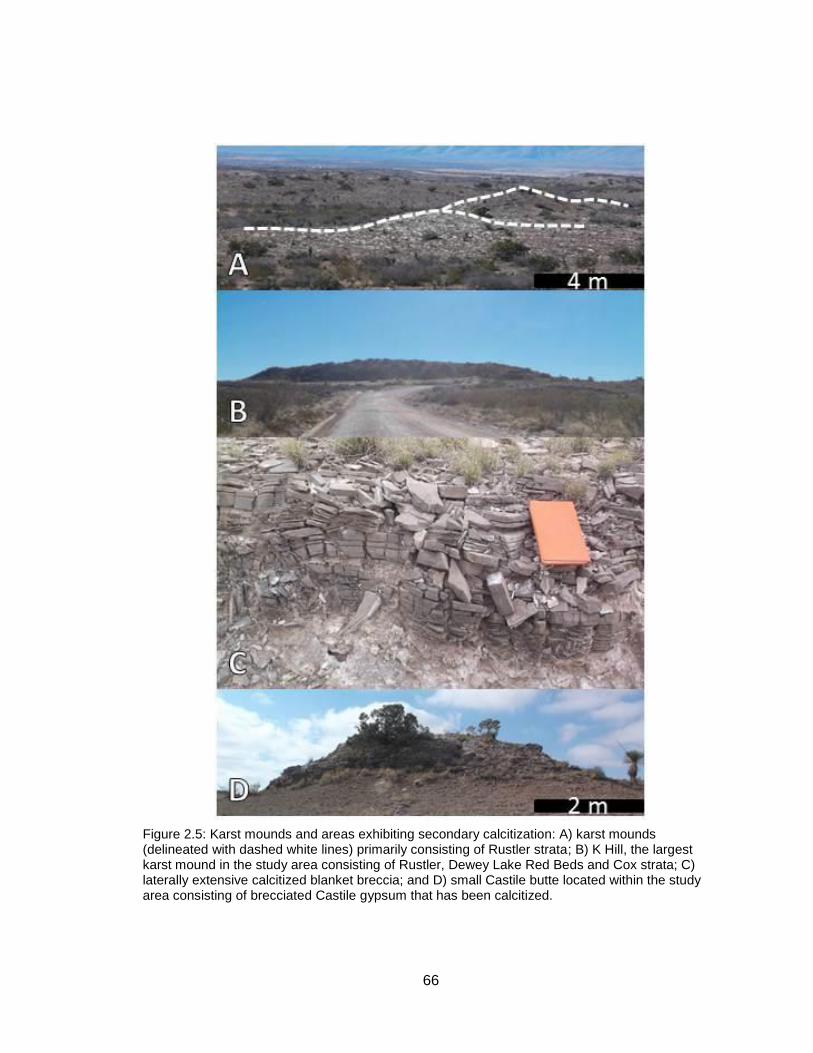
66
Figure 2.5: Karst mounds and areas exhibiting secondary calcitization: A) karst mounds (delineated with dashed white lines) primarily consisting of Rustler strata; B) K Hill, the largest karst mound in the study area consisting of Rustler, Dewey Lake Red Beds and Cox strata; C) laterally extensive calcitized blanket breccia; and D) small Castile butte located within the study area consisting of brecciated Castile gypsum that has been calcitized.

67
masses at the land surface or laterally extensive surface horizons (Figure 2.5C).
Ascending light hydrocarbons, likely methane, reduced calcium sulfate to
limestone throughout the Ochoan evaporites via either Bacterial Sulfate
Reduction or Thermal Sulfate Reduction (Stafford, 2008c; Kirkland and Evans,
1976). Isolated limestone buttes, also known as “Castile Buttes” (Figure 2.5D),
crop out across the Gypsum Plain as a product of differential weathering of these
calcitized zones, creating topographic highs ranging from a few m2 to tens of
thousands of m2 in area, and a maximum height of 40 m (Kirkland and Evans,
1976; Stafford, 2008c). Laterally extensive limestone sheets are present as
residual brecciated clasts at the surface or as intact linear sheets dipping into the
subsurface, generally where surrounding gypsum has been dissolved leaving
less soluble calcitized residuum. Limestone sheets may range from a few dm to
up to two m in thickness and can crop out over thousands of m2 (Stafford,
2008a). Float of secondary limestone, small clasts of brecciated rock displaced
by surface processes, may be localized to areas where the limestone is exposed
at the surface or may cover wide areas of the landscape. Calcitization processes
and mineral conversion of associated sulfur-ore deposits have also produced
secondary selenite occurrences through near-surface oxidation which manifest
as linear features, fracture fillings and lenticular masses (Stafford, 2008c).

68
MULTISPECTRAL IMAGERY DATASET AND CHARACTERIZATION
The use of remote sensing data to discriminate between and identify
surficial lithologies for the purpose of geologic mapping is a well-established
practice (Van der Meer et al., 2012). A variety of optical sensor data are available
for this purpose, featuring varying spectral and spatial ranges and resolutions
appropriate for different purposes and methodologies (Table 1). Today,
hyperspectral data is most commonly employed in regional bedrock
characterization due to greater spectral resolution and range allowing for
increased ability and accuracy for identifying earth materials, such as mineral
groups and lithotypes, across lithologically variable landscapes for the purpose of
mineral mapping and exploration (Harris, et al., 2011; Kruse, 2015; Van der
Meer, 2012). However, limited spatial resolution of commercially/publicly
available data from hyperspectral sensors prevents small-scale outcrops and
features from being discernible across an image, making it unsuited for the
identification of small lithologic changes associated with karst features such as
those present within the study area investigated and greater Gypsum Plain.
Hyperspectral imagery data is also difficult to obtain and process, costly, and
exhibits great redundancy in data (Kruse, 2015). Currently, the highest
resolution, commercially-available hyperspectral data is 30 m Hyperion satellite-

69
borne data or that obtained via unmanned aerial vehicles (UAVs) equipped with a
camera capable of collecting hyperspectral data. The use of UAVs in conjunction
with hyperspectral cameras pose their own set of problems, including the high
cost of both the platform and camera, time and possible travel required for
collection of data and the ability of the user to operate the UAV effectively, to
name a few. Conversely, multispectral data is less expensive/often free, less
redundant and widely publically-available in increased spatial resolutions of up to
50 cm or less.
Karstic features targeted by this study generally occur on the cm to m
scale and associated surficial lithologic variability is common over short lateral
distances; therefore, more refined spatial resolution was required for lithologic
mapping for improved natural resource management. As seen in Table 2.1, of
commercial imagery available for purchase, WorldView-2 satellite imagery
features the highest multispectral resolution available at 0.5 m (Harris et al.,
2011). Traditionally, CIR imagery is used to differentiate vegetation health across
a target area through the use of band rationing techniques (Wolf, 2010; Hamideh
et al., 2014). However, the geologic remote sensing community has traditionally
utilized visible to near-infrared imagery for lithologic and structural mapping.
Additionally, working with a limited number of bands such as only those present
within CIR datasets reduces extraneous data redundancy brought on by the
overlap of adjacent channels in each sensor (van der Meer et al., 2012).

70
WorldView-2 CIR satellite imagery, acquired on September 27, 2016, was
purchased by Stephen F. Austin State University, Department of Geology for use
in this study, chosen for its 50 cm spatial resolution of generated products.
Orthorectification and radiometric corrections were performed prior to purchase
and imagery acquisition, including a dark offset subtraction and non-uniformity
correction (Updike and Comp, 2010). Atmospheric corrections were performed,
including conversion of raw digital numbers to top-of-atmosphere spectral
radiance, and subsequently top-of-atmosphere reflectance using ArcGIS 10.2
following the process outlined by Updike and Comp (2010).

71
IMAGE CLASSIFICATION
Before performing image classification, a control point database was
established for all documented surficial lithology types and karst features present
within the study area. 10, one km2 grids divided into traverse lines spaced at 50
m intervals were randomly selected across the study area and systematically
mapped in order to develop detailed representative maps of lithologic and
geomorphic variability. Based upon data collected through field mapping of each
gridded control site, combined with a priori knowledge of the area and known
geology, 10 unique sample classes were established for image analyses
comprising the majority of the surface lithologies and features within the study
area: 1) alluvium, 2) algal crust, 3) surficial gypsite precipitates, 4) dense
vegetation manifesting usually as bushes one-quarter to several m2 in area, 5)
calcitized breccia zones or float, 6) exposed Castile gypsum bedrock, 7) residual
Cox strata, 8) residual Dewey Lake Red Beds strata, 9) residual Rustler strata,
and 10) surface bodies of water. Subsequent to field mapping, additional areas
suspected of representing each of the 10 established classes were
systematically identified across the entirety of the study area in order to evaluate
feature class variability using Google Earth Pro. Locations of identified features
were recorded and physically verified in the field to supplement field data

72
attained from detailed physical mapping of gridded sites. Once verified for
accuracy, GPS coordinates were established for 106 control points representing
each lithology or lithologic feature of interest across the entire study area, not
including bushes/large vegetation features (Figure 2.6). These control points
were utilized to create training samples and establish reflectance values of the
corresponding CIR raster cells. Vegetation related control points were
established directly within the original CIR imagery products in order to account
for the temporal change associated with vegetation life cycle and actual physical
existence of features both on the ground and within the image.
Computer assisted processing was employed via ArcGIS for Desktop 10.2
software in order to produce a maximum likelihood classification (MLC) of the
CIR imagery acquired for use within this study. Based on the control points
previously established in the field, areas corresponding to each lithology type
were specified and surface reflectance values extracted in the form of training
samples. A signature file was created, in which each individual class was
assigned the mean vector and covariance matrices of the collective cells
comprising the specific training sample, and used to perform a maximum
likelihood classification of each raster cell within the study area. The final product
consisted of an output classified raster in which each cell was assigned a class
based on the value of the cell.

73
Fig
ure
2.6
: Locatio
n o
f each c
ontr
ol po
int id
entified a
nd f
ield
checked f
or
nin
e o
f th
e 1
0 c
lasses u
sed
for
late
r cla
ssific
atio
n o
f th
e
colo
r-in
frare
d d
ata
se
t (c
ontr
ol po
ints
were
not esta
blis
hed f
or
“Ve
geta
tion”)
. C
hart
(to
p left
) d
eta
ils t
he n
um
ber
of
contr
ol p
oin
ts
acro
ss the la
ndscap
e c
orr
espond
ing t
o e
ach c
lass ide
ntified
in
the
fie
ld.
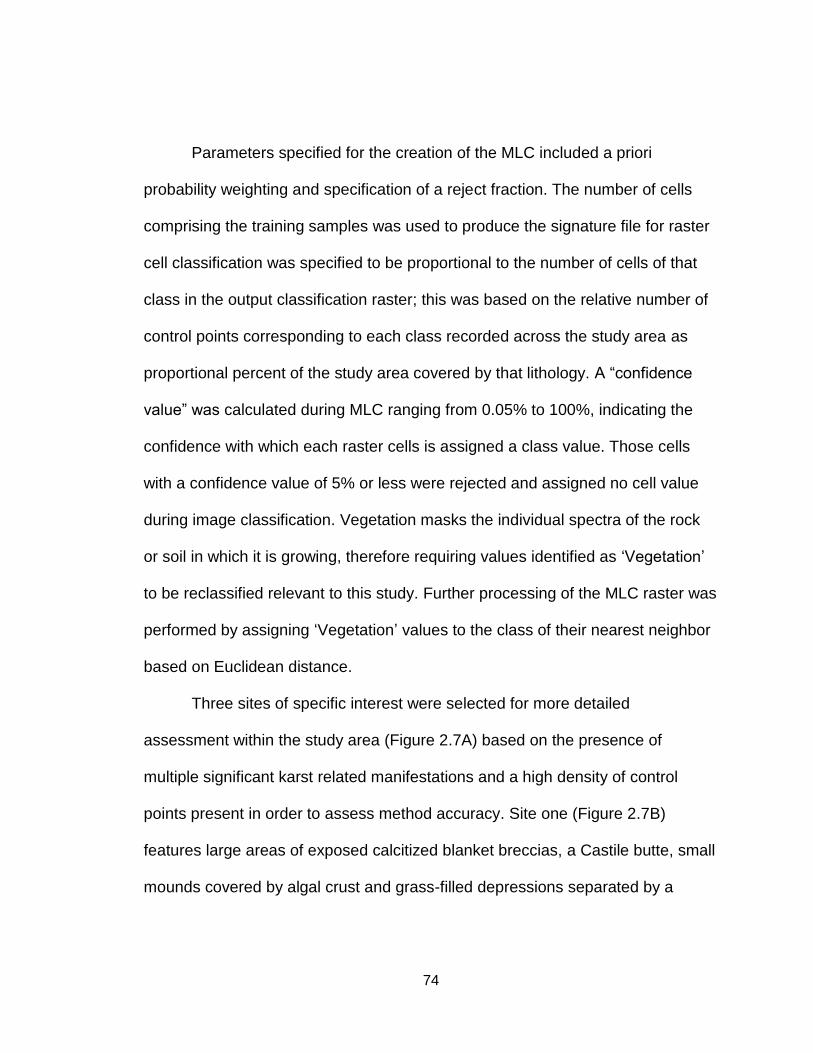
74
Parameters specified for the creation of the MLC included a priori
probability weighting and specification of a reject fraction. The number of cells
comprising the training samples was used to produce the signature file for raster
cell classification was specified to be proportional to the number of cells of that
class in the output classification raster; this was based on the relative number of
control points corresponding to each class recorded across the study area as
proportional percent of the study area covered by that lithology. A “confidence
value” was calculated during MLC ranging from 0.05% to 100%, indicating the
confidence with which each raster cells is assigned a class value. Those cells
with a confidence value of 5% or less were rejected and assigned no cell value
during image classification. Vegetation masks the individual spectra of the rock
or soil in which it is growing, therefore requiring values identified as ‘Vegetation’
to be reclassified relevant to this study. Further processing of the MLC raster was
performed by assigning ‘Vegetation’ values to the class of their nearest neighbor
based on Euclidean distance.
Three sites of specific interest were selected for more detailed
assessment within the study area (Figure 2.7A) based on the presence of
multiple significant karst related manifestations and a high density of control
points present in order to assess method accuracy. Site one (Figure 2.7B)
features large areas of exposed calcitized blanket breccias, a Castile butte, small
mounds covered by algal crust and grass-filled depressions separated by a

75
significant amount of gypsite in which several karstic sinkholes have been
identified. The second site (Figure 2.7C) is focused on the carbonates of K Hill,
surrounded by gypsite and exposed gypsum containing multiple small epigene
Figure 2.7: Color-infrared imagery of selected sites of interest evaluated, including: A) relative location of three sites within larger study area (see figure 1 for reference location of Figure 8A); B) clustered area of exposed calcitized breccia and one of the two Castile buttes located in the study area; C) K Hill karst mound remnant of paleocavern breccia infilling; and D) clustered area of karst mounds composed of Rustler collapse strata.
76
karst features. Site three (Figure 2.7D) was chosen for the presence of several
karst mounds of the Rustler Formation separated by gypsite.
Figure 2.8 displays the final classified images produced for the three sites
of specific interest, while Figure 2.9 is that of the entire study area. Correlation of
the control points used to create training samples indicates that 61% of points
were classified with absolute accuracy. Discrepancies in lithologies most often
occurred between cells classified as the Rustler Formation and Gypsite, which is
consistent with field observations where Rustler Hills are almost always capped
by well-developed gypsite. Figure 2.10 indicates that this is due in part to the
similarity in reflectance values indicated by the two lithologies. Areas of gypsite
not associated with Rustler across the study area, but classified as so are due to
the similar reflectance values. Additionally, the Cox Formation and Dewey Lake
Red Beds are difficult to distinguish from one another due to the same similarity
in mean reflectance values exhibited between classes. Both the Cox and Dewey
Lake are carbonates with similar chemical compositions, thus similar reflectance
values. Visual comparison with Google Earth Pro imagery was used to evaluate
the overall accuracy of the area which showed strong a priori agreement with
knowledge of the study area. All control point values misclassified were clusters
of only a few cells, less than a few m2, located within a greater area of the control
point lithology.

77
Figure 2.8: Final Maximum Likelihood Classification rasters produced for each of the three areas of interest from figure 2-7: A) relative location of three sites within larger study area (see figure 1 for reference location of Figure 8A); B) clustered area of exposed calcitized breccia and one of the two Castile buttes located in the study area; C) K Hill karst mound remnant of paleocavern breccia infilling; and D) clustered area of karst mounds composed of Rustler collapse strata.

78
Fig
ure
2.9
: F
inal lit
ho
log
ic s
urf
ace m
ap o
f th
e s
tud
y a
rea b
ase
d o
n the
maxim
um
lik
elih
ood
cla
ssific
ation p
erf
orm
ed.

79
Post-depositional alteration of gypsum due to high solubility and ease of
weathering has resulted in the existence of a thin gypsic residue across the
landscape of the Gypsum Plain (Watson, 1982). Spectral sensors employed in
the collection of CIR data only collect data concerning surface reflectance
characteristics, indicating that many of the signatures collected have been
influenced by the weathered, surficial residue (Harris et al., 2011) inhibiting the
comparison of values across the image observed with standard laboratory-based
values for carbonates and evaporites for accuracy.
Figure 2.10: Graph displaying the mean reflectance value of each band for the corresponding class’ training samples. Note distinct reflectance values for most sample classes.

80
CONCLUSIONS
Surface geologic maps created through the classification of spectral
reflectance values across a landscape via satellite imagery is a more efficient
approach to characterization of the lithologic variability within the karsted
landscape of the Gypsum Plain of the Delaware Basin than traditional methods
commonly employed. Results of this study enabled efficient and largely effective
geologic mapping of the entire 100 km2 study area (Figure 2.10), which could be
extended throughout the entire Gypsum Plain and is currently being utilized for
improved delineation of likely regions of more intense karst development,
including caves and paleokarst features. High spatial resolution is especially
important in the creation of such products, resulting in the use of multispectral
data rather than hyperspectral data in this study based on current technology of
commercially-available data. Based on the training sample values and
classification parameters used, the methods employed in this study produced a
more accurate representation of the study area based on comparison with control
points, Google Earth Pro imagery and familiarity with the area, than traditional,
published geologic maps of the region indicate (Figure 2.1).
Differences in control point values and classified cell values were the
product of extremely similar reflectance values across multiple bands of the CIR

81
imagery due to similar chemical composition of actual or constantly associated
lithologies and were almost always individual to small clusters of cells located in
a greater area of the correct lithology; the confusion between Rustler and gypsite
lithologies, where gypsite thinly mantles Rustler strata, being the exception. The
use of such remotely-sensed map products as those developed in this study
allows for targeted survey and identification of karst features, rather than
methodical surveys that often take months to years of field observations to
complete, thus increasing field efficiencies and reducing potential assessment
costs.
The creation of surface geologic maps via less expensive, less time
consuming processes such as satellite image classification for the
characterization and use in identification of geologic variability across a karsted
landscape is useful to entities such as the Bureau of Land Management or other
agencies for a more efficient approach to natural resource management. Greater
availability and decreased cost of multispectral data than that of hyperspectral,
as well as simplified pre- and post-classification image processing allows for the
use of proposed methods by a greater community and lower skill and experience
levels with remote sensing. As technologies increase, hyperspectral imagery
analyses will likely be used for even greater accuracy (especially of cells
pertaining to Rustler/gypsite and Cox/Dewey Lake issues) of remotely sensed
geologic mapping within the Gypsum Plain and similar arid environments, but

82
currently, commercially-available, satellite-based hyperspectral imagery
resolution is too poor. New and rapidly advancing UAV technologies will provide
significant opportunities for improved geologic characterization within complex
karst systems such as the Gypsum Plain in the near future, but likely require a
significantly higher cost to be obtained, as well as all issues previously specified.
83
REFERENCES
Adams, J.E. (1944). Upper Permian Ochoa series of Delaware Basin, West Texas and southeastern New Mexico. Am. Assoc. Petroleum Geol. Bull., 28, 1596-1625.
Adams, J.E. (1972). Semi-cyclicity in the Castile anhydrite; in Elam, J.G. and Chuber, S. (eds.), Cyclic sedimentation in the Permian Basin. Texas: West Texas Geol. Soc.
Bachman, G. O. (1980). Regional geology and Cenozoic history of Pecos Region, Southeastern New Mexico. U.S. Geol. Surv., Open-file Rept. 116, 80-1099.
Crawford, J. E. (1993). K Hill and the Yeso Hills selenite occurrence. in Love, D.W., Hawley, J.W., Kues, B.S., Adams, J.W., Austin, G.S. & Barker, J.M. (Eds.), Carlsbad Region, New Mexico and West Texas. New Mexico: New Mexico Geological Society.
Dickenson, W. R. (1981). Plate tectonic evolution of the southern Cordillera. Arizona Geological Society Digest, 14, 113-135.
Dietrich, J. W., Owen, D. E., Shelby, C. A., & Barnes, V.E. (1995). Geologic atlas of Texas: Van Horn- El Paso sheet. Austin: University of Texas Bur. Econ. Geol.
Green, G.N. and Jones, G.E. (1997). The Digital Geologic Map of New Mexico in ARC/INFO Format: U.S. Geological Survey Open-File Report 97-0052.
Harris, J., Wickert, L., Lynds, T., Behnia, P., Rainbird, R., Grunsky, E., McGregor, R., & Schetselaar, E. (2011). Remote Predictive Mapping 3.

84
Optical Remote Sensing - A Review for Remote Predictive Geological Mapping in Northern Canada. Geoscience Canada, 38(2), 49-84
Hamideh, N., Beecham, S., Anderson, S., and Nagler, P. (2014). High spatial resolution WorldView-2 imagery for mapping NDVI and its relationship to Temporal Urabn Landscape Evapotranspiration Factors. Journal of Remote Sensing, 6, 580-602.
Hill, C. A. (1996). Geology of the Delaware Basin, Gudalupe, Apache and Glass Mountains: New Mexico and West Texas. R. F. Lindsay & R. A. Garber (Eds.). Midland, Texas: Permian Basin Section- SEPM.
Kirkland, D.W. (2014). Role of hydrogen sulfide in the formation of cave and karst phenomena in the Guadalupe Mountains and western Delaware Basin, New Mexico and Texas. National Cave and Karst Research Institute, special paper 2.
Kirkland, D.W. and Evans, R. (1976). Origin of limestone buttes, Gypsum Plain, Culberson County, Texas. Am. Assoc. Petroleum Geol. Bull., 60(11), 2005-2018.
Kruse, F. A. (2015). Integrated visible and near-infrared, shortwave infrared, and longwave infrared full-range hyperspectral data analysis for geologic mapping. Journal of Applied Remote Sensing, 9(1), 096005-1-096005-17.
Stafford, K.W.(2015). Evaluation of Existing Geologic Conditions along RM 652: Initial Characterization of Karst Geohazards Associated with RM 652 in Culberson County, Texas: TxDOT rep.,1–71.
Stafford, K., Nance, R., Rosales-Lagarde, L., and Boston, P. (2008a). Epigene and hypogene gypsum karst manifestations of the Castile Formation: Eddy County, New Mexico and Culberson County, Texas, USA. International Journal of Speleology, 37(2), 83–98.

85
Stafford K.W., Rosales-Lagarde L. and Boston P.J. (2008b). Castile evaporite karst potential map of the Gypsum Plain, Eddy County, New Mexico and Culberson County, Texas: a GIS methodological comparison. J. Cave and Karst Studies, 70(1), 35-46.
Stafford, K.W., Ulmer-Scholle, D., and Rosales-Lagarde, L. (2008c). Hypogene calcitization: Evaporite diagenesis in the western Delaware Basin. Carbonates Evaporites, 23(2), 89–103
Updike, T. and Comp, C. (2010). Radiometric use of WorldView-2 imagery. Digital Globe. Tech. Rept.
Van der Meer, F.D., van der Werff, H.M., van Ruitenbeek, F.J., Hecker, C.A., Bakker, W.H., Noomen, M.F., van der Meijde, M., Carranza, E.J.M., de Smeth, J.B., Woldai, T. (2012). Multi- and hyperspectral geologic remote sensing: A review. Int. J. Appl. Earth Obs. Geoinf, 14, 112-128.
Watson, A. (1982). The origin, nature and distribution of gypsum crusts in deserts. University of Oxford.
Wolf, A. (2010). Using WorldView 2 VIS-NIR MSI Imagery to Support Land Mapping and Feature Extraction Using Normalized Difference Index Ratios. Proc.SPIE, 8390.

86
APPENDIX A
DETAILED LITERATURE REVIEW

87
INTRODUCTION
The Delaware Basin of southeast New Mexico and West Texas is the site
of extensive karst development within evaporite strata. The presence of karst
creates complex natural resource management problems for the region. Oilfield
drilling and exploration operations
have increased recently due to
advances in hydrocarbon extraction
abilities, placing additional
environmental pressures on the
natural resources of the area,
including water resources and
associated karst.
The Delaware Basin is
located within the western portion
of the Permian Basin of
southeastern New Mexico and
West Texas (Figure A1). The basin
occupies an area of approximately
33,500 km2 and is an irregular, Figure A1: Extent and location of the Delaware Basin in the Trans-Pecos Region (MB-Midland Basin: VB-Val Verde Basin) (from Stafford, 2015).

88
north-northwest trending, inverted pear-shaped depression 250 km long and 180
km wide. Approximately 7,315 m of Phanerozoic sediments reside within this
depression (Hill, 1996); the inner basin area is surrounded by the Capitan Reef
complex. The Delaware Basin is primarily situated within the Chihuahuan Desert
in the Pecos River section of the Great Plains, receiving on average 150 to 400
mm of precipitation per year and maintaining an average temperature of 24 Co
(Stafford, 2015).
During Guadalupian time, a thick sequence of siliciclastic sediments was
deposited within the Delaware Basin as the Cherry Canyon and Bell Canyon
formations, as well as limestone as reef material with interbedded carbonates
and siliciclastics of the shallow lagoonal shelf formed inland. The basin was the
last site of deep water sedimentation and massive reef growth in the area (Hill,
1996). Following this, the Ochoan Series of the Late Permian saw deposition of
thick sequences of evaporites caused by the closing of the Hovey Channel and
the Delaware Basin to marine waters marking the beginning of the continental
regime within the Delaware Basin. The Castile, Salado, Rustler, and Dewey Lake
continental red beds were all deposited sequentially throughout Ochoan time
(Hill, 1996)

89
GEOLOGIC HISTORY
The structural history of the Delaware Basin may be divided into a series
of phases beginning with the passive margin phase (Horak, 1985). Initially, a
peninsular spur originated off of the Transcontinental Arch which covered areas
of southeastern New Mexico and western Texas. Sagging of this peninsular spur,
due to cooling and shrinking of underlying crust and mantle rocks, created the
negative axis of the Tobosa Basin (Adams, 1965). The Tobosa Basin developed
as a broad, shallow, gently dipping depression characterized by weak crustal
extension and low rate subsidence (Galley, 1958; Horak, 1985). The Early
Ordovician Ellenberger Sea slowly transgressed over this flattened coastal plain
from the Marathon Embayment to the south (Adams, 1965). Aside from minor
periods of exposure, deposition began and continued for almost 300 million
years. Crustal warping led to a series of sags and arches throughout the basin
that were further intensified by block-faulting (Hill, 1996). The largest of the sags
consists of a 563 km wide depression between the Texas Arch to the east and
the Diablo Arch to the west (Adams, 1965).
The collision phase began with the formation of the supercontinent of
Pangea through the collision of Laurasia and Gondwana (Hill, 1996). This
collision caused the originally negative axis of the Tobosa Basin to be lifted to

90
form the Central Basin Platform, leading to the structural separation seen today
of the Delaware and Midland basins (Figure A2). Additionally, the Ouachita-
Marathon fold belt was formed along high-angle basement faults and pre-existing
zones of weakness (Horak, 1985). The early Pennsylvanian was a time of rapid
subsidence within the western Delaware Basin, which remained a deep water
site until at least the end of Guadalupian time (Adams, 1965; Hill, 1996). The
eastern portion of the Delaware Basin experienced a deepening due to vertical
movement followed by a tilting to the east (Hills, 1984).
These events carried into the Permian Basin phase, when tectonic stability
was achieved. At this time, the region was part of the southern flank of the North
American craton, on the western margin of Pangea (Hill, 1996). The Early
Figure A2: Location and relationship of major sedimentary basins associated with study (from Pioneer Natural Resources, 2016).

91
Permian Wolfcampian experienced rapid filling of the previously formed sags with
clastics from nearby mountain ranges and the formation of reef fringed
carbonate/evaporite platforms (Horak, 1965). The Leonardian saw a decrease in
the extreme rate of subsidence previously experienced (Adams, 1965). With the
Guadalupian came a shift in sediment deposition to siliciclastic accumulations,
while the platforms and shelves experienced carbonate deposition (Adams,
1965). Uplift of the basin eventually caused the Hovey Channel, the source of
marine waters within the Delaware Basin, to close (Hill, 1996).
The Mesozoic marked the beginning of the stable platform phase. During
this period all elements of the Permian Basin remained intact and acted as a
single unit (Horak, 1965). The restricted seas of the Ochoan expanded eastward
and northward with a new epoch of sagging (Adams, 1965). The surrounding
Southern Cordillera experienced a much different history, with rifting acting to
separate North and South America. The Marathon region also experienced
similar rifting and spreading related to the Yucatan’s separation from Texas (Hill,
1996). As the rifted margin of the Gulf of Mexico subsided, a transgression of
marine waters was able to spread across Texas and portions of the western
United States. This transgression led to additional sediment deposition within the
Delaware Basin and surrounding areas (Keith, 1982).
The stable platform phase followed the Permian Basin phase. Little
movement occurred during this phase, causing few new structures to be formed

92
within the basin. The Laramide Orogeny occurred approximately 150 million
years later, causing little deformation to the basin. Volcanic deposits originated in
six centers within West Texas and adjacent portions of Mexico, ushering in the
volcanic phase of the Late Eocene to Late Oligocene. This volcanic phase
produced intrusive and extrusive volcanism in the Glass Mountains and
deposited dikes within basinal areas (Hill, 1996). This led to a large increase in
heat flow in the Delaware Basin: the cause of this activity is a matter of
speculation. Finally, the Basin and Range phase saw extensive tectonism in the
southwestern United States, primarily leading to additional uplift in the Delaware
Basin (Horak, 1985). Block faulting and jointing on the western side of the
Delaware Basin caused the adjacent Salt Basin to downdrop. Tensional stress
produced high-angle normal faulting and fracturing (Hill, 1996).
Guadalupian Series Stratigraphy
Guadalupian time marked the end of normal marine carbonate deposition
in the Delaware Basin. Extensive reefs composed of organic-inorganic, long,
linear, wave-resistant structures, characterized this eight to nine million-year-long
period. The deep basin consisted of a dense sequence of siliciclastics while
limestone was deposited as reef material around the periphery. The shallow shelf
lagoon was made up of interbedded carbonates, evaporites and siliciclastics. The
decrease in areal extent of the Delaware Basin occurring throughout this time

93
resulted in the isolation of the Midland Basin, leaving the Delaware Basin as the
final site of deep water sedimentation and massive reef-structure growth in the
late Permian (Hill, 1996).
Cherry Canyon Formation
At the southern end of the Guadalupe Mountains, making up the upper
half of the slope below the Capitan Limestone cliffs, the Cherry Canyon (Figure
A3) comprises the middle formation of the Delaware Basin (King, 1942). This
formation averages 300 to 400 m in thickness, and consists of thin-bedded,
finely-laminated, fine-grained sandstone and siltstone. A cyclic deposition of
sedimentation is evident in the repetition of shaly sandstone, followed by thin-
bedded sandstone, concluding with lenticular or nodular sandstone before the
three types are repeated every 3 to 6 m. Tongues of limestone that may be
Figure A3: Lithologic units of the Delaware Basin and associated cross-section (adapted from Scholle et al., 2004).
94
traced or correlated with reef and shelf rocks of the Delaware Basin are also
present within the Cherry Canyon Formation (Hill, 1996).
A few km shelfward, making up the lower quarter of the Cherry Canyon, is
a sandstone tongue varying from 30 to 60 m in thickness. Above this lies the
Getaway Limestone Member which varies from 60 to a few m in thickness. The
Getaway Limestone is a black to dark-gray, thinly-bedded, dolomitic limestone.
Often, silty locales may be found containing some lighter gray, granular, very
fossiliferous units. Carbonate debris flow deposits are also common.
Approximately 180 m above the base of the Cherry Canyon is the South Wells
Limestone Member. Thin- to medium-bedded, black to gray, fossiliferous,
dolomitic limestone is interbedded with buff to brown, fine-grained sandstone
beds for a total thickness of 20 to 25 m. Laminated beds and current ripple marks
are common here (Hill, 1996).
The uppermost member of the Cherry Canyon Formation is the Manzanita
Limestone Member. This is a dense, buff-colored to earth gray dolomite ranging
from 20 to 45 m in total thickness. Several layers of waxy, green, bentonite ash
beds and pale apple-green, siliceous shale or chert beds may be found
throughout the member (Beck, 1967). King (1948) speculated that these volcanic
ash layers present over the entire outcrop area may have originated from a
volcanic area to the south. The Manzanita Member also features a paleontologic
gap that extends to the base of the Hegler Member of the Bell Canyon

95
Formation. Only poorly preserved fossils may be found here. This may be due to
the nature of the late Cherry Canyon Formation as that of a period of transition
for invertebrates within the Delaware Basin and an abrupt and substantial drop in
sea level (Hill, 1996).
Bell Canyon Formation
Between the Delaware Mountains and the Gypsum Plain to the east, the
Bell Canyon Formation crops out as a broad belt. The uppermost formation of the
Delaware Mountain Group, the Bell Canyon, ranges anywhere from 200 to 300 m
thick (King, 1942; Henrickson and Jones, 1952). The Bell Canyon Formation is
lithologically similar to the Cherry Canyon Formation, consisting of fine-grained
sandstone and coarse-grained siltstone with some interbedded, thin limestone.
The sands present are extremely well-sorted, fine-grained quartz (Hill, 1996). In
addition, the formation exhibits high feldspar content (Jenkins, 1961). Carbonate
tongues existing near reef margins exhibit abundant fossil content while deeper
basin waters were not able to support life; therefore, they contain low, restricted
fossil quantities. As seen in the Cherry Canyon Formation, carbonate tongues of
the Bell Canyon interfinger with sandstone units along the margin of the basin,
continue to thicken in the reefward direction and finally merge with the Capitan
Limestone. These carbonate tongues are correlative with upper Guadalupian
shelf units (Hill, 1996).

96
The Bell Canyon Formation consists of five formally named carbonate
members of the marginal facies, all exhibiting a strongly calcitic nature. The
lowest member, the Hegler Limestone, consists of a dark gray slabby limestone
up to 75 m thick in certain areas (King, 1942). The Hegler Limestone may range
from the properties seen at the type locality of a dark gray, fine-grained limestone
made up of closely-spaced nodules a few cm thick, to a dense, light gray, thinly-
bedded, spotty limestone containing vugs filled with spar as seen on the western
face of the Guadalupe Mountains (King, 1948). These limestones stand in two
distinct groups of ledges with a total thickness of three to six m, separated by a
break consisting of sand or marl. Directly above the Hegler Limestone Member
lies the Pinery Limestone Member, in areas as much as 45 m thick. The Pinery
Limestone is a dark gray, fine-grained, somewhat cherty limestone of thin straight
beds containing several thicker, light-colored layers near the base (Hill, 1996).
Thinning of the member occurs from about 35 m at the basin margin to about five
m approximately 20 km basinward (Koss, 1977).
Following this is the Rader Limestone Member. The Rader Limestone is a
massive, light gray limestone ranging from 10 to 40 m thick and darkening in the
basinward direction (King, 1942). Outcrops tend to contain reef and upper slope-
derived, poorly-sorted, pebble to boulder sized lithoclasts set in a sandstone
matrix (Scholle and Halley, 1980). Sheet-like megabreccias of a mixed-debris
flow/turbidite origin are also commonly found within the Rader (Lawson, 1989 a,

97
b); at least one apple-green, volcanic ash layer of bentonite also exists here. The
McCombs Limestone Member, usually less than five m thick, follows the Rader
as a very thin and flaggy limestone (King, 1942). A thick, 120 m sequence of
sandstone occurs between the Rader and Lamar members. This sandstone
interfingers with the McCombs; sands equivalent to the informal member of the
Ramsey Sand of the deep basin and Yates reside on the shelf (Hill, 1996).
Finally, the last of the formally named carbonate members and uppermost
limestone tongue of the Bell Canyon Formation is the Lamar Limestone Member.
This is an extremely useful correlation unit. The Lamar is black in color with an
approximately uniform thickness of eight m across the entire Delaware Basin. As
a dense, flaggy, gray to black, fossiliferous limestone, the member contains a
significant amount of organic matter. Some areas exhibit laminations or high
chert content. As the five marginal carbonate members pinch out basinward, they
are replaced by a series of sandstone units in the deeper water basin.
Depositional water depths have been speculated to range from 100 m (King,
1934) to 730 m (Adams, 1936), and close to 500 m near the end of the Bell
Canyon time (Williamson, 1980). These deep water sands include the Hayes
Sand, Olds Sand, Ford Shale, Ramsey Sand, and Lamar (or Trap) Shale (Hill,
1996).

98
Ochoan Series Stratigraphy
The Ochoan series marks the ending stage of the Permian Sea and the
marine events occurring from Precambrian to Guadalupian time. The shift from
limestones, siltstones, and sandstones to thick sequences of evaporites and
thinner sequences of red beds signifies the closing of the Delaware Basin to
marine waters. The following continental regime created 1200 to 1500 m of strata
over the 500,000 to 600,000 year period (Hill, 1996). A soluble, friable nature
exists here causing outcrops of Ochoan age rock to be more common in the
subsurface (Jones, 1954). Formations present within the Ochoan series include
the Castile, Salado, Rustler, and Dewey Lakes. The Castile consists mainly of
anhydrite, the Salado of halite, the Rustler of dolomite and anhydrite, and the
Dewey Lakes of continental red beds (Hill, 1996). Each of these formations
indicates the existence of an interior continental desert with a very arid climate in
West Texas and eastern New Mexico (Scholle et al., 1992).
Castile Formation
The oldest unit of the Ochoan Series consists of massive to laminated
anhydrite and gypsum interbedded with halite that is completely devoid of fossils
(Henrickson and Jones, 1952). The Castile crops out from the Delaware
Mountains to the Rustler Hills, from west to east, on the Gypsum Plain.
Thickness varies from areas completely lacking the formation to areas exhibiting

99
480 m of Castile thickness in the subsurface: at the surface it weathers to form a
grayish-white gypsite. Dissolution of halite has caused breccia zones, initiated by
the uplift and tilting of the west side of the basin (Hill, 1996).
Essentially, non-evaporite deposits are nonexistent within the Castile
Formation and it is almost clastic free (Kerr and Thompson, 1963; Kelley, 1972).
A common geomorphologic feature found in the Castile is the existence of
Castile buttes. These are circular hills of limestone that may be found to extend
as high as 30 m above the Gypsum Plain. When present in the subsurface, the
accumulations are known as “Castile masses” (Adams, 1944). Sulfate reduction
common during the Tertiary led to bioepigenetic replacement of anhydrite by
calcite, forming these secondary limestones. These features may range
anywhere from a few m2 to a few hundred m2. Nine informal units comprise the
Castile: Basal Limestone, Anhydrite I, Halite I, Anhydrite II, Halite II, Anhydrite III,
Halite III, Anhydrite IV, and the Painthorse members (Hill, 1996).
Salado Formation
The Salado is a halite formation with supplementary beds of anhydrite,
polyhalite, potash salts and occasionally red sandy clay layers (Henrickson and
Jones, 1952).These halite beds are composed of fine- to coarse-grained, clear
halite with disseminated clay and polyhalite, in addition to laminae (Linn and
Adams, 1966). The anhydrite beds present are gray, fine- to medium-grained and
generally laminated with varves approximately five mm thick (Lang, 1935).Brick-
100
red, massive, and fine-grained polyhalite beds exist here, with potash salts
occurring locally within the northern section of the Delaware Basin (Hill, 1996).
Magnesite is also abundant within the Salado Formation (Stein and Krumhansl,
1988).
The three informal members of the Salado Formation include various
formal members within their sequences. The Lower Member ranges in thickness
from 100 to 300 m throughout the basin. This member contains the Fletcher
Anhydrite, a 45 m thick halite zone, the La Huerta Siltstone, and the Cowden
Anhydrite. The Fletcher Anhydrite and La Huerta Siltstone are each only found
on the shelf today. Overlying these key beds is a zone 60 m in thickness
consisting of alternating halite and anhydrite beds. The McNutt Potash Member,
the middle section of the Salado Formation, consists of commercially valuable
potash ore found mainly in the Carlsbad potash district near Carlsbad, New
Mexico (Hill, 1996). The Upper Member consists of bedded halite, anhydrite,
polyhalite, and clay approximately 150 m thick (Gard, 1968).
Rustler Formation
Extending from the Apache Mountains in the south to southeastern New
Mexico in the north, the outcrop belt of the Rustler Formation displays the
alternating transgressions and regressions of the Rustler Sea. Concurrent
deepening and shallowing of the low-relief basin over multiple 20,000 year
periods is visible (Lowenstein, 1987). Mudflat and saltpan environments were

101
created following a series of five major transgressions and episodes of isolation
and evaporation (Powers and Holt, 1990; Holt and Powers, 1993). The Rustler
Formation consists of dolomite, siltstone, anhydrite and halite (Mercer and
Gonzalez, 1981). This lithology is similar to that of the Salado Formation, only
with greater levels of dolomite and terrigenous clastics (Hentz et al., 1989). The
total thickness is highly variable, ranging anywhere from 50 to 450 m (Hill, 1996).
The Rustler is separated into the Virginia Draw, Culebra Dolomite,
Tamarisk, Magenta Dolomite, and Forty-Niner Members. The Virginia Draw
Member occupies the lowest 20 to 50 m of the Rustler Formation (Hill, 1996).
The first 15 m consist of dark reddish-brown to olive-gray siltstone, overlain by 10
m of gray brown, thin-bedded, finely-crystalline dolomite, followed by five m of
amygdaloidal dolomite, siltstone and limestone (Miller 1992). This is often a
cavernous unit filled with Cretaceous paleokarst. The Culebra Dolomite Member
is approximately six to nine m thick, yellowish-gray to light gray, thin-bedded,
laminated to finely-crystalline dolomite (Hill, 1996). This member is characterized
by tiny, spherical vugs, two to 10 mm in diameter, which often contain selenite
crystals (Snyder and Gard, 1982). The Tamarisk Member consists of halite and
anhydrite, with minor siltstone and traces of polyhalite in the subsurface. At the
surface this member is fairly undistinctive, light-gray, massive, coarsely-
crystalline gypsum which appears to be severely altered by dissolution. The
Magenta Dolomite Member is a reddish-brown dolomite, six to eight m thick,

102
alternating with gray anhydrite and buff siltstone-sandstone (Hill, 1996). The
member is magenta in color, just as the name suggests, hosting thin, undulatory
or wavy (Bachman, 1984) laminae 0.2 to five mm thick (Vine, 1963). The Forty-
Niner Member is the uppermost portion of the Rustler. This member consists of
anhydrite, siltstone and halite in the subsurface, with outcrops of massive
gypsum interbedded with thin, reddish siltstone (Hill, 1996). Small caves,
solutionally-enlarged joints and sinkholes are common in the surface (Vine,
1963).
Dewey Lake Red Beds Formation
Poorly-indurated, earthy, unfossiliferous, well-laminated, thin-bedded,
reddish-brown to reddish-orange siltstone, followed by claystone and lenticular
fine-grained sandstone make up the Dewey Lake Red Beds Formation. This unit
is characterized by numerous light greenish-gray reduction spots, in addition to
the occurrence of exceptionally-large, frosted quartz grains. Small-scale, cross-
laminated, fine-grained sandstone becomes common in the upper part of the
formation (Hill, 1996). The Lower Sequence is 28 m of mostly siltstone and
mudstone with some interbedded claystone and sandstone, while the Upper
Sequence is 115 m of thinly-laminated to cross-laminated sandstones and
siltstones (Holt and Powers, 1990).

103
Post-Ochoan Stratigraphy
Anomalous occurrences of post-Ochoan age strata have been identified
within the study area as paleokarst erosional remnants. The Cretaceous age Cox
Formation is a brownish, thin- to massively-bedded quartz-pebble conglomerate.
Additionally, the unit is made up of fine- to medium-grained sandstone. Gravel
remnants of this formation have been found scattered in various locations across
the Delaware Basin (Hill, 1996).
Tertiary intrusive bodies have also been identified as a series of northeast
trending dikes (Hill, 1996). The dikes are considerably decomposed but, upon
examination, have been described as lamprophyre of basaltic habit by C. S.
Ross (Darton, 1928). The position of observed dikes appears to be controlled by
joint orientations, as is the case in the Yeso Hills area (Hill, 1996). The dikes
appear as rust colored, earthy material, occasionally containing small, sharp
fragments of dark-colored, fine-grained igneous rock (Austin et al., 1993).

104
Figure A4: Example of the spatial distribution of karstic depressions within the Castile Formation (from Stafford, 2015).
KARST AND SPELEOLOGY
Sinkholes, karren and surficial precipitates are common manifestation of
surficial karst within the Gypsum Plain. Sinkholes are usually the most abundant
karst geomorphic manifestation (Figure A4) (Stafford, et al. 2008A); these usually
consist of shallow, surficial dissolution hollows formed by the collapse of bedrock
into an underground void, and may be
observed in both open and filled forms
(Hill, 1996). Sinks are almost always the
site of water percolating through the soil
or bedrock into solutionally-enlarged
drains (Palmer, 2007). Two dominant
mechanisms control the formation of
sinks; collapse of subsurface voids or the
drainage of surficial waters. Sites due to
collapse tend to appear as near-circular or
elliptical features with walls that are near
vertical. Sites created due to drainage of
water from the surface consist of well-
developed arroyos that converge to the
105
site of a central drain (Stafford et al., 2008A). Broad subsidence sinkholes and
valleys may be caused by the dissolution of salt beds at depth (Smith and Veni,
1994). Another common type of sink present within the study area is a cenote,
which appears as a sinkhole rimmed by steep, overhung, bedrock walls
extending down to ponded water (Palmer, 2007).
Runoff may deeply etch exposed, bare, soluble bedrock. Steep slopes
feature straighter rills, while sinuous channels are found on more gentle slopes.
These surficial karst features are known as karren (Palmer, 2007). Various forms
of karren are present within the study area, including: rillenkarren, spitzkarren,
and kamenitzas. Surficial precipitates are largely found as mm to cm thick crusts
of gypsite covering exposed bedrock surfaces. This crust is due to the dissolution
of the exposed gypsum. Macroflora are rarely found here, but lichen and
microbial colonies are abundant (Stafford, et al., 2008A).
Epigene caves usually form a network of enlarged fissures and pores that
take on a branchwork or dendritic design (Palmer, 2007). Epigene features are
primarily isolated occurrences that tend to be well-developed, solutional, closed
depressions which often form large, incised sinkholes connected to small solution
conduits (Stafford et al., 2008A; Klimchouk, 2000). A common feature of the
epigene caves located in the Gypsum Plain is well-developed, small-scale
scallops along the walls, ceilings and floors. These scallops indicate the transport
of large amounts of water at significant velocities through the cave passages

106
(White, 1988). Shallow groundwater recharge features are often associated with
cave passages in the area (Stafford et al., 2008A). It is common for cave
passages to initially open to a very limited size and narrow with length (Smith and
Veni, 1994). This is caused by the fluids flowing through bedrock, forming the
conduits described, quickly approaching saturation, making them unable to
dissolve additional bedrock with depth.
Most observed epigenetic caves within the Gypsum Plain are laterally-
limited, with development following prominent joint sets. With areas that have
experienced higher levels of tectonism, caves may form along the fold axis of
anticlines. Here rock compressions have produced fractures along the fold axis;
both types previously described are small and laterally limited. Epigene caves
may also form in the tabular gypsum fabrics found throughout the study area.
These are the least common type, and are similar to those found in the gypsum
bedrock in that they are also small. Gypsite epigene caves are also present,
although these are usually too small to enter and plugged with soil (Stafford et
al., 2008A).
In contrast, hypogene caves form below the surface of the earth, involving
water at depth. Undersaturated reservoirs below the earth’s surface deliver rising
fluids, which cause dissolution of soluble rock units. Forced and free convection
are the primary agents causing the rise of these fluids. Fluids deeper within the
earth reside at a higher pressure, causing them to travel upward, to regions of

107
lower pressure. This movement by forced convection is driven by differences in
hydraulic potential across the region. Free convection involves aggressive waters
of a less saturated nature to rise via convection as more saturated waters
descend deeper below the surface (Stafford et al., 2008A). The moment the
waters come into contact with soluble rock, dissolution begins. Length of flow
over which cave development takes place is often short, with a large ratio of
discharge to flow length. Patterns have no or limited relation to surface karst
features or recharge.
Hypogene caves include several types, but are most commonly seen as
maze caves (Palmer, 2007). Morphometric features most often found include
risers, outlets and half-tubes. Preferential flow paths connecting transmissive
zones to soluble zones are indicated by cuspate wall and floor features known as
risers or feeders, respectively. Outlets, also known as cupolas, are ceiling
structures that form domes. Ascending fluids continue to move to higher
elevations and lower pressures by dissolving soluble rock in these areas. Where
undersaturated fluids migrate from risers to outlets, concave, semi-circular
channels are developed known as half-tubes. These tubes form vertically along
walls or horizontally along ceiling passages. When each of these elements is
found within a cave, it is reasonably assumed that the cave is of hypogene origin.
Dense clusters of caves and sinkholes indicate similar derivation (Stafford et al.,
2008A).

108
Figure A5: Diagram illustrating the formation of blanket-dissolution breccias through the dissolution of halite. Arrows represent fluid movement (from Stafford, 2015).
Figure A6: Diagram illustrating the formation of breccia pipes through the dissolution of halite. Arrows represent fluid movement (from Stafford, 2015).
Direct evidence of the widespread
occurrence of hypogene speleogenesis within the
Delaware Basin is provided by the extensive
brecciation and calcitization present. Both vertical
breccia pipes and horizontal blanket breccias are
widespread throughout the Castile, Rustler and
Salado formations (Stafford, 2015). Lateral
dissolution begins in the western portion of the basin, moves downdip, and
dissolves salt horizons in the subsurface. Overlying strata collapse over time into
these blanket void spaces, creating the blanket
breccias observed (Figure A5). Vertical dissolution
occurs in a similar manner as water moves up or
down along vertical structures in a brine-density flow
mechanism (Figure A6) (Stafford et al., 2008A).
These intrastratal breccia zones are often
associated with calcitization. Bacterial Sulfate
Reduction (BSR), Thermochemical Sulfate
Reduction (TSR), and meteoric calcitization have all
been attributed as the cause of calcite occurrences
within Delaware Basin strata. Commonly, these masses are found in conjunction
with areas featuring hypogene karst or large amounts of selenite within the study

109
area. Native sulfur bodies are also in close proximity. Massive limestone buttes
and laterally extensive limestone sheets are the general surface manifestations
(Stafford et al., 2008c).

110
REMOTE SENSING
There are various advantages to using CIR (color infrared) imagery over
other types of remotely-sensed imagery. Shorter, easily scattered wavelengths
are filtered out using CIR. This allows for better penetration through atmospheric
haze than normal color imagery. Stress levels of vegetation, moist areas and
plant identification can all be revealed using CIR, which are undetectable on
normal color imagery. Essentially, CIR was developed during World War II so
that camouflaged tanks could be differentiated from the surrounding vegetation
(Thompson, 2011).
Color infrared imagery is used to delineate surface features, such as
sinkholes, vegetation types, lineaments, and major lithologies. CIR is a false
color photograph that shows reflected electromagnetic waves from an object.
Near infrared (NIR) is assigned to the red color band, green light is assigned to
blue, and red light is assigned to green; blue light is completely filtered out,
causing blue objects to appear black. Each object included in land cover absorbs
a particular portion of the electromagnetic spectrum such that a portion of the
light coming into contact with an object is transmitted and the remainder is
reflected. This reflectance is recorded with a passive image system, most often

111
stationed on a satellite platform. These passive image systems act to detect and
record specific wavelength ranges of reflected solar radiation (Thompson, 2011).

112
REFERENCES
Adams, J. E. (1936). Oil pool of open reservoir type. American Association of Pertroleum Geology Bulletin, 20, 780-796.
Adams, J. E. (1944). Upper Permian Ochoa Series of Delaware Basin, West Texas and Southeastern New Mexico. American Association of Petroleum Geologists, 28, 1596-1625.
Adams, J. E. (1965). Stratigraphic- Tectonic Development of Delaware Basin. Bulletin of the American Association of Petroleum Geologists, 49(11), 2140-2148.
Austin, G. S., et al. (1993). First day road log from Carlsbad to White City, Orla, Loving, potash enclave and return to Carlsbad; in Love, D. W. et al. (eds.), Carlsbad region, New Mexico and West Texas. New Mexico Geol. Soc., Guidebook, Ann. Field Conf., 1-39.
Bachman, G.O. (1984) Regional geology of Ochoan Evaporites, Northern Part of Delaware Basin. New Mexico Bureau of Mines and Mineral Resources, Open File 184
Beck, R. H. (1967) Depositional mechanics of the Cherry Canyon Formation, Delaware Basin, Texas: Unpubl. MS thesis, Texas Technological College, 107.
Darton, N. H. (1928). "Red Beds" and associated formations in New Mexico. United States Geological Survey Bulletin, 794, 356.
Galley, J. E. (1958). Oil amd geology in the Permian Basin of Texas and New Mexico. (L. G. Weeks, Ed.) Habitat of Oil, 395-446.

113
Gard, L. M. (1968). Geologic studies, Project Gnome, Eddy County, New Mexico. U.S. Geol. Surv., Prof. Paper 589, 33.
Henrickson, G. E., and Jones, R. S. (1952). Geology and groundwater resources of Eddy County, New Mexico: New Mexico Bur. Mines Mineral Resources, Groundwater Rept. 3, 109 pp.
Hill, C. A. (1996). Geology of the Delaware Basin, Gudalupe, Apache and Glass Mountains. New Mexico and West Texas. Midland, Texas: Permian Basin Section- SEPM.
Hentz, T. F., Price, J. G., and Gutierrez, G. N. (1989). Geologic occurrence and regional assessment of evaporite- hosted native sulfur, Trans-Pecos Texas. Bur. Econ. Geol., Univ. Texas Austin, Rept. Invest. 184, 70.
Holt, R. M., and Powers, D.W. (1990). The Late Permian Dewey Lake Formation at the Waste Isolation Pilot Plant (WIPP); in Powers et al. (field trip leaders), Geological and hydrological study of evaporites in the northern Delaware Basin for the Waste Isolation Pilot Plant (WIPP), New Mexico. Geol. Soc. Am., Field Trip no. 14, 107-129.
Holt, R. M., and Powers, D.W. (1993). Summary of the Delaware Basin endstage deposits; in Love, D. W., et al. (eds), Carlsbad region, New Mexico and West Texas. New Mexico Geol. Soc., Guidebook, 44th Ann Field Conf.90-92.
Horak, R. L. (1985). Trans-Pecos tectonism and its affects on the Permian Basin. In P. W. Dickerson, & W. R. Muelberger, Structure and Tectonics of Trans-Pecos Tecas (pp. 81-87). Midland: West Texas Geological Society.
Jenkins, R. E. (1961). Characteristics of the Delaware Formation Jour. Petroleum Technology, December,1230- 1236.
Jones, C. L. (1954). The occurrence and distribution of potassium minerals in southeastern New Mexico. New Mexico Geol. Soc., 5th Field Conf., 107-112.

114
Keith, S.B. (1982). Paleoconvergence rates determined from K2O/SiO2 ratios in magmatic rocks and their application to Cretaceous and tertiary tectonic patterns in southwestern north America. Geological Society of America Bulletin, 93, 524-532.
Kelley, V. C. (1972). Geometry and correlations along the Permian Capitan escarpment, New Mexico and Texas. Am. Assoc. Petroleum Geol., Bull., 56(11), 2192-2211.
Kerr, S. D., and Thomson, A. (1963). Origin of nodular and bedded anhydrite in Permian shelf sediments, Texas and New Mexico. Am. Assoc. Petroleum Geol., Bull. , 47(9),1726- 1732.
King, P. B. (1934). Permian stratigraphy of Trans-Pecos Texas. Geol. Soc. Am., Bull., 45(4), 697-798.
King, P. B. (1942). Permian of West Texas and southeastern New Mexico. Am. Assoc. Petroleum Geol., 26(4), 535-763.
King, P. B. (1948). Geology of the southern Guadalupe Mountains, Texas. U.S. Geol. Surv., Prof. Paper 215, 183.
Klimchouk, A. (2000). Speleogenesis in gypsum; in Klimchouk, A., Ford, D. C., Palmer, A.N. and Dreybrodt, W. (eds.), Speleogenesis: evolution of karst aquifers. Hunstville, National Speleological Society.
Koss, G. M. (1977). Carbonate mass flow sequences of the Permian Delaware Basin, West Texas; in Hileman, M. E. and Mazzullo, S. J. (eds.), Upper Guadalupian facies, Permian Reef Complex: Soc. Econ. Paleontol. Mineral., Permian Basin section, Publ. 77-16.
Lang, W. B. (1935). Upper Permian Formation of Delaware Basin of Texas and New Mexico. Am. Assoc. Petroleum Geol., 19(2), 262-270.

115
Lawson, E. C. (1989a). Megabreccias and associated carbonates of the Rader Member, Capitan Reef Complex (Premian), Delaware Mountains, West Texas (abs.); in Pray, L. C. and Harris, P. M. (eds.), The Capitan Reef Complex, West Texas and New Mexico: Soc. Econ. Paleontol. Mineral., Permian Basin section, Field Trip Sem. No. 1.
Lawson, E. C. (1989b). Subaqueous gravity flows in the Rader Member, Capitan Reef Complex (Permian), Delaware Mountain, West Texas; in Harris, P. M. and Grover, G. A.(eds.), Subsurface and outcrop examination of the shelf margin, northern Delaware Basin. Soc. Econ. Paleontol. Mineral., Core Workshop no. 13.
Linn, K. O., and Adams, A. A. (1966). Barren halite zones in potash deposits, Carlsbad, New Mexico; in Rau, J. L. (ed.), Second Symposium on Salt. Northern Ohio Geol. Soc., Cleveland, OH, v. 1.
Lowenstein, T. K. (1987). Depositional cycles in the Permian Salado Formation, southeastern New Mexico; in Powers, D. W. and James, W. C. (eds.), Geology of the western Delaware Basin, West Texas and southeastern New Mexico. El Paso Geol. Soc., Guidebook 18.
Mercer, J. W., and Gonzalez, D. D. (1981). Geohydrology of the proposed Waste Isolation Pilot Plant Site in southeastern New Mexico; in Wells, S. G. and Lambert, W. (eds.), Environmental geology and hydrology in New Mexico. New Mexico Geol. Soc., Spec. Publ. 10.
Miller, L. J. (1992) Sulphur ore controls within the Salado and Castile Formations of West Texas; in Wessel, G. R., and Wimberly, B. H., (eds.), Native sulfur – developments in geology and exploration. Soc. Mining, Metallurgy, Exploration, Proc., Pheonix, AZ, Ch 1.
Palmer, A. N. (2006). Cave geology. Dayton, OH: Cave Books.
Powers, D. W., and Holt, R. M. (1990). Sedimentology of the Rustler Formation near the Waste Isolation Pilot Plant (WIPP) site; in Powers et al. (field trip leaders), Geological and hydrological studies of evaporites in the northern

116
Delaware Basin for the Waste Isolation Pilot Plant (WIPP), New Mexico. Geol. Soc. Am., Field Trip no. 14.
Scholle, P. A., and Halley, R. B. (1980). Upper Paleozoic depositional and diagenetic facies in a mature petroleum province ( a field guide to the Guadalupe and Sacramento Mountains). U.S. Geol. Surv., Open-file Rept. 80-383.
Scholle, P. A., Ulmer, D. S., and Melim, L. A. (1992). Late-stage calcites in the Permian Capitan Formation and its equivalents, Delaware Basin margin, West Texas and New Mexico—evidence for replacement of precursor evaporites. Sedimentology, 39, 207- 234.
Smith, A. R., and Veni, G. (1994). Karst Regions of Texa; in The caves and karst of Texas: a guidebook for the 1994 Convention of the National Speleological Society with emphasis on the Southwestern Edwards Plateau. Brackettville, TX: National Speleological Society.
Snyder, R. P., and Gard, L. M. (1982). Evaluation of breccia pipes in southeastern New Mexico and their relation to the Waste Isolation Pilot Plant (WIPP) site. U.S. Geol. Surv., Open-file Rept. 82-968.
Stafford, K. W. (2013). Evaporite karst and hydrogeology of the Castile Formation: Culberson County, Texas and Eddy county, New Mexico; in Land, L., Doctor, D. H., and Stephenson J. B., (eds.), NCKRI Symposium 2: Proceedings of the 13th Multidisciplinary Conference on Sinkholes and the Engineering and Environmental Impacts of Karst. Carlsbad, NM: National Cave and Karst Research Institute.
Stafford, K.W. (2015). Evaluation of Existing Geologic Conditions along RM 652: Initial Characterization of Karst Geohazards Associated with RM 652 in Culberson County, Texas. TxDOT rep.
Stafford, K., Nance, R., Rosales-Lagarde, L., and Boston, P. (2008a). Epigene and hypogene gypsum karst manifestations of the Castile Formation:

117
Eddy County, New Mexico and Culberson County, Texas, USA. International Journal of Speleology, 37, 83–98.
Stafford K.W., Rosales-Lagarde L. and Boston P.J. (2008b). Castile evaporite karst potential map of the Gypsum Plain, Eddy County, New Mexico and Culberson County, Texas: a GIS methodological comparison. J. Cave and Karst Studies, 83-98.
Stafford, K.W., Klimchouck, A.B., Land, L., and Gary, M.O. (2009). The Pecos River hypogene speleogenetic province: a basin-scale karst paradigm for eastern New Mexico and west Texas, USA, In Stafford, K.W., Land, L., and Veni, G. (eds), NCKRI Symposium 1: Advances in Hypogene Karst Studies. Carlsbad, New Mexico: National Cave and Karst Research Institute.
Stafford, K.W., Ulmer-Scholle, D., and Rosales-Lagarde, L. (2008c). Hypogene calcitization: Evaporite diagenesis in the western Delaware Basin. Carbonates and Evaporites, 23, 89–103.
Stein, C. L., and Krumhansl, J. L. (1988). A model for the evolution of brines in salt from the lower Salado Formation, southeastern New Mexico: Geochim. Acta, 52, 1037-1046.
Thompson, G. (2011). Using Color Infrared (CIR) Imagery: A Guide for Understanding, Interpreting, and Benefiting from CIR Imagery. Statewide Mapping Advisory Committee, 22 pp.
Vine, J. D. (1963). Surface geology of the Nash Draw Quadrangle, Eddy County, New Mexico. U.S. Geol. Surv., Bull 1141-B, B1-B46.
White, W. B. (1988). Geomorphology and Hydrology of Karst Terrains. New York: Oxford University Press.
Williamson, C. R. (1980). Sedimentology of Guadalupian deep-water clastic facies, Delaware Basin, New Mexico and West Texas; in Dickerson, P.

118
W., and Hoffer J. M. (eds.), Trans-Pecos Region. New Mexico Geol. Soc., Guidebook, 31st Field Conf., pp. 195-204.

119
APPENDIX B
DETAILED METHODOLOGY
120
IMAGE ANALYSES
Cave and karst phenomena of the Gypsum Plain are commonly present in
an area associated with certain lithologies, especially that of paleokarst features.
Recent advances in available resolution of commercial Color Infrared (CIR)
imagery have enabled large-scale characterization of geologic variability, that,
when coupled with geospatial analyses, allows features of interest to be more
readily and accurately identified than ever before. Fifty cm resolution WorldView-
2 CIR satellite imagery of the study area totaling approximately 100 km2 (Figure
B1), shot on September 27, 2016, was purchased by Stephen F. Austin State
University, Department of Geology for use in this study.
Before beginning analyses of the CIR imagery, control points were
established during fieldwork using a Garmin Rino 650 handheld GPS unit. Areas
suspected of representing each type of lithology present within the study area
were systematically identified using Google Earth Pro, locations noted, and
physically surveyed in the field. Those locations were verified to contain karst-
related features or lithologies, such as sinkholes or areas of calcitized gypsum
were photographed, detailed descriptions were recorded, and GPS locations
obtained. This resulted in a control point database of locations of each type of
lithology, water body, and anthropogenic feature found within the study area

121
Figure B1: Index map of study area showing WorldView-2 CIR imagery
(Figure B2). Features corresponding to ‘Vegetation’ such as bushes and trees
were selected directly within the color infrared image, rather than as control
points in the field to account for any temporal change in the presence of
vegetation between the time that the imagery was captured and field checks
were performed.
Pre-processing of the image was performed before purchase of the CIR
product, including orthorectification, a dark object subtraction and atmospheric
corrections related to haze and visibility of the image in accordance with
DigitalGlobe’s Atmospheric Compensation (AComp) model. Further processing

122
Fig
ure
B2:
Locatio
n o
f each
contr
ol po
int
identified a
nd f
ield
checked f
or
nin
e o
f th
e 1
0 c
lasses u
sed f
or
late
r cla
ssific
ation o
f th
e
colo
r-in
frare
d d
ata
se
t (N
ot
inclu
din
g c
on
trol po
ints
esta
blis
hed
for
“Vege
tation”)
. C
hart
(to
p left
) deta
ils th
e n
um
ber
of
contr
ol po
ints
acro
ss the la
ndscap
e c
orr
espond
ing t
o e
ach c
lass ide
ntified
in
the
fie
ld.

123
performed on the CIR image before it could be classified involved a conversion of
the raw digital number (DN) values of the raster into top-of-atmosphere spectral
radiance, followed by a conversion to top-of-atmosphere reflectance as outlined
by Updike and Comp (2010).
The CIR file was imported into ESRI ArcGIS for Desktop in the form of an
enhanced compression wavelet (ECW) in order to identify areas correlating to
the control points documented in the field. Using the Training Sample Manager
within the Image Classification Toolbar in ArcGIS, training samples were created
by drawing polygons around areas corresponding to the control points that were
taken in the field. Once several training samples had been established for each
type of control point, the training samples were converted into a Signature File
using the Create Signature File Tool within the Image Classification Toolbar. The
generated signature file associated the number of cells within each of the
polygons of the associated training sample, along with the mean and covariance
matrices to the corresponding class type. The statistical values were computed
based on the spectral signature cell value for each of the bands within the CIR
image (Figure B3). A signature file is necessary to run a Maximum Likelihood
Classification on the image.
Classification classes consisted of: 1) alluvium, 2) algal crust, 3) dense
vegetation manifesting usually as bushes one-quarter to several m2 in area, 4)
calcitized breccia zones or float, 5) exposed Castile gypsum bedrock,

124
Figure B3: Graph displaying the mean reflectance value of each band for the corresponding training samples, calculated and assigned within the Create Signatures File tool.
6) residual Cox strata, 7) residual Dewey Lake Red Beds strata, 8) surficial
gypsite precipitates, 9) residual Rustler strata, and 10) surface bodies of water.
‘Bushes’ values include all forms of vegetation large enough to be identified by
the resolution of the original CIR image, including trees. Major anthropogenic
features such as roads and wastewater evaporation ponds were originally
classified by their major lithology types, but removed from the Training Sample
Manager due to their spectral signature statistics being slightly different (due to
human activity) than that of unmodified rock of the same type elsewhere within
the study area. The output signature file created from each of the two training

125
samples was then used to perform a Maximum Likelihood Classification, found in
the ArcGIS Multivariate toolset within the Spatial Analyst Toolbox, on the entire
CIR image. The tool employs an algorithm that considers the variance and
covariance of each cell within an image and assigns it to one of the classes
represented in the input signature file that it most likely corresponds to. The
algorithm operates on the principle of Bayes’ theorem of decision making where
cells in each class sample are normally distributed, allowing them to be
characterized by their corresponding mean vector and covariance matrix (ArcGIS
Resources, 2014).
Tool parameter options include the ability to specify a priori probabilities of
each class if the likelihood of the occurrence of some classes is higher, or lower
than others. A SAMPLE a priori option was used within this study, assigning the
probability of each class’ occurrence as proportional to the number of cells that
make up the training sample class relative to the total number of cells in the
image. Consequently, those classes more common across the study area
(gypsite, algal crust) that correspond to training samples made up of a greater
number of cells than those classes less common across the study area (Cox and
Dewey Lake carbonates) were assigned a greater probability of occurrence
(Figure B2). For the purpose of eliminating extraneous noise from the final
classified image, a reject factor was also specified as a tool parameter. During
classification the Maximum Likelihood Classification tool calculates a confidence

126
value directly correlating the distance to the mean vector of the assigned class
with the percent confidence in which the cell is classified by the program. Those
cells with less than or equal to 5% confidence in the assigned value were not
classified and received a “No Data” value.
The output classification file was a raster file with each cell of greater than
5% confidence assigned a class value from the input signature file. With the
purpose of classifying the entire study area by lithology, vegetation was then
assigned to a corresponding lithology in which it is growing. It may logically be
assumed that the lithology from which plants originate is that of their nearest
neighbor based on observations recorded within the field and verified within the
output classified images. Using the Reclassify tool, located within the Spatial
Analyst Toolbox’s Reclass Toolset in ArcMap, all values identified as ‘Bushes’
were also assigned a ‘NoData’ value.
The Nibble Tool, also located in the Spatial Analyst Toolbox, in the
Generalization toolset, was used to replace the original cell values of ‘Bushes’
and those cells classified as ‘No Data’ in the original classification , with the
corresponding values of their nearest neighbor according to Euclidean distance.
An algorithm used by the tool first identifies all cells within a mask raster with a
value of ‘NoData’ (ArcMap, 2016). Those cells in the original raster
corresponding to the ‘NoData’ values of the mask raster were then “nibbled” and
replaced by their nearest neighbor value; the output “nibbled” raster is the final

127
product classifying the entire image by lithology (Figure B4). Once all values
within the classified raster have been assigned a lithology, the map produced
may be used for field studies or further processing depending on the goals of the
user.

128
Fig
ure
B4
: F
inal lit
ho
logic
surf
ace m
ap o
f th
e s
tud
y a
rea b
ase
d o
n the
maxim
um
lik
elih
ood
cla
ssific
ation p
erf
orm
ed.

129
KARST SURVEY
In order to understand the speleogenetic evolution of the study area and
greater Gypsum Plain, spatial analyses of cave features discovered was
performed through physical cave mapping and the production of illustrated cave
maps. Through these processes structural controls, general trends, flow paths
and morphology were identified and recorded. Spatial distribution of features is
important to establishing the hydrogeologic framework and controls present.
Before any survey of cave features began, features were systematically
identified by teams physically traversing 10, one km2 grids placed strategically
across the 100 km2 study area (Figure B5). Grid locations were based on known
areas of interest and areas expected to contain significant numbers of features.
Each grid was converted into a series of traverse lines approximately 50 m apart.
Equipped with a camera, Rite in the Rain All Weather Universal field notebook,
and Garmin Rino 650 handheld GPS unit, each traverse line was slowly walked
and any feature of interest indicating the presence of karst was photographed,
documented, and its GPS location recorded. Features of interest documented
along the traverse lines included sinkholes, cave entrances, solutional conduits,
vent structures, calcitized areas, and changes in lithology.

130
Fig
ure
B5
: Locatio
n m
ap o
f contr
ol grids w
alk
ed to id
entify
ca
ve a
nd k
ars
t fe
atu
res.
Caves t
hat
were
surv
eye
d a
re m
ark
ed b
y a
sta
r sym
bol.

131
All humanly enterable cave features identified within each of the 10 control
grids, in addition to a number of features identified outside of the grids, were
surveyed. Teams of two to three people conducted surveys using a Disto
rangefinder, and Suunto compass/clinometer. The lead person entering the cave
acted as a scout and identified the point
to which the second person entering the
cave would perform instrument
readings. Distance, azimuth and
inclination were measured by this
second team member at point (A), to the
lead team member at point (B). The
collected data was recorded and all plan, profile and cross-sectional views were
sketched in a Rite in the Rain All Weather Field Binder, according to National
Speleological Society protocol (Dasher, 1994). Once general sketches had been
drawn, geomorphic details such as rock types, floor and ceiling drops, fractures,
and features indicative of either hypogene or epigene origin were added (Figure
B6).
Once data was recorded and all sketches finished, the values were
entered into Walls, a free program available through the Texas Speleological
Survey designed for the analysis of cave survey data. Once a new project and
item are created, the value of the “from point” is entered into column one, “to
Figure B6: Example of field sketches containing morphological features from JB Hole.

132
Figure B8: Plan view line plot generated by Walls from data collected in the field.
point” entered into column two, followed by the
length, inclination and azimuth in columns three,
four and five, respectively (Figure B7). Walls
compiles this input information to produce line
plots of the profile and plan of the cave, in addition
to statistics such as total passage length and
depth (Figure B8).
The plan and profile views created by Walls
were then imported into a blank Xara Xtreme 5
document, an illustration program used to digitize
the field sketches. The field sketches were also
imported and overlain
transparently on top of the
Walls line plot by
corresponding survey points
in order to preserve scale.
The plan, profile, and cross-
sectional sketches were
then digitized using the
drawing tools within Xara.
Once the drawing of the cave map is complete basic cartographic attributes were
Figure B7: Example of Walls input file containing field measurements of point locations and their corresponding length, inclination, and azimuth.

133
added and the image was exported for publication. Vertical relief and relationship
of all cave passages and features may now be assessed for a greater
understanding of the speleogenetic history of the cave.

134
REFERENCES
ArcGIS Resources. (2014). How Maximum Likelihood Classification works. (n.d.). ArcGIS Help 10.2. ArcMap. (2016). Generalizing zones with Nibble, Shrink, and Expand. ArcGIS for Desktop. Dasher, G. R. (1994). On station: a complete handbook for surveying and mapping caves. National Speleological Society. Updike, T. and Comp, C. (2010). Radiometric use of WorldView-2 imagery.
Digital Globe. Technical note, 1-17.

135
APPENDIX C
CAVES AND KARST

136
CAVE INVENTORY
Speleogenetic history and formation conditions were determined through
the performance of traditional cave surveying and drafting techniques using
standard cave symbology. Caves exhibiting both epigenetic and hypogenetic
characteristics were identified within the study area. The following is a description
of each of the features found within the study area control grids and surrounding
area considered that were large enough to physically enter and study. A total of
15 caves were mapped in the study area (Figure C1)
Bridge Cave
Bridge Cave (Figure C2) features a survey length of 86 m and depth of six
m. The cave entrance is located in the bottom of the eastern most of two
sinkholes, separated by a bridge-like structure formed by dissolution of gypsum
bedrock (Figure C1). The entrance is partially blocked by a large boulder of
bedrock, with an accessible opening of approximately one-half m in diameter.
The adjacent sinkholes are a combination of gypsum bedrock and gypsic soil.
The cave passage maintains a constant size of approximately three m tall
and one-half to one m wide for the initial 40 m of passage, slowly descending.
The floor is generally gypsum bedrock with soil and bedrock float. The passage
narrows to one m tall and slowly continues to narrow from one-half m in diameter

137
Fig
ure
C1:
Map o
f th
e s
tud
y a
rea d
eta
iling c
ave
an
d c
ontr
ol gri
d locations.

138
Fig
ure
C2
: D
raft
ed c
ave m
ap o
f B
ridge
Ca
ve.

139
to one-quarter m over the following 35 m until it is no longer accessible for
survey. The final 10 m of passage is made up of gypsum bedrock floor and walls,
but dissolution of the original ceiling and infilling of sediment has created a
current ceiling of organic soil. All passages exhibit the characteristics of a classic
tubular epigene passage formed in the phreatic zone that has become
entrenched by vadose processes. Together these processes have culminated in
the piping of soil into the eastern end of the cave by suffosion.
Death Crack and Big Room caves
Death Crack Cave (Figure C3) is the western most of two caves located in
the northwest portion of the study area, west of U.S. Highway 62/180 (Figure
C1). Both caves have undergone recent and extensive collapse of their original
structure, due to dissolution of gypsum by vadose processes. They are located
within a gypsum escarpment that lies along the edge of the Gypsum Plain,
proximal to the Guadalupe Mountains. Death Crack Cave is an almost vertical
multi-level shaft originating within the center of a soil and bedrock arroyo eight m
in diameter and five m deep. The opening of the cave itself is two m long and one
m wide. The vertical shaft drops 10 m, reaching the middle and largest level.
Three passages, originating in a center room three m wide and five m long,
follow the fracture of the bedrock walls outward before terminating in collapse.
Down the original shaft another five m, the lower level terminates in a soil- and
collapse-filled drain that forms a funnel within the floor. The walls of this section

140
of the cave are highly fractured bedrock, with large unstable slabs slowly
shearing away due to dissolution of the rock.
Located 45 m southeast of the entrance to Death Crack Cave is Big Room
Cave, the remnants of a collapsed room and cave passage. The entrance to Big
Figure C3: drafted cave map of Death Crack and Big Room caves.

141
Room Cave is located in a soil and bedrock sinkhole within the side of the
gypsum escarpment. At the base of a five-m-tall headwall, a hole two m wide and
one-m-tall opens to a passage of solid bedrock ceiling and walls formed of
gypsum collapse. This passage continues for approximately seven m before
opening into a large room seven m in diameter and seven-m-tall. The floor in this
area is a large accumulation of damp soil, derived from the gypsic soil ceiling and
brought in by the flow of surficial waters. The walls adjacent to the lithified soil
ceiling are highly fractured bedrock slabs arching to form the dome ceiling. The
center of the soil floor features a vertical passage one-half-m in diameter and
five-m-deep, completely made of collapsed bedrock held together by soil. The
passage has been reopened from the original collapse by large flows of surface
waters.
At one time Death Crack and Big Room caves were most likely one
epigene passage connected via the area of collapsed in the bottom of Big Room
cave, indicated by the trend of the lower collapse passage and the ease with
which sound is carried between the caves. Other caves, primarily consisting of
unstable bedrock collapse are also located in the northern portion of the gypsum
escarpment. Collapse of the caves within the escarpment is due to the
preferential flow of vadose and phreatic waters along the slope of the Gypsum
Plain and through the escarpment to reach the Black River Valley separating the
Guadalupe Mountains and the escarpment. The increased flow through this area

142
has caused greater dissolution of the gypsum bedrock forming Death Crack and
Big Room caves than other caves in the study area, leading to more extensive
and multiple episodes of collapse.
Fireball Cave
Fireball Cave (Figure C4) is located in the central portion of the study area
(Figure C1) and is 13 m long and three m deep. The cave begins in a soil and
bedrock sink three m in diameter before forming a bridge structure. On the
opposite side of the bridge, the cave entrance is one m in diameter and opens to
a passage approximately one-half-m in diameter. The passage continues three m
before narrowing and becoming impassable. The cave passage is formed
entirely within gypsum bedrock and the floor is covered in soil. The ceiling of the
cave exhibits fracture control patterns while scalloped walls indicate rapid flow of
surface waters into the epigene cave. At one time the bridge structure formed the
main entrance to the cave connected to the second entrance by gypsum
bedrock. Overtime fluid flow has caused the dissolution of that bedrock that once
covered the sinkhole between the two entrances.

143
Green Moss Cave
Green Moss (Figure C5) is a traditional epigene karst feature with some
hypogene characteristics, located just west of Red Hammer (Figure C1) With a
survey length of 67 m and a depth of 11 m, Green Moss is one of the longest
caves found within the study area. The entrance to the cave is approximately two
m tall by three-fourths-m wide opening at the base of
Figure C4: drafted cave map of Fireball Cave.

144
Fig
ure
C5:
dra
fted c
ave m
ap o
f G
reen M
oss.

145
an east-west trending, incised arroyo of gypsum bedrock and soil approximately
15 m long, five m deep and four m wide at its largest point. The entrance
immediately opens to a small room of collapsed bedrock from the adjacent
ceiling and walls, approximately one m wide and two m tall. The cave directly
narrows to a small entrance through the collapse of about one m in diameter that
continues into a large passage of gypsum bedrock resembling a classic incised
entrenchment of fracture-controlled passage formed within the vadose zone.
The following approximately 40 m of passage continues at an average
width of one-half- to one-quarter-m and a height of three to seven m, in a sinuous
fashion of extremely tight bends followed by straight stretches at a moderately
steep downward gradient. The floor is mostly bedrock with areas of gypsum float
and organic debris, most likely the result of large flows of surficial water during
significant precipitation events. At this point, the cave passage steps down
through a hypogene, vertical breccia pipe of calcitized gypsum extending
approximately three lateral m, while narrowing to a more tube-like conduit one m
in diameter and 10 m long. The passage became impassable because a sump
was encountered, but it appears to continue with reduced aperture.
Horseshoe Cave
Horseshoe Cave (Figure C6) is located along the Texas-New Mexico
border (Figure C1). The cave is approximately 60 m long and seven m deep. The
entrance to the cave is located in the bottom of a large, collapsed bedrock arroyo

146
Figure C6: drafted cave map of Horseshoe Cave.

147
approximately 24 m in diameter and 10 m deep. Sediment and organic matter
have been washed into the arroyo, forming a hill-like feature in the center with
vegetation growing throughout. The entrance to the cave is four m tall and one m
wide, with significant gypsum float and organic matter lining the floor. The
entrenched passage continues with a relatively constant size for approximately
18 m before encountering a large section of bedrock wall that has sheared off
and created a divider within the passage. Sediment and organic matter have
accumulated around the feature from the flow of surface waters into the cave.
After another three m, the passage begins to narrow to about one-and-one-half
m tall, before crossing the phreatic zone and filling with water and mud. Fracture
control patterns and vadose/phreatic entrenchment indicate epigene origins of
Horseshoe Cave.
JB Hole
JB Hole (Figure C7) is centrally located within the study area (Figure C1),
with a survey length of 74 m and four m in depth. The first of two entrances is an
approximately one-m-tall, half-m-wide crawl located
t the northern most extent of the cave. The passage immediately adjacent to the
entrance opens to a three-m-wide room extending south to split into two
passages. The floor is a layer of bedrock breakdown from the ceiling and walls.
One of the passages extends southwest for approximately six m before
narrowing from two m wide to a quarter-m.

148
The main passage of the cave continues southeast for approximately 10
m before the subtle change to a southwest trend. Along this extent, the floor
contains large amounts of gypsum bedrock breakdown from the ceiling and
walls, as well as dry sediment. Several small drainage tubes are located along
the base of the walls of this main passage. After traversing approximately 15 m,
a second entrance to the cave is found as a skylight, approximately three m
above the floor and three-fourths-m in diameter.
Figure C7: drafted cave map of JB Hole.

149
Beyond this second, southern most entrance, the cave narrows to
approximately a quarter-m wide and half-m tall for approximately two-and-one-
half m before opening to a series of collapsed rooms each no more than a m-
and-one-half tall and a m wide. Eventually the cave terminates in a collapsed
area that was impassable at the time of survey. A third collapsed sinkhole is
located near the extent of JB Hole that likely connected to the feature before it’s
collapse.
JB Hole is an epigene feature formed as an entrenched and solutionally-
widened fracture through gypsum bedrock. The extent of the cave follows a main
fracture that has begun to collapse and exhibits large selenite crystal growth
within the ceiling. Moderately-sized scallops along the walls of the cave are
evidence of surficial water flow acting to further widen and entrench the cave.
Suffosion of overlying and entrance soils have contributed to infilling and
blockage of the greater extent of passage.
K-Hill Pit
K-Hill Pit (Figure C8) is located southwest of K-Hill (Figure C1), formed at
the base of a near vertical arroyo approximately one m in diameter and three-
and-on-half m deep. Small scallop features in the bedrock walls indicated rapid
flow of water into the cave. At the bottom of the first pit a second, pit-like drop
exists with a diameter of one-third-m and three-and-one-half m deep. The cave
continues to narrow as the passage trends back below the second level shelf

150
feature in a northeast direction approximately three-and-one-half m before
reaching a vertical drain pipe too small to enter. The ceiling of the cave shows
heavy fracture control, suggestive of epigenic origins.
Lost Cave
Lost Cave (Figure C9) is a small epigene feature developed along a solutionally-
widened and vadose-entrenched fracture with a length of 13 m and a total depth
of three m located west of K-Hill (Figure C1). The entrance is approximately
Figure C8: drafted cave map of K-Hill Pit.
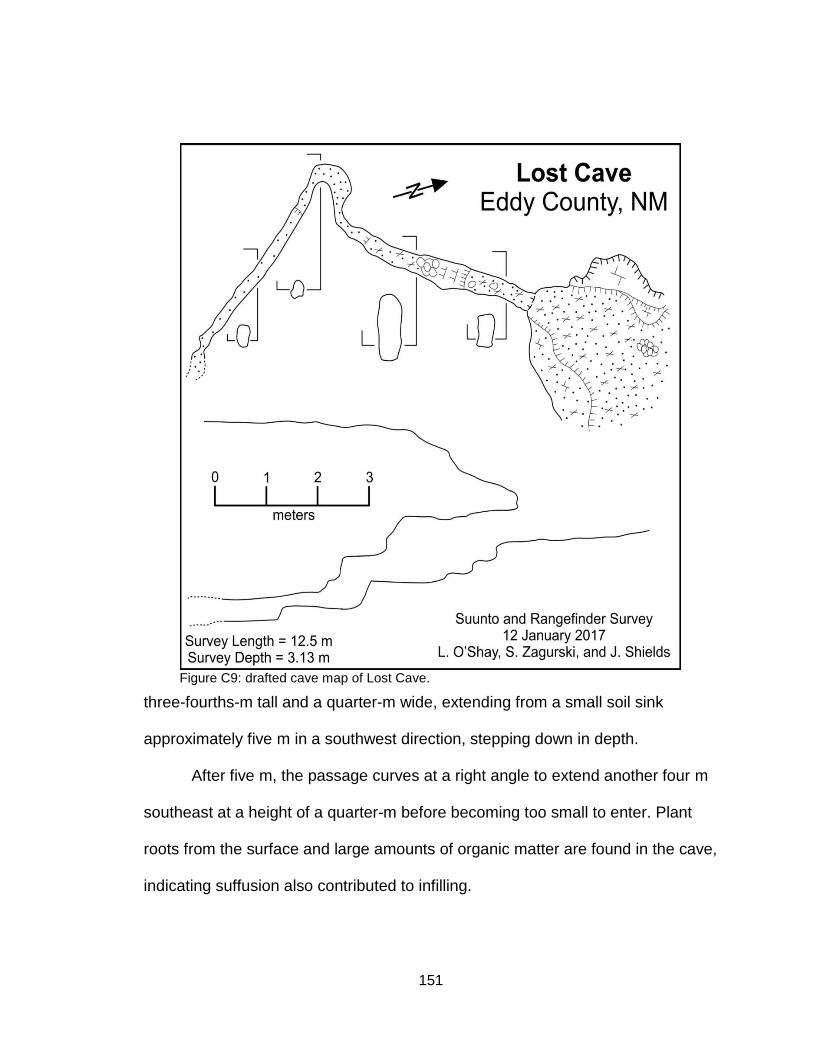
151
three-fourths-m tall and a quarter-m wide, extending from a small soil sink
approximately five m in a southwest direction, stepping down in depth.
After five m, the passage curves at a right angle to extend another four m
southeast at a height of a quarter-m before becoming too small to enter. Plant
roots from the surface and large amounts of organic matter are found in the cave,
indicating suffusion also contributed to infilling.
Figure C9: drafted cave map of Lost Cave.

152
Nicholl’s Cave
Nicholl’s Cave is a small vadose zone cave system within gypsum
bedrock formed by epigene processes (Figure C1). The cave features a total
length of 20 m and depth of five m. The entrance to Nicholl’s Cave is
approximately one-half-m in diameter through indurated gypsic soil and opens to
Figure C10: drafted cave map of Nicholl’s Cave.

153
a large room of the same material. Large sections of collapsed soil from the
ceiling cover the floor. Suffosion caused by water flow from the surface to the
lower cave system through subsurface fracture networks created this large soil
room immediately adjacent to the entrance. The northwest corner of the room
connects to solid gypsum bedrock passage about three-fourths-m in diameter
and one-half-m tall, continuing in this way for nine m before becoming too narrow
to continue. Gypsum float and soil line the floor along this portion of Nicholl’s
Cave (Figure C10). Small wall scallops, and the fracture-controlled nature of the
ceiling indicate that this bedrock section of cave was created by epigene
processes.
Quill Soil Cave
Quill Soil Cave (Figure C11) is located northwest of U.S. Highway 62/180
(Figure C1). The cave opens from a slight depression in the soil to converge with
an entrance one m in diameter. The passage opens to three-m-wide and two-m-
tall, extending four m before narrowing to one-m-wide by one-half-m-tall. The
cave is completely formed within indurated gypsic soil, with boulders of soil
collapse lining the passage floor. The cave opens to a small room of breakdown
before extending another 12 m and opening to another room.
The passage continues in this pattern until finally narrowing to one-
quarter-m in diameter, prohibiting further survey, for a total length of 49 m and
depth of four m. Over time, the soil has piped through the subsurface by fluids
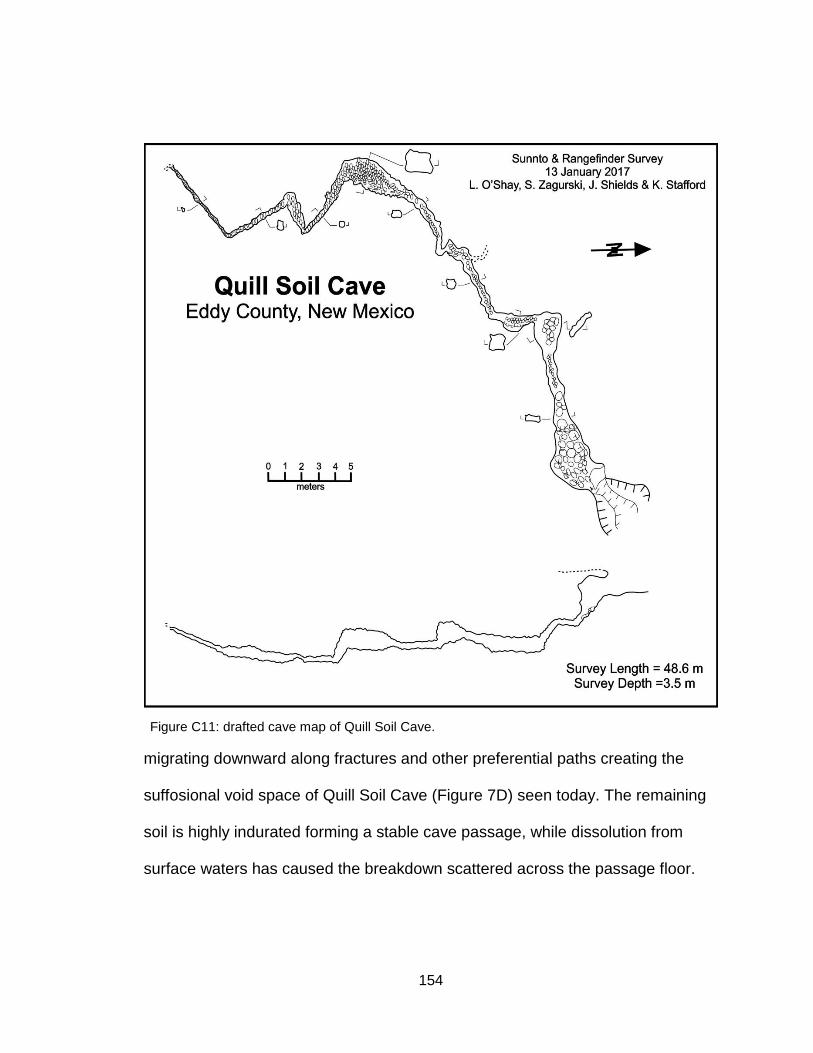
154
migrating downward along fractures and other preferential paths creating the
suffosional void space of Quill Soil Cave (Figure 7D) seen today. The remaining
soil is highly indurated forming a stable cave passage, while dissolution from
surface waters has caused the breakdown scattered across the passage floor.
Figure C11: drafted cave map of Quill Soil Cave.

155
Figure C12: drafted cave map of Red Hammer Cave.
Red Hammer Cave
Red Hammer Cave (Figure C12) is located at the base of an entrenched
bedrock arroyo two-m-wide (Figure C1). The entrance to the cave, formed within
gypsum bedrock, is one-m-wide and two-m-tall. The cave immediately turns east
travelling five m along an entrenched epigene passage before opening into a pit
like structure, three-m-wide, one-m-long, and six-m-deep. From the entrance to
the pit, the floor is
mostly gypsum bedrock
with some gypsum float
in areas. The pit area
features three conduits
one-quarter-m in
diameter trending
northeast and
southwest at the level
of the uppermost
passage, further
indicating epigenic
phreatic formational
processes.

156
Hypogene processes most likely formed the lower pit area, and the center
spiral corkscrew feature through ascending fluids, due to the tubular passage
shape and smooth wall detail. This lower hypogene feature eventually
intersected epigene passage above, causing the floor to dissolve away and
create a pit. Further entrenchment of the pit occurred due to preferential flow of
surficial waters into the cave and down through the lower drain currently blocked
by collapse at the bottom of the pit. The upper passage continues adjacent to the
northern side of the pit, narrowing to half-m-wide and one-m-tall. All passages
appear to be formed along fractures, widened by fluid flow. Organic matter
flushed in through surface drainage lines this section of passage. After continuing
another five m, the passage opens into a deeply-entrenched area five-m-tall and
one-half-m-wide before the ceiling drops dramatically to a passage one-half-m-
tall and plugged with sediment. At this point the passage intersects the phreatic
zone, indicating phreatic-epigene formation of the entrenched portion.
VB Hole
VB Hole (Figure C13) is located along the southern side of the central
portion of U.S. Highway 62/180 (Figure C1) within the study area, with a total
survey length and depth of 63 m and two m, respectively. The main sinkhole is
located at the north end of the cave, but the entrance itself is blocked by
collapse. The larger of two remaining entrances, both of which are located within
the ceiling of the passage, are 15 m southeast of the main sinkhole. This

157
entrance is one m in diameter and two m above the floor within gypsic soil. The
cave passage is developed in solid gypsum bedrock trending northwest for 15 m
at a width of 3 m. Gypsum collapse and soil line the floor in most of the cave.
Additional side passages are found at the main entrance and 10 m along the
passage north. These features exhibit drainage characteristics and indicate
epigenic origins controlled by preexisting fractures within the bedrock.
The second entrance is much smaller than the first, and is found eight m
south of the first. A shaft one-quarter-of-a-m in diameter and one m above the
floor has formed within the gypsic soil above, due to uffusion processes. The
passage south drastically narrows to one-quarter- m in diameter for two m before
opening again to a relatively straight passage two m wide and one-and-one- half
m tall until terminating in collapse 30 m later. This portion of the cave also
exhibits high fracture control and epigene origins.

158
Fig
ure
C13 :
dra
fted c
ave m
ap o
f V
B H
ole
.

159
Zombie Cave
Zombie Cave (Figure C14) is a small epigene cave located between VB
Hole and Bridge Cave (Figure C1) approximately 43 m long and two m deep. The
cave entrance is located in the bottom of a bedrock sinkhole, approximately two
m tall and one m wide. The passage is formed in solid bedrock. The floor of the
passage is mostly bedrock with occasional collapse and dry soil. The passage is
clearly fracture controlled, continuing from the entrance approximately 25 m,
trending southeast at one-m-wide and one-and-one-half-m tall. The passage
Figure C14: drafted cave map of Zombie Cave.

160
forms a right angle, turning northeast for approximately 10 m at a similar height
and width. Another tight, 90 degree turn to the southeast, followed by the same
turn back to the northeast, ends in a decrease in passage width, impassable to
the survey team.

161
VITA
Jessica M. Shields graduated from Brazoswood High School in Clute, Texas. In
August of 2016, Jessica graduated from Stephen F. Austin State University
where she received her Bachelor of Science in Geology. In August of 2016 she
was admitted to the Graduate School of Stephen F. Austin State University and
began pursuing her Master of Science degree in Geology. Jessica received her
Master of Science degree in May of 2018.
Permanent Address: 2007 Wildwood Dr. Richwood, TX 77531
Style manual designation: Geological Society of America.
This thesis was typed by Jessica M. Shields.