Embed Size (px)
Citation preview
Speech enhancement using the modified phase-opponencymodel
Om D. Deshmukha� and Carol Y. Espy-WilsonDepartment of Electrical and Computer Engineering and Institute for Systems Research, University ofMaryland, College Park, Maryland 20742
Laurel H. CarneyDepartment of Biomedical and Chemical Engineering and Institute for Sensory Research, SyracuseUniversity, Syracuse, New York 13244
�Received 1 February 2006; revised 11 February 2007; accepted 13 February 2007�
In this paper we present a model called the Modified Phase-Opponency �MPO� model forsingle-channel speech enhancement when the speech is corrupted by additive noise. The MPOmodel is based on the auditory PO model, proposed for detection of tones in noise. The PO modelincludes a physiologically realistic mechanism for processing the information in neural dischargetimes and exploits the frequency-dependent phase properties of the tuned filters in the auditoryperiphery by using a cross-auditory-nerve-fiber coincidence detection for extracting temporal cues.The MPO model alters the components of the PO model such that the basic functionality of the POmodel is maintained but the properties of the model can be analyzed and modified independently.The MPO-based speech enhancement scheme does not need to estimate the noise characteristics nordoes it assume that the noise satisfies any statistical model. The MPO technique leads to the lowestvalue of the LPC-based objective measures and the highest value of the perceptual evaluation ofspeech quality measure compared to other methods when the speech signals are corrupted byfluctuating noise. Combining the MPO speech enhancement technique with our aperiodicity,periodicity, and pitch detector further improves its performance. © 2007 Acoustical Society ofAmerica. �DOI: 10.1121/1.2714913�
PACS number�s�: 43.72.Ne �DOS� Pages: 3886–3898
I. INTRODUCTION
Speech signals in real-world scenarios are often cor-rupted by various additive noise types �e.g., computer fannoise, subway noise, car noise, and babble�, convolutivenoise types �e.g., change in microphone or telephone-band-limited speech�, and nonlinear disturbances. Speech en-hancement techniques that can attenuate the interfering noisewith minimal distortions to the speech signal can be used invarious speech communication applications like automaticspeech recognition, hearing aids, car and mobile phones,cockpits, and multiparty conferencing devices.
The problem of speech enhancement has received a tre-mendous amount of research attention over the past severaldecades. A thorough discussion of the different speech en-hancement techniques can be found in Benesty et al. �2005�.A bulk of the speech enhancement techniques are based onmodifying the short time spectral amplitude �STSA� of thenoisy speech signals. The techniques based on subtractive-type algorithms assume that the background noise is locallystationary to the degree that noise characteristics computedduring the speech pauses are a good approximation to thenoise characteristics during the speech activity. In addition tothe basic spectral subtraction algorithm �Boll, 1979�, severalextensions and improvements have been proposed �Beh andKo, 2003; Berouti et al., 1979; Compernolle, 1992; Gustafs-
a�
Electronic mail: [email protected]3886 J. Acoust. Soc. Am. 121 �6�, June 2007 0001-4966/2007/12
son et al., 2001�. Virag �1999� presents a detailed analysis ofthe effect of variations in the subtraction parameters like theover-subtraction factor, the spectral flooring factor, and theexponent on the residual noise as well as the intelligibility ofthe enhanced speech. It also presents a spectral subtractionalgorithm that adapts the subtraction parameters in time andfrequency based on the masking properties of the humanauditory system.
McAulay and Malpass �1980� have shown that, undercertain assumptions about the spectral characteristics of thespeech signal and the noise, the spectral subtraction methodis the maximum likelihood estimator of the variance of thespeech spectral components. Ephraim and Malah �1984�have proposed a system that utilizes the minimum meansquare-error short-time spectral amplitude �MMSE-STSA�estimator to enhance speech signals. This method assumesthat each of the Fourier expansion coefficients of the speechand of the noise process can be modeled as Gaussian randomvariables with zero mean. Moreover, it is also assumed thatthese coefficients are independent of each other. The MMSE-STSA estimator which takes into account the uncertainty ofspeech presence �McAulay and Malpass, 1980� is also pre-sented. The quality of the enhanced speech is better using theMMSE estimator that takes into account the speech presenceuncertainty than the one that does not. The residual noise isperceived more as white noise than as musical noise and isattributed to the smooth variation of a priori signal-to-noise
ratio �SNR� estimates �Cappe, 1994�. The MMSE-STSA al-© 2007 Acoustical Society of America1�6�/3886/13/$23.00

gorithm is extended by Ephraim and Malah �1985� to com-pute the STSA estimator that minimizes the mean-square er-ror of the log-spectral amplitude, which is a more relevantcriterion for perceivable distortions in speech. Loizou �2005�replaced the squared-error cost function used in the MMSEestimator by perceptually more relevant cost functions thattake into account the auditory masking effects.
All of these speech enhancement methods make variousrestricting assumptions about the temporal and spectral char-acteristics of the speech signals and the corrupting noise. Itwill be shown in Sec. VI D that the performance of some ofthese methods deteriorates when the speech signals are cor-rupted by fluctuating noise. In this paper we present a speechenhancement technique, called the Modified Phase Op-ponency �MPO� speech enhancement technique, that makesminimal assumptions about the noise characteristics. TheMPO speech enhancement scheme does not assume that thenoise satisfies any statistical model or any degree of station-arity, nor does it need to estimate/update the noise character-istics but takes advantage of the known nature of speechsignals. The MPO speech enhancement technique is thus po-tentially robust to fluctuating background noise. The perfor-mance of the MPO technique on fluctuating noise is pre-sented in Sec. VI D. The MPO speech enhancement schemeis based on the auditory Phase Opponency �PO� model �Car-ney et al., 2002� for tone-in-noise detection that includes aphysiologically realistic mechanism for processing the infor-mation in neural discharge times. Some of the other speechenhancement techniques based on models of human auditorysystems include Cheng and O’Shaughnessy �1991�, Hansenand Nandkumar �1995�, Mesgarani and Shamma �2005�, andTsoukalas et al. �1997�.
In the present work, the MPO enhancement scheme isalso combined with our Aperiodicity, Periodicity and Pitch�APP� detector �Deshmukh et al., 2005b� to develop theMPO-APP speech enhancement scheme. The APP detectorwas developed to estimate the proportion of periodic andaperiodic energy in a speech signal. The MPO scheme iscombined with the APP detector to remove the narrowbandnoise that might be seen as speech-like by the MPO process-ing and to retain some of the wideband speech signal thatmight be seen as noise-like by the MPO processing. TheMPO-APP speech enhancement scheme produces a binaryspectrotemporal mask called the MPO profile that distin-guishes spectrotemporal regions where the speech signal ismore dominant than the regions where the noise is moredominant. The use of binary masks is fairly common in theauditory scene analysis based speech enhancement and ro-bust speech recognition techniques �Wang, 2005� and is mo-tivated by the phenomenon of masking in the human audi-tory system. Hu and Wang �2004� proposed a computationalauditory scene analysis method for segregating speech sig-nals corrupted by various additive interferences. This methodsegregates the low-frequency resolved harmonics of thespeech signals based on temporal continuity and cross-channel correlation and the high-frequency unresolved har-monics based on amplitude modulation and temporal conti-nuity. The segments from the resolved harmonics are
grouped according to common periodicity estimates and theJ. Acoust. Soc. Am., Vol. 121, No. 6, June 2007 Deshmukh e
segments from the unresolved harmonics are grouped ac-cording to common amplitude modulation rates. The pro-posed MPO-APP technique also contains an algorithm thatreliably estimates the proportion of periodicity in speech sig-nals but combines it with an algorithm that detects the pres-ence of narrowband signals in noise to separate speech sig-nals from the background noise.
The proposed speech enhancement scheme leads to thelowest value of the linear-predictive coefficients based objec-tive measures and the highest value of the perceptual evalu-ation of speech quality �PESQ� measure compared to someof the other methods when the speech signals are corruptedby fluctuating noise. The performance of the proposedspeech enhancement scheme is comparable to some of theother enhancement techniques when the global SNR and thenoise type of the corrupting noise are not fluctuating.
II. THE PHASE OPPONENCY MODEL
A model for detection of tone-in-noise based on process-ing the information in neural discharge times is presented inCarney et al. �2002�. This model exploits the frequency-dependent phase properties of the tuned filters in the auditoryperiphery and uses cross-auditory-nerve-fiber coincidencedetection to extract temporal cues. It is shown that the re-sponses of some of the cross-channel coincidence detectorsare reduced when a tone is present in the background noise.This reduction in response to the presence of the target isreferred to as Phase Opponency �PO�. The performance ofthe PO model in the detection of low-frequency tones em-bedded in fixed-level or roving-level masking noise is con-sistent with that of humans �Carney et al., 2002�, making it asuitable model to detect narrowband signals corrupted byadditive noise. In the present work, the PO model is ex-tended to develop a speech enhancement scheme by utilizingthe facts that �a� much of the speech signal is voiced and canbe thought of as a combination of narrowband signals �i.e.,harmonics� with varying amplitudes and �b� retaining thehigh-amplitude harmonics near the formant frequencies isperceptually more significant than the harmonics in the val-ley regions. The MPO processing scheme will thus not beable to retain the obstruents in a given speech signal al-though it does detect the frequency onset of strident frictionin high SNR situations.
Figure 1 shows the PO model with center frequency�CF� equal to 900 Hz. The two nerve fibers are modeled astwo gammatone filters with slightly different CFs. The mag-nitude and the phase response of the two gammatone filtersare also shown in Fig. 1.
When the input is a tone at 900 Hz, the outputs of thetwo filters will be out of phase and the cross correlation willlead to a negative output. The output will remain negative aslong as the input is a bandlimited signal centered at the CF�900 Hz in this case� and with bandwidth �BW� within theout-of-phase frequency region �Fa−Fb in Fig. 1�. We refer tothe frequency region Fa−Fb as the out-of-phase region andthe rest of the frequency region as the in-phase region. Whenthe input is a wideband signal, the output of the two filters
will exhibit some degree of correlation and the cross-t al.: Modified phase-opponency based speech enhancement 3887

correlation output will be positive or very slightly negative.Thus the model is able to distinguish between narrowbandsignals and wideband noise. A saturating nonlinearity is ap-plied to the output of each of the filters to minimize the effectof amplitude fluctuations on the overall output of the POmodel.
Some of the issues with the PO model shown in Fig. 1are that the relative magnitude response and the relativephase response of the two paths depend on the same set ofparameters, making it difficult to manipulate either of thetwo independent of the other. It is difficult to predict therelationship between the parameters controlling the charac-teristics of the PO model and the width and the location ofthe out-of-phase region.
III. MODIFIED PHASE OPPONENCY MODEL
To address the concerns raised in Sec. II about the POmodel, the MPO model was developed in such a way that thebasic functionality of the PO model is maintained, but thevarious properties of the model can be analyzed and modi-fied independent of each other. Figure 2 shows the schematicof the MPO model used in the present work. In the MPO
FIG. 1. PO filter pair to detect a tone at 900 Hz. GTF: Gammatone filter.The relative phase response of the two GTFs is out-of-phase in the fre-quency range �Fa−Fb�. The CFs for the two filters are 848.5 and 951.5 Hz.Adapted from Carney et al. �2002�.
FIG. 2. Modified PO filter pair. “Norm” indicates amplitude normalization.
3888 J. Acoust. Soc. Am., Vol. 121, No. 6, June 2007 Desh
model, one of the paths is modeled as a linear-phase finiteimpulse response �FIR� bandpass filter �BPF�. The otherchannel is modeled as a concatenation of the same FIR BPFfollowed by an all pass filter �APF�. The relative phase re-sponse of the two paths can be manipulated by changing theparameters of the APF which does not introduce any changesin the relative magnitude response. The magnitude responseof the two paths can be manipulated by changing the param-eters of the BPF which does not introduce any changes in therelative phase response. Thus the MPO model shown in Fig.2 allows for manipulation of the relative magnitude responseand the relative phase response independently of the other.The filters are followed by an amplitude normalizing schemeto minimize the effect of magnitude information in the cross-frequency coincidence. The characteristics of the BPF aremainly decided by the range of the target frequency that is tobe detected. The characteristics of the APF are mainly de-cided by the expected frequency range and BWs of the targetsignals. The relation between the parameters of the APF andits phase response is explored below.
A. Mathematical formulation of the MPO model
Consider a second-order APF, H�z�, with one pair ofcomplex conjugate poles,
H�z� =�z−1 − a*��z−1 − a�
�1 − a*z−1��1 − az−1�,
where a=rej� is the complex pole and a* is its complexconjugate. Figure 3 shows the magnitude and the phase re-sponse of the APF for r=0.93 and �=0.375�. The magnituderesponse is uniformly 0 dB for all values of the frequency �.
FIG. 3. �Color online� Magnitude and phase response of a typical all passfilter with one pair of complex conjugate poles. The out-of-phase frequencyregion is also shown.
The phase response, ����, is given by
mukh et al.: Modified phase-opponency based speech enhancement

���� = − 2�
− 2 tan−1� 2r sin���cos��� − r2 sin�2��1 − 2r cos���cos��� + r2 cos�2��� .
�1�
We are interested in deriving the relationship between r and� and the location and the width of the out-of-phase region.Notice from Fig. 3 that locating the out-of-phase region isequivalent to locating the frequency region where the phaseresponse is the steepest. The frequency region where thephase response, ����, is the steepest can be located by find-ing the frequency where the slope of the phase response hasan inflection point, i.e., by finding the � for whichd2������ /d�2=0. Equating the numerator of the second-order derivative to zero and simplifying leads to
D�r,�,��cos � = cos � ,
where
D�r,�,�� = �1 + 2r2 + 4r2�cos2 � + sin2 �� + r4
4r�1 + r2� � . �2�
If we assume �=�, then the cos � term on the left-hand sideof Eq. �2� is balanced by the cos � term on the right-handside. Further, if we assume r=1, then the sum of the coeffi-cients in the numerator of D�r ,� ,�� �1+2+4+1=8� is ex-actly equal to that of the coefficients in the denominator �4� �1+1�=8�. Thus, the equality in Eq. �2� holds for �=� andr=1. However, stability of the APF dictates that the magni-tude of r be less than 1. It can easily be verified �Deshmukh,2006� that D�r ,� ,�� remains close to 1 even for variousvalues of r less than 1. Thus, it is reasonably accurate toassume that:
The slope of the phase response, ����, of a stable APFwith a pair of complex conjugate poles at re±j� is the steepestat frequency �=�. Moreover, this frequency location is inde-pendent of r, the magnitude of the pole.
The phase response, ����, of the APF at �=�, under theassumption of r�1 simplifies to:
���� � �� if cot � � 0
− � if cot � � 0. �3�
The phase response at �=� can thus be approximatedas ±�.
The closer the value of r to 1, the more accurate theapproximation is. The next step is to express the dependenceof the width of the out-of-phase region on the values of r and�. This is equivalent to expressing the slope of ���� at �=� in terms of r and �. Evaluating the derivative of ����with respect to � at �=� for various values of � and �shows that for a given value of r, the value of d������ /d� isnot very sensitive to the value of �. On the other hand, it isvery sensitive to the choice of r. It can thus be assumed that:
d������ /d� evaluated at �=� (i.e., at the frequencywhere the phase response of the APF is the steepest) is inde-pendent of � and is dependent only on the value of r.
In summary, for an APF with poles at a=rej� and a*, theout-of-phase region is centered around �=� irrespective of
the value of r �the phase response at �=� is approximatelyJ. Acoust. Soc. Am., Vol. 121, No. 6, June 2007 Deshmukh e
equal to ±�� and the width of the out-of-phase region iscontrolled only by the value of r, irrespective of the value of�.
B. MPO design
Our aim is to design a MPO structure to detect signalscentered at �c and of bandwidths less than or equal to ��.The first requirement is to choose the APF such that thephase response is about −� at �c. Analysis in Sec. III Ashows that this requirement is satisfied by choosing the phaseof the pole of the APF as �=�c �see Eq. �3��, irrespective ofwhat the value of r, the magnitude of the pole of the APF, is.The expected bandwidth of the target signal, ��, dictates thevalue of r. The value of r should be such that the phaseresponse, ����, of the APF spans −� /2 to −3� /2 in �� radcentered around �c �i.e., the out-of-phase region correspondsto the expected bandwidth of the input signal�. Unfortu-nately, there is no closed form relation between r and theBW of the out-of-phase region. For a given expected band-width, ��, the value of r has to be computed using multipletrials. But, as is shown in Sec. III A, for a given bandwidth,the value of r is dependent only on the bandwidth and isindependent of the center frequency of the signal. Assumethat the optimal value of r for the expected bandwidth of ��is r=rc. The APF is completely defined by specifying theparameters r and �.
The next step is to choose the FIR BPF. The BPF has tosatisfy two constraints:
�1� The passband of the BPF should include the out-of-phase region.
�2� The passband should be such that the MPO output isnegative for narrowband signals �with bandwidth lessthan or equal to �� and centered at the CF� and positivefor wideband signals.
Several BPFs can be designed that satisfy the two above-
FIG. 4. �Color online� Magnitude response of the �a� symmetric BPF; �b�upward-skewed BFP; and �c� downward-skewed BPF that will be used inthe MPO structure with CF=1000 Hz. �d� Phase response of the APF thatwill be used in the MPO structure with CF=1000 Hz. �e� Spectral slice of asonorant region in speech signal.
mentioned constraints. Figure 4 shows three such BPFs for a
t al.: Modified phase-opponency based speech enhancement 3889

MPO structure that can be used to distinguish narrowbandsignals centered at 1000 Hz with bandwidth less than 250 Hzfrom wideband noise signals. Initial versions of the MPO-based speech enhancement scheme �Deshmukh and Espy-Wilson, 2005; Deshmukh et al., 2005a� used BPFs with pass-band symmetry across the CF of the MPO structure. Figure4�a� shows the magnitude response of such a symmetric BPF.Figure 4�d� shows the phase response of the APF used in thecorresponding MPO structure. The optimal bandwidth of theBPF is computed by calculating the two-class �narrowband-signal-in-noise versus noise-only� classification error for dif-ferent choices of bandwidths and choosing the one that givesthe least error. For low values of bandwidth the output forthe presence-of-signal situations as well as for the absence-of-signal situations will be negative leading to many false-positive errors whereas for high values of bandwidth the out-put for the absence-of-signal situations as well as for thepresence-of-signal situations will be positive leading to manycorrect-miss errors. Figure 5 plots the total classification er-ror for a MPO structure that uses the APF shown in Fig. 4�d�and for different bandwidths of the corresponding symmetricBPF. The optimal BPF is 450�2=900 Hz. Note that theclassification error is close to the minimum value over awide range of the BPF bandwidths �800–1200 Hz� and isthus not very sensitive to the exact choice of the BPF band-width. In all the simulations, the BPF length was kept con-stant at 76 samples, and was constructed using the standardMATLAB routine fir1.
Figure 6 shows the distribution of the output of the MPOmodel shown in Figs. 4�a� and 4�d� for 5000 frames �a frameis 30 ms long with a frame rate of 5 ms� each of white noiseand a bandlimited signal centered at 1000 Hz and of band-width 250 Hz corrupted with white noise at , 20, 10, and0 dB SNR. Notice that the distribution of the output forwhite noise is well separated from that for the bandlimitedsignal at dB SNR. Moreover, the distribution of the band-limited signal corrupted by white noise remains quite similar
FIG. 5. �Color online� Variation in the binary classification error as thebandwidth of the BPF is varied. The two classes are: �a� presence of nar-rowband signal in broadband noise at 0 dB SNR and �b� broadband noise.
over a wide range of SNRs � to 0 dB�. The threshold to
3890 J. Acoust. Soc. Am., Vol. 121, No. 6, June 2007 Desh
discriminate the presence of the signal from the absence ofsignal is computed using the maximum likelihood �ML�-based likelihood ratio test �LRT�. The optimal thresholdvalue is −0.0215. Figure 7 shows the receiver operating char-acteristic �ROC� curve for MPO detectors at three differentCFs: 950 Hz �dash curve�, 1000 Hz �dotted curve�, and1050 Hz �solid curve�. The optimal threshold values are:−0.0183, −0.0215, and −0.0197, respectively. The ROCcurves in Fig. 7 were obtained by varying the threshold overthe range: �opt�thresh −0.05:−0.005� where opt�thresh is theoptimal threshold for the corresponding MPO detector. Ingeneral, it is observed that the probability of false alarm isbelow 3% for threshold values below 0 �the theoreticalthreshold� and the probability of detection remains above96% for threshold values as low as opt�thresh −0.05 indicat-ing that the exact value of the threshold is not critical for theoverall operation of the MPO detectors. It is worth pointingout that the thresholds for the MPO detectors at different CFsare computed using the two extremes of �a� narrowband sig-
FIG. 6. �Color online� Distribution of the output of MPO model when theinput is white noise ���; band-limited signal at dB SNR ���; at 20 dBSNR ��; at 10 dB SNR �black curve: *�; and at 0 dB-SNR ���.
FIG. 7. �Color online� ROC curves for MPO detectors at three differentCFs: 950 Hz �dash curve�; 1000 Hz �dotted curve�; and 1050 Hz �solid
curve�.mukh et al.: Modified phase-opponency based speech enhancement
nals centered at the CF and �b� white noise. These thresholdsare not retrained when the background conditions change. Itis shown in Sec. VI that the MPO speech enhancementscheme is robust to various noise types at different levelswith no additional noise-specific training.
The other two BPFs shown in Fig. 4 have passbandsskewed upward or downward in frequency with respect tothe CF of the MPO structure �Figs. 4�b� and 4�c�, respec-tively�. Both of these BPFs offer some advantages over thesymmetric BPF and will be discussed in Sec. IV A.
IV. MPO-BASED SPEECH ENHANCEMENT
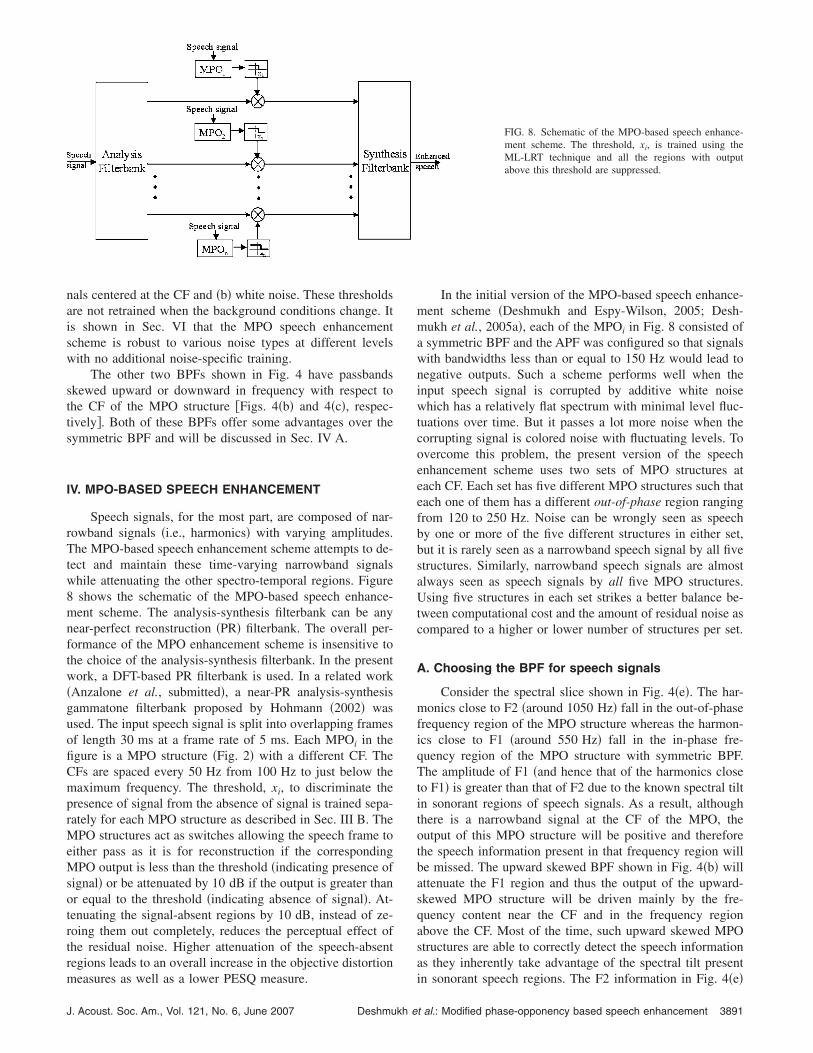
Speech signals, for the most part, are composed of nar-rowband signals �i.e., harmonics� with varying amplitudes.The MPO-based speech enhancement scheme attempts to de-tect and maintain these time-varying narrowband signalswhile attenuating the other spectro-temporal regions. Figure8 shows the schematic of the MPO-based speech enhance-ment scheme. The analysis-synthesis filterbank can be anynear-perfect reconstruction �PR� filterbank. The overall per-formance of the MPO enhancement scheme is insensitive tothe choice of the analysis-synthesis filterbank. In the presentwork, a DFT-based PR filterbank is used. In a related work�Anzalone et al., submitted�, a near-PR analysis-synthesisgammatone filterbank proposed by Hohmann �2002� wasused. The input speech signal is split into overlapping framesof length 30 ms at a frame rate of 5 ms. Each MPOi in thefigure is a MPO structure �Fig. 2� with a different CF. TheCFs are spaced every 50 Hz from 100 Hz to just below themaximum frequency. The threshold, xi, to discriminate thepresence of signal from the absence of signal is trained sepa-rately for each MPO structure as described in Sec. III B. TheMPO structures act as switches allowing the speech frame toeither pass as it is for reconstruction if the correspondingMPO output is less than the threshold �indicating presence ofsignal� or be attenuated by 10 dB if the output is greater thanor equal to the threshold �indicating absence of signal�. At-tenuating the signal-absent regions by 10 dB, instead of ze-roing them out completely, reduces the perceptual effect ofthe residual noise. Higher attenuation of the speech-absentregions leads to an overall increase in the objective distortion
measures as well as a lower PESQ measure.J. Acoust. Soc. Am., Vol. 121, No. 6, June 2007 Deshmukh e
In the initial version of the MPO-based speech enhance-ment scheme �Deshmukh and Espy-Wilson, 2005; Desh-mukh et al., 2005a�, each of the MPOi in Fig. 8 consisted ofa symmetric BPF and the APF was configured so that signalswith bandwidths less than or equal to 150 Hz would lead tonegative outputs. Such a scheme performs well when theinput speech signal is corrupted by additive white noisewhich has a relatively flat spectrum with minimal level fluc-tuations over time. But it passes a lot more noise when thecorrupting signal is colored noise with fluctuating levels. Toovercome this problem, the present version of the speechenhancement scheme uses two sets of MPO structures ateach CF. Each set has five different MPO structures such thateach one of them has a different out-of-phase region rangingfrom 120 to 250 Hz. Noise can be wrongly seen as speechby one or more of the five different structures in either set,but it is rarely seen as a narrowband speech signal by all fivestructures. Similarly, narrowband speech signals are almostalways seen as speech signals by all five MPO structures.Using five structures in each set strikes a better balance be-tween computational cost and the amount of residual noise ascompared to a higher or lower number of structures per set.
A. Choosing the BPF for speech signals
Consider the spectral slice shown in Fig. 4�e�. The har-monics close to F2 �around 1050 Hz� fall in the out-of-phasefrequency region of the MPO structure whereas the harmon-ics close to F1 �around 550 Hz� fall in the in-phase fre-quency region of the MPO structure with symmetric BPF.The amplitude of F1 �and hence that of the harmonics closeto F1� is greater than that of F2 due to the known spectral tiltin sonorant regions of speech signals. As a result, althoughthere is a narrowband signal at the CF of the MPO, theoutput of this MPO structure will be positive and thereforethe speech information present in that frequency region willbe missed. The upward skewed BPF shown in Fig. 4�b� willattenuate the F1 region and thus the output of the upward-skewed MPO structure will be driven mainly by the fre-quency content near the CF and in the frequency regionabove the CF. Most of the time, such upward skewed MPOstructures are able to correctly detect the speech informationas they inherently take advantage of the spectral tilt present
FIG. 8. Schematic of the MPO-based speech enhance-ment scheme. The threshold, xi, is trained using theML-LRT technique and all the regions with outputabove this threshold are suppressed.
in sonorant speech regions. The F2 information in Fig. 4�e�
t al.: Modified phase-opponency based speech enhancement 3891
that was missed by the symmetric MPO structure will bedetected by the upward-skewed MPO structure.
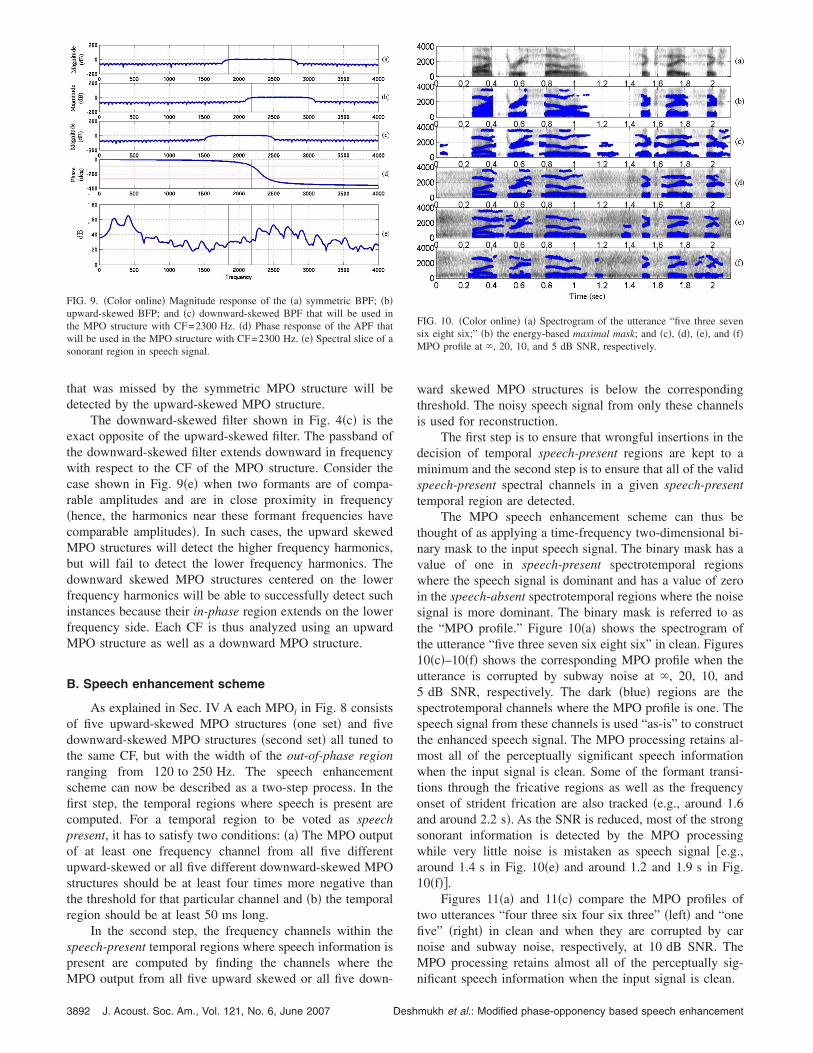
The downward-skewed filter shown in Fig. 4�c� is theexact opposite of the upward-skewed filter. The passband ofthe downward-skewed filter extends downward in frequencywith respect to the CF of the MPO structure. Consider thecase shown in Fig. 9�e� when two formants are of compa-rable amplitudes and are in close proximity in frequency�hence, the harmonics near these formant frequencies havecomparable amplitudes�. In such cases, the upward skewedMPO structures will detect the higher frequency harmonics,but will fail to detect the lower frequency harmonics. Thedownward skewed MPO structures centered on the lowerfrequency harmonics will be able to successfully detect suchinstances because their in-phase region extends on the lowerfrequency side. Each CF is thus analyzed using an upwardMPO structure as well as a downward MPO structure.
B. Speech enhancement scheme
As explained in Sec. IV A each MPOi in Fig. 8 consistsof five upward-skewed MPO structures �one set� and fivedownward-skewed MPO structures �second set� all tuned tothe same CF, but with the width of the out-of-phase regionranging from 120 to 250 Hz. The speech enhancementscheme can now be described as a two-step process. In thefirst step, the temporal regions where speech is present arecomputed. For a temporal region to be voted as speechpresent, it has to satisfy two conditions: �a� The MPO outputof at least one frequency channel from all five differentupward-skewed or all five different downward-skewed MPOstructures should be at least four times more negative thanthe threshold for that particular channel and �b� the temporalregion should be at least 50 ms long.
In the second step, the frequency channels within thespeech-present temporal regions where speech information ispresent are computed by finding the channels where the
FIG. 9. �Color online� Magnitude response of the �a� symmetric BPF; �b�upward-skewed BFP; and �c� downward-skewed BPF that will be used inthe MPO structure with CF=2300 Hz. �d� Phase response of the APF thatwill be used in the MPO structure with CF=2300 Hz. �e� Spectral slice of asonorant region in speech signal.
MPO output from all five upward skewed or all five down-
3892 J. Acoust. Soc. Am., Vol. 121, No. 6, June 2007 Desh
ward skewed MPO structures is below the correspondingthreshold. The noisy speech signal from only these channelsis used for reconstruction.
The first step is to ensure that wrongful insertions in thedecision of temporal speech-present regions are kept to aminimum and the second step is to ensure that all of the validspeech-present spectral channels in a given speech-presenttemporal region are detected.
The MPO speech enhancement scheme can thus bethought of as applying a time-frequency two-dimensional bi-nary mask to the input speech signal. The binary mask has avalue of one in speech-present spectrotemporal regionswhere the speech signal is dominant and has a value of zeroin the speech-absent spectrotemporal regions where the noisesignal is more dominant. The binary mask is referred to asthe “MPO profile.” Figure 10�a� shows the spectrogram ofthe utterance “five three seven six eight six” in clean. Figures10�c�–10�f� shows the corresponding MPO profile when theutterance is corrupted by subway noise at , 20, 10, and5 dB SNR, respectively. The dark �blue� regions are thespectrotemporal channels where the MPO profile is one. Thespeech signal from these channels is used “as-is” to constructthe enhanced speech signal. The MPO processing retains al-most all of the perceptually significant speech informationwhen the input signal is clean. Some of the formant transi-tions through the fricative regions as well as the frequencyonset of strident frication are also tracked �e.g., around 1.6and around 2.2 s�. As the SNR is reduced, most of the strongsonorant information is detected by the MPO processingwhile very little noise is mistaken as speech signal �e.g.,around 1.4 s in Fig. 10�e� and around 1.2 and 1.9 s in Fig.10�f��.
Figures 11�a� and 11�c� compare the MPO profiles oftwo utterances “four three six four six three” �left� and “onefive” �right� in clean and when they are corrupted by carnoise and subway noise, respectively, at 10 dB SNR. TheMPO processing retains almost all of the perceptually sig-
FIG. 10. �Color online� �a� Spectrogram of the utterance “five three sevensix eight six;” �b� the energy-based maximal mask; and �c�, �d�, �e�, and �f�MPO profile at , 20, 10, and 5 dB SNR, respectively.
nificant speech information when the input signal is clean.
mukh et al.: Modified phase-opponency based speech enhancement

When the input signal is noisy, the MPO processing,while detecting most of the strong harmonics, fails to detectthe short vowel /I/ in both the instances of “six” �1.12–1.16and 1.68–1.73 s in Fig. 11�d�� as well as completely missesthe last “three” �1.9–2.3 s�. Also notice that the /w/ in thenoisy “one” �0.22–0.3 s Fig. 11�d� on the right� is not de-tected by the MPO processing. F1 and F2 for /w/ are veryclose and thus look like a wideband signal which is not de-tected by the MPO processing. Also note that in all of theseregions the temporal signal has strong periodicity which dis-tinguishes it from the temporal signal in the noise-only re-gions. On the other hand, some of the noise is wrongly seenas narrowband signal by the MPO processing and is passedfor reconstruction �e.g., 0.12–0.2 and 2.23–2.3 s in Fig.11�d��. But these noise regions are not as periodic as thespeech-present regions.
The number of noise-insertions and the number ofspeech-deletions can be reduced by combining the MPO pro-cessing with an algorithm that reliably estimates the period-icity information in speech signals. In the present work, theMPO processing is combined with our APP detector �Desh-mukh et al., 2005b�. The APP detector estimates the propor-tion of periodic and aperiodic energy in each spectrotemporalchannel as well as the confidence of periodicity in each timeframe. Such a time-frequency analysis by the APP detectormakes it convenient to combine the APP detector with theMPO processing. The narrowband noise that is inserted inthe reconstructed speech signal by the MPO processing doesnot have a harmonic structure across the frequency channelssimilar to that of the periodic regions in a speech signal. Onthe other hand, the locally wide-band regions of speech sig-nals formed due to the proximity of two or more formantsretain a coherent harmonic structure across the frequencychannels. The APP detector captures this coherence ofacross-frequency-channel periodicity and can reduce suchspeech-deletions in the MPO speech enhancement scheme.
FIG. 11. �Color online� �a� Spectrograms of clean signals “four three threesix four six three” �left� and “one five” �right�. �b� The MPO profiles of thecorresponding signals. �c� Spectrograms of the signals corrupted by carnoise �left� and subway noise �right� at 10 dB SNR. �d� The MPO profiles ofthe corresponding noisy signals. �e� Periodicity confidence. Frames withperiodicity confidence greater than per�thresh are shown with a thicker line.�f� The combined MPO-APP profiles of the noisy signals.
Section V presents a brief overview of the APP detector,
J. Acoust. Soc. Am., Vol. 121, No. 6, June 2007 Deshmukh e
the use of the APP detector as a separate speech enhance-ment technique, and the way in which the MPO processing iscombined with the APP detector.
V. APERIODICITY, PERIODICITY, AND PITCHDETECTOR
The processing in the APP detector begins by splittingthe speech signal into 60 frequency channels that are equi-spaced on the ERB scale. The average magnitude differencefunction �AMDF� is computed on the envelope of each of thefrequency channels at a frame rate of 2.5 ms and a framelength of 20 ms. The AMDF is given by
�n�k� = m=−
m=
�x�n + m�w�m� − x�n + m − k�w�m − k�� ,
where x�n� is the envelope signal, k is the lag value insamples, and w�m� is a 20-ms-long rectangular window.
For a periodic signal, the AMDF attains minima �re-ferred to as dips� values close to one at lags equivalent to thepitch period and its integer multiples. Moreover, for a framein a periodic speech region, the pitch period is quite similaracross the different frequency channels. Thus, lag-wise addi-tion of the AMDF dips across the frequency channels leadsto clustering at integer multiples of the pitch period as shownin Fig. 12�a� for a frame during the /w/ centered at 0.27 s inclean condition �Fig. 11, right-hand side�. Figures 12�b� and12�c� show that the clusters are retained even as the SNR isreduced to 10 and 5 dB, respectively. For an aperiodic frame,the lag-wise addition of the AMDF dips across the frequencychannels results in dips that are randomly scattered over therange of the possible lag values. For example, Fig. 12�d�shows the lag-wise addition of the AMDF dips for an aperi-odic frame centered at 0.46 s in the utterance shown on theright-hand side in Fig. 11 and corresponds to the phoneme /f/in “five.”
The periodicity confidence of a given temporal frame iscomputed as the strength of the dips close to the cluster
FIG. 12. AMDF clusters for a periodic frame at different SNRs and for anaperiodic frame.
peaks relative to the strength of the rest of the dips. The
t al.: Modified phase-opponency based speech enhancement 3893

locations of the cluster peaks is the estimate of the pitchfrequency. For aperiodic frames, where no strong clustersexist, a cluster is formed around the lag with the maximumstrength. The periodicity confidence values for the plots inFigs. 12�a�–12�d� are: 50.8, 9.7, 9.3, and 0.4, respectively.The periodicity confidence can thus distinguish a periodicframe from an aperiodic frame even when the speech signalis corrupted by noise. The optimal threshold of the periodic-ity confidence, per�thresh, to distinguish periodic framesfrom aperiodic frames is computed using periodic and aperi-odic frames from clean speech signals and is not altered asthe background conditions change.
Frequency channels where the AMDF dips close to thecluster peaks are stronger than the AMDF dips away fromthe cluster peaks are classified as periodic channels. The restof the channels are classified as aperiodic channels. Thisleads to a spectrotemporal binary mask, called the “APP pro-file,” which has a value of 1 in frequency channels which areestimated to be periodic and a value of 0 in channels whichare estimated to be aperiodic. Also, note that if any of thefrequency channels has periodic noise then the periodic noisewill be classified as periodic speech signal only if the corre-sponding period of the noise is very close to the estimatedpitch period of the speech signal. �Please refer to Deshmukhet al. �2005b� for more details on the various stages of theAPP detector.�
A. APP-based speech enhancement technique
The APP speech enhancement technique consists of theAPP detector sandwiched between a near-PR analysis-synthesis gammatone filterbank proposed by Hohmann�2002�. �The setup is similar to the one shown in Fig. 8 forthe MPO speech enhancement scheme.� The filters of thenear-PR filterbank are equi-spaced on the ERB scale and theCFs and the bandwidths are chosen such that they match thefilters used in the analysis of the APP detector. The spec-trotemporal channels where the APP profile is one �indicat-ing presence of periodic signal� are passed as-is to the syn-thesis filterbank and the rest of the spectrotemporal channelsare attenuated by 10 dB before being passed to the synthesisfilterbank.
B. Combining MPO processing with the APP detector
As mentioned earlier, some of the main shortcomings ofthe MPO processing are: �1� Noise insertions: Where someof the narrowband noise is detected as speech-like althoughit lacks the harmonicity typical of the sonorant speech re-gions and �2� speech deletions: Where locally wideband re-gions of speech signals are not retained although they have acoherent harmonic structure across the frequency channels.
For each of the frequency channels analyzed by theMPO processing, the AMDF dips are computed on the enve-lope of the channel signal. The periodicity confidence ofeach temporal frame is computed by the lag-wise addition ofthe AMDF dips across the frequency channels as mentionedin Sec. V. A given speech-present region in the MPO-processing is classified as speech-absent �and thus not used
for reconstruction� if the maximum value of the periodicity3894 J. Acoust. Soc. Am., Vol. 121, No. 6, June 2007 Desh
confidence in the corresponding region is below per�thresh.For example, consider the MPO-estimated speech-present re-gion between 0.13 and 0.20 s �Fig. 11�d�, left-hand side�.The maximum value of the periodicity confidence in thisregion is below per�thresh �frames with periodicity confi-dence greater than per�thresh are shown with a thicker line inFig. 11�e��. Thus, this region will not be used for reconstruc-tion. Such a strategy leads to a reduction in noise insertions.
All the frames that are classified as speech absent by theMPO processing but have the corresponding periodicity con-fidence greater than 2�per� thresh �indicating strong period-icity� are classified as speech present and reintroduced forsynthesis. Figure 11�f� shows the combined MPO-APP pro-file for the noisy utterances shown in Fig. 11�c�. Notice thatthe noise insertions are removed and most of the speech de-letions are reintroduced.
VI. EVALUATION
A. Database
The Aurora database �Hirsch and Pearce, 2000� wasused to evaluate the MPO-based speech enhancementscheme. This database is a derivative of the TIdigits databaseresampled at 8 kHz. The database has three different subsetsfor testing. In the present study, only the test subset A wasused for evaluation. Subset A consists of utterances corruptedby four different noise types at seven different SNRs from to −5 dB. Each utterance in the Aurora database is cor-rupted by one of the noise types at a given SNR. The fourdifferent noise types are: Subway noise, babble, car noise,and exhibition hall noise. These are referred to as N1, N2,N3, and N4, respectively.
A database of speech signals corrupted by fluctuatingnoise �F-DB� was formed from this subset of the Auroradatabase. Each utterance in F-DB database consists of sevendigits. Each of the seven digits is corrupted by a differentnoise type at a different SNR. The F-DB database consists of1120 such utterances.
The overall MPO speech enhancement strategy �i.e.,number of MPO structures at each CF, combining the outputof these MPO structures� was developed using a subset of theTIMIT database corrupted by white noise and a subset of theAurora database.
The performance of the MPO and the combined MPO-APP speech enhancement technique was compared withsome of the speech enhancement techniques presented in theliterature: �a� MMSE-STSA �Ephraim and Malah, 1984�; �b�MMSE-STSA with noncausal SNR estimation �NC-MMSE��Cohen, 2004�; �c� logMMSE-STSA �Ephraim and Malah,1985�; �d� Generalized Spectral Subtraction �GSS� �Comper-nolle, 1992�; �e� Hu-Wang method �2004�; and �f� APP-based speech enhancement technique. The code for the Hu-Wang method was downloaded from their lab website. Thecode was used as-is except the sampling rate was changedfrom 16 to 8 kHz.
The evaluations presented here only compare the quality
of the enhanced speech signals and not their intelligibility.mukh et al.: Modified phase-opponency based speech enhancement
Detailed evaluations comparing the intelligibility of thespeech signals enhanced using the different techniques willbe reported in the future.
B. Spectrograms displays
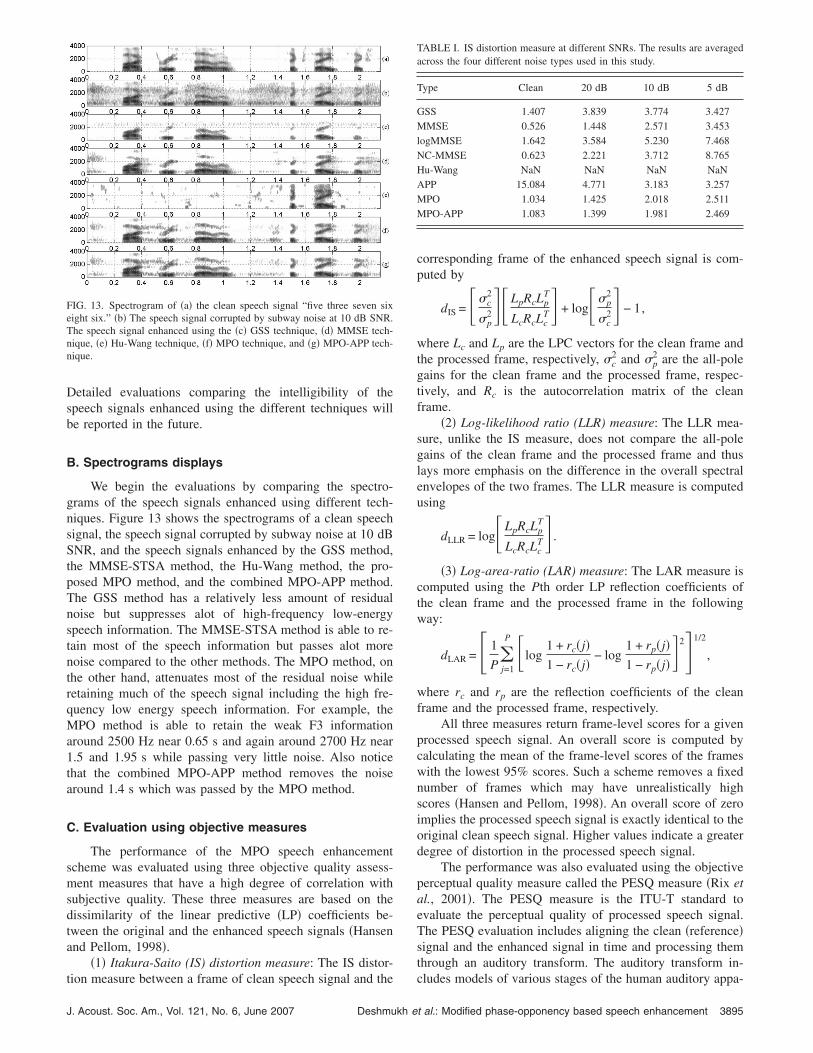
We begin the evaluations by comparing the spectro-grams of the speech signals enhanced using different tech-niques. Figure 13 shows the spectrograms of a clean speechsignal, the speech signal corrupted by subway noise at 10 dBSNR, and the speech signals enhanced by the GSS method,the MMSE-STSA method, the Hu-Wang method, the pro-posed MPO method, and the combined MPO-APP method.The GSS method has a relatively less amount of residualnoise but suppresses alot of high-frequency low-energyspeech information. The MMSE-STSA method is able to re-tain most of the speech information but passes alot morenoise compared to the other methods. The MPO method, onthe other hand, attenuates most of the residual noise whileretaining much of the speech signal including the high fre-quency low energy speech information. For example, theMPO method is able to retain the weak F3 informationaround 2500 Hz near 0.65 s and again around 2700 Hz near1.5 and 1.95 s while passing very little noise. Also noticethat the combined MPO-APP method removes the noisearound 1.4 s which was passed by the MPO method.
C. Evaluation using objective measures
The performance of the MPO speech enhancementscheme was evaluated using three objective quality assess-ment measures that have a high degree of correlation withsubjective quality. These three measures are based on thedissimilarity of the linear predictive �LP� coefficients be-tween the original and the enhanced speech signals �Hansenand Pellom, 1998�.
�1� Itakura-Saito (IS) distortion measure: The IS distor-
FIG. 13. Spectrogram of �a� the clean speech signal “five three seven sixeight six.” �b� The speech signal corrupted by subway noise at 10 dB SNR.The speech signal enhanced using the �c� GSS technique, �d� MMSE tech-nique, �e� Hu-Wang technique, �f� MPO technique, and �g� MPO-APP tech-nique.
tion measure between a frame of clean speech signal and the
J. Acoust. Soc. Am., Vol. 121, No. 6, June 2007 Deshmukh e
corresponding frame of the enhanced speech signal is com-puted by
dIS = ��c2
�p2��LpRcLp
T
LcRcLcT� + log��p
2
�c2� − 1,
where Lc and Lp are the LPC vectors for the clean frame andthe processed frame, respectively, �c
2 and �p2 are the all-pole
gains for the clean frame and the processed frame, respec-tively, and Rc is the autocorrelation matrix of the cleanframe.
�2� Log-likelihood ratio (LLR) measure: The LLR mea-sure, unlike the IS measure, does not compare the all-polegains of the clean frame and the processed frame and thuslays more emphasis on the difference in the overall spectralenvelopes of the two frames. The LLR measure is computedusing
dLLR = log�LpRcLpT
LcRcLcT� .
�3� Log-area-ratio (LAR) measure: The LAR measure iscomputed using the Pth order LP reflection coefficients ofthe clean frame and the processed frame in the followingway:
dLAR = � 1
Pj=1
P �log1 + rc�j�1 − rc�j�
− log1 + rp�j�1 − rp�j��2�1/2
,
where rc and rp are the reflection coefficients of the cleanframe and the processed frame, respectively.
All three measures return frame-level scores for a givenprocessed speech signal. An overall score is computed bycalculating the mean of the frame-level scores of the frameswith the lowest 95% scores. Such a scheme removes a fixednumber of frames which may have unrealistically highscores �Hansen and Pellom, 1998�. An overall score of zeroimplies the processed speech signal is exactly identical to theoriginal clean speech signal. Higher values indicate a greaterdegree of distortion in the processed speech signal.
The performance was also evaluated using the objectiveperceptual quality measure called the PESQ measure �Rix etal., 2001�. The PESQ measure is the ITU-T standard toevaluate the perceptual quality of processed speech signal.The PESQ evaluation includes aligning the clean �reference�signal and the enhanced signal in time and processing themthrough an auditory transform. The auditory transform in-
TABLE I. IS distortion measure at different SNRs. The results are averagedacross the four different noise types used in this study.
Type Clean 20 dB 10 dB 5 dB
GSS 1.407 3.839 3.774 3.427MMSE 0.526 1.448 2.571 3.453logMMSE 1.642 3.584 5.230 7.468NC-MMSE 0.623 2.221 3.712 8.765Hu-Wang NaN NaN NaN NaNAPP 15.084 4.771 3.183 3.257MPO 1.034 1.425 2.018 2.511MPO-APP 1.083 1.399 1.981 2.469
cludes models of various stages of the human auditory appa-
t al.: Modified phase-opponency based speech enhancement 3895
ratus. The outcome of the PESQ measure is an estimate ofthe subjective mean opinion score �MOS�, which has valuesbetween 0 �poor quality� and 4.5 �no perceptual distortion�.
Table I compares the IS distortion measure at differentSNRs for the output of different enhancement techniques.The MPO processing leads to the lowest IS measure whenthe input speech signal is noisy. Combining the MPO pro-cessing with the APP detector �MPO-APP� leads to a furtherdrop in the IS distortion measure in noisy conditions. The ISdistortion measure computed on MPO-processed cleanspeech signals is higher than that computed on clean speechsignals processed by other enhancement techniques. One ofthe reasons for this higher value could be that the spectralvalleys in clean speech signal are further attenuated by theMPO processing. The IS distortion values for the Hu-Wangmethod were quite high and are hence replaced by NaNs�not-a-number�. One of the reasons for the drop in the per-formance of the Hu-Wang method could be the change in thesampling rate. �Some of the parameters in the algorithmcould be optimized for the default sampling rate of 16 kHz.�.
Tables II and III compare the LAR and LLR measures,respectively, at different SNRs for the output of differentenhancement techniques. The LAR and LLR measures ob-tained for the proposed MPO enhancement scheme are com-parable with those obtained for some of the other enhance-ment schemes although the values are consistently higher�indicating more distortion� than those obtained for theMMSE-STSA enhancement scheme. Combining the MPOenhancement scheme with the APP detector �MPO-APP�consistently leads to a drop in the distortion values. Table IVcompares the PESQ measure at different SNRs for the outputof different enhancement techniques. The results are similarto those obtained for the LAR and LLR measures. The com-
TABLE II. LAR measure at different SNRs. The results are averaged acrossthe four different noise types used in this study.
Type Clean 20 dB 10 dB 5 dB
GSS 1.712 3.987 5.372 5.758MMSE 0.994 3.215 4.871 5.496logMMSE 1.160 3.218 5.211 5.867NC-MMSE 0.779 2.867 4.881 6.013Hu-Wang 7.761 17.841 32.533 40.827APP 2.590 4.538 5.433 5.923MPO 1.939 4.070 5.003 5.577MPO-APP 1.919 4.022 4.941 5.507
TABLE III. LLR measure at different SNRs. The results are averaged acrossthe four different noise types used in this study.
Type Clean 20 dB 10 dB 5 dB
GSS 0.103 0.453 0.782 0.958MMSE 0.081 0.397 0.748 0.942logMMSE 0.111 0.392 0.784 0.998NC-MMSE 0.064 0.366 0.765 1.032Hu-Wang 2.746 11.362 26.807 35.710APP 0.241 0.556 0.775 0.923MPO 0.159 0.519 0.761 0.943MPO-APP 0.158 0.510 0.750 0.929
3896 J. Acoust. Soc. Am., Vol. 121, No. 6, June 2007 Desh
bined MPO-APP enhancement technique is an improvementover the MPO enhancement technique and its performance iscomparable to that of some of the other enhancement tech-niques.
D. Robustness to fluctuating noise types and noiselevels
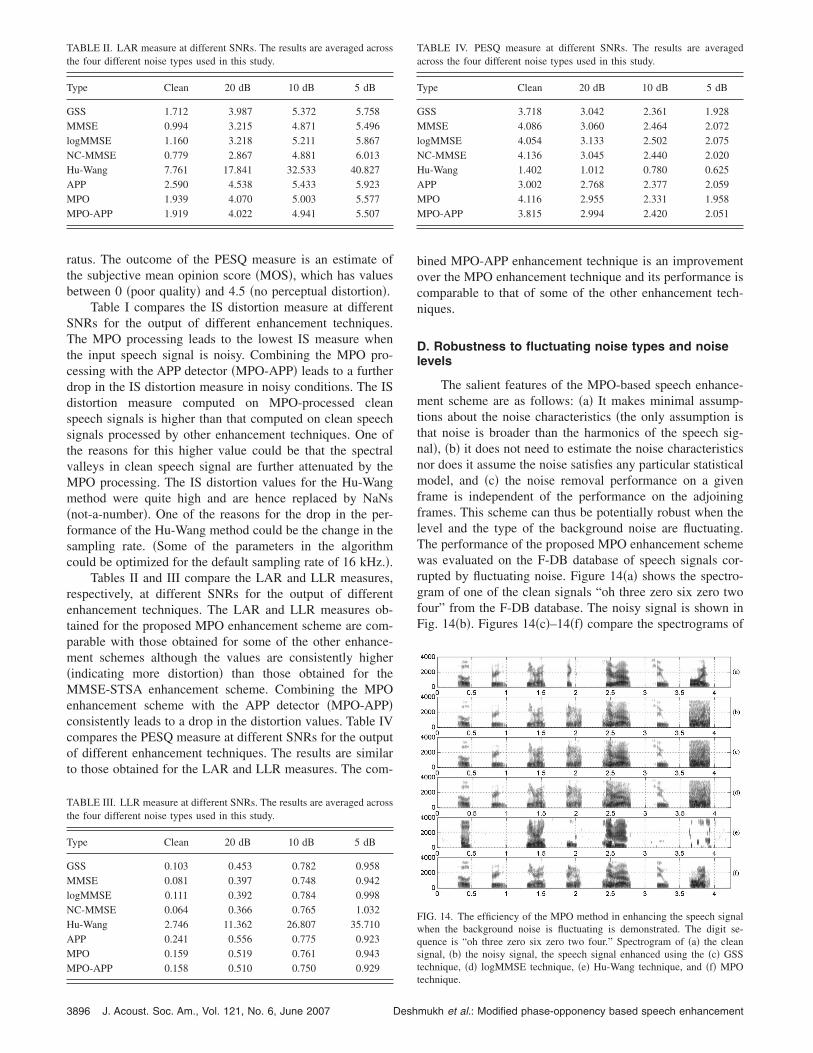
The salient features of the MPO-based speech enhance-ment scheme are as follows: �a� It makes minimal assump-tions about the noise characteristics �the only assumption isthat noise is broader than the harmonics of the speech sig-nal�, �b� it does not need to estimate the noise characteristicsnor does it assume the noise satisfies any particular statisticalmodel, and �c� the noise removal performance on a givenframe is independent of the performance on the adjoiningframes. This scheme can thus be potentially robust when thelevel and the type of the background noise are fluctuating.The performance of the proposed MPO enhancement schemewas evaluated on the F-DB database of speech signals cor-rupted by fluctuating noise. Figure 14�a� shows the spectro-gram of one of the clean signals “oh three zero six zero twofour” from the F-DB database. The noisy signal is shown inFig. 14�b�. Figures 14�c�–14�f� compare the spectrograms of
TABLE IV. PESQ measure at different SNRs. The results are averagedacross the four different noise types used in this study.
Type Clean 20 dB 10 dB 5 dB
GSS 3.718 3.042 2.361 1.928MMSE 4.086 3.060 2.464 2.072logMMSE 4.054 3.133 2.502 2.075NC-MMSE 4.136 3.045 2.440 2.020Hu-Wang 1.402 1.012 0.780 0.625APP 3.002 2.768 2.377 2.059MPO 4.116 2.955 2.331 1.958MPO-APP 3.815 2.994 2.420 2.051
FIG. 14. The efficiency of the MPO method in enhancing the speech signalwhen the background noise is fluctuating is demonstrated. The digit se-quence is “oh three zero six zero two four.” Spectrogram of �a� the cleansignal, �b� the noisy signal, the speech signal enhanced using the �c� GSStechnique, �d� logMMSE technique, �e� Hu-Wang technique, and �f� MPO
technique.mukh et al.: Modified phase-opponency based speech enhancement
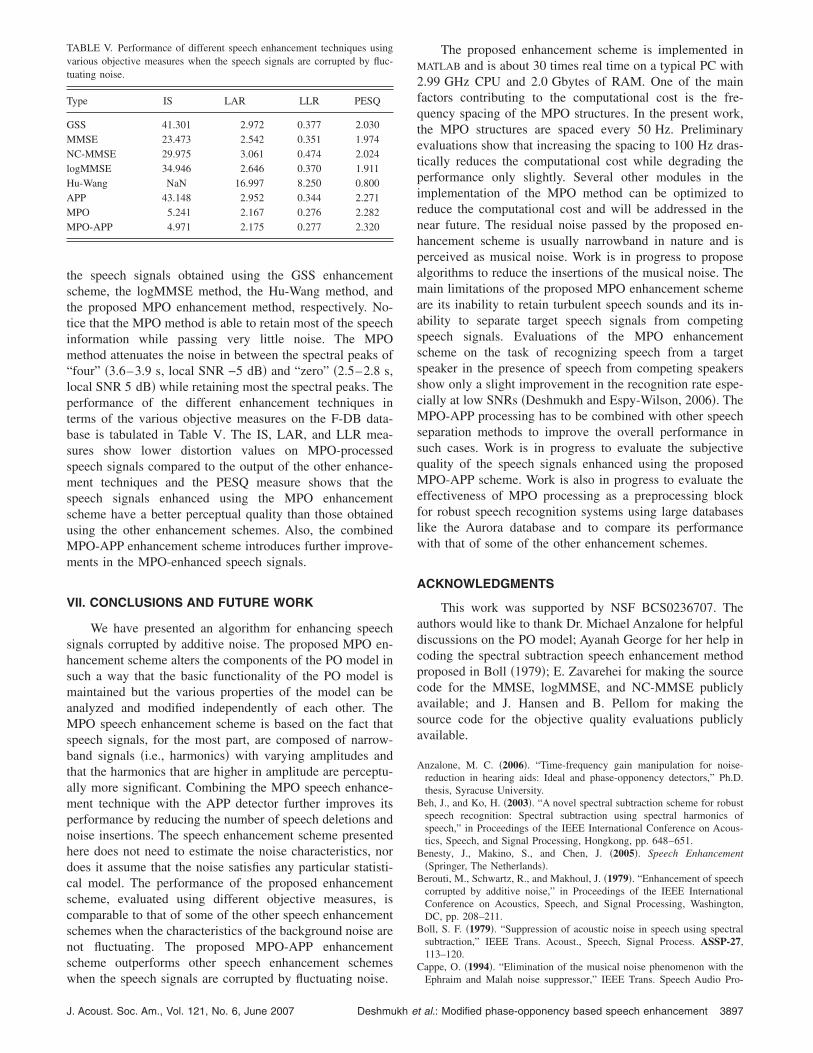
the speech signals obtained using the GSS enhancementscheme, the logMMSE method, the Hu-Wang method, andthe proposed MPO enhancement method, respectively. No-tice that the MPO method is able to retain most of the speechinformation while passing very little noise. The MPOmethod attenuates the noise in between the spectral peaks of“four” �3.6–3.9 s, local SNR −5 dB� and “zero” �2.5–2.8 s,local SNR 5 dB� while retaining most the spectral peaks. Theperformance of the different enhancement techniques interms of the various objective measures on the F-DB data-base is tabulated in Table V. The IS, LAR, and LLR mea-sures show lower distortion values on MPO-processedspeech signals compared to the output of the other enhance-ment techniques and the PESQ measure shows that thespeech signals enhanced using the MPO enhancementscheme have a better perceptual quality than those obtainedusing the other enhancement schemes. Also, the combinedMPO-APP enhancement scheme introduces further improve-ments in the MPO-enhanced speech signals.
VII. CONCLUSIONS AND FUTURE WORK
We have presented an algorithm for enhancing speechsignals corrupted by additive noise. The proposed MPO en-hancement scheme alters the components of the PO model insuch a way that the basic functionality of the PO model ismaintained but the various properties of the model can beanalyzed and modified independently of each other. TheMPO speech enhancement scheme is based on the fact thatspeech signals, for the most part, are composed of narrow-band signals �i.e., harmonics� with varying amplitudes andthat the harmonics that are higher in amplitude are perceptu-ally more significant. Combining the MPO speech enhance-ment technique with the APP detector further improves itsperformance by reducing the number of speech deletions andnoise insertions. The speech enhancement scheme presentedhere does not need to estimate the noise characteristics, nordoes it assume that the noise satisfies any particular statisti-cal model. The performance of the proposed enhancementscheme, evaluated using different objective measures, iscomparable to that of some of the other speech enhancementschemes when the characteristics of the background noise arenot fluctuating. The proposed MPO-APP enhancementscheme outperforms other speech enhancement schemes
TABLE V. Performance of different speech enhancement techniques usingvarious objective measures when the speech signals are corrupted by fluc-tuating noise.
Type IS LAR LLR PESQ
GSS 41.301 2.972 0.377 2.030MMSE 23.473 2.542 0.351 1.974NC-MMSE 29.975 3.061 0.474 2.024logMMSE 34.946 2.646 0.370 1.911Hu-Wang NaN 16.997 8.250 0.800APP 43.148 2.952 0.344 2.271MPO 5.241 2.167 0.276 2.282MPO-APP 4.971 2.175 0.277 2.320
when the speech signals are corrupted by fluctuating noise.
J. Acoust. Soc. Am., Vol. 121, No. 6, June 2007 Deshmukh e
The proposed enhancement scheme is implemented inMATLAB and is about 30 times real time on a typical PC with2.99 GHz CPU and 2.0 Gbytes of RAM. One of the mainfactors contributing to the computational cost is the fre-quency spacing of the MPO structures. In the present work,the MPO structures are spaced every 50 Hz. Preliminaryevaluations show that increasing the spacing to 100 Hz dras-tically reduces the computational cost while degrading theperformance only slightly. Several other modules in theimplementation of the MPO method can be optimized toreduce the computational cost and will be addressed in thenear future. The residual noise passed by the proposed en-hancement scheme is usually narrowband in nature and isperceived as musical noise. Work is in progress to proposealgorithms to reduce the insertions of the musical noise. Themain limitations of the proposed MPO enhancement schemeare its inability to retain turbulent speech sounds and its in-ability to separate target speech signals from competingspeech signals. Evaluations of the MPO enhancementscheme on the task of recognizing speech from a targetspeaker in the presence of speech from competing speakersshow only a slight improvement in the recognition rate espe-cially at low SNRs �Deshmukh and Espy-Wilson, 2006�. TheMPO-APP processing has to be combined with other speechseparation methods to improve the overall performance insuch cases. Work is in progress to evaluate the subjectivequality of the speech signals enhanced using the proposedMPO-APP scheme. Work is also in progress to evaluate theeffectiveness of MPO processing as a preprocessing blockfor robust speech recognition systems using large databaseslike the Aurora database and to compare its performancewith that of some of the other enhancement schemes.
ACKNOWLEDGMENTS
This work was supported by NSF BCS0236707. Theauthors would like to thank Dr. Michael Anzalone for helpfuldiscussions on the PO model; Ayanah George for her help incoding the spectral subtraction speech enhancement methodproposed in Boll �1979�; E. Zavarehei for making the sourcecode for the MMSE, logMMSE, and NC-MMSE publiclyavailable; and J. Hansen and B. Pellom for making thesource code for the objective quality evaluations publiclyavailable.
Anzalone, M. C. �2006�. “Time-frequency gain manipulation for noise-reduction in hearing aids: Ideal and phase-opponency detectors,” Ph.D.thesis, Syracuse University.
Beh, J., and Ko, H. �2003�. “A novel spectral subtraction scheme for robustspeech recognition: Spectral subtraction using spectral harmonics ofspeech,” in Proceedings of the IEEE International Conference on Acous-tics, Speech, and Signal Processing, Hongkong, pp. 648–651.
Benesty, J., Makino, S., and Chen, J. �2005�. Speech Enhancement�Springer, The Netherlands�.
Berouti, M., Schwartz, R., and Makhoul, J. �1979�. “Enhancement of speechcorrupted by additive noise,” in Proceedings of the IEEE InternationalConference on Acoustics, Speech, and Signal Processing, Washington,DC, pp. 208–211.
Boll, S. F. �1979�. “Suppression of acoustic noise in speech using spectralsubtraction,” IEEE Trans. Acoust., Speech, Signal Process. ASSP-27,113–120.
Cappe, O. �1994�. “Elimination of the musical noise phenomenon with the
Ephraim and Malah noise suppressor,” IEEE Trans. Speech Audio Pro-t al.: Modified phase-opponency based speech enhancement 3897

cess. 2, 345–349.Carney, L., Heinz, M. G., Evilsizer, M. E., Gilkey, R. H., and Colburn, H. S.
�2002�. “Auditory phase opponency: A temporal model for masked detec-tion at low frequencies,” Acta Acust. 88, 334–347.
Cheng, Y. M., and O’Shaughnessy, D. �1991�. “Speech enhancement basedconceptually on auditory evidence,” IEEE Trans. Signal Process. 39,1943–1954.
Cohen, I. �2004�. “Speech enhancement using a noncausal a-priori SNRestimator,” IEEE Signal Process. Lett. 11, 725–728.
Compernolle, D. V. �1992�. “DSP techniques for speech enhancement,”ESCA tutorial and research workshop on speech processing in adverseconditions, Cannes, France, pp. 21–30.
Deshmukh, O., and Espy-Wilson, C. �2005�. “Speech enhancement usingauditory phase opponency model,” in Proceedings of the Eurospeech, pp.2117–2120, Lisbon, Portugal.
Deshmukh, O., Espy-Wilson, C., Azalone, M., and Carney, L. �2005a�. “Anoise reduction strategy for speech based on phase-opponency detectors,”in 149th Meeting of the Acoustical Society of America, Vancouver,Canada.
Deshmukh, O. D. �2006�. “Synergy of acoustic phonetics and auditory mod-eling towards robust speech recognition,” Ph.D. thesis, University ofMaryland, College Park, MD.
Deshmukh, O. D., and Espy-Wilson, C. Y. �2006�. “Modified phase op-ponency based solution to the speech separation challenge,” in Interna-tional Conference on Spoken Language Processing, Pittsburgh, PA, pp.101–104.
Deshmukh, O. D., Espy-Wilson, C. Y., Salomon, A., and Singh, J. �2005b�.“Use of temporal information: Detection of periodicity, aperiodicity, andpitch in speech,” IEEE Trans. Speech Audio Process. 13, 776–786.
Ephraim, Y., and Malah, D. �1984�. “Speech enhancement using a minimummean-square error short-time spectral amplitude estimator,” IEEE Trans.Acoust., Speech, Signal Process. 32, 1109–1121.
Ephraim, Y., and Malah, D. �1985�. “Speech enhancement using a minimummean-square log-spectral amplitude estimator,” IEEE Trans. Acoust.,Speech, Signal Process. 33, 443–445.
Gustafsson, H., Nordholm, S. E., and Claesson, I. �2001�. “Spectral subtrac-tion using reduced delay convolution and adaptive averaging,” IEEETrans. Speech Audio Process. 9, 799–807.
3898 J. Acoust. Soc. Am., Vol. 121, No. 6, June 2007 Desh
Hansen, J., and Pellom, B. �1998�. “An effective quality evaluation protocolfor speech enhancements algorithms,” in Proceedings of the IEEE Inter-national Conference on Acoustics, Speech, and Signal Processing, pp.2819–2822.
Hansen, J. H., and Nandkumar, S. �1995�. “Robust estimation of speech innoisy backgrounds based on aspects of the auditory process,” J. Acoust.Soc. Am. 97, 3833–3849.
Hirsch, H. G., and Pearce, D. �2000�. “The AURORA experimental frame-work for the performance evaluations of speech recognition systems undernoisy conditions,” in ISCA ITRW ASR2000 Automatic Speech Recogni-tion: Challenges for the Next Millennium, Paris, France, pp. 18–20.
Hohmann, V. �2002�. “Frequency analysis and synthesis using a gammatonefilterbank,” Acta Acust. 88, 334–347.
Hu, G., and Wang, D. L. �2004�. “Monaural speech separation based onpitch tracking and amplitude modulation,” IEEE Trans. Neural Netw. 15,1135–1150.
Loizou, P. C. �2005�. “Speech enhancement based on perceptually motivatedBayesian estimators of the magnitude spectrum,” IEEE Trans. Speech Au-dio Process. 13, 857–869.
McAulay, R. J., and Malpass, M. L. �1980�. “Speech enhancement using asoft-decision noise suppression filter,” IEEE Trans. Acoust., Speech, Sig-nal Process. ASSP-28, 137–145.
Mesgarani, N., and Shamma, S. A. �2005�. “Speech enhancement based onfiltering the spectrotemporal modulations,” in Proceedings of the IEEEInternational Conference on Acoustics, Speech, and Signal Processing,Philadelphia, PA, pp. 1105–1108.
Rix, A. W., Beerends, J. G., Hollier, M. P., and Hekstra, A. P. �2001�.“Perceptual evaluation of Speech Quality �PESQ�, an objective method forend-to-end speech quality assessment of narrowband telephone networksand speech codecs,” Technical Rep., ITU-T recommendation, P. 862.
Tsoukalas, D. E., Mourjopoulos, J. N., and Kokkinakis, G. �1997�. “Speechenhancement based on audible noise suppression,” IEEE Trans. SpeechAudio Process. 5, 497–514.
Virag, N. �1999�. “Single channel speech enhancement based on maskingproperties of the human auditory system,” IEEE Trans. Speech AudioProcess. 7, 126–137.
Wang, D. L. �2005�. Speech Separation by Humans and Machines, Chap. 12�Kluwer Academic, Norwell, MA�.
mukh et al.: Modified phase-opponency based speech enhancement