Embed Size (px)
Citation preview
Beacon Securities Ltd.| 66 Wellington Street West, Suite 4050, Toronto, Ontario, M5K 1H1 |416.643.3830|www.beaconsecurities.ca
AcuityAds Holdings Inc. (AT – V)
March 06, 2015
Emerging Player In A Fast Growing Market
Company Profile
AcuityAds has developed a programmatic marketing platform that
enables advertisers to manage their purchasing of digital advertising
using real-time bidding. RTB is an auction-based mechanism for
media buyers to bid on advertising at the impression level. RTB
enables media buyers to specify what their goals or outcomes are
and only look for ad inventory that matches against those goals.
Investment Thesis
Our investment thesis is predicated on our positive view of the
continued rapid growth in real-time bidding spending, along with
AcuityAds’ ability to leverage this growth as evidenced by its
impressive revenue and active customers growth profile to date.
Key Investment Highlights
- According to IDC, within the US, real-time bidding spending is
expected to grow from $2B in 2012 to $14.4B in 2017. RTB’s share
of overall digital advertising spending is expected to grow from
14% in 2012 to 41% in 2017. We believe this growth is being driven
by the high ROI associated with RTB’s integration, automation
and optimization of the display ad value chain
- We believe that AcuityAds has been able to successfully
leverage the growth of RTB as evidenced by its 3-year revenue
growth CAGR of 130% (2011 – 2014), the growth of its client base
(~223 in 2014 versus 167 in 2013), and the increasing proportion of
revenues from existing customers.
- In our opinion, key growth levers for the company include
increased productivity amongst its recently expanded sales and
marketing team, further expansion into the US (currently 27% of
revenues), increasing contributions from existing customers,
video/mobile/social, and its self-service SaaS solution.
- In our opinion, RTB competition is intense. As such, we believe this
industry is ripe for consolidation, which could benefit AcuityAds as
a potential takeout candidate given its relatively small size (i.e.
easier to digest) and enviable customer base (with good success
in automotive, telecom and cable companies).
- From a financial perspective, we expect revenue growth of ~35%
for our forecast period with the company hitting EBITDA
breakeven in 2016. We are initiating coverage with a Speculative
Buy rating and $1.60 target, which equates to 1.7x FY16 EV/Sales
(i.e. 37% discount to the group average of 2.8x). In our opinion,
key catalysts, include new customer announcements, an
acceleration in US and self-service-based revenue growth, and
potential new strategic partnerships.
$1.60$0.85
$1.60
88%
YE: Dec FY14E FY15E FY16E
Revenue (M) 13.7 18.0 24.7
EBITDA (M) -4.5 -2.5 0.0
FY14E FY15E FY16E
EV/Sales 1.3x 1.0x 0.7x
EV/EBITDA n/a n/a n/a
20.1
Shares O/S (FD) 20.1
Market Cap (Basic) $17.1
Market Cap (FD) $17.1
Cash $3.1 $0.16/sh
Debt $3.9 $0.20/sh
EV $17.9
Initiating Coverage
Previous Close
12-month Target Price
Potential Return
Estimates (C$)
Valuation
Company Description
Toronto- based AcuityAds has developed a programmatic
marketing platform that enables advertisers to manage their
purchasing of digital advertising using real- time bidding. RTB is an
auction- based mechanism for media buyers to bid on advertising
at the impression level. RTB enables media buyers to specify what
their goals or outcomes are and only look for ad inventory that
matches against throse goals.
Research Team
Speculative Buy
Stock Performance (1 year)
Stock Data (M)
Shares O/S (Basic)
Gabriel Leung 416-507-3963

Who They Are and What Do They Do?
• Toronto-based AcuityAds has developed a programmatic marketing platform that enables
advertisers to manage their purchasing of digital advertising using real-time bidding (“RTB”).
• RTB is an auction-based mechanism for media buyers to bid on advertising at the impression
level, as the ad impression takes place. RTB enables a media buyer to specify exactly what their
goals or outcomes are and look only for ad inventory that matches against those goals.
• By contrast, with direct buys, advertisers essentially buy impressions in bulk.
• The company was founded in 2011 and went public via an RTO with Wildlaw Capital CPC 2 in
July 2014. The company raised gross proceeds of $5.75M at $1.59/sh issuing 3.6M shares from
treasury.
• The company has offices in Canada, the US and its customers include both large Fortune 500
enterprise and small-to-medium sized businesses. The company currently has ~60 employees,
including 20 in sales.
1Gabriel Leung, 416-507-3963

Understanding The Programmatic RTB Industry
• What does “programmatic” mean?
– The term “programmatic” is the umbrella term for automated buying and selling of media.
• What is real-time bidding?
– RTB is a subset of programmatic and is an auction-based mechanism for media buyers to bid on
advertising at the impression level as the ad impression takes place.
• Who are the key players in RTB?
– Demand Side Platforms (e.g. AcuityAds): DSPs enable buyers (i.e. advertisers) to connect directly to
multiple sources of inventory supply and provide such benefits as workflow simplification, integrated
reporting, algorithmic buying optimization and the ability to make impression-level bids.
– Ad Exchanges: Powered marketplaces where ad networks, publishers, advertisers and other sources of
supply and demand meet to buy and sell media in continuous real-time auctions. Examples include
Google Ad Exchange, Microsoft Ad Exchange, AppNexus, etc.
– The Publisher: Provides the source of ad inventory (i.e. the digital spaces in which ads are served). Some
publishers may use Supply Side Platforms, or SSPs, to help better manage and sell their inventory.
2Gabriel Leung, 416-507-3963

How Does RTB Work?
At its most basic form, the RTB process unfolds like this:
• The publisher provides its inventory to an Ad Exchange, who is responsible for holding an auction,during which the DSPs, on behalf of the advertisers, will place a bid on each impression.
• The value of the bid is based on the value of that impression, as determined by the advertiser’sparameters with the DSP. (e.g. consumer profile #, demographics, consumer location, consumerinterests, page content, etc). The bidding process ensures that each impression is sold at the maximumprice, as dictated by real time market demand.
• RTB (for desktop display) leverages cookies, which are information that a website saves to yourcomputer using your web browser. A cookie allows sites to record your browsing activities – like whatpages and content you’ve looked at, when you visited, what you searched for, and whether you clickedon an ad. Data collected by cookies can be combined to create a profile of your online activities.Within mobile advertising, device identities such as indentifierForAdvertising (“IDFA”) for iOS devicesand Advertising ID for Android devices are used.
• Once the bidding is completed, the winner is chosen and the ad is served on the publisher’s website.
To summarize, the advertiser works with a DSP, which allows the advertiser to bid (in real-time) amongstbillions of daily impressions on ad exchanges. Based on a multitude of variables, bids are made forimpressions that have the highest probability of generating a desired action (e.g. signing up for moredetails, making a purchase, accessing a micro-site).
3Gabriel Leung, 416-507-3963

Where Does AcuityAds Fit In?
4Gabriel Leung, 416-507-3963
AcuityAds’ demand side platform enables advertisers to manage their purchasing of digitaladvertising in real-time using real-time bidding (“RTB”). The company purchases impressions foradvertisers through publishers, ad networks and exchanges. The company’s technology platformbenefits advertisers by enabling them to manage their bid amounts, meet specific performancemetrics and achieve consumer targeting goals. Advertisers benefit from AcuityAds algorithms,which help to improve efficiency and they can also optimize their campaigns based on hundreds ofreal-time data metrics (i.e. analytics).
AcuityAds generates revenues by using its programmatic marketing platform to deliver digitaladvertisements to consumers across online display, video, social and mobile channels.
The company offers both:
- Managed services where it provides complete execution of a digital advertising campaign foradvertising agencies and/or brands, and;
- Self-service technology where advertisers can use AcuityAds’ programmatic marketing platformto create and manage their own digital advertising campaigns and collect data and analysis (i.e.software-as-a-service platform).

The Ecosystem
5Gabriel Leung, 416-507-3963
Source: Company filings

How Programmatic Ad Buying Works
6Gabriel Leung, 416-507-3963
Source: Company filings
Automatic transaction between buyer and selling in <50 milliseconds
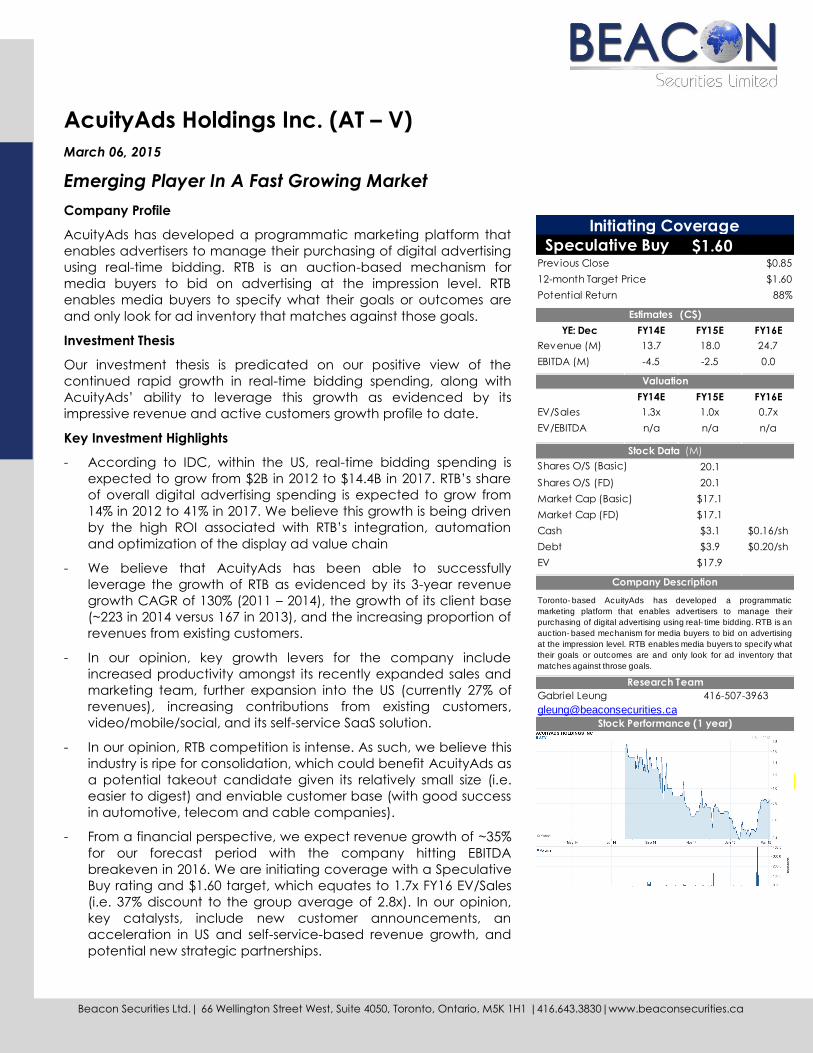
AcuityAds’ Competitive Advantages
7Gabriel Leung, 416-507-3963
Source: Company filings

Key Investment Highlights
8Gabriel Leung, 416-507-3963
• Growing Market Opportunity
• High ROI to Drive Adoption
• Impressive Traction To Date
• Potential Takeout Down the Road

Growing Market Opportunity
9Gabriel Leung, 416-507-3963
• According to research firm IDC, worldwide real-time bidding-based spending will grow from
$2.7B in 2012 to $20.8B in 2017.
• RTB’s share of total combined online and mobile display advertising spending will grow from 8%
to 28% during the same time.
• The US is expected to be the most advanced market. RTB spending is expected to grow from
$2B in 2012 to $14.4B in 2017.
• Within the US, the market share of RTB-based spending of all display ad spending, including
online and mobile display, will almost triple from 14% in 2012 to 41% in 2017.
• Mobile and video advertising are expected to be fast growing sub-sectors with revenue
contributions here growing from $243M in 2013 to $4.7B by 2017 within the US.

Growing Market Opportunity (cont’d)
10Gabriel Leung, 416-507-3963
US Real-Time Bidding ("RTB") Spending Forecast
Source: IDC
1,997
3,137
4,669
6,875
10,056
14,405
87%
57%
49%47%
46%
43%
30%
40%
50%
60%
70%
80%
90%
100%
0
2,000
4,000
6,000
8,000
10,000
12,000
14,000
16,000
2012 2013 2014 2015 2016 2017
RTB Spending Growth Y/Y (RHS)
($00
0)

Growing Market Opportunity (cont’d)
11Gabriel Leung, 416-507-3963
US Real-Time Bidding Spending Via Mobile And Online Video
Source: IDC
243
861
1,875
3,183
4,665
8%
18%
27%
32% 32%
0%
5%
10%
15%
20%
25%
30%
35%
0
1,000
2,000
3,000
4,000
5,000
6,000
2013 2014 2015 2016 2017
Mobile + Video RTB Spending % Of Total RTB Spending (RHS)
($00
0)

High ROI Helping To Drive Adoption
• By automating, integrating and optimizing the way display advertising is being traded and
served, we believe AcuityAd’s RTB programmatic platform allows publishers, advertisers and ad
agencies to improve their overall ROI, which is helping to accelerate adoption.
• To highlight the benefits associated with deploying AcuityAds, we have included case studies
involving Toyota and A&W.
• Toyota wanted to generate awareness of its upcoming sales event and increase traffic to its
showrooms through multimedia (online display, video, mobile and social media). By leveraging
AcuityAds’ programmatic platform, Toyota found:
– Video completion rates were extremely high at 90% (industry stands is 76.95%)
– Viewability reached a weekly high of 63.6% compared to the industry average of 31%.
– 0.00% of ads were delivered to non-human traffic, while the comScore average is 0.05%.
• Acuity helped Toyota achieve a 7.9% brand lift by the end of the campaign.
.
12Gabriel Leung, 416-507-3963

High ROI Helping To Drive Adoption
• Meanwhile, A&W was looking to educate consumers about its “A&W Pure Beef Guarantee”.
However, A&W was unsure as to whether programmatic buying could be effective in
communicating this branding message through digital media.
• AcuityAds elected to use comScore’s Validated Campaign Essentials (vCE) product on this
campaign. The purpose was to validate that the ads served through the Acuity Programmatic
Marketing Platform were delivered in-view, in the right geography, in a brand safe environment
and absent of non-human traffic. In addition, a Brand Survey Lift Pulse (BSL Pulse) study was
conducted to measure the lift in awareness attributed to the online campaign.
• Based on the vCE, Acuity performed strongly on several key measures:
– 99.8% of the impressions were delivered within the specified geographic area (comScore average:
97.8%);
– Only 0.01% of all impressions were served to fraudulent or non-human traffic. This is 5x less than
comScore’s average of 0.05%;
– 0.00% of ads were delivered in unsafe Brand environments (comScore average: 5.29%).
• According to comScore, this campaign saw 85% more lift than the average campaign
13Gabriel Leung, 416-507-3963

Impressive Traction To Date
• In our opinion, given the early stage of the company, the best way to measure its success to
date is via revenue and client growth. As highlighted in the accompanying page, 2014 revenues
(preliminary results have been released) increased 35% to $13.7M. We also understand that
active clients increased to 223 from 167 last year.
• Just as impressive, we would note that growth from existing client is running at ~68% of
revenues, which we believe highlights the high ROI and strong service delivered by the
AcuityAds team (happy customers mean repeat customers).
• Another key point is that AcuityAd’s platform generates data, which can ultimately be used to
improve the efficiency of future campaigns and could act as a competitive differentiator. For
example, based on the outcome of a new car campaign, the company can determine what the
best parameters they should use for future campaigns (i.e. the platform gets smarter over time).
• As it relates to the company’s US business, although it was only 27% of last quarter (i.e. Q3)
revenues, it was up ~240% y/y and, we believe, could be an important near-term growth driver.
Likewise, we would note that the company’s self-service SaaS recurring revenue stream has
grown to $484k in Q3 2014 from $18k in the same period last year.
14Gabriel Leung, 416-507-3963

Impressive Traction To Date (cont’d)
15Gabriel Leung, 416-507-3963
AcuityAds: Active Customer Analysis
Source: Company filings
26
102
167
223
0
50
100
150
200
250
2011 2012 2013 TTM
AcuityAds: Revenue Growth Analysis
Source: Company filings
1.1
5.1
10.2
13.7
18.0
24.7
0
5
10
15
20
25
30
2011 2012 2103 2014e 2015e 2106e
($M
)

Potential Takeout Down The Road
16Gabriel Leung, 416-507-3963
• As is the case with many high growth sectors, particularly within adtech, we believe the market
for programmatic RTB solutions is very competitive, including several vendors such as
RocketFuel (FUEL – Q, NR), MediaMath (private), Chango (private), and advertising agency
desks, amongst others.
• Over time, we believe the high level of competition could lead to gross margin pressures, but
also a potential acceleration in M&A activity.
• Given AcuityAds’ relatively small size, yet enviable customer base and success to date, we
believe the company could find itself a potential takeout target for a larger competitor, agency
trading desk, or direct advertiser looking to acquire AcuityAds’ technology platform, strong
Canadian customer portfolio and domain/industry expertise (notably in automotive and
cable/telecom based on our conversations with customers).

Financial Analysis
17
• AcuityAds generates revenues from two sources: managed services and self-service
technology. With managed services, AcuityAds provides complete execution of a digital
advertising campaign. Revenues are recognized on a gross advertising spending basis. The
associated cost of good is the cost of media buying. We believe gross margins are in the ~50%
range here. Managed services contracts are short-term in nature, with a terms of 30 – 90 days.
• Self-service enable advertisers to use AcuityAds’ programmatic marketing platform to create
and manage their own digital advertising campaigns and collect data and analytics (i.e. think
software-as-a-service type revenues). Revenues are likewise recognized on a grossed up basis,
although gross margins are lower than managed services (we estimate ~35%). Contract terms
are also one year or longer, which provides better revenue visibility.
• The company sells primarily through its direct sales force, which consists of 20 reps.
• The company’s balance sheet currently stands at $3.1M, against $3.9M in debt (due January
2016 at a cost of debt of 17%). The company has tax loss carry-forwards of ~$7M.
• For the 9-months ended Sept. 2014, ~53% of revenues were derived from top 10 customers.
Gabriel Leung, 416-507-3963

Growth Assumptions
• We assume that the company grows revenues annually in the ~35% range for our forecast
period. We’ve assumed managed services growth of ~25% and self-service of ~80%.
• We’ve also modeled gross margins of ~47%, which is down from the 50% range in 2014 due to
the growing proportion of contributions from self-service, which carries a lower margin profile,
but longer contract terms.
• We are forecasting the company to cut its EBITDA loss by half in 2015 (versus 2014) thanks
partially to cost optimization activities from earlier this year. We also expected the company to
breakeven by 2016 due to revenue scaling higher.
• Based on the existing cash balance and our forecasted EBITDA burn, we anticipate the company
will likely require an equity financing in 2015.
• For the purposes of modeling, we have assumed a ~$3M raise in mid-2015 (at a 15% discount
to current prices). We have not factored contributions from acquisitions, although we believe the
company could be targeting companies that add scale or additional products to its technology
stack.
18Gabriel Leung, 416-507-3963

Initiating Coverage with A Speculative Buy Rating
• As highlighted by the list of comparable adtech-related companies in the next page, we derive
an average EV/Sales (FY+1) multiple of 2.8x against a 2-year revenue CAGR of 22%.
• By contrast, AcuityAds is currently trading at 0.7x EV/Sales against a 2-year revenue CAGR of
34%.
• In our opinion, AcuityAds’ valuation could start to expand as it moves closer to EBITDA
profitability.
• Applying a 1.7x EV/Sales multiple to our 2016E forecast for AcuityAds (i.e. 37% discount to the
group to reflect its smaller scale and EBITDA loss position), we derive a $1.60 target price. For
the purposes of our enterprise value calculation, we’ve applied our 2016 ending net cash
balance of $60k and $3.9M in debt, and shares outstanding of 24.4M (which includes a $3M
equity financing in mid-2015 at $0.70/sh).
• Given the ~86% potential rate of return, we are initiating coverage with a Speculative Buy rating.
19Gabriel Leung, 416-507-3963

Comparable Company Valuation Analysis
20Gabriel Leung, 416-507-3963
Market 2-Year
Ticker S/O (M) Cap ($M) Currency FY - 1 FY1 FY + 1 Sales CAGR FY - 1 FY1 FY + 1 FY -1 FY1 FY + 1
Comps
Google GOOG-US 341 195,995 USD 2.6 x 2.3 x 1.9 x 16% 5.3 x 4.6 x 4.0 x 49% 48% 48%
Facebook FB-US 2,236 181,613 USD 13.7 x 10.0 x 7.6 x 35% 20.8 x 16.4 x 12.5 x 66% 61% 61%
Yahoo! YHOO-US 936 41,339 USD 7.9 x 8.0 x 7.9 x 0% 25.5 x 30.3 x 29.1 x 31% 26% 27%
Rocket Fuel FUEL-US 41 426 USD 1.0 x 0.7 x 0.6 x 27% -402.5 x -130.7 x 22.2 x 0% -1% 3%
Rubicon Project RUBI-US 37 711 USD 4.9 x 3.5 x 2.7 x 35% 32.2 x 29.3 x 16.5 x 15% 12% 16%
Marketo MKTO-US 41 1,112 USD 6.7 x 4.9 x 3.7 x 34% -53.1 x -40.7 x -80.1 x -13% -12% -5%
Constant Contact CTCT-US 32 1,379 USD 3.7 x 3.1 x 2.7 x 17% 20.1 x 16.1 x 12.7 x 18% 19% 21%
Millennial Media MM-US 139 223 USD 0.6 x 0.5 x 0.4 x 13% 16.3 x -6.2 x n/a 3% -8% n/a
Marin Software MRIN-US 37 246 USD 1.8 x 1.6 x 1.3 x 17% -10.8 x -16.2 x -40.0 x -17% -10% -3%
Tremor Video TRMR-US 51 132 USD 0.3 x 0.3 x 0.2 x 21% -4.9 x -8.1 x 32.7 x -7% -3% 1%
YuMe YUME-US 33 192 USD 0.7 x 0.6 x 0.6 x 14% 71.3 x 60.7 x 12.0 x 1% 1% 5%
Criteo CRTO-US 59 2,585 USD 6.1 x 4.6 x 3.6 x 31% 23.4 x 17.9 x 12.1 x 26% 26% 29%
Global Average 4.2 x 3.3 x 2.8 x 22% -21.4 x -2.2 x 3.1 x 14% 13% 18%
Global Median 3.1 x 2.7 x 2.3 x 19% 18.2 x 10.4 x 12.5 x 9% 6% 16%
AcuityAds AT-CA 20 18 CAD 1.3 x 1.0 x 0.7 x 34% -3.8 x -7.5 x 575.1 x -36% -14% 0%
AcuityAds Comparable Group Valuation Analysis
Source: Company filings, FactSet, Beacon Securities
EV/Sales EV/EBITDA EBITDA margins

Management Team
21Gabriel Leung, 416-507-3963

Experienced Board of Directors
22Gabriel Leung, 416-507-3963
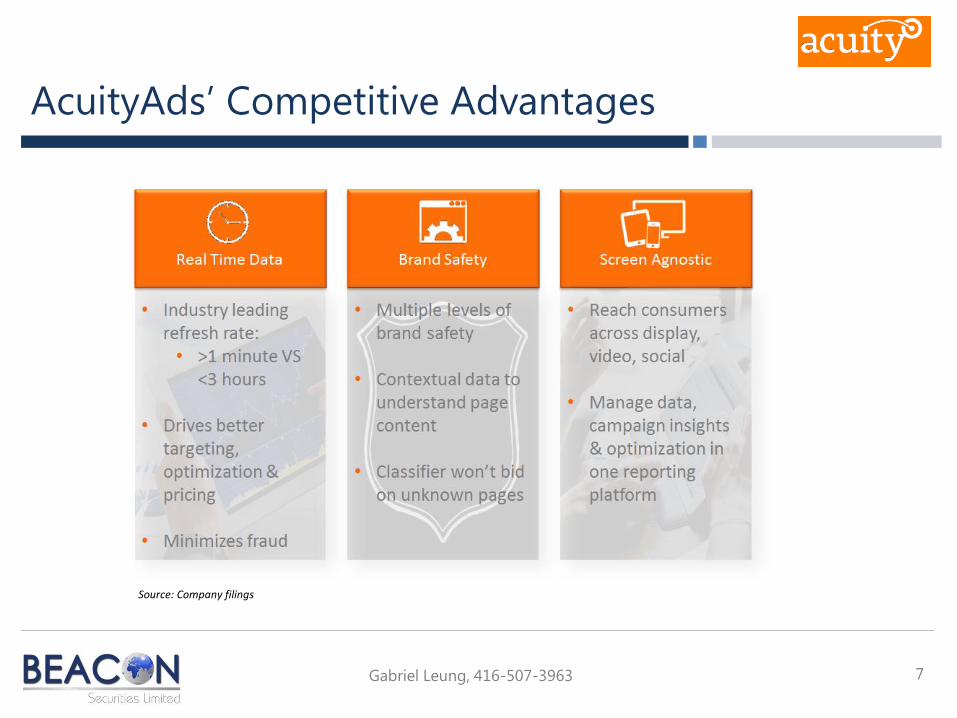
Capital Structure
23Gabriel Leung, 416-507-3963
Shares outstanding - Basic 20,756,265
Options 1,140,888 Average price $1.37
Fully diluted shares outstanding 21,897,153
Insider Ownership 78%
Institutional Ownership 15%
AcuityAds: Capital Structure
Source: Company filings

Risks To Our Analysis
• This is a relatively small company in ramp up mode with limited financial resources. As such, a
slower than expected pick up in adoption of the company’s RTB platform could constrain the
company’s financial resources. Based on our growth projections, we anticipate AcuityAds could
require additional financing over the near-term, which creates potential financing/dilution risks.
• AcuityAds uses “cookies” (small text files) in connection with its Programmatic Marketing
Platform. Without cookie data, Acuity may bid on advertising without as much insight into
activity that has taken place through an Internet user’s browser thereby undermining the
effectiveness of AcuityAd’s Programmatic Marketing Platform. Cookies may easily be deleted or
blocked by Internet users. In addition, some Internet browsers block third party cookies by
default, and other Internet browsers may implement similar features in the future. Certain
international jurisdictions have adopted and implemented legislation that negatively impacts the
use of cookies for online advertising, and additional jurisdictions may do so in the future.
24Gabriel Leung, 416-507-3963

Risks To Our Analysis
• If a “Do Not Track” browser setting is adopted by many internet users, and the standard either
imposed by legislation or agreed upon by standard setting groups, prohibits AcuityAds from
using non-personal information as it currently does, then that could hinder growth of
advertising and content production on the web generally, cause AcuityAds to change its
business practices, and adversely affect its business.
• This is a competitive market and includes both direct competitors such as Rocket Fuel,
MediaMath, and Chango, and also indirect competitors in the form of media agency trading
desks. We believe the high level of competition could put pressure on AcuityAds’ gross margin
profile over time, but also increase the probability of consolidation activity (with AcuityAds’ being
a potential target).
25Gabriel Leung, 416-507-3963

March 5, 2015 | Page 26 Gabriel Leung | 416-507-3963 | [email protected]
AcuityAds Holdings Inc.
AcuityAds Income Statement
2011 2012 2013 Q1 2014 Q2 2014 Q3 2014 Q4 2014e 2014e 2015e 2016e
(C$) Dec-11 Dec-12 31-Dec-13 31-Mar-14 30-Jun-14 30-Sep-14 31-Dec-14 31-Dec-14 31-Dec-15 31-Dec-16
Revenues:
Managed Services 9,971,207 2,619,108 2,889,041 2,806,179 3,700,000 12,014,328 15,199,569 19,151,457
Growth q/q 10.3% -2.9% 31.9%
Growth y/y 18.3% 7.2% 32.0% 26.0% 20.5% 26.5% 26.0%
Self-service technology 185,177 157,709 300,996 483,651 700,000 1,642,356 2,850,000 5,500,000
Growth q/q 90.9% 60.7% 44.7%
Growth y/y n/a 225.3% 2640.1% 833.3% 786.9% 73.5% 93.0%
Total revenues 1,116,716 5,074,364 10,156,384 2,776,817 3,190,037 3,289,830 4,400,000 13,656,684 18,049,569 24,651,457
Growth q/q 14.9% 3.1% 33.7%
Growth y/y 354.4% 100.2% 25.4% 14.4% 53.5% 46.1% 34.5% 32.2% 36.6%
Media costs 681,390 2,453,693 4,259,422 1,315,094 1,655,606 1,578,715 2,305,000 6,854,415 9,604,280 13,342,243
% of revenues 61.0% 48.4% 41.9% 47.4% 51.9% 48.0% 52.4% 50.2% 53.2% 54.1%
Gross profit 435,326 2,620,671 5,896,962 1,461,723 1,534,431 1,711,115 2,095,000 6,802,269 8,445,289 11,309,214
Gross margins 39.0% 51.6% 58.1% 52.6% 48.1% 52.0% 47.6% 49.8% 46.8% 45.9%
Operating expenses:
Employee compensation and benefits 274,930 1,330,022 3,308,319 1,278,136 2,460,455 2,364,557 2,420,000 8,523,148 8,388,218 8,628,010
% of revenues 24.6% 26.2% 32.6% 46.0% 77.1% 71.9% 55.0% 62.4% 46.5% 35.0%
G&A 638,306 1,671,557 2,038,728 590,051 1,266,056 869,079 893,200 3,618,386 3,363,807 3,500,507
% of revenues 57.2% 32.9% 20.1% 21.2% 39.7% 26.4% 20.3% 26.5% 18.6% 14.2%
Listing expense 0 0 0 0 0 352,253 0 352,253 0 0
Depreciation 2,004 14,262 88,539 36,293 52,569 65,969 65,969 220,800 263,876 263,876
Total expenses 915,240 3,015,841 5,435,586 1,904,480 3,779,080 3,651,858 3,379,169 12,714,587 12,015,902 12,392,393
Operating income -479,914 -395,170 461,376 -442,757 -2,244,649 -1,940,743 -1,284,169 -5,912,318 -3,570,613 -1,083,179
Operating margins -43.0% -7.8% 4.5% -15.9% -70.4% -59.0% -29.2% -43.3% -19.8% -4.4%
EBITDA -376,849 -284,687 741,199 -383,576 -2,160,928 -1,309,488 -1,005,167 -4,859,159 -2,454,605 32,829
EBITDA margins -33.7% -5.6% 7.3% -13.8% -67.7% -39.8% -22.8% -35.6% -13.6% 0.1%
Finance income 0 0 0 0 0 -12,579 0 -12,579 0 0
Finance costs 81,111 227,832 516,276 214,133 180,316 191,386 191,386 777,221 765,544 765,544
Foreign exchange (gain) loss 14,744 -23,606 42,884 68,760 -35,725 63,181 0 96,216 0 0
95,855 204,226 559,160 282,893 144,591 241,988 191,386 860,858 765,544 765,544
Income before taxes -575,769 -599,396 -97,784 -725,650 -2,389,240 -2,182,731 -1,475,555 -6,773,176 -4,336,157 -1,848,723
Income taxes 0 0 0 8,386 2,885 0 0 11,271 0 0
Income tax rate 0.0% 0.0% 0.0% -1.2% -0.1% 0.0% 0.0% -0.2% 0.0% 0.0%
Net income -575,769 -599,396 -97,784 -734,036 -2,392,125 -2,182,731 -1,475,555 -6,784,447 -4,336,157 -1,848,723
Net margins -51.6% -11.8% -1.0% -26.4% -75.0% -66.3% -33.5% -49.7% -24.0% -7.5%
EPS:
Basic -0.04 -0.04 -0.01 -0.04 -0.14 -0.11 -0.07 -0.37 -0.19 -0.08
FD -0.04 -0.04 -0.01 -0.04 -0.14 -0.11 -0.07 -0.37 -0.19 -0.08
Shares outstanding:
Basic 15,384,615 15,384,615 15,820,766 16,834,760 16,834,760 20,096,619 20,096,619 18,465,689 22,239,476 24,382,333
FD 15,384,615 15,384,615 15,820,766 16,834,760 16,834,760 20,096,619 20,096,619 18,465,689 22,239,476 24,382,333
Source: Company filings, Beacon Securities

March 5, 2015 | Page 27 Gabriel Leung | 416-507-3963 | [email protected]
AcuityAds Holdings Inc.
2011 2012 2013 Q1 2014 Q2 2014 Q3 2014
(C$) Dec-11 Dec-12 31-Dec-13 31-Mar-14 30-Jun-14 30-Sep-14
Assets:
Current assets:
Cash and cash equivalents 0 60,498 120,467 446,034 139,912 3,117,550
Accounts receivable 623,563 1,932,653 3,057,764 3,221,932 3,209,223 3,220,291
Other current assets 5,879 33,668 178,105 270,050 552,061 281,347
Investment tax credits receivable 276,067 491,764 1,091,764 1,191,764 450,000 450,000
Total current assets 905,509 2,518,583 4,448,100 5,129,780 4,351,196 7,069,188
Non-current assets:
Property and equipment 11,358 72,451 436,232 491,840 652,717 729,766
Total assets 916,867 2,591,034 4,884,332 5,621,620 5,003,913 7,798,954
Liabilities:
Current
Bank indebtedness 93,379
Accounts payable and accrued liabilities 683,968 3,191,664 2,359,827 2,444,518 3,720,350 3,666,202
Promissory notes payable 0 0 2,913,133 3,912,797 0 0
Due to related parties 1,085,829 848,854 616,657
Current portion of obligations under capital lease 27,507 91,542 132,700
Total current liabilities 1,863,176 4,040,518 5,272,960 6,384,822 4,428,549 3,798,902
Non-current liabilities:
Promissory notes payable 3,925,255 3,937,711
Due to related parties 608,249 626,500 0 0
Obligations under capital notes 51,681 155,407 218,601
Repayable government grant 150,000 150,000
Total liabilities 1,863,176 4,040,518 5,881,209 7,063,003 8,659,211 8,105,214
Shareholders' deficiency -946,309 -1,449,484 -996,877 -1,441,383 -3,655,298 -306,260
Total liabilites and shareholder equity 916,867 2,591,034 4,884,332 5,621,620 5,003,913 7,798,954
AcuityAds Balance Sheet
Source: Company filings, Beacon Securities

March 5, 2015 | Page 28 Gabriel Leung | 416-507-3963 | [email protected]
AcuityAds Holdings Inc.
2011 2012 2013 Q1 2014 Q2 2014 Q3 2014
(C$) Dec-11 Dec-12 31-Dec-13 31-Mar-14 30-Jun-14 30-Sep-14
Cash flows from (used in) operating activities:
Loss for the year -575,769 -599,396 -97,784 -732,244 -2,393,917 -2,198,727
Adjustments
Depreciation of property and equipment 2,004 14,262 88,539 36,293 52,569 65,969
Finance costs 81,111 227,832 516,276 214,133 180,316 191,387
Finance income -12,579
Share-based compensation 101,061 96,221 191,284 22,888 31,152 213,033
Reverse takeover consideration included in listing expense 205,174
Change in non-cash operating working capital:
Accounts receivable -591,147 -1,309,090 -1,125,111 -164,166 12,707 -11,068
Other current assets -5,879 -27,789 -144,437 -91,945 -282,011 270,714
Investments tax credits receivable -259,741 -215,697 -600,000 -100,000 741,764 0
Accounts payable and accrued liabilities 509,072 2,507,697 -831,838 83,898 1,274,196 -51,719
-163,519 1,293,436 -1,905,287 1,101 2,010,693 870,911
Interest paid -19,456 -118,808 -410,827 -179,434 -175,663 -168,781
Operating cash flow -758,744 575,232 -2,413,898 -910,577 -558,887 -1,496,597
Cash used in investing activities:
Additions to property and equipment -13,362 -75,355 -452,320 -12,713 -28,810 -15,317
Investing cash flow -13,362 -75,355 -452,320 -12,713 -28,810 -15,317
Cash flows from (used in) financing activities:
Net proceeds from promissary notes, net of issuance costs 2,891,416 984,007 2 -2
Proceeds (repayments) of amounts due to related parties, net 685,100 -346,000 -324,336 -400 -616,657
Repayment of capital leases -16,877 -23,347
Proceeds from private placement, net of issue costs 5,124,558
Proceeds from the issuance of common shares and warrants 900 250,022 250,000 -250,000 0
Proceeds from the exercise of stock options 109,885 14,850 148,850 5,000
Proceeds from the exercise of warrants 250,000 0
Proceeds related to repayable government grant 150,000 0
Dividends paid -800 0
Financing cash flow 686,000 -346,000 2,926,187 1,248,857 281,575 4,489,552
Changes in cash -86,106 153,877 59,969 325,567 -306,122 2,977,638
Cash, beginning of year -7,273 -93,379 60,498 120,467 446,034 139,912
Cash, end of year -93,379 60,498 120,467 446,034 139,912 3,117,550
Source: Company filings, Beacon Securities
AcuityAds Cash Flow Statement

Beacon Securities Ltd.| 66 Wellington Street West, Suite 4050, Toronto, Ontario, M5K 1H1 |416.643.3830|www.beaconsecurities.ca
Disclosure Requirements
Does Beacon, or its affiliates or analysts collectively, beneficially own 1% or more of any class of the issuer's equity securities? Yes No
Does the analyst who prepared this research report have a position, either long or short, in any of the issuer’s securities? Yes No
Does Beacon Securities beneficially own more than 1% of equity securities of the issuer? Yes No
Has any director, partner, or officer of Beacon Securities, or the analyst involved in the preparation of the research report, received remuneration for
any services provided to the securities issuer during the preceding 12 months?
Yes No
Has Beacon Securities performed investment banking services in the past 12 months and received compensation for investment banking services for
this issuer in the past 12 months? Yes No
Was the analyst who prepared this research report compensated from revenues generated solely by the Beacon Securities Investment Banking
Department? Yes No
Does any director, officer, or employee of Beacon Securities serve as a director, officer, or in any advisory capacity to the issuer? Yes No
Are there any material conflicts of interest with Beacon Securities or the analyst who prepared the report and the issuer? Yes No
Is Beacon Securities a market maker in the equity of the issuer? Yes No
Has the analyst visited the head office of the issuer and viewed its operations in a limited context? Yes No
Did the issuer pay for or reimburse the analyst for the travel expenses? Yes No
All information contained herein has been collected and compiled by Beacon Securities Limited, an independently owned and operated member of
the IIROC. All facts and statistical data have been obtained or ascertained from sources, which we believe to be reliable, but are not warranted as
accurate or complete.
All projections and estimates are the expressed opinion of Beacon Securities Limited, and are subject to change without notice. Beacon Securities
Limited takes no responsibility for any errors or omissions contained herein, and accepts no legal responsibility from any losses resulting from investment
decisions based on the content of this report.
This report is provided for informational purposes only and does not constitute an offer or solicitation to buy or sell securities discussed herein. Based on
their volatility, income structure, or eligibility for sale, the securities mentioned herein may not be suitable or available for all investors in all countries.
Dissemination
Beacon Securities distributes its research products simultaneously, via email, to its authorized client base. All research is then available on
www.beaconsecurities.ca via login and password.
Analyst Certification
The Beacon Securities Analyst named on the report hereby certifies that the recommendations and/or opinions expressed herein accurately
reflect such research analyst’s personal views about the company and securities that are the subject of the report; or any other companies
mentioned in the report that are also covered by the named analyst. In addition, no part of the research analyst’s compensation is, or will
be, directly or indirectly, related to the specific recommendations or views expressed by such research analyst in this report.


![6-6 Modeling Real-World Data with Sinusoidal Functions · Model 2: Graphing Calculator y 1.60 sin (0.51t 1.60) 12.12 y 1.60 sin [0.51(9.5) 1.60] 12.12 y 11.95484295 On September 30,](https://img.dokumen.tips/doc/110x75/5f20dbf37a97cc6aa36f9307/6-6-modeling-real-world-data-with-sinusoidal-functions-model-2-graphing-calculator.jpg)