Embed Size (px)
Citation preview
SPECULATIONS ON THE MOVEMENT OF POLLUTED AIR TO THE ARCTIC?
TOBY N. CARLSON
Department of Meteorology, The Pennsylvania State University, University Park, PA 16802, U.S.A.
Abstract-Using arguments based on the idea that the motion of air parcels is adiabatic except for an adjustment for diabatic (radiationaf) cooling, we are led to the hypothesis that the arctic aerosol comes from regions north of the polar front, primarily over the Eurasian Continent during wintertime.
1. INTRODUCTION
Large amounts of aerosol have been found over the Arctic during the winter months. The aerosol is charac- terized by constituents such as vanadium, manganese, sulfate and lead which are thought to beanthropogenic in origin (Rahn and McCaffrey, 1980). Most of the time the aerosol appears to be confined to the lowest l-3 km elevation but at least light amounts have been observed as high as SOOmb or above on some occasions. Although few measurements of the vertical stratification of the aerosol exist, observations suggest that the maximum concentrations occur above the surface but below 3 km (Pepin et al., 1980) and that the aerosol may be concentrated either in multiple shallow layers or spread into a single band (Rahn et al., 1977). Curiously, the air is often clear in the lowest 0.5-1.0 km.
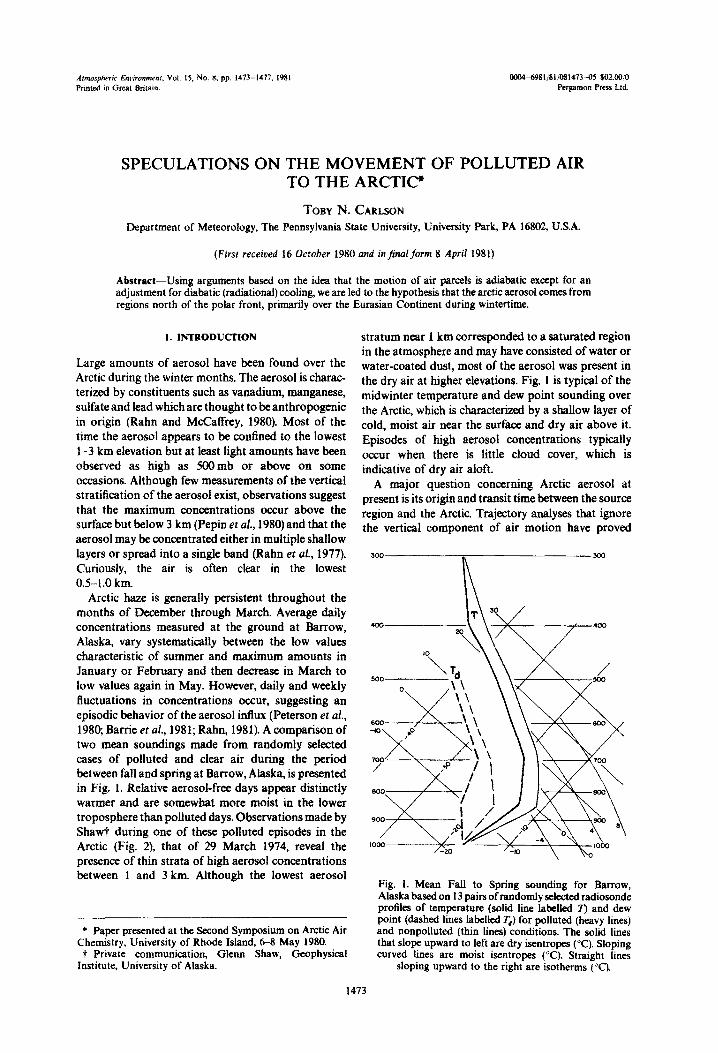
Arctic haze is generally persistent throughout the months of December through March. Average daily con~ntrations measured at the ground at Barrow, Alaska, vary systemati~iiy between the low values characteristic of summer and maximum amounts in January or February and then decrease in March to low values again in May. However, daily and weekly fluctuations in concentrations occur, suggesting an episodic behavior of the aerosol influx (Peterson et al., 1980; Barrie et al., 1981; Rahn, 1981). A comparison of two mean soundings made from randomly selected cases of polluted and clear air during the period between fall and spring at Barrow, Alaska, is presented in Fig. 1. Relative aerosol-free days appear distinctly warmer and are somewhat more moist in the lower troposphere than polluted days. Observations made by Shawt during one of these polluted episodes in the Arctic (Fig. 2), that of 29 March 1974, reveal the presence of thin strata of high aerosol concentrations between 1 and 3 km. Although the lowest aerosol
* Paper presented at the Second Symposium on Arctic Air Chemistry, University of Rhode Island, 6-8 May 1980.
t Private communication, Glenn Shaw, Geophysical Institute, University of Alaska.
stratum near 1 km corresponded to a saturated region in the atmosphere and may have consisted of water or water-coated dust, most of the aerosol was present in the dry air at higher elevations. Fig. 1 is typical of the midwinter temperature and dew point sounding over the Arctic, which is characterized by a shallow layer of cold, moist air near the surface and dry air above it. Episodes of high aerosol con~ntrations typically occur when there is little cloud cover, which is indicative of dry air aloft.
A major question concerning Arctic aerosol at present is its origin and transit time between the source region and the Arctic. Trajectory analyses that ignore the vertical component of air motion have proved
Fig. 1. Mean Fall to Spring sounding for Barrow, Alaska based on 13 pairs of randomly selected radiosonde profiles of temperature (solid line labelled 7J and dew point (dashed lines labelled q) for polluted (heavy lines) and nonpolluted (thin lines) conditions. The solid lines that slope upward to left are dry isentropes (“C). Sloping curved lines are moist isentropes (“C). Straight lines
sloping upward to the right are isotherms (“C).
1473
1474 TOBY N. CARLSON
inconclusive because kinematic constraints and lack of data often make it difficult, if not impossible, to define the paths of the airstreams. For instance, it is not apparent what levels should be chosen for determining a representative set of trajectories, because there is considerable vertical wind shear in the lower troposphere. The presence of thin aerosol strata, such as illustrated in Fig. 2, implies that air of widely differing origins exists in very close proximity in the vertical. Moreover, air does not remain at a given elevation during its migration from one place to another, but ascends or descends according to dynamic factors governing the atmospheric motions.
For these reasons it has been impossible to de- termine with certainty which, if any, of the three major source regions for the aerosol proposed by Rahn and McCaffrey (1980), i.e. the Northeastern United States, Europe or Central and Western Asia, are the correct ones. It is also not evident whether the transit time for the aerosol to move from source to Arctic is long or short, although the best estimate, according to Rahn,* seems to lie between one and two weeks.
It is the purpose of this paper to make some general deductions concerning the source regions and transit time for the aerosol. For the purpose of discussion, we will assume initially that the motion of an air parcel is approximately adiabatic and, therefore, the potential temperature is approximately conserved following the parcel’s trajectory, a condition that holds provided that turbulent mixing and radiative cooling are re- latively unimportant following the motion of the air between its source region and Arctic.+
2. ISENTROPIC CROSS SECTIONS
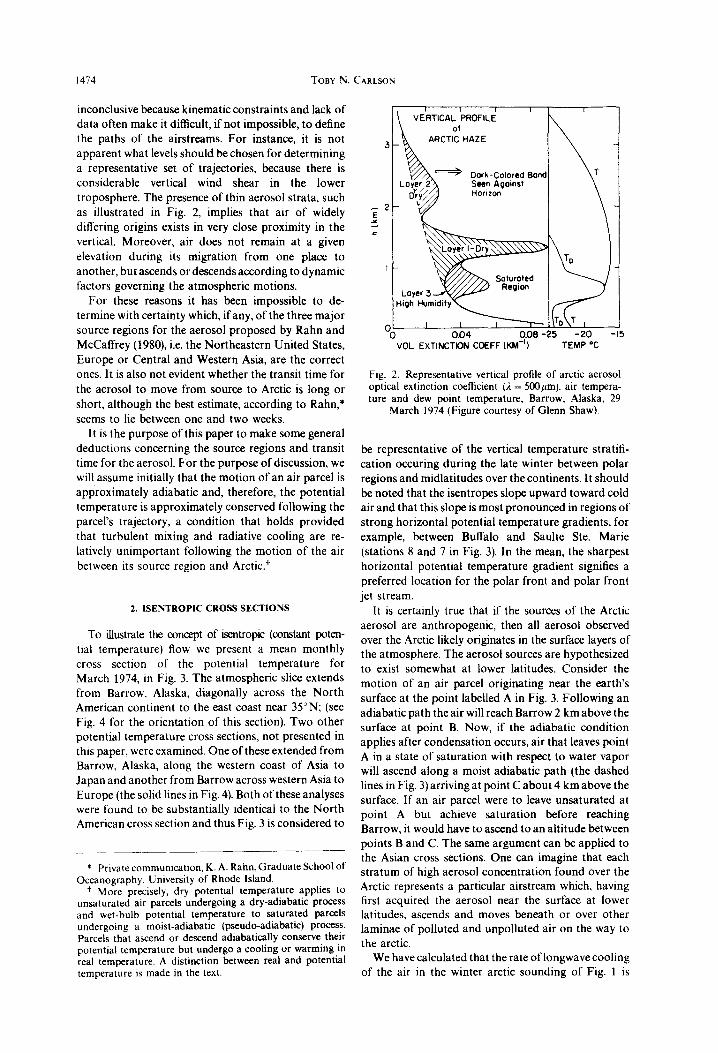
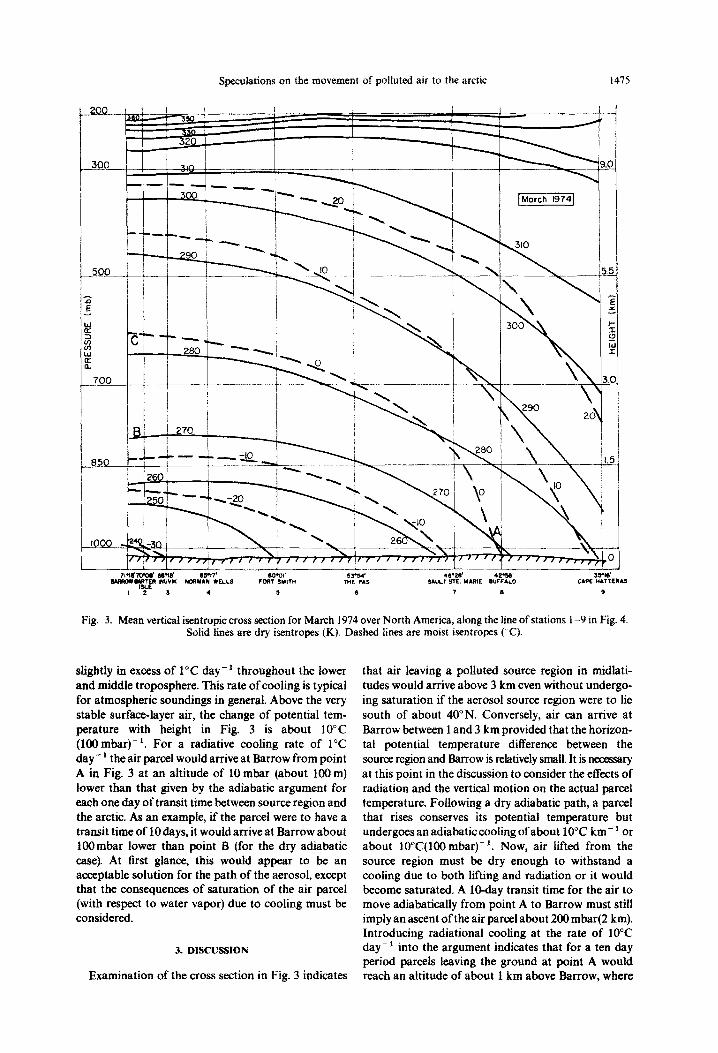
To illustrate the concept of isentropic (constant poten- tial temperature) flow we present a mean monthly cross section of the potential temperature for March 1974, in Fig. 3. The atmospheric slice extends from Barrow, Alaska, diagonally across the North American continent to the east coast near 35”N; (see Fig. 4 for the orientation of this section). Two other potential temperature cross sections, not presented in this paper, were examined. One of these extended from Barrow, Alaska, along the western coast of Asia to Japan and another from Barrow across western Asia to Europe (the solid lines in Fig. 4). Both of these analyses were found to be substantially identical to the North American cross section and thus Fig. 3 is considered to
* Private communication, K. A. Rahn, Graduate School of Oceanography, University of Rhode Island.
t More precisely, dry potential temperature applies to unsaturated air parcels undergoing a dry-adiabatic process and wet-bulb potential temperature to saturated parcels undergoing a moist-adiabatic (pseudo-adiabatic) process. Parcels that ascend or descend adiabatically conserve their potential temperature but undergo a cooling or warming in real temperature. A distinction between real and potential temperature is made in the text.
I\ , I I 1 I
VERTICAL PROFILE
3 ARCTIC HAZE
Dark-Colored Bond
I
0 0 0.04 0.08 -25 -20 .
VOL EXTlNCTlON COEFF (KM-‘) TEMP “C
Fig. 2. Representative vertical profile of arctic aerosol optical extinction coefficient (i = 5OOpm), air tempera- ture and dew point temperature, Barrow, Alaska, 29
March 1974 (Figure courtesy of Glenn Shaw).
be representative of the vertical temperature stratifi- cation occuring during the late winter between polar regions and midlatitudes over the continents. It should be noted that the isentropes slope upward toward cold air and that this slope is most pronounced in regions of strong horizontal potential temperature gradients, for example, between Buffalo and Saulte Ste. Marie (stations 8 and 7 in Fig. 3). In the mean, the sharpest horizontal potential temperature gradient signifies a preferred location for the polar front and polar front jet stream.
It is certainly true that if the sources of the Arctic aerosol are anthropogenic, then all aerosol observed over the Arctic likely originates in the surface layers of the atmosphere. The aerosol sources are hypothesized to exist somewhat at lower latitudes. Consider the motion of an air parcel originating near the earth’s surface at the point labelled A in Fig. 3. Following an adiabatic path the air will reach Barrow 2 km above the surface at point B. Now, if the adiabatic condition applies after condensation occurs, air that leaves point A in a state of saturation with respect to water vapor will ascend along a moist adiabatic path (the dashed lines in Fig. 3)arriving at point C about 4 km above the surface. If an air parcel were to leave unsaturated at point A but achieve saturation before reaching Barrow, it would have to ascend to an altitude between points B and C. The same argument can be applied to the Asian cross sections. One can imagine that each stratum of high aerosol concentration found over the Arctic represents a particular airstream which, having first acquired the aerosol near the surface at lower latitudes, ascends and moves beneath or over other laminae of polluted and unpolluted air on the way to the arctic.
We have calculated that the rate of longwave cooling of the air in the winter arctic sounding of Fig. 1 is
Speculations on the movement of polluted air to the arctic 1475
Fig. 3. Mean vertical isentropic cross section for March 1974 over North America, aiong the line of stations i-9 in Fig. 4. Solid lines are dry kentropes (K). Dashed lines are moist isentropes ( C).
slightly in excess of 1°C day-’ throughout the lower and middle troposphere. This rate of cooling is typical for atmospheric soundings in general. Above the very stable surface-layer air, the change of potential tem- perature with height in Fig. 3 is about 10°C (lOOmbar)-‘. For a radiative cooling rate of 1°C day- * theair parcel would arrive at Barrow from point A in Fig. 3 at an altitude of 10 mbar (about 100 m) lower than that given by the adiabatic argument for each one day of transit time between source region and the arctic. As an example, if the parcel were to have a transit time of 10 days, it would arrive at Barrow about lOOmbar lower than point B (for the dry adiabatic case). At first glance, this would appear to be an acceptable solution for the path of the aerosol, except that the consequences of saturation of the air parcel (with respect to water vapor) due to cooling must be considered.
3. DlSCUSSlON
Examination of the cross section in Fig. 3 indicates
that air leaving a polluted source region in midlati- tudes would arrive above 3 km even without undergo- ing saturation if the aerosol source region were to lie south of about 40”N. Conversely, air can arrive at Barrow between 1 and 3 km provided that the horizon- tal potential temperature difference between the source region and Barrow is relatively small. It is neassary at this point in the discussion to consider the effects of radiation and the vertical motion on the actual parcel temperature. Following a dry adiabatic path, a parcel that rises conserves its potential temperature but undergoes an adiabatic cooling of about 10°C km- ’ or about 10”C(1OOmbar)-‘. Now, air lifted from the source region must be dry enough to withstand a cooling due to both lifting and radiation or it would become saturated. A lO-day transit time for the air to move adiabatically from point A to Barrow must still imply an ascent of the air parcel about 200 mbar(2 km). Introducing radiational cooling at the rate of 10°C day-’ into the argument indicates that for a ten day period parcels leaving the ground at point A would reach an altitude of about 1 km above Barrow, where
I476 TOW N. CARLSON
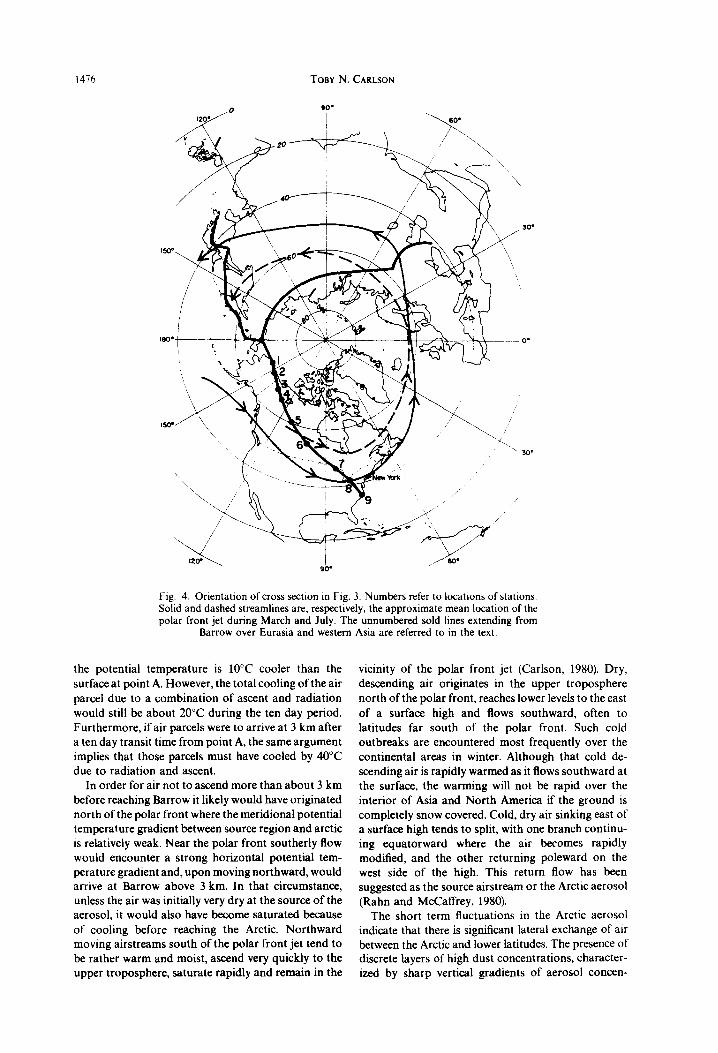
Fig. 4. Orientation of cross sectlon in Fig. 3. Numbers refer to locations of stations. Solid and dashed streamlines are. respectively, the approximate mean location of the polar front jet during March and July. The unnumbered sold lines extending from
Barrow over Eurasia and western Asia are referred to in the text.
the potential temperature is 10°C cooler than the surface at point A. However, the total cooling of the air parcel due to a combination of ascent and radiation would still be about 20°C during the ten day period. Furthermore, if air parcels were to arrive at 3 km after a ten day transit time from point A, the same argument implies that those parcels must have cocled by 40°C due to radiation and ascent.
In order for air not to ascend more than about 3 km before reaching Barrow it likely would have originated north of the polar front where the meridional potential temperature gradient between source region and arctic is relatively weak. Near the polar front southerly flow would encounter a strong horizontal potential tem- perature gradient and, upon moving northward, would arrive at Barrow above 3 km. In that circumstance, unless the air was initially very dry at the source of the aerosol, it would also have become saturated because of cooling before reaching the Arctic. Northward moving airstreams south of the polar front jet tend to be rather warm and moist, ascend very quickly to the upper troposphere, saturate rapidly and remain in the
vicinity of the polar front jet (Carlson, 1980). Dry, descending air originates in the upper troposphere north of the polar front, reaches lower levels to the east
of a surface high and flows southward, often to latitudes far south of the polar front. Such cold outbreaks are encountered most frequently over the continental areas in winter. Although that cold de- scending air is rapidly warmed as it flows southward at the surface, the warming will not be rapid over the interior of Asia and North America if the ground is completely snow covered. Cold, dry air sinking east of a surface high tends to split, with one branch continu- ing equatorward where the air becomes rapidly modified, and the other returning poleward on the west side of the high. This return flow has been suggested as the source airstream or the Arctic aerosol (Rahn and McCaffrey, 1980).
The short term fluctuations in the Arctic aerosol indicate that there is significant lateral exchange of air between the Arctic and lower latitudes. The presence of discrete layers of high dust concentrations, character- ized by sharp vertical gradients of aerosol concen-
Speculations on the movement of polluted air to the arctic 1417
tration as in Fig. 2, further suggests that the dusty air at Barrow is of recent origin because vertical mixing of the air by small-scale turbulence or by fallout of the dust has not had time to modify the structure of the dust profile. Furthermore, one cannot postulate ex- cessively long residence time for the aerosol reaching the Arctic (say a month) without also accepting the fact that the air must be either extremely dry to begin with or become saturated as the result of the combination of ascent and radiational cooling. It should be noted from Fig. 1 that the air near the surface is relatively cold and moist and that the temperature deereases rapidly toward the surface, suggesting that the air in the lowest 0.5-1.0 km of the Arctic may be representative of a relatively local air mass that experiences prolonged radiational cooling. However, this surface air is also relatively clean.
The polar front makes its southernmost excursion during the winter over continental repions. In midwin- ter the average location of the polar front jet is about 4&45”N over the interior of Asia and North America (Air Weather Service Atlas, 1955). Later the jet shifts northward except for an extension, which remains near 4&45”N over the eastern part of the continents until late March (the solid streamline in Fig. 4). By July, the jet migrates northward to the vicinity of 60“N (the dashed streamline in Fig. 4).
Over North America the heaviest concentrations of industrial pollutants, notably sulfate materials, orig- inate from sources that are south of 45”N, the excep- tion being South Central Ontario (Whelpdale, 1978). Eurasia, however, provides a significant source of sulfur emissions at latitudes of 45-55”N (Semb, 1978). With the coming of spring, the polar front retreats northward, the snow melts and the source regions of Europe, Asia and North America are left south of the zone of strongest meridioM1 potential tem~~ture contrast, where the air is warmer and substantially more moist than in winter. In this circumstance, north- ward-directed trajectories of polluted air from the interior of the continents would ascent rapidly, quickly reach saturation and therefore, lose aerosol because of rainout before reaching the Arctic. Episodes of high pollution concentration would become more in- frequent or cease entirely.
4. SUMMARY
We hypothesize that Arctic aerosol originates north of the polar front and therefore the most important source regions are likely to be northeastern Europe and north central Asia. We also suggest that the transit
time for polluted air between source region and arctic is relatively short, perhaps less than ten days. Were the aerosol to originate farther south than the polar front jet and the air carrying it to follow an approximate adiabatic path toward the Arctic, it would not only reach altitudes at Barrow, Alaska, above the levels at which highest concentrations are found (l-3 km) but also experience condensation and washout of the aerosol by precipitation. A lengthy transit time for the aerosol must imply a very large net radiational cooling of the airstream between source region and arctic, a situation which would not occur without condensation taking place in the airstream unless it was extremely dry at the source. Moreover, a long transit time would not be consistent with the aerosol’s multiple banded structure in the vertical which is observed to exist on some occasions. The implication is that the aerosot is introduced near the surface at middle latitudes in the subsided return flow from very dry, cold outbreaks which are confined to the regions near or north of the polar front. With the exception of South Central Ontario, significant sulfate sources exist north of the polar front mainly over northeastern Europe and north central Asia during wintertime.
REFERENCES
Atlas of 700-mb five-day mean northern he~phere anomaly charts, 1955. Air We&her Services Technical Report, AWS TR 105100/2. U.S. Air Force. Washinaton. DC. 39 DD.
Barrie L. A., H&R. and DagguRty S. (1981) The influence of midlatitude pollution sources on haze in the Canadian Arctic. Atmospheric Enu~ronme~r 15, 1407-1419.
Carbon T. N. (1980) Airfiow through mid-latitude cyciones and the comma comma cloud pattern., Mon. Breath. Rev. 108, 14981509.
Pepin T. J., Lane R. W., Simon F. and Cerni T. A. (1980) Remote sensing of the verticai ~~ntration of aerosots and ozone in the arctic atmosphere. Int. Radiation Symp., 11-16 August, 1980, Colorado State University, extended abstracts, 35-37.
Peterson J. T., Hanson K. T., Bodaine B. A. and Ottmans S. J. (1980) Dependence of CO,, aerosol and ozone con- centrations on wind direction at Barrow, Alaska during winter. Geophys. Rex Letr. 7, 349352.
Rahn K. A., Borys R. D. and Shaw G. E. (1977) The Asian source of Arctic haze bands. Nature 268, 713-715.
Rahn K. A. (1981) Relative importance of North America and Eurasia as sources of arctic aerosol. Atmospheric Enoiron- ment 15, 1447--1455.
Rahn K. A. and McCaffrey R. J. (1980) On the origin and transport of the winter arctic aerosol. Ann. N. Y. Acud. Sci. 338,48&x)3.
Semb A. (1978) Sulphur emissions in Europe. Armospheric Environment 12, 455-460.
Whetpdate D. M. (1978) Large-scale atmospheric sulfur studies in Canada. Atmospheric Environment 12,661-670.