Embed Size (px)
Citation preview

WU Boyang
APMT
Communication Engineer
Satcom ABC series (4)

Page 2
Communication Payload
Parameters
Carrier Assignment
Link Budget
Frequency Resource and RF Equipments
Payload Management
Spectrum Assignment
Carrier Management
Technical Support
Marketing Support Costumer Support
Sun Outage
Frequency Coordination

Page 3
Transponder Parameters
Transponder
Combination of receiver, frequency converter and transmitter
Main parameters
G/T, SFD and EIRP
relative to antenna pattern (geographical location)
relative to operation frequency (transponder number)
city tables and isograms
G/T and SFD
showing transponder Rx performance at its service area
depending on antenna Rx gain pattern
EIRP
showing transponder Tx power at its service area
depending on antenna Tx gain pattern

Page 4
G/T
figure of merit
Characterization of receive system performance
G/T (dB/k) = G (dBi) – TSYS (dBk)
where, G is antenna gain and TSYS is equivalent noise
temperature of receiving system
TSYS = TANT + TRCV
TANT: antenna noise temperature
depends on its gain pattern with the thermal environment
night sky: roughly 4 Kelvin
earth ground: physical temperature
sun surface: when in sun outage,
too high to interrupt transmission
TRCV: receiver noise temperature
G/T at beam peak
C-band: about 1 dB/k
Ku-band: about 7dB/k

Page 5
SFD
Saturated Flux Density
Flux density at receive antenna required to saturate HPA
SFD = C + Attn - G/T (dBW/m2)
where C is a constant (-90 to -100), Attn is corresponding
channel gain step (0 to 20 even to 30)
normal range: -70 to -100 dBW/m2
normally selected value: -85 to -93 dBW/m2
More sensitive SFD, less uplink power required
less C/N and C/I
SFD listed in data table is usually relative to a specified Attn
0dB Attn (most sensitive SFD) or 8dB Attn (normally used SFD)

Page 6
EIRP
EIRP
Effective Isotropic Radiated Power
The power radiated by a directional antenna with an antenna
gain relative to an isotropic antenna
EIRP (dBW) = P (dBW) - Loss (dB) + G (dBi)
where, P is HPA output power, Loss is wave guide loss
between HPA and antenna feed, G is antenna gain
EIRP at beam peak
C-band: about 41 dBW
Ku-band: about 56 dBW
Page 7
Communication Payload
Parameters
Carrier Assignment
Link Budget
Frequency Resource and RF Equipments
Payload Management
Spectrum Assignment
Carrier Management
Technical Support
Marketing Support Costumer Support
Sun Outage
Frequency Coordination

Page 8
Gain transfer
TWTA
HPA of satellite transponder: non-linear amplifier
Output/Input relationship: gain transfer curve
relationship between output power level and input power level
Gain transfer curve
Y-axis: output power
X-axis: input power
Saturation point
vertex of the curve
reference point
Linearity range
closer to saturation point,
higher efficiency at multi
carrier usage

Page 9
Back-off and Bandwidth Allocation
Back-off
Input back-off: difference of input power level between
operating point and saturation point
output back-off: difference of output power level between
operating point and saturation point
Linear back-off: Operation point at highest linearity range to
avoid IM
for LCTWTA: 3dB output back-off / 6dB input back-off
Carrier bandwidth allocation
Calculated by signal information rate, coding and modulation
type
Proper guard band reserved to avoid interference between
adjacent carriers
Rental for the user carrier based on carrier BW + guard band

Page 10
Intermodulation
Intermodulation component
Occurred at multi carrier operation
Interfered to other carriers

Page 11
Power Allocation
Transponder operation point
Reserving sufficient output back-off
To keep transponder power limited in linear range
Carrier power allocation
Transponder resource: power and bandwidth
When power balanced with bandwidth
EIRPC = EIRPXpd - OPBOC
where, EIRPC and EIRPXpd means EIRP for carrier and
transponder, and OPBOC means carrier output back-off
Downlink carrier power allocated as
OPBOC = OPBOXpd + 10 lg(BWXpd/BWC)
where, OPBOC and OPBOXpd means output back-off of
carrier and transponder respectively, and BWXpd and BWC
means bandwidth of transponder and carrier
If customer deserves higher carrier power than average power
of the transponder, the payment should be more than average
Page 12
Communication Payload
Parameters
Carrier Assignment
Link Budget
Frequency Resource and RF Equipments
Payload Management
Spectrum Assignment
Carrier Management
Technical Support
Marketing Support Costumer Support
Sun Outage
Frequency Coordination

Page 13
Link Budget
Target
To calculate antenna elevation and azimuth angle
To calculate carrier power and bandwidth
To estimate up-link C/N, down-link C/N and total C/N
(interference involved or not), and link margin
Input data
Transponder parameters
G/T at up-link site
SFD at up-link site (corrected by gain step setting)
EIRP at down-link site
Up-link frequency of the carrier (down-link frequency may be
auto-calculated by preset transfer frequency)
Output back-off (input back-off may be auto-calculated by preset
gain transfer data)

Page 14
Link Budget (cont.)
Input data (cont.)
Carrier information
information rate
modulation type
coding rate
required Eb/N0 (energy per bit to noise power density ratio,
relative to modulation type, coding rate and bit error rate)
Parameters for up-link and down-link earth stations
location with longitude and latitude
antenna size, antenna efficiency, and system noise temperature
Parameters for fade and interference
pointing error, atmospheric absorption, troposphere fading, rain
attenuation
C/T (carrier to noise temperature ratio) about adjacent satellites,
intermodulation, and cross polarization interference

Page 15
Link Budget (cont.)
Data correction
Estimated results need to be manually revised one or more
times
Data need to be revised before calculation
allocated bandwidth (auto-calculated occupied bandwidth +
proper guard band)
suggested HPA output power (> calculated up-link power + back-
off value, and match product standard)
Data need to be revised after first round of calculation
carrier back-off (if calculated system margin is too high or too
low)
modulation type and/or coding rate (if calculated system margin
is too high or too low)
U/L antenna size (if calculated HPA output power is too high)
D/L antenna size (if calculated system margin is not enough)

Page 16
Link Budget (cont.)
Sequence for link budget calculation
Multi input, and multi output estimation
all output data may be revised by any input data correction
several calculation sequences could be used
Carrier priority: preset carrier with changeable Rx antenna
according to desired carrier modulation type and coding rate,
using balanced or augmented back-off, selecting proper receive
antenna size, to meet the required margin
Aperture priority: preset Rx antenna with changeable carrier
according to desired receive antenna size, using balanced or
augmented back-off, selecting proper carrier modulation type and
coding rate, to meet the required margin
Back-off adjustment
bandwidth limited result: P% < BW%, usable power wasted
power limited result: P% > BW%, should pay more for rent
balanced result: P% = BW%, power and BW resource fully used

Page 17
Data and Formulas for Link Budget
Symbol rate
symbol rate = data rate / m / CRv / CRrs
where,
m (modulation index), 1 for BPSK, 2 for QPSK, 3 for 8PSK,
and 4 for 16QAM;
CRv (Viterbi coding rate), normally as 7/8, 5/6, 3/4, or 1/2;
CRrs (Reed-Solomon coding rate), normally as 188/204
Carrier bandwidth
noise BW (3dB BW) = symbol rate x 1.2
occupied BW (20BW) = symbol rate x 1.4
40dB BW = noise BW x 1.4 = symbol rate x 1.7
Common value of roll-off factor is 1.3
normally between 1.25 and 1.5
Page 18
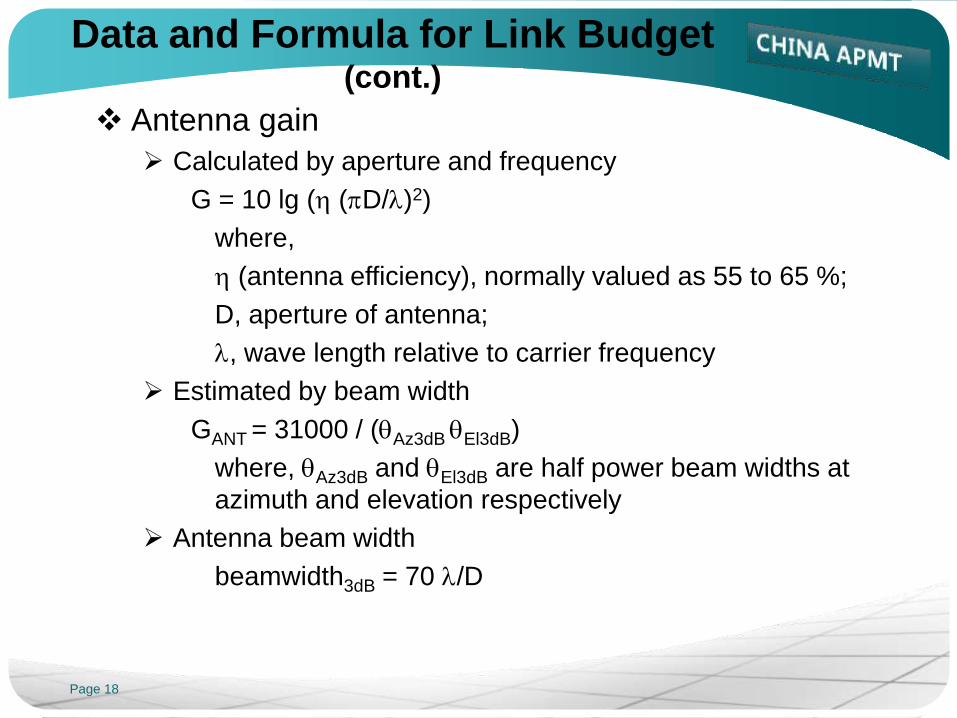
Data and Formula for Link Budget (cont.)
Antenna gain
Calculated by aperture and frequency
G = 10 lg (h (pD/l)2)
where,
h (antenna efficiency), normally valued as 55 to 65 %;
D, aperture of antenna;
l, wave length relative to carrier frequency
Estimated by beam width
GANT = 31000 / (Az3dB El3dB)
where, Az3dB and El3dB are half power beam widths at
azimuth and elevation respectively
Antenna beam width
beamwidth3dB = 70 l/D

Page 19
Data and Formula for Link Budget (cont.)
仰角(度)
0 5 10 15 20 25 30 35 40 45 50
10
20
30
40
5
0
60
天线
噪声
温度
TA(
K)
12GHz,线极化,1.8米天线测得
4GHz,圆极化,30米天线测得
天线噪声温度(晴朗天气)
Noise figure
NF = 10 lg(1 + T/290)
where, T is noise temperature, and 290k is room temperature
Normally 0.4dB (25-30k) for C-band LNB
Normally 0.8dB (59k) for Ku-band LNB
Receive system noise temperature
TS (dBk) = Ta + (LF - 1) T1 + LF x Te
where, Ta and Te are noise
temperatures of antenna and LNA
respectively, LF is insertion
loss between antenna feed and
LNA input, and T1 is the
environment temperature of feeder
line

Page 20
Communication Payload
Parameters
Carrier Assignment
Link Budget
Frequency Resource and RF Equipments
Payload Management
Spectrum Assignment
Carrier Management
Technical Support
Marketing Support Costumer Support
Sun Outage
Frequency Coordination
Page 21
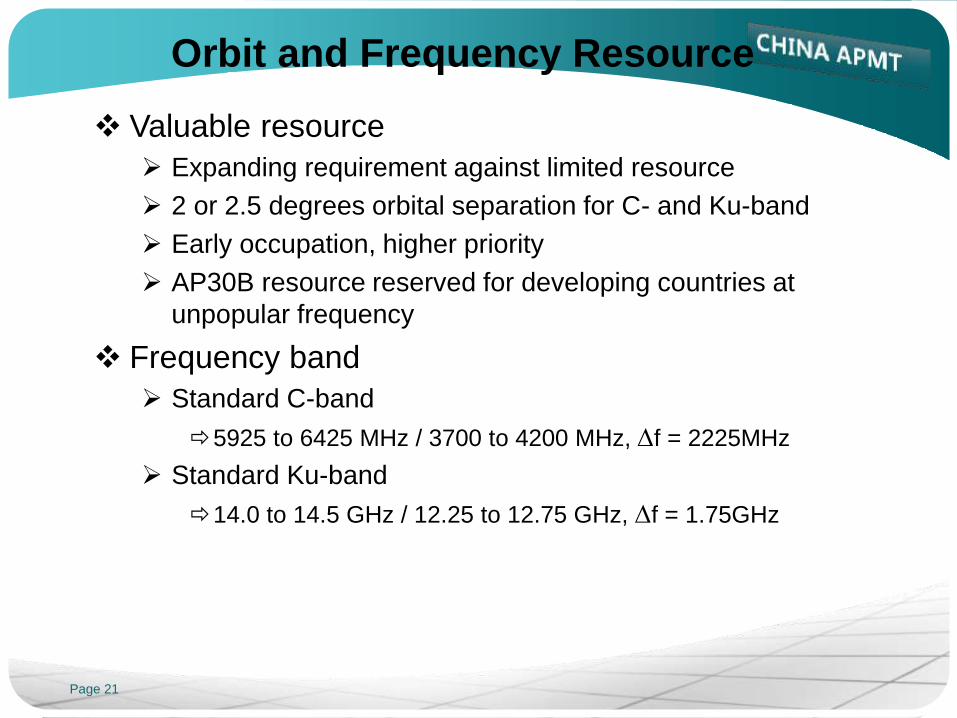
Orbit and Frequency Resource
Valuable resource
Expanding requirement against limited resource
2 or 2.5 degrees orbital separation for C- and Ku-band
Early occupation, higher priority
AP30B resource reserved for developing countries at
unpopular frequency
Frequency band
Standard C-band
5925 to 6425 MHz / 3700 to 4200 MHz, Df = 2225MHz
Standard Ku-band
14.0 to 14.5 GHz / 12.25 to 12.75 GHz, Df = 1.75GHz

Page 22
Block Diagram for Earth Station
IF connection
Cable between IDU and ODU at IF band (70MHz or 140MHz)
RF and Df of U/C and D/C lied on frequency plan of
designated satellite
Operation frequency band of antenna, HPA, LNA also lied on
satellite frequency plan

Page 23
Block Diagram for Earth Station (cont.)
L-band connection
Cable between IDU and ODU at L-band
RF and Df of U/C and D/C lied on frequency plan of
designated satellite
Operation frequency band of antenna, HPA, LNA also lied on
satellite frequency plan

Page 24
Low Noise Amplifiers
LNA: only amplifier (50 to 100 dB gain)
LNB: amplifier with D/C, output at L-band
LNC: amplifier with D/Cs, output at IF, (80-100 dB)

Page 25
Adjacent Satellites
Adjacent satellite interference
Interfered by adjacent satellite operating of co-frequency band
and co-service coverage
Larger antenna, narrower beam width, lower interference
Figure shows antenna size relative to Ku D/L interference
beam width for 0.45, 0.6, 0.75, 0.9, 1.2 and 2.4 m antennas

Page 26
Discussion for LaoSat-1
Not good at marketing
Uncommon frequency band, rarer and more expensive
antennas and RF equipments
allowance often used for customer carriers’ migration
More difficult in transponder rent and sell
more competitive rent fee often offered
Good at adjacent satellite interference
Uncommon frequency band, rarer and less interference from
adjacent satellite
easier for frequency coordination
smaller antenna may be used for market development

Page 27
Communication Payload
Parameters Carrier Assignment
Link Budget
Frequency Resource and RF Equipments
Payload Management
Spectrum Assignment
Carrier Management
Technical Support
Marketing Support Costumer Support
Sun Outage
Frequency Coordination

Page 28
Transponder Resource
Transponder resource
Power resource
EIRP, linear EIRP
Frequency resource
bandwidth
Resource allocation
sharing EIRP and B/W
Transponder spectrum
Noise floor showing SFD
sensitivity
Y-axis: EIRP density,
dBW/Hz
X-axis: bandwidth, Hz
Area: EIRP
EIRP (dBW) = EIRP density (dBW/Hz) x bandwidth (Hz)

Page 29
Transponder Spectrum
Carriers in transponders
Higher in Y-axis, higher power density occupied
Wider in X-axis, more frequency bandwidth occupied
Larger in area, more power occupied
Total area of carriers or carrier areas’ integral: transponder
power occupied by all carriers
Rule of resource allocation
Keeping carriers as same
power density as possible
More power occupied, more
expense offered

Page 30
Carrier Spectrum
Carriers at spectrum analyzer
SCPC carrier by phase modulation
spectrum line at rectangular shape
TDMA carrier by phase modulation
spectrum lines as rectangular pattern
Analog TV carrier by FM modulation
spectrum lines as pyramid pattern
Carrier resource allocation
Enough frequency bandwidth
including guard band
Average power (density) with
clear and flat noise floor

Page 31
Other Parameters
Linearity requirement
3rd intermoduration product, noise power ratio, phase shift,
and AM/PM transfer
Better specification at the band around center of transponder
Frequency response
frequency response, gain slope, and group delay
Better specification at the band around center of transponder
Cross polarization
Occurred by polarization
adjustment for transmit antennas
Frequency and power stability
Center in transponder is better

Page 32
Carrier Allocation
Multi carrier used transponder
Center bandwidth properly reserved for pure carrier test
causing corsspol interference to the transponder at crosspol
Interleaving frequency plan is better
Center frequency band allocation
Center is better for carriers easily influenced by non-linearity
or phase noise (TDMA and others)
Carriers needed more power
Asides is better to let
IM products going out
of band

Page 33
C-band and Ku-band
C-band
Larger service area
EIRP at 36 to 42 dBW, and G/T at -5 to +1 dB/k
1.8m or larger antenna for VSAT terminal
Less climatic influence
Compliant for high reliability as well as inter continent service
Ku-band
Smaller coverage
EIRP at 44 to 56 dBW, and G/T at -2 to +8 dB/k
1m or smaller antenna for TVRO and internet access
Rain fade and other climatic influence
Compliant for domestic network of numerous terminals

Page 34
输入回退
输出
回退
ALC
FGM
FGM
Fixed Gain Mode
Output power relative to input power
ALC
Automatic Level Control
Fixed output power at proper input power range
Suit for broadcast carrier uplinked by single E/S
FGM and ALC

Page 35
Communication Payload
Parameters Carrier Assignment
Link Budget
Frequency Resource and RF Equipments
Payload Management
Spectrum Assignment
Carrier Management
Technical Support
Marketing Support Costumer Support
Sun Outage
Frequency Coordination

Page 36
Carrier Filing
Link budget
One link budget table covering whole transponder bandwidth
Carriers or carrier groups listed one by one
Carrier’s center-frequency/bandwidth and carrier group’s
start/stop-frequency/bandwidth with their power level
Two down-link C/N, one for user’s E/S and the other for carrier
monitoring at SCC
Carrier spectrum archive
New plotted spectrum and its noise floor at line-up test
Regular profiling and comparing
Carrier information and spectrum plots
Information about carrier and user
Spectrum plots of the carrier, including neighbouring carriers,
and whole transponder

Page 37
Regular Monitoring
Daily monitoring
Raised noise pulse or noise floor
checking transponder and carrier spectrum by wide band and
narrow span
Raised carrier power or intrusive carrier
Anomaly recording and analyzing
informing the user and resolving the problem

Page 38
Interfering Measures
Interferences in satellite networks
Often happened
Hard to find the source
because of wide coverage, open access, lots of uplinkers,
stealers and intruders
Interfering source
Technical caused
equipment problem and incorrect operation, accounted for 90%
Unauthorized uplink
Intentional intrusion
economical or political reason

Page 39
Interfering Measures (cont.)
Distribution of interferences
unknown carrier 14%
customer itself 47%
external interference from other customer
3%
unknown 22%
weather 6%
local interference 4%
others 4%
Classification statistics
Most of the interferences are caused by improper operation
Measures
Power level decreased
U/L problem? Rain fade? Antenna mispointing?
Noise floor risen
Intermodulation? Crosspol interference?
Interference occurs
too much possibility

Page 40
Preventative Measures
Measures of operator’s
Rigorous network management
equipment verification test
carrier line-up test
carrier monitoring system
Completed interfering coordination
Enough margin remained at link budget
Measures of user’s
Notice operator before network changed
Carrier test plan prearrangement with operator

Page 41
Communication Payload
Parameters Carrier Assignment
Link Budget
Frequency Resource and RF Equipments
Payload Management
Spectrum Assignment
Carrier Management
Technical Support
Marketing Support
Costumer Support
Sun Outage
Frequency Coordination

Page 42
Pre-sale
For potential customers
Analyzing user’s requirement
Offering link budget based link or network suggestion
frequency band
antenna size and HPA power
Coordination
user asked antenna size vs. interference coordination
requirements
user asked power vs. power/bandwidth balance
user asked carrier bandwidth vs. physical truth + guard band

Page 43
Pre-sale (cont.)
For potential migration customers
Introducing the advantage of space segment
less adjacent satellite inference at unique frequency band
local service, quick response and omnibearing support
Measuring the difficulty of migration
unique frequency band for antenna and RF equipments, etc.
Discussing the process of migration
working quantity evaluation and migration schedule drafting
Cooperation
antenna pointing and pol-angle adjustment
line-up test for uplink carriers
other cooperation works

Page 44
Post-Sale
Annual session
Cooperation with marketing department
Invitation to all customers
Transponder resource introduction
Operating condition introduction
Common concern discussion
Technical training
Other technical support
Cooperation with marketing department

Page 45
Communication Payload
Parameters Carrier Assignment
Link Budget
Frequency Resource and RF Equipments
Payload Management
Spectrum Assignment
Carrier Management
Technical Support
Marketing Support
Costumer Support
Sun Outage
Frequency Coordination

Page 46
Regular Tests
Verification test
Antenna
side lobe test
crosspol isolation test
RF equipments
spurious, modulation and intermodulation characteristics
power and frequency stability
Line-up test
Antenna
pointing and pol-angle adjustment
Carrier
frequency and power calibration

Page 47
Crosspol Isolation Test
Crosspol isolation
Power difference at
co-pol and X-pol
Intrinsic specification
of antennas
Better or worse by
adjustment
Method
Change at Tx side
transmitting at both
polarization
monitoring at co-pol
Change at Rx side
transmitting at co-pol
monitoring at both
polarization

Page 48
Clients Service
Regular customer visiting
Operating condition review for user equipments
User claim and requirement listening
User’s future plan discussion
Service and interference problem suggestion
Customer test cooperation
Offering idle space segment
Witness and cooperation for the test
To avoid unnecessary intrusion, test resource about short
term and limited band may be offered for non-user

Page 49
Adjacent Satellite Interference
3dB
Half power antenna beam width
Beam width at antenna main lobe where -3dB roll off from
peak
3dB = 70 l/D
where, D is antenna aperture, and l is the wave length
relative to carrier frequency
Antenna could be estimated by beam width
GANT = 31000 / (Az3dB El3dB)
where, Az3dB and El3dB are half power beam widths at
azimuth and elevation respectively
To decrease adjacent satellite interference
Larger antenna, narrower beam width
Wider orbital separation, lower side lobe gain

Page 50
Adjacent Satellite Interference (cont.)
Down-link interference
Emission from adjacent satellite received by side lobe of local
antenna
C/I = (EIRP + GRx) - (eirp + G’)
where, C/I is carrier to interference power ratio, EIRP and
eirp is wanted and interfering satellite EIRP, GRx and G’ is
peak antenna gain pointing to wanted satellite and off-axis
gain to interfering satellite
Up-link interference
Off-axis emission from side lob of up-link antenna in adjacent
satellite network
C/I = EIRP - eirp’
where, EIRP is wanted up-link, eirp’ is interfering up-link
through side lobe, and difference in satellite receive gain
between wanted and interfering E/S is neglected

Page 51
Interference Caused by X-pol and IM
Cross-polarization
Closer to beam center, better crosspol isolation
antenna mispointing causing worse X-pol isolation
Gain variation by pol-angle changing is more sensitive at X-pol
than co-pol
monitoring X-pol when polarization angle adjustment
Intermodulation
Unauthorized carrier power increasement
carrier uplink power may be increased by one user after another,
when some of them without regard to allocated power level
Up-link power losing lock at RF equipment
Less margin in power allocation
Page 52
Interference from Earth Station
Unwanted loop formed at RF or IF segment
Retransmission raising noise floor
wide band noise floor raised
switching off suspects’ HPA one by one
RF equipment
down-link signal into up-link
Cable coupling
paralleling IF or L-band cable, especially under ground

Page 53
Interference from Microwave and
Intrusion Micro-wave relay
C-band shared by satellite and terrestrial
Low elevation angle, parallel to terrestrial emission
Stealing
Normally for testing in short term
Improper X-pol adjustment
Intrusion
Attitude bias for uplink site exploration
Negotiation with relative administration

Page 54
Rain Fade
Absorption of microwave signals by rain
Ku-band, up- and down-link
5dB or more attenuation
with raising noise floor and worse X-pol isolation
Insufficient even minus C/N margin
Up-link rain fade
Uplink power increasing
ALC mode presetting for mono uplink transponder
Down-link rain fade
More margin obligated
Page 55
Communication Payload
Parameters Carrier Assignment
Link Budget
Frequency Resource and RF Equipments
Payload Management
Spectrum Assignment
Carrier Management
Technical Support
Marketing Support
Costumer Support
Sun Outage
Frequency Coordination

Page 56
23.5º
23.5º
vernal
equinox
autumnal
equinox
太阳
Earth Orbit
Earth orbit is inclined to equatorial plane and GEO
During spring and fall equinoxes, the sun passes
through the equatorial plane
Page 57
Sun
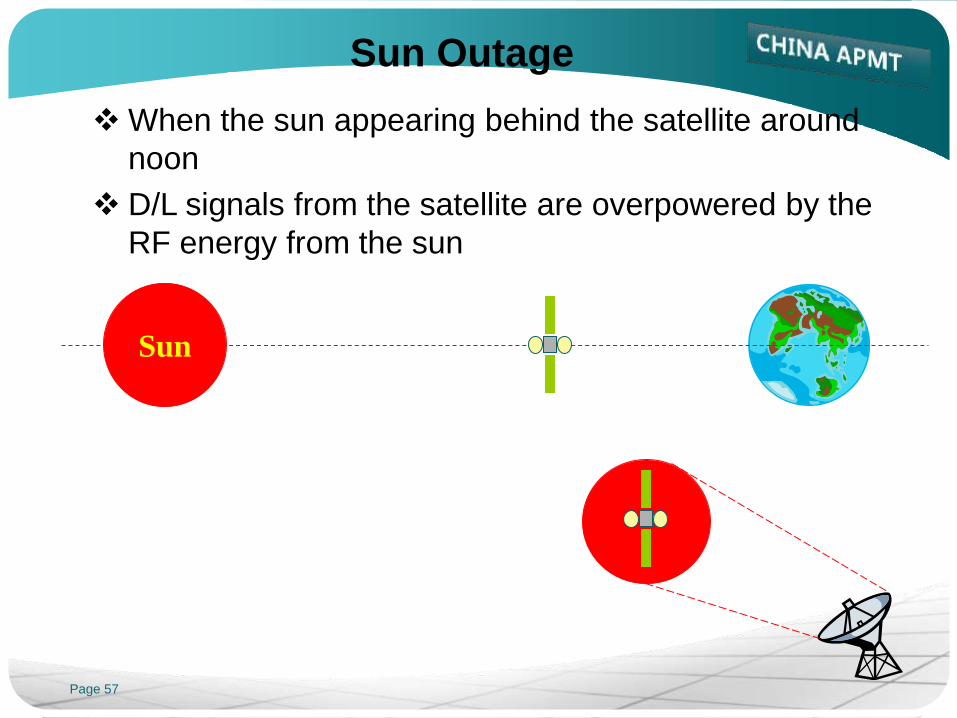
Sun Outage
When the sun appearing behind the satellite around
noon
D/L signals from the satellite are overpowered by the
RF energy from the sun

Page 58
Day Sun inclination Outage Lat.
1 0.4 2.64
2 0.8 5.29
3 1.2 7.94
4 1.6 10.62
5 2 13.32
6 2.4 16.04
7 2.8 18.81
8 3.2 21.62
9 3.6 24.48
10 4 27.41
21 March
北
Outage date
Solar orbit’s daily shift in south/north is 0.4 degrees
Outage location’s daily shift in north/south is about 2.8
degrees (non linearity)
Page 59
equator
plane
北
太
阳
光
线
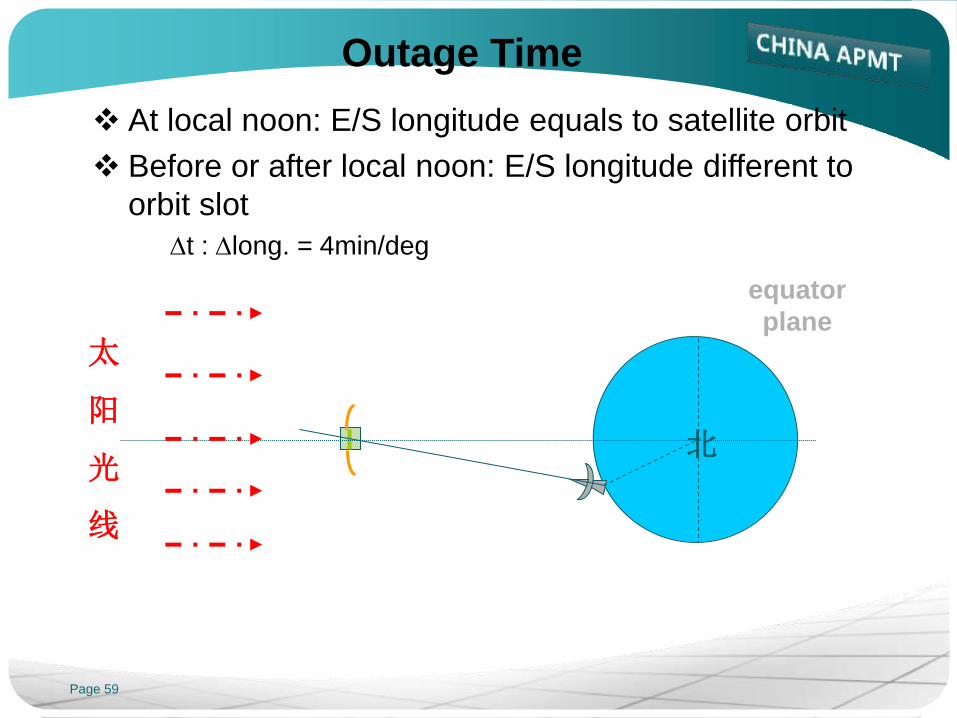
Outage Time
At local noon: E/S longitude equals to satellite orbit
Before or after local noon: E/S longitude different to
orbit slot
Dt : Dlong. = 4min/deg

Page 60
天线直径 束宽
2 1.63
3 1.17
4 0.94
5 0.80
6 0.71
9 0.56
11 0.50
Sun Outage Duration
Outage duration
Beam width of receiving antenna
Larger antenna, narrower B/W
Higher frequency, narrower B/W
Apparent diameter of the sun
The difference between noise and signal power
S/N performance of the receive equipment

Page 61
Outage Prediction Data
Sun outage prediction
Communication engineer: preparing customer’s information
E/S location, antenna size, and frequency band
Orbit analyser: calculating outage prediction data
Communication engineer: sending data
before each outage period during spring equinox and fall
equinox
to inform customers for preparation
Outage calculator at satellite operator’s homepage
Required input parameters
E/S location: longitude and latitude in deg, altitude in m
satellite orbit slot: in deg
antenna size: in m
D/L frequency: in GHz

Page 62
Communication Payload
Parameters Carrier Assignment
Link Budget
Frequency Resource and RF Equipments
Payload Management
Spectrum Assignment
Carrier Management
Technical Support
Marketing Support Costumer Support
Sun Outage
Frequency Coordination

Page 63
Regulation of Frequency Coordination
Regulation
Only completed the coordination, could operator use the
applied orbital resource
Standard for coordination: C/I
coordination for co-coverage and co-frequency band, 10 degrees
separation may not meet the requirement
2 degrees or more is enough for common operation
Regulation vs. reality
Relative priority vs. coordination request
Out-of-date standards vs. technical improvement
Filing coordination vs. channel by channel discussion
Face-saving administration vs. hungry so unreasonable
operator

Page 64
C/T, C/N and C/I
U/L carrier
U/L noise
U/L interference
D/L carrier
D/L interference
D/L noise
C/T
Carrier power to thermal noise ratio, (dBW/k)
Internal noise and influence, controlled through link design
C/N
Carrier to noise power ratio, (dB)
C/T to C/N calculation in dB
C/N = C/T + 228.5 - BWN
where, BWN is noise bandwidth
C/I
Carrier to interference power ratio, (dB)
By interference power to noise temperature conversion, C/I
and C/T can be converted each other

Page 65
interfering
satellite
wanted
satellite
receive E/S transmit E/S
D/L and U/L Adjacent Satellite C/I

Page 66
C/T, C/N and C/I (cont.)
C/(N+I)
Carrier power to noise and interference power ratio
Same as thermal noise, interference will also degrade service
quality
Relationship between C/T, C/N, C/I, C/(N+I)
where, symbol [ ] means logarithmic notation (dB)
...
...
11111
11111
DIMDXPIDASIDACID
UIMUXPIUASIUACIU
I
C
I
C
I
C
I
C
I
C
I
C
I
C
I
C
I
C
I
C
111
111
111
DUT
DDD
UUU
IN
C
IN
C
IN
C
N
C
I
C
IN
C
N
C
I
C
IN
C

Page 67
Limited Antenna Size and Power Density
Transponder performance may be limited in use
For reducing interference to adjacent satellite, some limitation
at antenna size and uplink power density might be committed
by the operator
System margin may be lower than link budget
For uplink interference from adjacent satellite network
transmitted by small Tx antenna
For downlink interference from adjacent satellite received by
small Rx antenna
The C/I may be much lower than link budget estimated
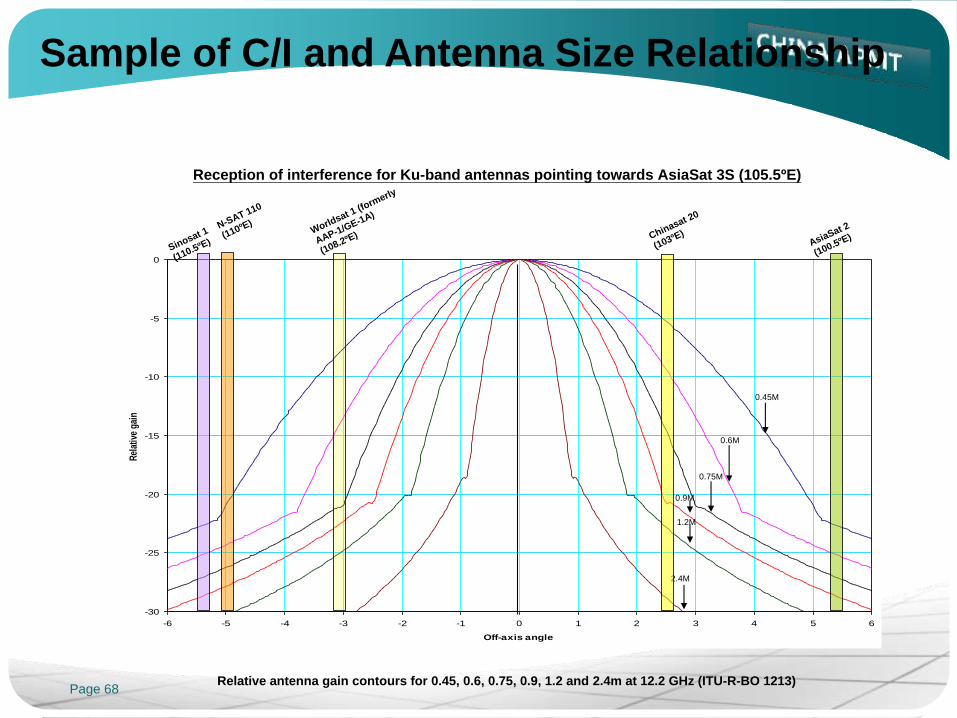
Page 68
Reception of interference for Ku-band antennas pointing towards AsiaSat 3S (105.5ºE)
Relative antenna gain contours for 0.45, 0.6, 0.75, 0.9, 1.2 and 2.4m at 12.2 GHz (ITU-R-BO 1213)
-30
-25
-20
-15
-10
-5
0
-6 -5 -4 -3 -2 -1 0 1 2 3 4 5 6
Off-axis angle
Rel
ativ
e ga
in
N-SAT 110
(110ºE)
Sinosat 1
(110.5ºE)
Worldsat 1 (fo
rmerly
AAP-1/GE-1A)
(108.2ºE)AsiaSat 2
(100.5ºE)
0.45M
0.6M
0.75M
0.9M
1.2M
2.4M
Chinasat 20
(103ºE)
Sample of C/I and Antenna Size Relationship

Page 69
Reference:
AsiaSat: Customer Training Materials, April 2004
Thanks!
Welcome to my homepage
www.satcomengr.com


![$ SREUH]D H D GHVLJXDOGDGH XPD UHDOLGDGH …](https://img.dokumen.tips/doc/110x75/61bd3e4a61276e740b10ccd2/-sreuhd-h-d-ghvljxdogdgh-xpd-uhdolgdgh-.jpg)


![AULA6-Massasdear.e.frentes [Modo de Compatibilidade]lcb.fflch.usp.br/sites/lcb.fflch.usp.br/files/upload/paginas/AULA6-Massasdear.e... · 'H XPD PDQHLUD JHUDO R FOLPDGH XPD GDGD UHJLmR](https://img.dokumen.tips/doc/110x75/607bce6b09d5857c401b9a2f/aula6-massasdearefrentes-modo-de-compatibilidadelcbfflchuspbrsiteslcbfflchuspbrfilesuploadpaginasaula6-massasdeare.jpg)