Embed Size (px)
Citation preview

BABES-BOLYAI UNIVERSITY
FACULTY OF PHYSICS
Emilia Sabina Vanea
Spectroscopic Studies on Aluminosilicate
Biomaterials Containing Iron and Rare Earths
PhD Thesis Summary
Scientific Supervisor:
Prof. Dr. Viorica Simon
Cluj-Napoca
2010

2
Table of Contents
Introduction ................................................................................................................................3
1. Sample preparation .............................................................................................................6
2. Sample characterization by XRD .......................................................................................6
3. Magnetic measurements .....................................................................................................8
4. Sample characterization by EPR ......................................................................................10
5. Sample functionalization ..................................................................................................13
5.1 Sample characterization by XPS and IR ....................................................................13
5.1.1 XPS results received for 60SiO2∙20Al2O3∙10Fe2O3∙10Y2O3 system ...................13
5.1.2 FT-IR results received for 60SiO2∙20Al2O3∙10Fe2O3∙10Y2O3 system ................19
5.1.3 XPS results received for 60SiO2 ∙ 20Al2O3 ∙ 20Fe2O3 system .............................20
5.1.4 IR results received for 60SiO2 ∙ 20Al2O3 ∙ 20Fe2O3 system .................................25
Conclusions ..............................................................................................................................27
Selected References .................................................................................................................29
Keywords: sol-gel, aluminosilicates, radiation induced defects, EPR, nanostructured microparticle,
protein adsorption, BSA, fibrinogen, SBF, XPS, FT-IR,

3
Introduction
Biomaterials have a long-lasting history over more than several thousand years. Definitions of
biomaterials and of biocompatibility have changed since that time with respect to the acquired
knowledge and the increasing performance of a material. So a biomaterial must now be understood
as a (living or not-living) material destined to be put in contact with living tissues and/or with
biological fluids to evaluate, treat, modify forms or replace any tissue, organ or function of the body
[1, 2].
The definition of biocompatibility has even more been changed with respect to the considered
material. First defined for biological inert materials, it has been adapted to biological active and
finally functionalized materials for drug binding and drug delivery. It also has to consider
biodegradable and natural materials. Its today most objective definition should be the property of a
biomaterial that is to generate in the host an appropriate reaction [2]. This means that knowing the
multiple transient signals in the organism, it is utopia to want not to generate any unwanted reaction.
Thus it is preferable to try to minimize it and to control it.
Glass systems are very often used as bone repairing and substituting materials in many dental
and orthopedic applications due to their excellent biocompatibility and osteointegration [3].
Due to their high stability in the body, the aluminosilicate glass ceramics found several
medical applications [4-7-10].
The aluminosilicate glass ceramics are highly stable in the body and by addition of iron oxide
they could be optimised for hysteresis heating of interest in hyperthermia.
Hyperthermia has been gaining a lot of interest recently as a method for curing cancer
especially as an adjunct to other modalities such as radiotherapy and chemotherapy. The
simultaneous application of radiotherapy and hyperthermia considerably enhances the therapeutic
effects of the two cancer treatment methods [11]. Hyperthermia is a heat treatment, the temperature
of the tissue being artificially elevated in order to receive therapeutic benefits [12]. It is performed by
generating of temperatures up to 45-47◦C by the magnetic nanoparticles injected locally near the
cancerous tissue, in the presence of an external magnetic field.
The most important results obtained studying these systems refers to structure-properties
corelation and on effects of different external agents like temperature, nuclear radiations, chemical
agents and mechanical stress on the physical-chemical caracteristics 3,8 .
It is necessary to sterilize all medical implants after fabrication and prior to their use to reduce
the risk of infections and associated complications [13, 14].
Despite the availability of a wide range of sterilisation techniques, it is generally agreed that
no single sterilisation process is capable of sterilising without adverse effects, all processes having
their own advantages and disadvantages [15-17]. An effective sterilization method must guarantee

4
the required sterility assurance level with a minimum effect on the chemical, physical and biological
properties of the biomaterial [18, 19].
This study describes the gamma irradiation effects on aluminosilicate compounds of
biomedical interest for sterilisation purpose. The paramagnetic defect centres in silica–based sol-gel
materials were produced at room temperature. A promising technique that can be used to describe
and explain the radiation-induced paramagnetic centres is the Electron Paramagnetic Resonance
(EPR).
Magnetic particles for the hyperthermia/radiotherapy application have to be injected locally
or intravenously at the site of the tumor. After the particles are injected into the bloodstream they are
rapidly coated by components of the circulation, such as plasma proteins. On the other hand, foreign
products are recognized by the body’s major defence system, the reticulo-endothelial system (RES)
and are quickly removed from blood circulation [20]. This process is known as opsonization.
A solution to this problem is to encapsulate the nanoparticles in a protein shell. The protein
should be such that it should avoid detection by the RES and thus ensure longer sustenance of the
particles within the body [21].
The role of the dense require surface modification, that would ensure particles were non-
toxic, biocompatible and stable to the RES, is to inhibit opsonization, thereby permitting longer
circulation times.
It is been widely accepted that the protein adsorption behaviour must be controlled to control
a biomaterial surface and thus the study of protein-surface interaction should continue to be of
central importance for biomaterial development.
We describe the adsorption characteristics of bovine serum albumin (BSA) and fibrinogen
(Fg), two main plasma components and the relevant proteins adsorbed on the surface of blood
contact biomaterials.
Albumin is the predominant plasma protein, making up 60-70% of plasma [22]. Albumin is
generally considered to “passivate” the surface and greatly reduce the acute inflammatory response
to the material [23]. Fibrinogen is the third primary plasma component and it immediately adsorbs to
implanted biomaterials [24] being one of the most relevant proteins that are adsorbed on biomaterial
surfaces because it takes part in blood coagulation, facilities adhesion and aggregation of platelets,
which are very important properties in the processes of both haemostasis and thrombosis.
Thus another objective of this in vitro study was to functionalise the aluminosilicates
compounds containing iron and yttrium/dysprosium in order to improve the systems
biocompatibility. The proteins adsorption was investigated by means of XPS and FT-IR
spectroscopy. X-ray Photoelectron Spectroscopy (XPS) is a very useful analysis tool dedicated to
investigate the atomic composition and chemical environment of the outermost 2-10 nm layer of a

5
surface and can accurately determine the surface coverage. Transform Infrared Spectroscopy (FTIR)
is one of the most used techniques for studying protein secondary structures.
The thesis begins with the present introduction and continues with five chapters each of them
followed by references and finishes with conclusions.
The first chapter begins by a general definition of biomaterials and biocompatibility, and then
introduces the basic structural unit of SiO2 and its principal defects. It treaties also the main
sterilisation techniques, together with the advantages of gamma sterilisation.
The second chapter describes hyperthermia for cancer treatment and the biological rationale
for associating hyperthermia with radiation.
The third chapter approaches protein-surface interactions fundamentally responsible for the
biocompatibility of the materials.
The fourth chapter contains a brief description of the experimental methods used both for
preparation and analysis of the systems.
The last chapter describes the experimental results obtained for the aluminosilicates system
containing iron and rare earth.

6
1. Sample preparation
The sol-gel method, via hydrolysis and condensation of molecular precursors, was chosen in
this procedure to prepare aluminosilicate glasses doped with iron, yttrium and dysprosium content.
The sol-gel approach is a high-purity process that leads to excellent homogeneity.
The composition of the prepared aluminosilicate system is given in the next table (Table 1).
Table 1. Sample composition.
Code
Components (mol %)
SiO2 Al2O3 Fe2O3 Dy2O3 Y2O3
ASF 60 20 20
ASFD 60 20 10 10
ASFY 60 20 10 10
The compounds were thus synthesized by sol-gel method using as starting materials silicic
acid (Si(OH)4), aluminium nitrate (Al(NO3)3∙9H2O), iron nitrate (Fe(NO3)3∙9H2O), yttrium nitrate
(Y(NO3)3∙6H2O) and dysprosium nitrate (Dy(NO3)3∙H2O) with high grade of purity.
The calculated amount of precursors were dissolved in distilled water and mixed together at
the 90°C in order to form a gel structure.
After the gel formation, the samples were filtrated, dried in an electric oven at 110ºC for
couple of hours and then heat-treated at 500°C for one hour and 1200°C for 24 hours, respectively.
The aim of the thermal treatment was to create iron oxide crystalline phases to heat by hysteresis.
Thermal treatment can also restore the device performance and/or relieve the damages
induced after sample preparation. The annealing process alters the microstructures of a material and
annihilates the defects, and can be accomplished by the diffusion of defects to the surface, the
recombination of interstitials and vacancies, or the re-orientation of defects [25].
2. Sample characterization by XRD
The structure of prepared aluminosilicates compounds was investigated before and after
applied thermal treatment at 500°C and 1200°C by X-ray Diffraction (XRD).
The X-ray diffraction analysis was carried out on a Shimadzu XRD-6000 diffractometer
using CuKα radiation (λ=1.54 Ǻ), with Ni–filter.

7
10 20 30 40 50 60 70 80
MMM h
m h
M
h M
C
hh
Inte
nsity (
cp
s)
(a)
(c)
(b)
Theta-2Theta (deg)
(A)
C
M
Q M M
10 20 30 40 50 60 70 80
Inte
nsity (
CP
S)
Theta-2Theta (deg)
(a)
(b)
(c)
(B)C
h
M
QC
m
Ch
M
h, M
C
MMM h
m
h
M M
10 20 30 40 50 60 70 80
m
h
M (c)
(b)
(a)
Inte
nsity (
cps)
Theta-2Theta (deg)
(C)C
h
MC
C
MM
h
h m
M C
M MMh
m
h
M M
Figure 1. XRD patterns of samples ASF (A), ASFD (B) and ASFY (C)
before (a) and after heat-treatment at 500oC (b) and 1200
oC (c).

8
X-ray diffractograms show the amorphous structure before thermal treatment and an
increasing crystalline structure after thermal treatment applied at 500°C and 1200°C, respectively as
shown in images below.
The X-ray diffraction pattern of dried sample Figure 5.1 (A) reveals no crystalline. However,
the peaks of the 500oC sample are not well defined; the diffuse X-ray peaks indicate also the presence
of poorly crystallized hematite particles.
The 1200°C heat treatment determines the development of SiO2 cristobalite (C) and quartz (Q) [26],
Al6Si2O13 mullite (M) [27], Fe2O3 hematite (h) and Fe3O4 magnetite (m) [28] nanocrystals. Crystal
sizes estimated with Scherrer equation according to the position and width of XRD peaks are up to
75 nm (Fig. 1).
3. Magnetic measurements
In order to establish the magnetic behavior of the synthesized samples was checked also the
magnetic properties such as magnetic saturation and Curie temperature.
For the manipulation of magnetic particles, it is very important to know their magnetic
moment. This was measured with the Alternating Gradient Magnetometer (AGM) MicroMag 2900
from the Princeton Measurement Corporation.
The magnetization measurements were carried out using a Curie-Weiss balance. The field
dependence of magnetization was determined on home-made equipment for the systems thermal
treated at 1200 °C.
The magnetic moment measurements as a function of magnetic field indicate a high magnetic
moment values and a ferromagnetic behavior of the investigated sample (Fig. 2).
-6 -4 -2 0 2 4 6-9
-6
-3
0
3
6
9
Ma
gn
etiza
tio
n (
em
u/g
)
Magnetic Field (kOe)
(a)

9
-6 -4 -2 0 2 4 6
-9
-6
-3
0
3
6
9
Ma
gn
etiza
tio
n (
10
-3 e
mu
/g)
Magnetic Field (kOe)
(b)
-6 -4 -2 0 2 4 6-9
-6
-3
0
3
6
9
Ma
gn
etiza
tio
n (
10
-3 e
mu
/g)
Magnetic Field (KOe)
(c)
Figure 5.2 Field dependence of magnetization for ASF (a),
ASFY (b), ASFD (c) after applied thermal treatment at 1200 °C.
The temperature dependence of the magnetization shows for the sample ASF, the Curie
temperature to be around 430 K (Fig. 3 a) and for the sample with dysprosium content (ASFD) the
Curie temperature is around 711 K (Fig. 3 b). Even though, the Curie temperatures were much higher
than the desired optimum 315 K for hyperthermia application, the compounds have appropriate
magnetic properties showing a stable ferromagnetic behaviour, being the subject of further
investigations.

10
300 320 340 360 380 400 420 4400.0
0.2
0.4
0.6
0.8
1.0
M/M
S
Temperature (K)
(a)
300 400 500 600 7000.2
0.3
0.4
0.5
0.6
0.7
0.8
0.9
1.0
1.1
M/M
S
Temperature (K)
(b)
Figure 3. Temperature dependence
of normalised magnetisation for ASF (a) and ASFD (b) after
applied thermal-treatment at 1200°C.
4. Sample characterization by EPR
In order to use de samples as biomaterials they have to be sterilised to destroy the
microorganisms and to reduce the risk of infections and associated complications.
Gamma sterilisation was chosen for this purpose being the most accessible technique. It is a
simple, rapid and efficacious method of sterilisation. For this reason the samples were gamma
irradiated and investigated with respect to possible occurrence of nocuous irradiation deffects.
The samples were thus exposed to gamma rays for a few weeks, using a 60
Co source with a
debit dose of 10 Gy/h. The irradiation dose was close to 8 kGy.

11
Electron resonance spectra of the sol-gel materials were recorded by means of EPR
spectrometer, ADANI type, operating at 9.4 GHz (X band). The magnetic field was modulated at 100
KHz. All spectra were recorded at room temperature.
The identified intrinsic point defects that are induced by radiation in SiO2 include oxygen
vacancy species such as E’ centers (≡ Si•), non-bridging oxygen hole centre NBOHCs (≡ Si−O•),
peroxy radicals (≡ Si−O−O•), and self-trapped holes (≡ Si −O• −Si ≡) [25].
1000 2000 3000 4000 5000
ASFY
ASFD
ASF
Magnetic Field (G)
(A)geff
~ 4.3g
eff ~ 2.01
1000 2000 3000 4000 5000
ASFY
ASFD
Magnetic Field (G)
(B)
ASF
Figure 4. Room temperature EPR spectra of aluminosilicate compounds thermal-treated at 500°C
(A) and 1200 °C (B) before gamma exposure.
0 1000 2000 3000 4000 5000
Magnetic Field (G)
ASF
ASFD
ASFY
(A)g ~ 4.3
g ~ 2.01
3200 3250 3300 3350 3400 3450
Magnatic Field (G)
ASF
ASFD
ASFY
g ~ 2.037g
~ 2.02
g ~ 2.01
g ~ 2.009
(B)
Figure 5. Room temperature EPR derivate spectra of aluminosilicate compounds thermal-treated
at 500°C, recorded using a sweep width of 4000 G (A) and 200 G (B) respectively.

12
The EPR spectra recorded for non irradiated samples reveals only the lines corresponding to
Fe3+
ions. The X-band EPR spectra of glasses with Fe3+
ions usually exhibit two well defined lines at
geff ≈ 4.3 corresponding to the isolated Fe3+ ion and at geff ≈ 2 attributed to the Fe3+ species that
participate to dipole-dipole interactions (Fig. 4) [29].
0 1000 2000 3000 4000 5000
(A)
Magnetic Field (G)
ASFD
ASFY
ASF
3200 3250 3300 3350 3400 3450
(B)
Magnetic field (G)
ASF
ASFD
ASFY
Figure 6. Room temperature EPR derivate spectra of aluminosilicate compounds heat-
treated at 1200°C, recorded using a sweep width of 4000 G (A) and 200 G (B) respectively.
The EPR spectra for irradiated systems present additional signals occurring from
paramagnetic defects, mainly detected for 500°C thermal-treated systems (Fig. 5 (A, B)).
Regarding the g factors of the resonance line received for the samples thermal-treated at
500°C, the presence of resonance line with g ≈ 2.037 indicates the presence of paramagnetic peroxy-
centres, OHC. The resonance line with g ≈ 2.02, g ≈ 2.0179, g ≈ 2. 009 can be assumed to NBOHC
(Fig. 5 B) [30].
For the crystallised samples resulted after the thermal-treated applied at 1200°C (Fig. 6 (A,
B)) the EPR spectra reveal a very weak signal at geff ≈ 2.01 due to a low number of lattice defects
associated with oxygen or cation vacancies, that denotes a very good stability of the crystalline
compounds. The analysis indicates that for the samples treated at 500°C the defects concentration is
meaningful greater than for the samples treated at 1200°C which is in very good agreement with the
idea that thermal treatment can restore the material structure, and the native defect centres are almost
vanished.

13
5. Sample functionalization
Thus, protein adsorption experiments were carried out by incubating the aluminosilicates
sample containing iron and yttrium oxide in fibrinogen (Fg) solutions prepared in phosphate –
buffered saline solution (PBS), and then the powder samples were immersed in simulated body fluid
(SBF) enriched with bovine serum albumin (BSA).
The yttrium containing samples immersed in simulated biologic media were kept at 37°C in
incubator for 5 minutes, 2 hours and 24 hours, under static conditions.
Aluminosilicate sample with 60SiO2・20Al2O3・20Fe2O3 after fine grinding was immersed
in simulated body fluid (SBF) and also in simulated body fluid enriched with bovine serum albumin
(BSA) in two different concentrations obtained by adding 3.33 and 6.67 g lyophilised BSA to 1 ℓ
SBF. The system was kept also in the same incubator at 37°C, for 24 hours, 3 and respectively 7
days.
5.1 Sample characterization by XPS and IR
Surface chemical functionalization was determined by XPS and FT-IR spectroscopy.
XPS measurements were peformed using a SPECS PHOIBOS 150 MCD system equipped
with monochromatic AlKα source.
Infrared spectroscopy has been used in this study to assess the conformational state of
proteins adsorbed on aluminosilicates surface.
FTIR spectra of surface bound protein, before and after incubation, were conducted with
attenuated total reflectance using Equinox 55 Bruker instrument in the range 4000-650 cm-1
, with a
resolution of 2 cm-1
.
As the surface has been washed with analytically pure water, the protein left on the surface is
considered to be irreversibly bound.
5.1.1 XPS results received for 60SiO2∙20Al2O3∙10Fe2O3∙10Y2O3 system
In the XPS survey spectrum recorded before immersion, only photoelectron peaks
corresponding to the elements entering in the sample composition occur, excepting the C 1s
photoelectron peak (Fig. 5.10). Carbon adsorption usually takes place on all surfaces exposed to the
atmosphere and is immediately detected by the XPS technique.
As expected Y 3p, Fe 2p, Si 2p Al 2p peaks were found for all aluminosilicate-investigated
samples (Fig. 7 (A, B)). However, for the protein functionalised substrates, detection of these four
elements was less obvious due to the outer layer of protein (Table 2, 3). Similar results were obtained
for the two types of proteins (BSA/Fg) used for functionalisation purpose.
14
Table 2. Relative percentage of the main components before and after immersion in
SBF/BSA solutions determined from survey spectra.
Immersion
time
Elemental composition (at %)
C N O Al Si Fe Y
0 6.92 - 53.08 2.3 36.77 0.18 0.75
5 min 28.43 5.68 37.7 2.19 25.47 0.04 0.49
2 hr 28.93 6.46 37.21 1.71 25.2 0.03 0.46
24 hr 33.21 6.67 35.16 1.54 23 - 0.42
Table 3. Relative percentage of the main components before and after immersion in
PBS/Fg solutions determined from survey spectra.
Immersion
time
Elemental composition (at %)
C N O Al Si Fe Y
0 6.92 - 53.08 2.3 36.77 0.18 0.75
5 min 43.11 10.69 29.26 0.8 15.96 0.02 0.16
2 hr 51.81 11.5 23.25 0.41 13.02 0.01 -
24 hr 48.53 13.52 27.83 0.1 10.02 - -
1200 1000 800 600 400 200 0
Inte
nsity (
a.u
.)
(d)
(c)
(b)
(a)
O 2
s
Al 2
pS
i 2
p
Si 2
sC 1
sY
3p
N 1
s
O 1s
Fe
2pO
KL
L
C K
LL
Binding Energy (eV)
(A)
1200 1000 800 600 400 200 0
Inte
nsity (
a.u
.)
Fe
2p
Al 2
pSi 2
p
Si 2
s
C 1
sY
3p
N 1
s
O 1s
O K
LL
C K
LL
(d)
(c)
(b)
(a)
Binding Energy (eV)
(B)
O 2
s
Figure 7. XPS survey spectra before immersion (a), after 5 minutes (b),
2 hours (c) and 24 hours (d) immersion in SBF/BSA (A) and PBS/Fg (B) solutions.

15
At the same time, analysis of the survey spectra indicates N 1s peaks occurring from the
nitrogen present in every amino acid of the protein.
410 405 400 395 390
Binding Energy (eV)
(d)
Inte
nsity (
a.u
.)
410 405 400 395 390
Binding Energy (eV)
(d)
Inte
nsity (
a.u
.)
410 405 400 395 390
Binding Energy (eV)
(c)
Inte
nsity (
a.u
.)
410 405 400 395 390
Binding Energy (eV)
(c)
Inte
nsity (
a.u
.)
410 405 400 395 390
Binding Energy (eV)
(b)
Inte
nsity (
a.u
.)
410 405 400 395 390
Binding Energy (eV)
(b)
Inte
nsity (
a.u
.)
410 405 400 395 390
Inte
nsity (
a.u
.)
Binding Energy (eV)
(a)
410 405 400 395 390
Inte
nsity (
a.u
.)
Binding Energy (eV)
(a)
(A) (B)
Figure 8. Deconvoluted N 1s high resolution XPS spectra of lyophilised BSA/Fg (a) and after 5
minutes (b), 2 hours (c) and 24 hours (d) immersion in SBF/BSA (A) and PBS/Fg (B) solutions.

16
XPS measurements of the nitrogen concentration can be interpreted as an indirect measure of
the protein content [31]. The nitrogen concentration was practically zero before the immersion of the
sample in the protein solutions (Table 2, 3), that means it can be used as a reliable marker for protein
adsorption, and N:C ratio is typically used as indicators of protein deposition [32].
The deconvolution of N 1s core level spectra (Fig. 8) reveals two components, centred at
398.2 and 400 eV, characteristic of C-NH2 groups [33]. Actually, the N 1s photoelectron peaks
recorded close to 400 eV are typical for nitrogen in organic matrix [34].
XPS analysis confirms the increase of N content after different incubation periods, larger
sized protein will produce a higher nitrogen signal than a smaller sized protein. This is because the
larger protein molecule has more nitrogen atoms in XPS sampling depth.
After sample immersion in protein solution the C 1s high-resolution spectra (Fig. 9) appear
broader and signalise new type of bonds.
The C 1s photoelectron peaks were decomposed according to binding energies of carbon
bonds in proteins. They are well fitted (Fig. 9) with components at 284.6 eV, corresponding to C-C
and C-H bonds, 286.5 eV, corresponding to C-O bonds, and the component at 288.3 eV,
corresponding to C=O bonds [34]. These are characteristic carbon bonds in proteins.
295 290 285 280 275
Inte
nsity (
a.u
.)
(e)
Binding Energy (eV)
295 290 285 280 275
(e)
Inte
nsity (
a.u
.)
Binding Energy (eV)
295 290 285 280 275
Inte
nsity (
a.u
.)
(d)
Binding Energy (eV)
295 290 285 280 275
(d)
Inte
nsity (
a.u
.)
Binding Energy (eV)
295 290 285 280 275
Inte
nsity (
a.u
.)
(c)
Binding Energy (eV)
295 290 285 280 275
(c)
Inte
nsity (
a.u
.)
Binding Energy (eV)

17
295 290 285 280 275
Inte
nsity (
a.u
)
(b)
Binding Energy (eV)
295 290 285 280 275
Inte
nsity (
a.u
)
(b)
Binding Energy (eV)
295 290 285 280 275
Inte
nsity (
a.u
.)
(a)
Binding Energy (eV)
295 290 285 280 275
Inte
nsity (
a.u
.)
(a)
Binding Energy (eV)
(A) (B)
Figure 9. Deconvoluted C 1s high resolution XPS spectra before immersion (a), of lyophilised
BSA and Fg (b), and after 5 minutes (c), 2 hours (d) and 24 hours (e) immersion in SBF/BSA (A)
and PBS/Fg (B) solutions.
The O 1s signal before immersion in protein solution consists of a dominant component at
533.2 eV associated to Si-O-Si, and a second component at lower binding energy 531.5 eV, which
are related to bridging oxygens (BO) and, respectively, non-bridging oxygens (NBO) occurring in
the structural units of the aluminosilicate microparticles [37]. Based on the preponderance of BO
relative to NBO in the nanostructurated aluminosilicate microparticles (Fig. 10 a), they are expected
to own a high stability in the biological media.
545 540 535 530 525
Inte
nsity (
a.u
.)
Binding Energy (eV)
(e)
545 540 535 530 525
Inte
nsity (
a.u
.)
Binding Energy (eV)
(e)

18
545 540 535 530 525
Inte
nsity (
a.u
.)
Binding Energy (eV)
(d)
545 540 535 530 525
Inte
nsity (
a.u
.)
Binding Energy (eV)
(d)
545 540 535 530 525
Inte
nsity (
a.u
.)
Binding Energy (eV)
(c)
545 540 535 530 525
Inte
nsity (
a.u
.)
Binding Energy (eV)
(c)
545 540 535 530 525
Inte
nsity (
a.u
.)
Binding Energy (eV)
(b)
545 540 535 530 525
Inte
nsity (
a.u
.)
Binding Energy (eV)
(b)
545 540 535 530 525
Inte
nsity (
a.u
.)
Binding Energy (eV)
(a)
545 540 535 530 525
Inte
nsity (
a.u
.)
Binding Energy (eV)
(a)
(A) (B)
Figure 10. Deconvoluted O 1s high resolution XPS spectra before immersion (a) of lyophilised
BSA/Fg (b), and after 5 minutes (c), 2 hours (d) and 24 hours (e) immersion in SBF/BSA (A) and
PBS/Fg (B) solutions.
After immersion in protein solutions, the O 1s photoelectron peaks are evidently broader and
shifted to lower binding energies, mainly on the account of the BSA component located at 530.3,
respectively of fibrinogen component located at 531.2 (Fig. 10 b).

19
The results obtained by deconvolution of O 1s photoelectron peaks suggest that the O 1s
photoelectrons correspond significantly to peptidic oxygen of proteins [38].
5.1.2 FT-IR results received for 60SiO2∙20Al2O3∙10Fe2O3∙10Y2O3 system
The infrared spectroscopy results were analysed with respect to protein secondary structure.
The proteins exhibit characteristic bands, emerging from vibration in the peptide linkages, in 4000-
1200 cm-1
spectral range of FTIR spectra. There are three dominant bands, namely amide I band
(1600-1700 cm-1
) which comprises contribution from 80% C=O stretching mode, Amide II (1500–
1600 cm−1
: 60% N–H bending and 40% C–N stretching modes) and Amide III (1200–1330 cm−1
:
40% C–N stretching and 30% N–H bending modes) [39, 40]. The amide I band is mostly used to
extract information about the secondary structure. Because each of the different secondary structural
elements contributes to the FTIR spectrum, the observed amide bands are composed of several
overlapping components representing helices, β-structures, turns and random structures.
The exact frequency of the amide I vibration depends on the nature of the hydrogen bonding
involving C=O and N-H groups, this in turn is determined by the particular secondary structure
adopted by the protein [41, 42, 43]. Band deconvolution using the second derivative can be used to
identify the number and the position of the bands underlying the amides envelops [44].
Protein adsorption was evaluated for the two hours immersed system in SBF/BSA and
PBS/Fg solutions.
Compared to the lyophilised BSA, there are several conformation changes for the protein
adsorbed on surface (Fig. 11) toward a higher β-sheet/β-turn ratio, which indicates protein-surface
interaction and enhanced blood compatibility [45].
Fibrinogen adsorbed on material surface also changes its native structure.The α-helix content
of adsorbed fibrinogen obviously decreases and is mainly transformed to β-sheet which meaningfully
increases, while the β-turn is less changed.
The β-sheet/β-turns ratio used to indicate the biocompatibility of the biomaterial shows that
this ratio exhibits a higher value for the adsorbed protein compared to the native one (Fig. 10),
indicating a good biocompatibility of the material, as supported by other data in literature [3].

20
Figure 11. Distribution of secondary structures in bovine serum albumin.
Figure 12. Distribution of secondary structures in fibrinogen.
5.1.3 XPS results received for 60SiO2 ∙ 20Al2O3 ∙ 20Fe2O3 system
The uptake of proteins from solutions with different BSA concentration and prolonged
immersion time was tested for the 20 % iron containing aluminosilicate system.

21
The occurrence of nitrogen species is clearly evidenced only after immersion in SBF with
BSA solution (Fig. 13 c). In order to evaluate the uptake of protein on samples surface both survey
and the C 1s, N 1s and O 1s core level spectra were examined.
1400 1200 1000 800 600 400 200 0
Inte
nsity (
a.u
.)
Al 2
p
O K
LL
C K
LL
Fe
2p
O 2
sSi 2
p
Si 2
s
C 1
s
N 1
s
O 1s
(d)
(c)
(b)
(a)
Binding energy (eV)
Figure 13. Widescan XPS spectra before immersion (a), and after one day
immersion in SBF (b), SBF enriched with BSA (c) and SBF twice enriched with BSA.
The relative percentage of C, N and O after immersion in SBF solutions, determined from
survey XPS spectra (Table 4) points out very close values for both concentrations of BSA in SBF,
denoting that the attachment of the protein on the surface of the aluminosilicate sample is saturated
even by immersion in the solution with lower BSA content.
Table 4. Relative percentage of C, N and O after immersion in SBF solutions,
determined from survey XPS spectra.
BSA
concentration in
SBF (g/ℓ)
Elemental composition (at %)
C N O
0 19 - 81
3.33 52 11 37
6.67 51 10 39
The C 1s high resolution spectra recorded from the samples immersed in SBF/BSA solution
(Fig. 14) contains the BSA signature after one day soaking in the SBF solution with low BSA
content.

22
290 285 280
Inte
nsity (
a.u
)
295 290 285 280
Inte
nsity
(a
.u)
Binding energy (eV)
(b)
(d)
(c)
(a)
Binding energy (eV)
Figure 14. C1s high- resolution XPS spectra before immersion (a), and after one
day immersion in SBF (b), SBF enriched with BSA (c) and SBF twice enriched
with BSA. In inlay is shown the spectrum recorded from lyophilized BSA.
The deconvoluted C 1s photoelectron peaks (Fig. 15) provide more information. From the
non-immersed sample only one single C 1s peak at 285.5 eV is recorded. Also after one day
immersion in SBF the C 1s photoelectron peak is well fitted with a single line centered at 285.5 eV,
but the peak is broadened, with 2.9 eV full width at half maximum (Fig. 15 b), while the full width at
half maximum for the non-immersed sample (Fig. 15 a) is only 2.3 eV. The deconvolution of C 1s
photoelectron peaks for the samples immersed in SBF solution enriched with BSA leads beside the
peak at 285.5 eV to other two components centered at 286.7 and 288.6 eV, but their relative peak
areas are notably different (Table 5). It is beyond doubt that the increased contribution of higher
binding energy components is arising from the BSA adhered to the surface of aluminosilicate
samples.
The N 1s photoelectron peak was recorded only for the samples immersed in SBF with BSA
solutions (Fig. 16). The deconvolution of the peaks leads to different contributions for the two
components centered at 400.3 eV and 399.1 eV. The binding energies of N 1s typical for organic
matrices are close to 400 eV, related to C-N bonds [50]. The atomic percent estimated for nitrogen
(8.6 %) is in good agreement with the values reported on the surface of silicon wafers after BSA
adsorption [49].

23
295 290 285 280
Inte
nsity (
a.u
.)
(d)
Binding Energy (eV)
295 290 285 280
Inte
nsity (
a.u
.)
(c)
Binding Energy (eV)
295 290 285 280
Inte
nsity (
a.u
.)
(b)
Binding Energy (eV)
295 290 285 280
Inte
nsity (
a.u
.)
(a)
Binding Energy (eV)
Figure 15. Deconvoluted C 1s high resolution XPS spectra before immersion (a), and after one
day immersion in SBF (b), SBF enriched with BSA (c) and SBF twice enriched with BSA (d).

24
405 400 395
Inte
nsity (
a.u
.)
405 400 395
Inte
nsi
ty
(a.u
.)
Binding energy (eV)
(b)
(a)
Binding Energy (eV)
Figure 16. C1s high-resolution XPS spectra before immersion (a), and after one day
immersion in SBF (b), SBF enriched with BSA (c) and SBF twice enriched with BSA.
In inlay is shown the spectrum recorded from lyophilized BSA.
540 535 530 525
Inte
nsity (
a.u
)
540 535 530 525
Inte
nsity (
a.u
.)
Binding energy (eV)
Binding energy (eV)
(d)
(c)
(b)
(a)
Figure 17. O1s high-resolution XPS spectra before immersion (a), and after one day
immersion in SBF (b), SBF enriched with BSA (c) and SBF twice enriched with BSA.
In inlay is shown the spectrum recorded from lyophilized BSA.
With respect to the evolution of O 1s core level spectra (Fig. 5.28) one remarks symmetric
peaks that are well fitted with a single line, that overlaps the contributions due to the oxygen atoms
25
from the aluminosilicate sample surface, adsorbed –OH groups and peptidic oxygen of BSA [38].
The full width at half maximum of O 1s photoelectron peak recorded from the non-immersed sample
is 2.3 eV and increases to 2.7 eV after immersion in pure SBF and to 2.9 eV after immersion in
BSA-SBF, as well in 3.33 and 6.67 g BSA /1 ℓ SBF solution; the broadening of the full width at half
maximum points out a larger distribution of the oxygen sites.
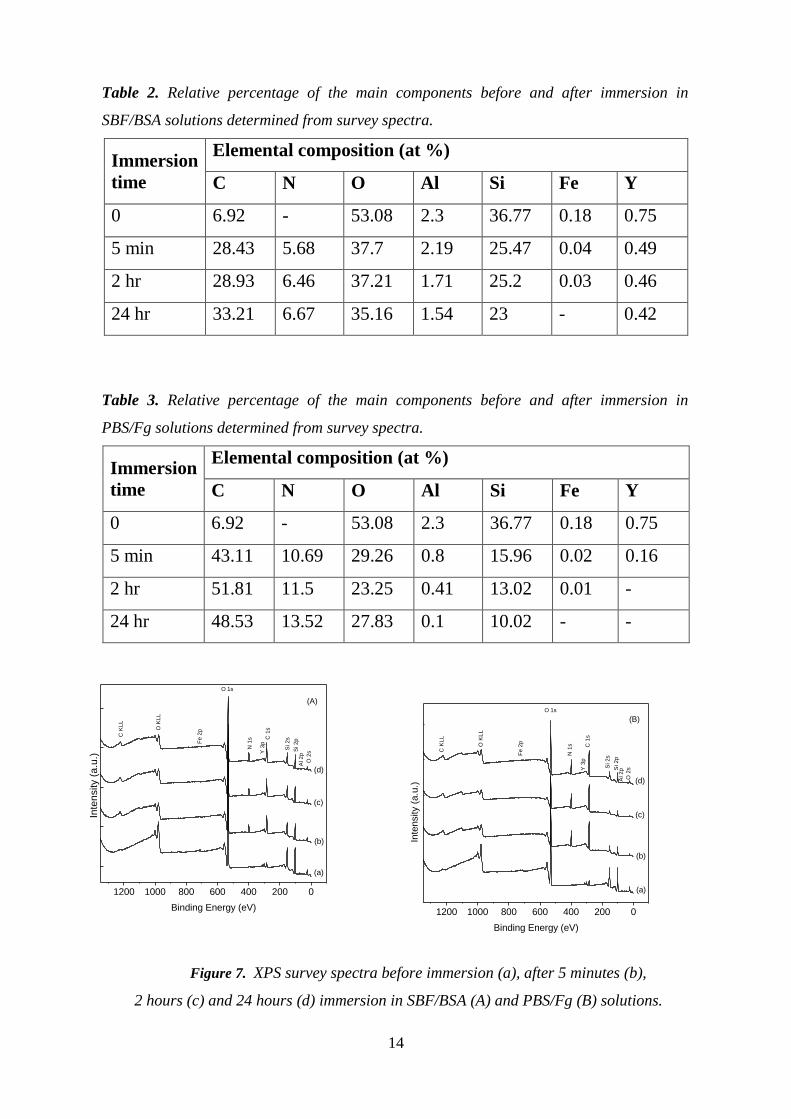
5.1.4 IR results received for 60SiO2 ∙ 20Al2O3 ∙ 20Fe2O3 system
The features of FTIR spectrum recorded from lyophilised BSA introduced into simulated
body fluid it is well evidenced in the FTIR spectrum of the sample immersed for seven days in the
solution containing 6.67 g BSA / ℓ SBF. The deconvolution of amide I absorption band of
lyophilized BSA and of adsorbed BSA on the aluminosilicate sample is presented in Figures 18 A, B,
respectively.
1600 1620 1640 1660 1680 1700
Absorb
ance (a
.u.)
Wavenumber (cm-1)
(A)
1600 1620 1640 1660 1680 1700
Absorb
ance (a
.u.)
Wavenumber (cm-1)
(B)
Figura 18. Deconvolution of amide I absorption band of lyophilized BSA (A) and
adsorbed BSA on aluminosilicate biomaterial (B).
Deconvolution of the native albumin amide I band was made assuming five components,
while for the adsorbed albumin six components are considered. The recent literature [44] regarding a
curve fitting procedure shows that six or five components had to be used for hydrophilic or
hydrophobic surfaces, respectively. The occurrence of a new band around 1610 cm-1
is assignable to
the intermolecular β-sheet structure (or side chain) which is indicative for the aggregation of the
protein. One can observe from the data summarised in Fig. 19 that β-sheet content increases from
27.1 % in lyophilized state to 34.7 % after adsorption, as well as the random conformation from 8.8

26
% to 18 %. In the same time α-helix conformation decreases from 49.7 % to 42 % after adsorption
and the turns from 14.4 % to 4.3 %.
Figure 19. Distribution of secondary structures in bovine serum albumin.
In our measurements, β-sheet/ β-turns ratio exhibit a higher value for the adsorbed protein
compared to the native one, indicating a good biocompatibility of the material, as supported by other
data in literature [44].
BSA adsorption was confirmed by infrared data. XPS spectroscopy clearly appears more
sensitive than FTIR performed in reflectance mode to the changes occurred on the sample surface
after immersion in simulated body fluids [49, 50].

27
Conclusions
- Homogenous aluminosilicate systems containing iron and rare earths (yttrium and
dysprosium) were prepared following the sol-gel route.
- After thermal treatment, the iron preponderantly crystallises as magnetite, but hematite and
maghemite are also developed, expecting a ferromagnetic behaviour. The developed
crystallites are nanosized.
- Magnetic moment measurements as a function of magnetic field approve the expected
ferromagnetic behaviour.
- The temperature dependence of the magnetization shows for ASF and ASFD samples the
Curie temperature close to 430 K and 711 K, respectively.
- After gamma exposure of samples, oxygen hole centres (NBOHC) and peroxy centres were
evidenced by EPR spectroscopy.
- It was evidenced that paramagnetic defects may occur during preparation and can be induced
by gamma exposure, but they disappear while the thermal treatment temperature increases,
denoting that the greater the crystallisation degree the better the stability of the irradiated
samples against the occurrence of structure defects.
- First evidence of microparticles interaction with the protein is the occurrence in the XPS
spectra of N 1s photoelectron signal with increasing intensity during the incubation period
from 5 minutes to 24 hours, and the significant percentage reduction of the elements entering
in the composition of the pristine samples.
- The nitrogen content established already after 5 minutes immersion time indicates the quick
attachment of BSA and fibrinogen onto the microparticles surface.
- After sample incubation in protein solution, the C 1s core level spectra contain components of
binding energies characteristic for peptidic carbons.
- The O 1s signal before immersion in protein solution are related to bridging oxygens (BO) and
non-bridging oxygens (NBO) occurring in the structural units of the aluminosilicate
microparticles.
- The preponderance of BO relative to NBO in these samples supports the expectation of a high
stability in the biological media.
- After immersion in protein solutions, the O 1s photoelectrons correspond significantly to
peptidic oxygen of proteins.
- Diminished oxygen content is detected on the microparticles surface for increasing immersion
periods, because after incubation in protein solutions the aluminosilicate sample, initially with

28
high oxygen content, offers as outmost layer the attached BSA or fibrinogen protein of lower
oxygen content.
- The protein concentration in SBF influences the building up of the BSA layer, but after short
immersion periods the surface is nearly saturated in taking up BSA functional groups
regardless of BSA concentration in SBF.
- The analysis of FTIR absorption bands characteristic for secondary structure of proteins
shows that the β-sheet/β-turns ratio exhibits a higher value for the adsorbed proteins compared
to the native ones, which indicates a good biocompatibility of these materials.
- The attachment of BSA/fibrinogen is proved by the β-sheet structure of amide I at 1650 cm-1
and spectral changes around 1540 cm-1
, assigned to amide II and 1320 cm-1
, assigned to amide
III.
- The results of this study provide evidences that the synthesis of aluminosilicate nanostructured
microparticles containing iron and yttrium/dysprosium can be useful in potential applications
of simultaneous radiotherapy and hyperthermia.
29
Selected References
[1]. S.V. Bhat, Biomaterials, Alpha Science, Harrow U.K. 2005.
[2]. H. F. Hildebrand, N. Blanchemain1, G. Mayer, Y. M. Zhang, O. Melnyk, M. Morcellet and B.
Marte, Key Engineering Materials Vols. 288-289, 47-50, 2005.
[3]. I. D. Xynos, A. I. Edgar, L. D. K. Buttery, L. L. Hench, J. M. Polak, J. Biomed. Mater. Res, 55,
151, 2001.
[4]. L.L. Hench, D.E. Day, W. Holand, V.M. Rheinberger, Glass and Medicine, Int J Appl Glass Sci;
1:104–117, 2010.
[5]. D. Day, Am Ceram Soc Bull; 74: 64-68, 1995.
[6]. J.K. Bibby, N.L. Bubb, D.J. Wood, P.M. Mummery, J Mater Sci: Mater Med; 16:379– 385,
2005.
[7]. V. Simon, D. Eniu, A. Gritco, S. Simon, J Optoelectr Adv Mater ; 9: 3368-337, 1, 2007.
[8]. R.F. Brown, L.C. Lindesmith, D.E. Day, Int. J. Rad. Appl. Instrum B, 18, 783, 1991.
[9]. S.W. Lee, W.D. Reece, Phys. Med. Biol., 50, 151, 2005.
[10]. J.E. White, D.E. Day, Key Eng. Mat., 94-95, 181, 1994.
[11]. M. Kawashita, H. Takaoka, T. Kokubo, T. Yao, S. Hamada, T. Shinjo, J. Ceram. Soc. Jpn., 109,
39, 2001.
[12]. S. K. Alpard et al, Therapeutic hyperthermia, Perfusion, 11, 425-435, 1996.
[13]. J. M. Anderson, B. Bevacqua, A. N. Cranin, D. Whittlesey, Academic Press, London, 415–420,
1996
[14]. M. Baciut, G. Baciut, V. Simon, C. Albon, V. Coman, P. Prodan, St. I. Florian, S. Bran, J.
Optoelectr. Adv. Mat., 9, 2547, 2007.
[15]. M. Goldman, L. Pruitt, J. Biomed Mater Res., 40, 378, 1998.
[16]. E. M. Noah, J. Chen, X. Jiao, I. Heschel, N. Pallua, Biomaterials. 23, 2855, 2002.
[17]. M. Takechi, Y. Miyamoto, Y. Momota, T. Yuasa, S. Tatehara, M. Nagayama, K. Ishikawa, J.
Biomed. Mater. Res. B Appl Biomater., 69, 58, 2004.
[18]. S. Lerouge, C. Guignot, M. Tabrizian, D. Ferrier, N. Yagoubi, L. Yahia, J. Biomed. Mater.
Res., 52, 774, 2000.
[19]. P. D. Nair, J. Biomater. Appl., 10, 121, 1995.
[20]. R. Gref, A. Domb, P. Quellec, T. Bunk, R. H. Muller, J. M. Verbavatz, R. Langer, Advanced
Drug Delivery reviews, 16, 215 – 233, 1995.
[21]. C. C. Berry, S. Adams, G. Curtis, J. Phys. D: Appl. Phys. 36, 198- 206, 2003.
[22]. L. Tang, A.H. Lucas, J.W. Eaton, J Lab Clin Med; 122(3): 292-300, 1993.

30
[23]. L. Tang L, J. W. Eaton, Am J Clin Pathol; 103(4): 466-71, 1995.
[24]. V. Balasubramanian et al., J Biomed Mater Res; 44(3): 253-60, 1999.
[25]. D.L. Griscom, Science and Technology, Eds. G. Pacchioni, L. Skuja and D.L. Griscom, Kluwer
Academic Publishers, p. 117, 2000.
[26]. S.H. Hyun, S.C. Yi, S. G.Kim, J Mat Sci Lett; 15:1384-1387, 1996.
[27]. F. He, W.T. Petuskey, Mater Lett; 63:2631-2634, 2009.
[28]. Y. Sun, L. Duan, Z. Guo, Y. Duanmu, M. Ma, L. Xu, et al., J Magn Magn Mater;285:65-70,
2005.
[29]. V. Simon et al., J. Non-Cryst. Solids 351, 2365-2372, 2005.
[30]. D. Cacaina, H. Ylänen, D. A. Udvar, S. Simon, J. Optoelectr. Adv. Mater., 9, 675, 2007.
[31]. A. Arvidsson, F. Currie, P. Kjellin, Y.T. Sul, V. Stenport, J Mater Sci: Mater Med; 20:1869-
1879, 2009.
[32]. S.L. McArthur, Surf Interface Anal; 38:1380–1385, 2006.
[33]. M. Advincula M, Fan X, Lemons J, Advincula R, Colloid Surface B;42:29-43, 2005.
[34]. A. P. Serro, M.P. Gispert, M.C.L. Martins, P. Brogueira, R. Colaco, B. Saramago, J Biomed
Mater Res;78A:581-589, 2006.
[35]. A. Lebugle, M. Subirade, J. Gueguen, BBA Protein Struct Mol Enzymol; 1248:107-114, 1995.
[36]. D.D. Deligianni, N. Katsala, S. Ladas, Sotiropoulou D, Amedee J, Missirlis YF, Biomaterials;
22:1241-1251, 2001.
[37]. G. Speranza, M. Ferrari, M. Bettinelli, Philos Mag B; 79:2145-2155, 1999.
[38]. G. Iucci, G. Polzonetti, G. Infante, L. Rossi, Surf Interface Anal; 36:724-728, 2004.
[39]. G. Reiter, N. Hassler, V. Weber, D. Falkenhagen, U.P. Fringeli, Biochim. Biophys. Acta 1699,
253-261, 2004.
[40]. G. Falini, E. Foresti, I.G. Lesci, B. Lunelli, P. Sabatino, N. Roveri, Chem. Eur. J. 12, 1968-
1974, 2006.
[41]. W.J. Yang, P.R. Griffiths, D.M. Byler, H. Susi, Appl. Spectrosc. 39, 282-287,1985.
[42]. D.M. Byler, H. Susi., Biopolymers 25, 469-487, 1986.
[43]. C.K. Krishnan, Biomaterials 19, 357-369, 1998.
[44]. S. Tunc, M.F. Mainz, G. Steiner, L. Vazquez, M.T. Pham, R. Salzer, Colloid Surface B:
Biointerfaces 42, 219-225, 2005.
[45]. K. K. Chittur, Biomaterials 19, 357-369, 1998.
[46]. F. Yi, Q. Li, Z.X. Guo, J. Yu, J. Appl. Polymer Sci. 99, 1340, 2006.
[47]. A. Asatekin, S. Kang, M. Elimelech, A.M. Mayes, J. Membrane Sci. 298, 136, 2007.
[48]. T. L. Barr, S. Seal, J. Vac. Sci. Technol. A: Vac. Surf. Films 13, 1239, 1995.

31
[49]. F. Zhang, R.J. Gates, V.S. Smentkowski, S. Natarajan, B.K. Gale, R.K. Watt, M.C. Asplund,
M.R. Linford, J. Am. Chem. Soc. 129, 9252, 2007.
[50]. M.A.Z. Ewiss, Phys.Chem. Glasses 39 (4), 236, 1998.
[51]. V. Simon, D. Muresan, A.F. Takács, M. Neumann, S. Simon, Solid State Ionics 178, 221, 2007.
Acknowledgements
My warmest thanks go to my supervisor, Prof. Dr. Viorica Simon, for the honor and
privilege of being accepted to work in her research group. Her understanding, encouraging and
personal guidance have provided a good basis for the present thesis.
Similarly, I would like to thank Prof. Dr. Simion Simon for useful discussions and good
advices.
My sincere gratitude and thanks goes to my committee members for proofreading of the
thesis: Prof. Dr. Dumitru Luca from A. Cuza University, Iasi; Prof. Dr. Ing. Cătălin Popa from
Technical University, Cluj-Napoca; and to Prof. Dr. Leontin David, Babeş-Bolyai University for
his trust and kindness over the past 8 years.
I also want to thank to all my colleagues who helped me, giving both technical and moral
support.
I am very thankful to all my friends and people from scientific circle that helped me with
different kind of measurements, technical and guiding materials, especially to Camelia Albon from
Bielefeld University, Germany; Răzvan Adam from “Vrije Universiteit” Brussels, Belgium; and
Raluca Marcu from “Istituto Europeo di Oncologia”, Milan, Italy.
My acknowledgements go as well to Prof. Bernard Gallez and his research group for giving
me the opportunity to perform for over one year a research internship at “Université Catholique de
Louvain”, Brussels, Belgium.
I thank my family, my parents Cornelia and Ioan Vanea, for educating me and guiding me to
sciences, for unconditional support and encouragement to pursue my interests.
And in a very special way I thanks with all my heart to my dear and loving husband for the
provided inspiration and energy.
Finally, I acknowledge the financial support of the World Federation of Scientists and
CNCSIS.