Embed Size (px)
Citation preview

UNLV Theses, Dissertations, Professional Papers, and Capstones
12-2011
Spectroscopic methods of process monitoring for safeguards of Spectroscopic methods of process monitoring for safeguards of
used nuclear fuel separations used nuclear fuel separations
Jamie Lee Warburton University of Nevada, Las Vegas
Follow this and additional works at: https://digitalscholarship.unlv.edu/thesesdissertations
Part of the Materials Chemistry Commons, Nuclear Commons, Nuclear Engineering Commons, and
the Radiochemistry Commons
Repository Citation Repository Citation Warburton, Jamie Lee, "Spectroscopic methods of process monitoring for safeguards of used nuclear fuel separations" (2011). UNLV Theses, Dissertations, Professional Papers, and Capstones. 1269. http://dx.doi.org/10.34917/2824167
This Dissertation is protected by copyright and/or related rights. It has been brought to you by Digital Scholarship@UNLV with permission from the rights-holder(s). You are free to use this Dissertation in any way that is permitted by the copyright and related rights legislation that applies to your use. For other uses you need to obtain permission from the rights-holder(s) directly, unless additional rights are indicated by a Creative Commons license in the record and/or on the work itself. This Dissertation has been accepted for inclusion in UNLV Theses, Dissertations, Professional Papers, and Capstones by an authorized administrator of Digital Scholarship@UNLV. For more information, please contact [email protected].

SPECTROSCOPIC METHODS OF PROCESS MONITORING
FOR SAFEGUARDS OF USED NUCLEAR
FUEL SEPARATIONS
By
Jamie Lee Warburton
Bachelor of Science Massachusetts Institute of Technology
2007
A dissertation submitted in partial fulfillment of the requirements for the
Doctor of Philosophy in Radiochemistry
Department of Chemistry College of Sciences
The Graduate College
University of Nevada, Las Vegas December 2011

Copyright by Jamie Warburton 2012 All Rights Reserved

ii
THE GRADUATE COLLEGE We recommend the dissertation prepared under our supervision by Jamie Lee Warburton entitled Spectroscopic Methods of Process Monitoring for Safeguards of Used Nuclear Fuel Separations be accepted in partial fulfillment of the requirements for the degree of Doctor of Philosophy in Radiochemistry Department of Chemistry Ken Czerwinski, Committee Chair Paul Forster, Committee Member Patricia Paviet-Hartmann, Committee Member Ma y Anne Yates, Committee Member Anthony Hechanova, Graduate College Representative Ronald Smith, Ph. D., Vice President for Research and Graduate Studies and Dean of the Graduate College December 2011

iii
ABSTRACT
Spectroscopic Methods of Process Monitoring for Safeguards of Used Nuclear Fuel Separations
by
Jamie Lee Warburton
Dr. Ken Czerwinski, Committee Chair Professor of Chemistry
Chair of the Department of Radiochemistry University of Nevada, Las Vegas
To support the demonstration of a more proliferation-resistant nuclear fuel processing
plant, techniques and instrumentation to allow the real-time, online determination of
special nuclear material concentrations in-process must be developed. An ideal materials
accountability technique for proliferation resistance should provide nondestructive, real-
time, on-line information of metal and ligand concentrations in separations streams
without perturbing the process. UV-Visible spectroscopy can be adapted for this precise
purpose in solvent extraction-based separations.
The primary goal of this project is to understand fundamental URanium EXtraction
(UREX) and Plutonium-URanium EXtraction (PUREX) reprocessing chemistry and
corresponding UV-Visible spectroscopy for application in process monitoring for
safeguards. By evaluating the impact of process conditions, such as acid concentration,
metal concentration and flow rate, on the sensitivity of the UV-Visible detection system,
the process-monitoring concept is developed from an advanced application of
fundamental spectroscopy. Systematic benchtop-scale studies investigated the system
relevant to UREX or PUREX type reprocessing systems, encompassing 0.01-1.26 M U
and 0.01-8 M HNO3. A laboratory-scale TRansUranic Extraction (TRUEX)

iv
demonstration was performed and used both to analyze for potential online monitoring
opportunities in the TRUEX process, and to provide the foundation for building and
demonstrating a laboratory-scale UREX demonstration.
The secondary goal of the project is to simulate a diversion scenario in UREX and
successfully detect changes in metal concentration and solution chemistry in a counter
current contactor system with a UV-Visible spectroscopic process monitor. UREX uses
the same basic solvent extraction flowsheet as PUREX, but has a lower acid
concentration throughout and adds acetohydroxamic acid (AHA) as a
complexant/reductant to the feed solution to prevent the extraction of Pu. By examining
UV-Visible spectra gathered in real time, the objective is to detect the conversion from
the UREX process, which does not separate Pu, to the PUREX process, which yields a
purified Pu product. The change in process chemistry can be detected in the feed
solution, aqueous product or in the raffinate stream by identifying the acid concentration,
metal distribution and the presence or absence of AHA. A fiber optic dip probe for UV-
Visible spectroscopy was integrated into a bank of three counter-current centrifugal
contactors to demonstrate the online process monitoring concept. Nd, Fe and Zr were
added to the uranyl nitrate system to explore spectroscopic interferences and identify
additional species as candidates for online monitoring. This milestone is a demonstration
of the potential of this technique, which lies in the ability to simultaneously and directly
monitor the chemical process conditions in a reprocessing plant, providing inspectors
with another tool to detect nuclear material diversion attempts.
Lastly, dry processing of used nuclear fuel is often used as a head-end step before
solvent extraction-based separations such as UREX or TRUEX. A non-aqueous process,

v
used fuel treatment by dry processing generally includes chopping of used fuel rods
followed by repeated oxidation-reduction cycles and physical separation of the used fuel
from the cladding. Thus, dry processing techniques are investigated and opportunities for
online monitoring are proposed for continuation of this work in future studies.

vi
ACKNOWLEGEMENTS
Many individuals influenced the forming of this document, and I’m thankful for all of
the different perspectives, opinions and fields of expertise that I’ve been able to learn
from throughout this endeavor. My professors, supervisors and colleagues at the
University of Nevada Las Vegas provided me with the facilities, network and instruction
to succeed. Ken Czerwinski, Patricia Paviet-Hartmann, Anthony Hechanova, Mary Anne
Yates and Paul Forster were kind enough to sit on my dissertation committee and fly
from around the world to attend my defense. Additionally, the patience necessary to get
through multiple iterations of this document as committee members should not go
unnoticed. Michelle Bossler and Kris Davidson helped me so many times at UNLV,
from getting me a desk when I first arrived on campus to showing me how to mail a
FedEx envelope when my brain failed during the somewhat tortuous path leading up to
my defense. Thanks for being the go-getters who cut through red tape to get the job done
(gasp!), and for laughing at me when I’m an idiot. Thanks to Nick Smith for paving the
beginning of the path of this project and imparting a tremendous amount of knowledge to
me, and to Amber Wright who spent a tremendous amount of time explaining chemistry
to this nuclear engineer, and without whom this document wouldn’t exist (literally).
Additionally, all radiochemists and nuclear scientists should be lucky enough to have
Tom O‘Dou, Julie Bertoia and Trevor Low as an example to follow for diligence in
safety and laboratory management.
From my internships at Argonne National Laboratory, the Idaho National Laboratory
and General Atomics, thanks to Allen Bakel, John Krebs and Monica Regalbuto (ANL);
Troy Garn, Mitch Greenhalgh, Scott Herbst, Jack Law, Nick Mann, Dave Meikrantz and

vii
Troy Tranter (INL); Tina Back, Tim Bertch, Don McEachern and Bob Schleicher (GA).
To my new supervisors as part of the Nonproliferation Graduate Fellowship Program at
the National Nuclear Security Administration, Marco Di Capua and Rhys Williams – I’m
so very grateful that you’ve supported this endeavor and provided regular, enthusiastic
encouragement for me to finish.
Of course, all the encouragement in the world would not be enough to achieve this
milestone without the love and support of my family and friends. Thank you all so very
much for continuously supporting my endeavors around the country, putting up with my
(sometimes?) headstrong nature and making me the person that I am today. Our dynamic
family is an inspiration to me, and I feel incredibly fortunate to have all of you in my life.
Maj, your patience with me is never-ending. You have encouraged, challenged and
pushed me to choose and pursue my path with confidence and passion. My gratitude and
love for you is endless. To my friends and roommates, thanks for listening to me talk
about safeguards in used nuclear fuel recycling for so long, for cheering me on, and for
looking the other way on my long days and nights with Diet Coke and no showers.
I am deeply appreciative of the financial support I’ve received throughout my
graduate studies. This work was funded by the Nuclear Forensics Graduate Fellowship
Program which is sponsored by the U.S. Department of Homeland Security’s Domestic
Nuclear Detection Office and the U.S. Department of Defense’s Domestic Threat
Reduction Agency, and by the Nuclear Energy University Programs (NEUP) subcontract
No. 89654 from Battelle/INL entitled: Quantification of UV-Visible and Laser
Spectroscopic Techniques for Materials Accountability and Process Control under prime
contract with the Department of Energy No. DE-AC07-051D14517.
viii
TABLE OF CONTENTS
ABSTRACT ....................................................................................................................... iii!
ACKNOWLEGEMENTS .................................................................................................. vi!
LIST OF TABLES ............................................................................................................. xi!
LIST OF FIGURES .......................................................................................................... xii!
CHAPTER 1 INTRODUCTION ........................................................................................ 1!1.1! Project Overview ................................................................................................ 1!1.2! Research Goals.................................................................................................... 2!1.3! Dissertation Outline ............................................................................................ 3!
CHAPTER 2 BACKGROUND .......................................................................................... 5!2.1! Nuclear Fuel Cycles ............................................................................................ 5!
2.1.1! Nuclear Fuel Cycle Challenges ....................................................................... 7!2.2! Used Nuclear Fuel Composition ....................................................................... 11!2.3! Reprocessing Options ....................................................................................... 12!
2.3.1! UREX ............................................................................................................ 14!2.3.2! TRUEX ......................................................................................................... 15!2.3.3! AIROX .......................................................................................................... 18!
2.4! Proliferation Resistance and Safeguards ........................................................... 20!2.4.1! Process Monitoring ....................................................................................... 21!
CHAPTER 3 INSTRUMENTATION AND METHODS ................................................ 24!3.1! UV-Visible Spectroscopy ................................................................................. 24!
3.1.1! Fundamentals ................................................................................................ 24!3.1.2! Sample Preparation and Data Analysis ......................................................... 29!
3.2! X-ray Absorption Fine Structure (XAFS) Spectroscopy .................................. 31!3.2.1! Fundamentals ................................................................................................ 32!3.2.2! Sample Preparation and Data Analysis ......................................................... 33!
3.3! Inductively Coupled Plasma – Atomic Emission Spectroscopy (ICP-AES) .... 35!3.3.1! Fundamentals ................................................................................................ 35!3.3.2! Sample Preparation and Data Analysis ......................................................... 37!
3.4! Titration............................................................................................................. 37!3.4.1! Fundamentals ................................................................................................ 37!3.4.2! Sample Preparation and Data Analysis ......................................................... 38!
3.5! Centrifugal Countercurrent Contactors ............................................................. 38!3.5.1! Fundamentals ................................................................................................ 40!3.5.2! Settings and Options ..................................................................................... 42!
3.6! Raman Spectroscopy ......................................................................................... 44!3.6.1! Fundamentals ................................................................................................ 44!3.6.2! Sample Preparation and Data Analysis ......................................................... 46!
CHAPTER 4 PROCESS MONITORING UNDER UREX CONDITIONS .................... 47!

ix
4.1! Introduction ....................................................................................................... 47!4.1.1! Uranyl Spectroscopy ..................................................................................... 47!4.1.2! Relevance to reprocessing............................................................................. 52!
4.2! Scoping Experiments and Preliminary Application to Reprocessing ............... 55!4.3! High Fidelity Uranyl Nitrate System Studies ................................................... 62!4.4! Experimental Implementation of UV-Visible Process Monitor ....................... 72!4.5! Conclusions ....................................................................................................... 78!
CHAPTER 5 TRUEX EXPERIMENTS .......................................................................... 80!5.1! Introduction ....................................................................................................... 81!
5.1.1! Equipment ..................................................................................................... 83!5.2! Experimental Techniques and Setup ................................................................. 85!
5.2.1! TRUEX Flowsheet ........................................................................................ 85!5.2.2! Demonstration and Data Collection .............................................................. 88!
5.3! Results and Discussion ..................................................................................... 91!5.3.1! Steady-State Determination .......................................................................... 92!5.3.2! Removal Efficiencies .................................................................................... 97!5.3.3! Mass Transfer Stage Efficiency .................................................................... 98!5.3.4! Temperature Profiles ................................................................................... 100!
5.4! Conclusions ..................................................................................................... 104!
CHAPTER 6 DEVELOPMENT OF A DRY PROCESSING FLOWSHEET AND SAFEGUARDS APPROACH ........................................................................................ 107!
6.1! Introduction to EM2 ........................................................................................ 107!6.1.1! EM2 fuel cycle goals ................................................................................... 109!
6.2! Previous dry processing studies ...................................................................... 112!6.2.1! AIROX ........................................................................................................ 114!6.2.2! OREOX and DUPIC ................................................................................... 121!6.2.3! CARBOX/CARDIO ................................................................................... 124!6.2.4! Summary of processing conditions and results ........................................... 125!
6.3! Development of EM2 flowsheet ...................................................................... 128!6.4! Characterization of waste and recycled streams ............................................. 131!6.5! Proliferation resistance in dry processing ....................................................... 134!
6.5.1! Raman spectroscopy for dry process monitoring........................................ 138!6.6! Classification of dry processed waste products .............................................. 144!6.7! Conclusions ..................................................................................................... 148!6.8! Future work ..................................................................................................... 149!
CHAPTER 7 CONCLUSIONS ...................................................................................... 152!7.1! Process Monitoring Under UREX Conditions ................................................ 152!7.2! TRUEX Experiments ...................................................................................... 154!7.3! Dry processing flowsheet and safeguards approach ....................................... 155!
NOMENCLATURE ....................................................................................................... 157!
REFERENCES ............................................................................................................... 158!

x
VITA ............................................................................................................................... 188!!!

xi
LIST OF TABLES
Table 1: Summary of used nuclear fuel treatment options [15] ........................................ 13!Table 2: PUREX and UREX comparison [43-46] ............................................................ 15!Table 3: UREX+ Suite of Processes [52] ......................................................................... 17!Table 4: Conservative estimates of elemental removal by dry processing [60, 61] ......... 20!Table 5: Oxidation states, Raman and UV-Visible wavelengths of common process stream actinides [88] ......................................................................................................... 22!Table 6: Molar absorptivities and Lower Limit of Detection (LLD) for Pu major absorption bands in 1 M HClO4, diluted from 0.005 M Pu stock .................................... 53!Table 7: Comparison of calculated and averaged ICP-AES determined values for U concentration ..................................................................................................................... 63!Table 8: Prepared sample conditions ................................................................................ 64!Table 9: Metal concentration in UREX aqueous feeds ..................................................... 73!Table 10: Summary of UREX aqueous feed variables ..................................................... 73!Table 11: Aqueous feed target and actual compositions .................................................. 87!Table 12: TRUEX demonstration sample plan summary ................................................. 90!Table 13: Detection limits for ICP-MS metals analysis ................................................... 92!Table 14: Percentage of metals in effluent streams just prior to shutdown and calculated removal efficiencies. ......................................................................................................... 97!Table 15: Individual stage efficiencies for selected stages. ............................................. 99!Table 16: Selected boiling points reported for fission products [192]............................ 119!Table 17: Mean observed removal fractions of selected elements under CARDIO [194]......................................................................................................................................... 125!Table 18: EM2 dry process flowsheet fission product removal goals ............................. 129!Table 19: Selected summary of EM2 used fuel at Discharge, 5 and 10 years ................ 132!Table 20: Summary of selected elements present in EM2 discharge fuel ....................... 132!Table 21: Isotopes expected in LWR dry processing waste and recycled streams in quantities greater than g/MTHM with half lives greater than 100,000 years ................. 134!Table 22: Selected elements in used nuclear fuel and relative concentrations ............... 138!Table 23: Vibrational frequencies (cm-1) of UO2(NO2)·2TBPO [213] .......................... 141!Table 24: Resulting wastes from AIROX plant [57] ...................................................... 147!

xii
LIST OF FIGURES Figure 1: Nuclear fuel cycle schematic [10] ....................................................................... 6!Figure 2: 2003 UNF inventory by state [24, 25] ................................................................. 9!Figure 3: Approximate mass distribution of LWR used nuclear fuel ............................... 12!Figure 4: TBP molecule [51] ............................................................................................ 16!Figure 5: CMPO molecule [51] ........................................................................................ 16!Figure 6: Schematic of potential solvent extraction UNF reprocessing scheme ............. 17!Figure 7: Diagram of UV-Visible system [91] ................................................................. 27!Figure 8: UV-Visible spectra of 0.11 M U in ~2 M HNO3 .............................................. 28!Figure 9: Peak ratio example comparing 403 and 426 nm over a range of [HNO3] [89] 30!Figure 10: Segment of Advanced Photon Source synchrotron [114] ............................... 33!Figure 11: XAFS sample holders ...................................................................................... 35!Figure 12: ICP-AES diagram [116] .................................................................................. 36!Figure 13: Cutaway view of CINC V-02 contactor [121] ................................................ 40!Figure 14: Example Diagram of Countercurrent Centrifugal Contactors [125] ............... 41!Figure 15: Residence time as a function of flowrate in the V-02 CINC contactor [121] . 43!Figure 16: Molecular vibration modes [91] ...................................................................... 45!Figure 17: Molecular orbital diagram of uranyl ion [139] ................................................ 49!Figure 18: UV-Visible Absorbance of 0.63 M U at 0.01 M HNO3, 0.1 cm pathlength ... 51!Figure 19: Fiber optic dip probe range study with UO2
2+ ................................................ 56!Figure 20: Effect of addition of NH4OH on UV-Visible spectra ..................................... 57!Figure 21: UV-Visible absorption spectra of Nd solution showing the time response study with fiber optic dip probe .................................................................................................. 58!Figure 22: Resolution studies of uranyl nitrate solutions (0.023 to 0.115 M) with the fiber optic dip probe in Swagelok flow cell .............................................................................. 59!Figure 23: Fiber optic dip probe mounted in aqueous product outlet ............................... 60!Figure 24: UO2
2+ growth in UREX product stream [154] ................................................ 61!Figure 25: Inverse relationship between strip flow rate adjustment and UO2
2+ concentration seen in aqueous product stream [154] ........................................................ 62!Figure 26: UV-Visible Absorbance of 0.126 0.02 M U at 0.01-8 M HNO3, 0.1 cm pathlength .......................................................................................................................... 64!Figure 27: Example ICP-AES calibration curve ............................................................... 65!Figure 28: UV-Visible absorbance of 1.26 0.10 M U at 0.01-5 M HNO3, 0.1 cm pathlength .......................................................................................................................... 66!Figure 29: UV-Visible Absorbance of 0.01-1.26 M U concentrations at 0.01 M HNO3, 0.1 cm pathlength .............................................................................................................. 68!Figure 30: UV-Visible Absorbance of 0.01-1 M U concentrations at 7 M HNO3, 0.1 cm pathlength .......................................................................................................................... 69!Figure 31: UV-Visible Absorbance of 0.01-1.26 M U at 3 M HNO3, 0.1 cm pathlength 70!Figure 32: Molar absorptivities at 414 nm for uranyl in varied nitric acid solutions ....... 71!Figure 33: Bench of 3 V-02 contactors at UNLV ............................................................. 72!Figure 34: UV-Visible absorbance of uranyl peaks over time under UREX process conditions .......................................................................................................................... 74!Figure 35: ICP-AES measured metal concentrations over time in the aqueous product of a UREX extraction (0-17 minutes) and strip (17-37 minutes) ............................................ 75!

xiii
Figure 36: Peak ratios over time in UREX extraction and strip ....................................... 76!Figure 37: Foaming in organic interstage tubing .............................................................. 77!Figure 38: No foaming in aqueous interstage tubing ........................................................ 78!Figure 39: Thirty stage centrifugal contactor pilot plant .................................................. 84!Figure 40: Typical fluid feed system with components .................................................... 85!Figure 41: Contactor pilot plant flowsheet diagram ......................................................... 86!Figure 42: Foaming evident in interstage tubing throughout pilot plant .......................... 89!Figure 43: Steady-state plots for raffinate outlet .............................................................. 93!Figure 44: Approach to steady-state at strip product outlet .............................................. 94!Figure 45: Lanthanide concentration profile across the cascade in organic phase at steady-state ................................................................................................................................... 95!Figure 46: Concentration profiles for fission products across the cascade in aqueous phase at steady-state .......................................................................................................... 96!Figure 47: Aqueous and organic phase temperature (°C) profile averaged across respective extraction, scrub and strip sections ................................................................ 101!Figure 48: Temperature profile of solution outlets and ambient laboratory ................... 102!Figure 49: Used nuclear fuel accumulation scenarios .................................................... 110!Figure 50: Elemental makeup of LWR and EM2 used fuel [180] ................................... 112!Figure 51: Sample AIROX flowsheet [57] ..................................................................... 115!Figure 52: Summary of maximum removal percentages reported in the literature for dry
................................................ 126!Figure 53: Literature reported removal percentages for elements with maximum reported percentages of ....................................................................................................... 127!Figure 54: Summary of removal percentages for elements with maximum removal percentages between 65% and 75% ................................................................................ 128!Figure 55: Flowsheet for dry processing of used nuclear fuel for recycle into EM2 ...... 130!Figure 56: Normalized elemental composition of recycled and waste streams from dry processing of LWR discharge ......................................................................................... 131!Figure 57: [UO2(NO3)3]- molecule [14] ......................................................................... 142!Figure 58: [UO2Cl4]2- molecule [14] .............................................................................. 142!

1
CHAPTER 1
INTRODUCTION
1.1 Project Overview
This project was developed for the purpose of utilizing UV-Visible spectroscopy
in a process monitoring setting to provide a method for confirming and tracking
chemistry in solvent extraction separations of used nuclear fuel. The direct application of
this is for an increase in the proliferation resistance of nuclear fuel reprocessing through
both materials accountability and process monitoring. This project fits into the overall
task of the investigation of optical techniques for on-line materials accountability in the
used nuclear fuel treatment processes.
UV-Visible spectroscopy can be utilized in an on-line fashion to directly measure
the concentrations of special nuclear materials, thus allowing real-time accountability and
tracking for the solvent extraction processes. UV-Visible spectroscopy is an optical
technique that is attractive for online monitoring applications because it permits on-line,
real-time analysis of a solution and is easily adaptable to multiple sampling geometries.
The implementation of UV-Visible spectroscopy for concentration measurements in
flowing systems has been demonstrated at the laboratory-scale [1-4]. Therefore, the
fundamental basis for this project is proven, and coupled with the radiation-tolerance
potential of the setup [5, 6], this technology provides a great opportunity to
simultaneously and directly monitor chemical process conditions as well as
concentrations of special nuclear materials. In order to achieve this objective, the UV-
Visible spectroscopic technology, used nuclear fuel composition, reprocessing options,

2
solvent extraction equipment technology, U spectroscopy and spectral attribution
methods must be studied and understood.
1.2 Research Goals
The preliminary purpose of this research is to evaluate the effectiveness of UV-
Visible spectroscopy in a process monitoring setting to track U through a UREX
reprocessing scheme. As such, detection limits, process conditions and metal speciation
relevant to UREX are studied in a systematic fashion. This evaluation includes
determining the impact of process conditions, such as acid concentration and flow rate,
on the sensitivity of the UV-Visible detection system. Understanding this relationship
will enable an online materials accountability system as well as provide an attribution
methodology for identifying diversion scenarios.
Following the success of the uranyl nitrate UV-Visible spectroscopic study, the
spectroscopic methods for the evaluation of actinide concentrations and solution
conditions are expanded to other used fuel treatment schemes such as TRUEX and
AIROX (dry processing). Aspects of this research effort are investigated in the UNLV
laboratory, Argonne National Laboratory, Idaho National Laboratory and at General
Atomics.
The primary goal of this project is to understand fundamental UREX and PUREX
reprocessing chemistry and corresponding spectroscopy for application in process
monitoring for safeguards. Due to the impact of process chemistry on the molar
absorptivity of U, the potential application of UV-Visible spectroscopy as an online
technique for materials accountability must be examined separately for the relevant
conditions of 0.01-1.26 M U and 0.01-8 M HNO3. The limits of quantization, including

3
the impact of process chemistry (metal, nitrate and acid concentrations) are explored to
determine suitability of these techniques for real-time interrogation of the process
streams. The potential for applying the qualitative spectroscopic information to evaluate
the chemical environment of the process stream is also examined.
The secondary goal of the project is to simulate a diversion scenario in UREX (a
change to PUREX conditions) and successfully detect changes in metal concentration and
solution chemistry in a centrifugal counter-current contactor system with a UV-Visible
spectroscopic process monitor. Towards this end, the UREX and PUREX solvent
extraction flowsheets are investigated and compared, a benchtop scale pilot plant for a
cascade of solvent extraction separations is designed and constructed, and a UREX to
PUREX flowsheet conversion experiment is performed. Parameters monitored in this
experiment as indicators of a potential diversion are flow rate modification, acid
concentration, and concentration of the complexant/reductant AHA. Perturbations in the
UV-Visible spectroscopy of the flowsheet product are correlated with known process
changes to show that these diversion attempts can be detected in real time.
Finally, these studies are extrapolated to propose and demonstrate feasibility of
process monitoring for safeguards used in other reprocessing flowsheets such as TRUEX
and AIROX, to be studied more extensively in the future. Fundamental investigations are
performed to consider the effects of metal interferences, temperature and the presence of
other ligands on flowsheet performance and thus potential process monitors.
1.3 Dissertation Outline
Chapter 1 presents the project goals and dissertation overview. Chapter 2 provides an
extensive background and review of prior work for the topics covered in this dissertation,

4
including the nuclear fuel cycle, used nuclear fuel treatment options, details of the
processes relevant to this work and process monitoring for safeguards. Chapter 3 outlines
the instrumentation and methods used in this research, with further experimental details
on the application of these procedures given in Chapters 4-6. Each of Chapters 4-6 is
presented in manuscript format, subdivided into sections of introduction, experimental,
results, conclusions and discussions on future work. Chapter 4 discusses safeguards
relative to UV-Visible spectroscopy in UREX. Chapter 5 covers a TRUEX
demonstration, and Chapter 6 presents information relevant to dry processing. Chapter 7
provides a general summary of the conclusions discussed in previous chapters, and
reviews options for future research areas.

5
CHAPTER 2
BACKGROUND
An overview of nuclear fuel cycles (NFCs), used nuclear fuel (UNF) compositions,
treatment options for UNF recycling and proliferation resistance in NFCs is provided
within this chapter. The motivation for the research in this dissertation is to provide
opportunities for safeguards in used nuclear fuel recycling scenarios. As such, the
composition of discharged fuel, relevant used nuclear fuel treatment methods and
previous research on process monitoring for safeguards must be understood and
discussed.
2.1 Nuclear Fuel Cycles
As energy demands soar, nuclear power's ability to provide baseload electricity
becomes increasingly attractive resulting in the construction and licensing of more
nuclear power reactors. In turn, these reactors generate used nuclear fuel which
revitalizes the interest in modifying the U.S. open nuclear fuel cycle and utilizing a
reprocessing scheme. Nuclear energy’s presence in the U.S. energy portfolio and the
choice of fuel cycle are crosscutting issues encompassing fundamental and applied
science and engineering, energy independence and national security, and as such they are
topics of discussion in multiple realms including academia, private industry and state and
federal governments [7-9]. Thus, the development and advancement of all aspects of
nuclear fuel cycles are rich areas for research.
There are several potential nuclear fuel cycles, generally identified as “open,”
“modified open” or “closed.” Figure 1 illustrates all potential parts of a nuclear fuel

6
cycle. An “open” or “once-through” cycle would begin with U mining and milling, move
to UF6 conversion, enrichment, fuel fabrication, nuclear power generation, used fuel
storage, and then proceed directly to final disposal. A “modified open” cycle would be
the same as the “open” cycle from mining through used fuel storage, but then utilize
some form of used fuel partitioning or reprocessing, such as dry processing or fast reactor
burning, and then proceed to both new fuel fabrication and final disposal.
Figure 1: Nuclear fuel cycle schematic [10]

7
A “closed” cycle would be the same as the “open” and “modified open” through used
fuel storage, however then all of the fuel would go through a reprocessing scheme, with
extensive portioning allowing for new fuel fabrication, fast reactor transmutation and
only HLW being sent to a repository for final disposal. Within these general fuel cycles,
there are various methods and options at each step, for example there are many ways of U
mining and milling [11], approaches to transmutation in both thermal and fast reactors
[12], and a plethora of used fuel treatment or reprocessing options [13-18].
One assumption for the future U.S. nuclear fuel cycle, as described in U.S. policy
defining Generation IV reactors, is that in order for any reprocessing scheme to be
adapted successfully, it will need to utilize sufficient safeguards against proliferation [19,
20]. Towards this end, in addition to off-the-shelf technologies that can be used for
process monitoring such as pH meters, mass balances, flow rate meters and temperature
controllers, online UV-Visible spectroscopy can be used to effectively monitor certain
radionuclide concentrations along with process chemistry, yielding real-time results.
Some competitive techniques have been proposed [21], but few offer the real-time, online
capability under reprocessing conditions combined with speciation sensitivity provided
here.
2.1.1 Nuclear Fuel Cycle Challenges
As long as nuclear power has been used to generate electricity, "the management of
the radioactive wastes produced in the course of electricity generation from nuclear
fission [has been] a problem of concern to the electric-power sectors, governments and
publics of all of the 25 nations that obtain some of their electricity in this way, as well as
to people in other countries who might be affected by choices about how and where such

8
wastes will be shipped, processed and store [22]." Concerns about the safety of the
nuclear fuel cycle have always been at the forefront of public and policy-maker resistance
to the expansion of nuclear energy. These concerns, combined with those in regards to
radioactive wastes and weapons proliferation played a major role in the decline of nuclear
energy's prospects in the U.S. in the 1970s and 1980s. Specifically, "decisions in the late
1970s to defer indefinitely the reprocessing of used fuel, to discourage the transition to
breeder reactors, and to forbid the export of enrichment and reprocessing
technologies…were motivated by the concerns of the administration about nuclear-
weapons proliferation [22]." More recently, the goals in the nuclear fuel cycle have
shifted, likely due to increased energy demands, and now look to ensure that U resources
are efficiently utilized and electricity supplies are guaranteed in the future. In fact, many
believe that the establishment of a closed nuclear fuel cycle is one of the most important
issues from the viewpoints of long-term energy supply with "high reliability, reduction of
environmental impact due to radioactive waste disposal, and cost reduction for nuclear
power generation [23]."

9
0
1000
2000
3000
4000
5000
6000
7000
AL
AZ
AK
CA CT FL GA IL IA KS
LA ME
MD
MA MI
MN
MS
MO
NE
NH NJ
NY
NC
OH
OR
PA SC TN TX VT WA
WI
UN
F In
vent
ory
(MTU
)
State
Figure 2: 2003 UNF inventory by state [24, 25]
Currently, no commercially generated used fuel is reprocessed in the U.S., therefore it
is all stored in various forms across the country (Figure 2). A small commercial
reprocessing plant was operated in New York from 1966 to 1972, but was closed for
modifications and expansion in 1972 and never reopened. A second commercial
reprocessing plant in Illinois did not work properly during testing and was shut down
without ever going into commercial operation, and lastly a third plant in South Carolina
was completed but did not operate [22]. Thus, in general, the used fuel generated at the
operating commercial nuclear reactors in the U.S. is stored at the reactor sites, making

10
used fuel treatment or disposition a pressing matter (Figure 2). The 11 March 2011
Tohuku 9.0 earthquake and resulting tsunami experienced at the Fukushima Daiichi plant
in Japan has also increased interest internationally in the issue of UNF storage. In the
BWR Mark 1 design used at the Daiichi site, the spent fuel pools are located well above
ground and suffered varying loss of coolant scenarios [26]. Due to their location, the
spent fuel pools at Fukushima Daiichi were more susceptible to damage to hydrogen
explosions as compared to below-grade spent fuel storage. In general, some amount of
spent fuel storage is necessary at all reactor sites for immediate cooling of fuel upon
removal from the reactor core. However, if spent fuel were stored at a centralized facility
offsite after sufficient on-site cooling, the quantity of the spent fuel stored in the pools
would be greatly reduced, mitigating much of the potential risks of damage to spent fuel
pools in accident conditions, regardless of their location at the reactor site [27].
In contrast to commercial used nuclear fuel, defense high level waste (HLW) is stored
in tanks at three federal facilities: the Hanford Nuclear Reservation (Richland,
Washington) and the Savannah River Laboratory (Aiken, South Carolina), both of which
operated reprocessing plants for the weapons-material production reactors on the
respective sites; and the Idaho National Laboratory (Idaho Falls, Idaho), which has
reprocessed naval-reactor fuel [22].
One of the main benefits of closing the nuclear fuel cycle is that recycling provides
utilities with an additional source of domestic nuclear fuel, thus providing a hedge against
global U prices and promoting energy security [28]. Additionally, recycling "allows for
early movement of freshly discharged used fuel from utilities' sites…and provides more
efficient use of geologic repositories, avoiding the need for an additional repository

11
beyond this century and expanding repository options [28]." Recent events at the
Fukushima nuclear plant in Japan have brought renewed interest in moving used nuclear
fuel away from reactor sites for storage. Lastly, in speculating beyond current U.S.
policy, recycling of light water reactor (LWR) used fuel could impact the whole nuclear
fuel cycle by reducing the number of fast reactors needed to burn minor actinides [28].
2.2 Used Nuclear Fuel Composition
Literature is available on computer modeled and actual radionuclides in a LWR core
and the resulting gaseous, liquid and solid chemical species present both during normal
operation, under accident conditions and at discharge [29, 30]. Nominally, LWR
discharge fuel is assumed to have 60 GWd/t burnup and have the general composition of
95% U, 1% Pu and minor actinides, and 4% fission products, with a mass distribution
shown in Figure 3 [31, 32]. The variations in reactor type, initial fuel composition and
loading, burnup, core life and decay time prevent more specific generalizations on these
characteristics, however the composition estimates should remain approximately the
same even within these variables. Numerous databases and inventories are available for
specific used nuclear fuel compositions, and a number of computer codes, such as
ORIGEN, are available for calculating isotopically detailed nuclide transmutation,
radiation emission characteristics and decay heat of irradiated nuclear fuel [33-36].

12
0
1
2
3
4
5
6
7
85 93 100 106 116 126 136 143 150 154 241
kg/M
TUN
F
Atomic Mass (g/Mol)
Figure 3: Approximate mass distribution of LWR used nuclear fuel
2.3 Reprocessing Options
Reprocessing originated during the Manhattan Project in which two broad approaches
were used: isotopic enrichment to concentrate fissile 235U from natural U and
transmutation of 238U to produce fissile 239Pu. At the time, the bismuth phosphate process
was developed based on carrying Pu along with other metals in solution as precipitates,
and other classical separation methods were studied such as ion exchange and solvent
extraction [37]. Historically, reprocessing has existed in many countries such as the UK
(Butex and THORP at Sellafield), France (PUREX at Marcoule and La Hague), Germany
(WAK at Karlsruhe), Belgium (Eurochemic at Mol), Russia (Mayak) and Japan

13
(Rokkasho). All of these reprocessing operations have investigated and/or demonstrated
chemical processes such as bismuth phosphate precipitation, ion exchange or solvent
extraction [36].
Proliferation resistance relies on the knowledge of the nuclear fuel cycle under
consideration, therefore successful safeguards must be tailored for each separations
process within a nuclear fuel cycle. France has a relatively long reprocessing history, and
lessons can be learned from both the separations processes and opportunities for special
nuclear materials safeguards. For example, the separation activities at La Hague result in
about two truck shipments per week of separated Pu to the Melox MOX fuel fabrication
plant at Marcoule [38].
Generally, used nuclear fuel separations efforts are geared towards first separating
actinides from fission products, and then separating individual actinides. To begin,
processes such as URanium EXtraction (UREX) exploit the large differences between the
chemistry of the actinides and fission products to accomplish separations [39]. The
exception to this generalization is the separation of the transplutonium actinides from the
lanthanide fission products. Actinide/lanthanide separations are achieved through
processes such as TRansURanic EXtraction (TRUEX) and Trivalent Actinide Lanthanide
Separation by Phosphorous reagent Extraction from Aqueous Komplexes (TALSPEAK).
Table 1: Summary of used nuclear fuel treatment options [15]
Aqueous Processes Pyroprocesses
Solvent extraction (PUREX, UREX, TRUEX, etc.)
Pyrophysical fractionation (AIROX, CARBOX, fluoride volatility etc.)
Ion exchange Pyrochemical fractionation (electrorefining, molten salt electrolysis, etc.)
Electrolysis (Flurex) Precipitation (Bismuth Phosphate)

14
Over 30 alternative approaches have been suggested for reprocessing used nuclear
fuel, but all of these can be classified as either an aqueous processes or pyroprocesses.
Solvent extraction, ion exchange, photochemical induced separation, precipitation and
electrolytic separation fall within the aqueous process category and these processes are
generally geared toward oxide fuels (Table 1). Pyroprocesses, both pyrophysical and
pyrochemical, are molten salt electrorefining techniques applied to metal fuels [40].
Although there are such a large number of reprocessing options, in the U.S. advanced
technologies were investigated with the goals of safely and economically reducing the
volume and heat generation of material requiring geologic disposition by separating key
radionuclides from used fuel [41]. Therefore, processes such as UREX and TRUEX
have been studied more extensively than other options as they are expected to have
greater potential for application in the U.S.
2.3.1 UREX
The UREX process is based on the PUREX (Plutonium Uranium EXtraction) process.
In the first extraction step of UREX, U and Tc in the feed are extracted into the solvent,
then in the scrub section, other extractable species are scrubbed from the solvent and
finally in the strip section, the solvent is stripped of the U and Tc yielding an aqueous
product stream [42]. The solvent for the UREX process itself is the typical PUREX
solvent, tributyl phosphate (TBP) in n-dodecane, however the feed of dissolved UNF is
held at a lower concentration of nitric acid and acetohydroxamic acid (AHA) is added to
enhance the complexation of Pu and Np and increase the extractability of pertechnetate
ion (Table 2). These differences (acid, nitrate and AHA concentration) between PUREX

15
and UREX are what will be exploited in this work. Further process details are presented
in Chapter 4.
Table 2: PUREX and UREX comparison [43-46]
Component UREX PUREX [H+] 0.5 – 2.0 M 3.5 – 5.0 M
[NO3-] 3.0 – 4.5 M 6.0 – 8.0 M
[AHA] 0.1 - 1 M 0 M
As PUREX and UREX have been at the forefront of reprocessing efforts, the
extraction of uranyl nitrate by TBP has been studied extensively [47, 48]. Generally,
nitrates are extracted by TBP in the neutral form, always solvated by a definite number of
TBP molecules. The compounds formed range from hydrated to almost unhydrated [47].
As for the oxidation state of U, in addition to the dominant U(VI) in used fuel, any U(IV)
will also complex to TBP and be extracted from a nitric acid solution in a reprocessing
scheme, and this resulting uranyl(IV) nitrate in TBP system has been studied [48, 49]. In
fact, seven different U (IV) species have been identified in TBP solutions via absorption
spectroscopy including U(NO3)4(TBP)2, UOH(NO3)3(TBP)2, [U(NO3)6]2-, a species
containing the U4+ ion solvated with TBP and three distinct uranium perchlorate species
[49]. The extraction behavior and expected oxidation state of U in UREX is of
importance to this work as the process monitoring concepts proposed are sensitive to
chemical environment and coordination chemistry of metals.
2.3.2 TRUEX
The UREX process is often proposed to precede other extraction processes, such as
TRUEX [50]. In TRUEX, a CMPO (Octyl(phenyl)-N,N-

16
diisobutylcarbamoylmethylphosphine oxide)/TBP (TriButylPhosphate) in n-dodecane
diluent is used to extract actinides and lanthanides from fission products (Figure 4 and
Figure 5), a scrub section removes any fission products that may have extracted into the
organic phase, and a strip section returns the extracted metals to the aqueous phase
product.
Figure 4: TBP molecule [51]
Figure 5: CMPO molecule [51]
Extensive TRUEX process details are presented in Chapter 5. One of the systems that
has been studied extensively for used fuel treatment is the UREX+ process (Figure 6)
which is fundamentally a series of 5 solvent-extraction flowsheets that perform the
following separations. The first flowsheet accomplishes recovery of Tc and U (UREX).
Next, Cs and Sr are recovered in FPEX. NPEX follows, which recovers Pu and Np.
Next, Am, Cm and the rare-earth fission products are separated from other fission

17
products through TRUEX. Finally, separation of Am and Cm from the rare earths is
achieved through Cyanex 301 or TALSPEAK. In general, each of the processes shown
in Figure 6 has an extraction, scrub and strip section.
Figure 6: Schematic of potential solvent extraction UNF reprocessing scheme
Individual processes such as UREX, FPEX and NPEX are often linked together to
form a complete flowsheet for used fuel treatment. When connected together, these
flowsheets are designated as UREX+ and several combinations of processes and resulting
flowsheets are possible (Table 3). Several of these proposed flowsheets such as
UREX+1a, UREX+2 and UREX+3a have been demonstrated at the bench scale at
Department of Energy labs in the U.S. with both simulated used fuel and actual used fuel
[44, 45, 50].
Table 3: UREX+ Suite of Processes [52]
Process 1st Product
2nd Product
3rd Product
4th Product
5th Product 6th Product 7th
Product UREX+1a U Tc, I Cs, Sr FPs TRUs UREX+2 U Tc, I Cs, Sr FPs Pu, Np Am, Cm, Ln UREX+3a U Tc, I Cs, Sr FPs Pu, Np Am, Cm UREX+3b U Tc, I Cs, Sr FPs U, Pu, Np Am, Cm UREX+3c U Tc, I Cs, Sr FPs U, Pu Am, Np, Cm UREX+4a U Tc, I Cs, Sr FPs U, Pu, Np Am Cm UREX+4b U Tc, I Cs, Sr FPs U, Pu Am, Np Cm
URE
FPEX NPE
TRUEX TALSPEAK
Dissolved UNF
U & Tc Cs & Sr Np & Pu Non An/Ln FPs An, Ln

18
Head-end steps are often proposed for treatment of UNF before introduction into the
processes and flowsheets such as UREX and UREX+3a. These head-end steps allow for
physical separation of UNF from cladding, removal of volatile and gaseous fission
products, and pulverization for easier dissolving into the aqueous feed of the solvent
extraction flowsheet. AIROX is one such head-end step, and has also been proposed as a
used fuel treatment process in itself, without subsequent solvent extraction operations.
2.3.3 AIROX
As an addition or alternative to solvent extraction based separations for used nuclear
fuel treatment, dry recycle technologies have been researched as part of the Integral Fast
Reactor (IFR) program, for general fuel cycle use, for application in the DUPIC/CANDU
fuel cycle and as a disposition pathway for weapons stockpiled materials (AIROX,
Dmitrograd Dry process, CARBOX, OREOX, etc). In each process, fission products are
partially removed and there is limited segregation between the TRUs [39, 53, 54]. The
Dmitrograd Dry Process (DDP) and IFR processes rely on selective electrotransport of
mixed TRU, whereas the AIROX/OREOX/CARDIO/DUPIC rely on oxidation-reduction
at pyrochemical temperatures of 400-600°C, with some ventures to higher temperatures,
depending on the application. The DDP has been demonstrated with many thousands of
fuel pins recycled with a variety of burnups including up to 173,000 MWd/t [55]. The
more common dry processing technologies such as AIROX and OREOX have been
investigated at various theoretical and experimental levels for decades by countries such
as South Korea, Canada and the United States [56]. Research efforts in this dissertation
focus on processes that have shown potential for deployment, so the demonstration of dry
processing technologies at the laboratory and larger scales is an important criterion.

19
Dry processing schemes have an inherent benefit over wet processing schemes in that
the proliferation resistance is greatly increased due to no chemical separations, flowing
fissile material or fissile-fertile separations. Additionally, the processes cannot be easily
modified to allow U/Pu separations and due to the higher radioactivity in the used fuel
that is dry recycled, even after blending with virgin fissile material, the fuel must be
remotely handled. In turn, this can be seen as a downside to dry processing as it also
means that fuel fabricated and inspection must proceed remotely as well [57]. Also,
after a dry processing recycle, a slightly higher fissile content of fuel is required for
blending with the processed used fuel as compared to wet reprocessing [58].
A general dry process as applied to the LWR oxide case, used fuel pins are
mechanically removed from the fuel assembly, mechanically punctured and then exposed
to oxygen at 400°C where the UO2 is converted to U3O8, achieving a volume expansion
of approximately 30% which completely ruptures the cladding. Volatile and semi-
volatile fission products are removed in various fractions by flowing gas over the
oxidized used fuel under a variety of temperatures. The U3O8 is reduced under hydrogen
at 600°C to UO2, at which point the powder can be mixed with enriched UO2, resintered
and refabricated into new fuel. The oxidation and reduction steps may be repeated
multiple times to ensure complete pulverization of the used fuel and release of volatile
fission products [59]. Higher temperature treatments with a variety of flowing gases can
be utilized to achieve additional fission product removal beyond conservative fission
product removals (Table 4). When applied to LWR discharge, dry processing can reduce
the current inventory of material destined for geologic repository burial, with the exact
amounts being dependent on the selected process and UNF composition.

20
Table 4: Conservative estimates of elemental removal by dry processing [60, 61]
Element Removal % K, Xe, I, C 100
Cs, Ru 90 Te, Cd 75
Overall, the goals of any fuel cycle are to reduce the mass of UNF needing to be
disposed of as HLW, extract more energy from the original U ore and potentially deplete
weapons-material inventories, while maintaining a high level of proliferation resistance
[62]. Regardless of wet or dry processing method, demonstrable safeguards, materials
accountability and diversion detection capabilities will be necessary.
2.4 Proliferation Resistance and Safeguards
The International Atomic Energy Agency (IAEA) is the world's center of cooperation
in the nuclear field. It was set up in 1957 as the "Atoms for Peace" organization within
the United Nations family, and now works worldwide to promote safe, secure and
peaceful nuclear technologies [63, 64]. The IAEA has established international
safeguards standards for fissionable materials at used fuel reprocessing plants. The
overarching goal is to ensure that significant quantities of weapons-grade nuclear
material are not diverted over a specified time frame. As a result of the international
emphasis on nuclear safeguards, characterization and comparison of the proliferation
resistance of reactors, used fuel treatment options and fuel cycles in general is
commonplace [65-69]. Process monitoring and analysis of collected samples, along with
containment and surveillance, can maintain U and Pu accountancy through a reprocessing
scheme. Theoretical proliferant diversions would be accomplished via deliberate

21
modification of the flowsheet chemistry, so by confirming proper operational
performance and verifying process integrity throughout the reprocessing scheme, these
diversions can be avoided. Online, real time, multiparametric monitoring of the
radiochemical streams in any reprocessing flowsheet can provide rapid detection of
unwanted and/or suspect deviations from normal operation conditions. In order for this
type of monitoring to have the potential for deployment in an actual reprocessing plant,
the monitor must be robust, not interfere with the process, be nondestructive and
relatively straightforward to apply and maintain.
2.4.1 Process Monitoring
Process monitoring has already been used in various aspects of the nuclear industry,
such as in the tracking of radioactive gaseous waste released at Rokkasho and in the in
situ X-ray absorption spectroscopy of U(VI) in molten LiCl-KCl eutectic [70, 71].
Investigation of failed fuel elements has been proposed through online monitoring of
reactor coolants [72, 73]. Online determinations of acid, nitrate and metal concentrations
have been studied through various titrimetric and photometric techniques, with varying
success [74-77]. The emphasis in these previous online spectrophotometric studies has
been to simply determine concentration, not correlate data with process conditions or
quantify changes in situ over time. Additionally, simulation studies without supporting
experiments have investigated the potential for gamma- and neutron- based detection as
used nuclear fuel process monitors [78, 79]. UV-Visible spectroscopy has been utilized
in the measurement of solubilities in supercritical fluid extraction which has the potential
to provide a solvent-free extraction process [80]. At the Savannah River Site, U
concentration measurements have been conducted for monitoring of tank waste
22
conditions [1-4]. Applications of Raman spectroscopy have included pharmaceutical
analysis and quality control of pesticide formulations [81-83]. In electronic industries,
the online monitoring of etching solutions using spectroscopy directly through existing
Teflon lines is highly beneficial and accomplished through a Teflon-based Near-Infrared
measurement system [84]. More generally, the demand for in situ and online, real time
analysis of process steams is present in chemical, biological and nuclear industries from
the developmental science stage to the applied manufacturing level [85-87].
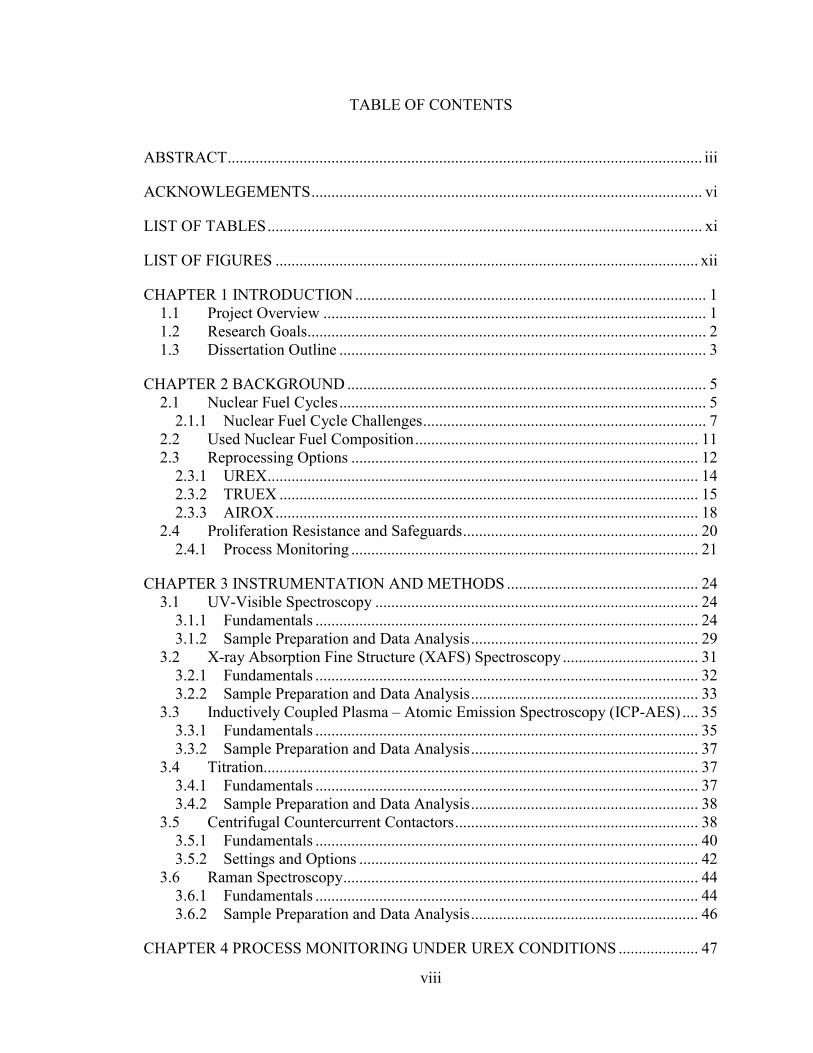
Table 5: Oxidation states, Raman and UV-Visible wavelengths of common process stream actinides [88]
Oxidation State Complex Ion Raman UV-Vis, nm ( , M-1cm-1)
U(VI) UO22+ 870 cm-1 415 (10)
Pu(VI) PuO22+ 833 cm-1 833 (550)
Pu(IV) Pu4+ 476 (65), 815 (20) Pu(III) Pu3+ 560 (35), 602 (40) Np(VI) NpO22+ 850 cm-1 1223 (45) Np(V) NpO2
+ 767 cm-1 980 (350) Np(IV) Np4+ 953-973
In order to effectively monitor a solvent-extraction based reprocessing scheme, the
key signatures, namely concentration and speciation of the main components, of the
separations under normal conditions must be identified to have a reference case.
Additionally, the stream pH, flow rate, and temperature can be monitored and compared
with chemical libraries of spectroscopic, chemical and physiochemical properties [88].
Overall, online monitoring at various points in a process is feasible as most flowsheets
contain Raman and/or UV-Visible spectroscopically active species (Table 5), and

23
immediate information on radiochemical stream composition and flow status is available
with off-the-shelf technologies.
If any used nuclear fuel treatment option is adopted by the U.S., regardless of
flowsheet or design, it will certainly be required to meet stringent nuclear materials
accountability and safeguards standards. Furthermore, the U.S. could set the precedent
for other countries who want to develop a commercial reprocessing program by providing
full transparency and integrated safeguards. By evaluating a selection of dry and wet
used fuel treatment options, opportunities for process monitoring by an application of
spectroscopic techniques can be identified.

24
CHAPTER 3
INSTRUMENTATION AND METHODS
Descriptions of the instrumentation and general methods used in this work are
presented in this chapter. Details on instrument fundamentals, system specifics, sample
preparation and measurement are provided. The techniques of UV-Visible spectroscopy,
X-Ray Absorption Fine Structure spectroscopy, Inductively Coupled Plasma Atomic
Emission Spectroscopy, Titration, Centrifugal Countercurrent Contactors and Raman
Spectroscopy are covered. It should be noted that no experiments utilizing Raman
Spectroscopy were performed in this research, but it is proposed for application in future
work and is relevant in Chapter 6, and thus an overview of the method is included.
3.1 UV-Visible Spectroscopy
In this dissertation, UV-Visible spectroscopy is used to both quantify U metal
concentration in solution and as the main method for detecting changes in the uranyl
nitrate molecular structure.
3.1.1 Fundamentals
When exposed to light in the UV-Visible region, molecules undergo electronic
transitions which can be investigated by measuring the light intensity before and after
passing through a sample of interest [89]. The absorbance (A, unitless) of a solution is
related -1cm-1), concentration (c, usually in
moles/liter) and pathlength (b, usually in cm) by the Beer-Lambert Law (Equation

25
1 bcA ), and is proportional to the transmission (T) and light intensities (I) as shown in
Equation 2 [90].
Equation 1 bcA
Equation 2
oIITA loglog
The molar absorptivity or molar extinction coefficient is a measure of how strongly a
chemical species absorbs light at a specific wavelength. There are three general
arrangements of UV-Visible spectroscopy instruments (Figure 7). In the single beam
geometry (a), incident light passes through the monochromator/grating which separates
the wavelengths. The separated light then goes through the sample (width of the sample
is the pathlength), then a photodetector and amplifier. Any reference measurements in
single beam geometry must be made by taking the sample out of the beamline and
inserting the reference, taking a reference spectrum and storing it for later correction (or
automated software correction) [91].
In the double beam geometry, the setup is similar to the single beam, however after
the monochromator or grating, there is a shutter which splits the beam into two. Thus,
one part of the light goes through a reference or background sample while the other beam
is simultaneously going through the sample to be measured. After each beam goes
through its respective cell, each is collected by a photodetector and a difference amplifier
is used to determine the reference corrected spectrum. This type of double-beam
geometry is considered double-beam separated in space (b), there is also double-beam
separated in time (c, a chopper is used to alternate between reference and sample beams).

26
In this work, two instruments were used for UV-Visible spectroscopic measurements, an
Ocean Optics USB200+ and a Varian Cary 6000i UV-Vis-NIR.
The Ocean Optics USB2000+ setup is similar to Figure 7 (a) where a fiber optic dip
probe is used for collection of spectra, and reference spectra must be measured separately
from the sample of interest. A 2H-W halogen light source is connected to the dip probe,
and collected light is passed to the spectrometer which uses a fixed grating and silicon
charge-coupled device (CCD). Two software interfaces were used, SpectraSuite for the
majority of data collection and OmniDriver for integration of the UV-Visible
spectroscopic data acquisition into LabVIEW.
The Cary 6000i setup is similar to Figure 7 (b), however in this case the chopper
separates the beam into thirds with one going to the sample, one going to the reference
and one being blocked. The UV and visible light sources are a 2H and a W lamp,
respectively, providing a range of 175-1800 nm. Both the sample and reference beams
are passed through a photomultiplier tube, with the Cary WinUV software interface
providing output results. The standard cuvette size of 12.5 x 12.5 x 45 mm is used in the
Cary 6000i, and several options are available for cuvette material and sample pathlength.

27
Figure 7: Diagram of UV-Visible system [91]
The UV-Visible spectroscopy result is generally a spectrum displayed as absorbance
over a range of scanned wavelengths, where instrument calibration and sample
quantification are possible. A sample uranyl spectrum is shown in Figure 8 illustrating
the various effects of sample geometry (cuvette versus fiber optic dip probe) and

28
pathlength (2 mm versus 10 mm) on resulting spectra. The characteristic U peaks at
approximately 404, 415 and 426 nm should be noted.
0
0.2
0.4
0.6
0.8
1
1.2
350 400 450 500 550
Cuvette singleCuvette doubleFiber single 2mmFiber single 10 mmFiber double 2 mmFiber double 10 mm
Abs
orba
nce
Wavelength (nm)
Figure 8: UV-Visible spectra of 0.11 M U in ~2 M HNO3
As the chemical form of the element impacts the absorbance spectra, speciation can
be determined from this technique. UV-Visible spectroscopy is an excellent method for
application to the actinides, as elements such as U, Np, Pu and Am are spectroscopically
rich due to their different oxidation states.

29
3.1.2 Sample Preparation and Data Analysis
When the Varian Cary 6000i UV-Visible-NIR Spectrophotometer was used for
spectroscopic measurements, the pathlengths used for sample measurement varied from 1
mm to 1 cm, and were chosen as appropriate for the molar absorptivity and concentration
of the solution under examination. Sample preparation is straightforward – the solution
sample is placed in a cuvette, the faces of the cuvette are cleaned so as to not interfere
with the passage of light, and the cuvette is placed in the sample holder in the
spectrophotometer. Both polymethyl methacrylate and quartz cuvettes were used in this
work, however in a given experiment the same type was always used for both the sample
and reference cells. In data acquisition, the Cary 6000i allows for the selection of
measurement parameters including the wavelength range, speed of scanning and
wavelength interval. Generally, the wavelength range scanned was 300-800 nm with 1
nm step size and a scan rate of 300-500 nm/minute. At the beginning of each experiment,
the system was zeroed and background and blank spectra were recorded. The
background spectrum was taken with a blank in the sample and reference positions.
When attempting to observe matrix changes, the reference was kept as a blank rather than
a sample matrix. In all cases, the detector was zeroed before every sample collection.
When using Hellma flow-through cuvettes, no sample was placed in the reference
position, as no identical flow-through cuvette was available. As such, background
sample collection before sample measurement was used for spectra correction.
As an alternative to placing the samples directly in plastic or glass cuvettes, a fiber
optic dip probe was inserted into a sample, or the sample was flowed through a quartz
cuvette flow cell. Again, wavelength range, scan speed and integration time can be

30
specified for each experiment. Initially the full 300-800 nm spectra were collected,
however for most of the uranyl nitrate work, the area of interest is limited so generally
these spectra were collected from 350-500 nm, with an acquisition time ranging from 250
–
does not have a beam splitter to provide for a simultaneous reference measurement,
background spectra were recorded prior to sample measurement, and blank matrix
samples were also recorded in the range pertinent to experiments.
Data analysis of UV-Visible spectra is straightforward. It is important to take a
background spectrum of the media of the sample if media effects are to be subtracted.
Additionally, the spectrometer’s absorbance should be zeroed after the sample chamber is
closed but before spectra collection. As long as this general procedure is followed, the
resulting plot of absorbance versus wavelength can then be analyzed for peak shifts,
absorbance changes or other spectral perturbations.
Figure 9: Peak ratio example comparing 403 and 426 nm over a range of [HNO3] [89]
Wavelength (nm)
Abs
orba
nce
426
403

31
In addition to the analysis of the raw spectral output, ratios of absorbance peaks can
be used for data breakdown. The peak ratio comparison method is demonstrated in
Figure 9, with the lines at 403 and 426 nm drawing attention to the quantitative changes
occurring in peak heights as the nitric acid concentration is varied. This method is useful
because peak ratios are dependent on molar absorptivities which yield information on
speciation, in turn providing process chemistry data. The importance of the peak ratio
comparison is that the ratio is no longer dependent on concentration; therefore the ratios
are a direct indication of the speciation that is occurring [92-94]. Another benefit of this
peak ratio method is that due to the direct relationship between changes in speciation and
peak ratio differences, the technique can yield close to real-time feedback in process as a
confirmation of chemistry or check for diversion.
3.2 X-ray Absorption Fine Structure (XAFS) Spectroscopy
A variety of actinides have been studied with XAFS, both as solids and in solution, as
they are relevant to environmental conditions, nuclear wastes and used nuclear fuel
reprocessing [95]. Often XAFS experimental techniques are coupled with Density
Function Theory (DFT) or other theoretical modeling to both calculate expected XAFS
results and interpret experimental data [95-98]. There are several XAFS studies that
relate directly to this work on uranyl nitrate [99-102], and other actinides in acidic nitrate
conditions [103-111]. In addition to the coupling of XAFS with molecular dynamics
simulations, some studies have laid the foundation for adding UV-Visible spectroscopy to
the suite of teamed investigative methods [104, 112].
32
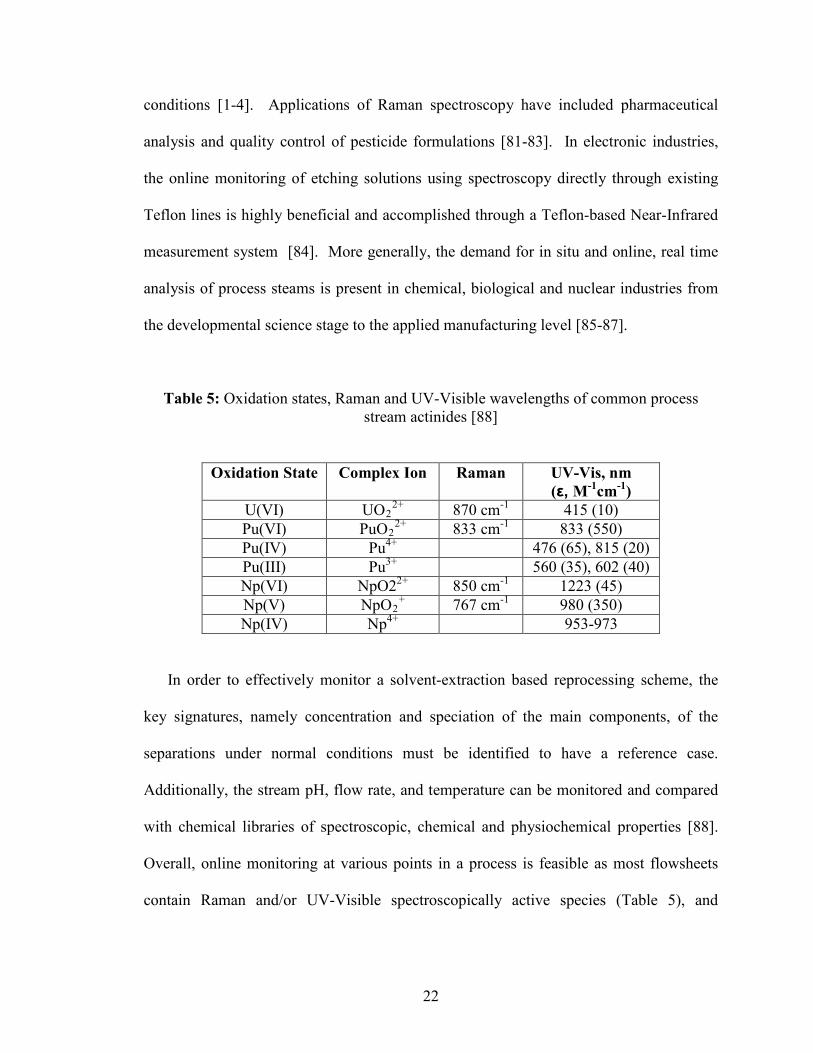
3.2.1 Fundamentals
X-ray Absorption Fine Structure spectroscopy is a technique that probes the
absorption of x-rays by atoms at energies near and above its core binding energy levels
[113]. When an atomic core-level electron absorbs an x-ray, if its incident energy is
greater than the binding energy, the electron may be removed from its quantum level and
a photo electron with excess energy ejected (photo electric effect). The resulting spectra
are sensitive to oxidation state, coordination chemistry and nearest neighbor distances
and species. XAFS is generally utilized in two more specific regimes - X-ray Absorption
Near Edge Spectroscopy (XANES) and Extended XAFS (EXAFS). XANES typically
yields information on oxidation state and extends 30-50 eV beyond the edge energy,
while EXAFS provides more data on the neighboring atoms and coordination chemistry
(distances, coordination number, and speciation) and probes up to 1000 eV above the
edge. All measurements begin at energies below the absorption edge of the element of
interest. Th -ray absorption
(Equation 3), and is a function of x-
(Z) and atomic mass (A). XAFS spectroscopy is fundamentally measuri
sample, and resulting spectra are displayed as absorption coefficient versus energy [113].
Equation 3
3
4
AEZ
For this research, XAFS spectroscopy was performed at the Advanced Photon Source
(APS) synchrotron at the Argonne National Laboratory. A schematic of the synchrotron
setup is shown in Figure 10. To produce x-rays, electrons are emitted from a cathode,
passed through a linear accelerator, injected into a booster synchrotron and then

33
accumulated in the large synchrotron storage ring. Electromagnets are used throughout
the synchrotron to provide acceleration, bending and focusing of the photons, and to
provide several beamlines tangential to the storage ring where XAFS experiments can
take place. The Basic Energy Sciences Synchroton Radiation Center Collaborative
Access Team Bending Magnet 12 at the APS was used for experiments in this work.
Figure 10: Segment of Advanced Photon Source synchrotron [114]
3.2.2 Sample Preparation and Data Analysis
As XAFS is an atomic probe, provided a proper and tunable x-ray source is available,
it can basically be used on any element and with solid or solution samples. For this work,

34
liquid samples were prepared in the 1-10 mM concentration range and placed into XAFS
sample holders, shown in Figure 11. Transmission or fluorescence measurements are
available as long as the beam is properly tuned to a homogeneous sample, with
fluorescence preferred for very thin or thick, dilute sample geometries. For U XAFS,
samples were measured in fluorescence mode at room temperature with x-rays tuned for
the LIII edge at 17.166 keV, where energy calibration was achieved using an in-beam Zr
foil. While taking XANES or EXAFS measurements is fairly simple (once the beam is
tuned and the sample aligned), interpretation and analysis of XAFS signals is not as
straightforward. In general, 10-16 scans are collected per sample, they are averaged,
meas
pre-
3 then perform a Fourier transform into R-space [113].
Programs such as Athena, WinXAS, TKatoms and FEFF are useful in XAFS data
reduction [115].

35
Figure 11: XAFS sample holders
3.3 Inductively Coupled Plasma – Atomic Emission Spectroscopy (ICP-AES)
3.3.1 Fundamentals
ICP-AES is used to determine metal concentration in solution samples. A schematic
of a typical inductively coupled plasma atomic emission spectrometer system is shown in
Figure 12. The liquid sample is introduced to the system via a nebulizer, then made into
a plasma with an argon carrier gas by a torch with temperatures ranging from 6,000 to
10,000 K [91]. The plasma is initialized when the argon atoms are ionized with a Tesla
coil, while the RF induction coil produces a magnetic field. As the torch breaks up the
molecules in the sample and ionizes each atom, the excited atoms emit photons at

36
characteristic wavelengths in order to de-excite, and spectroscopy is used to detect these
photons and relate the signal to the concentration of each element. A diffraction grating
is used to separate the emitted light spectrum into individual wavelengths. The intensity
of photons at each specified wavelength is amplified with a photomultiplier tube (PMT),
where photon interactions produce electrons which are amplified by a system of dynodes,
yielding an electronic signal. The signal is then sent to a detector, where the intensity of
this signal is directly proportional to the concentration of the element and can be used to
provide quantitative results when a calibration curve from solutions of known
concentrations is utilized.
Figure 12: ICP-AES diagram [116]

37
3.3.2 Sample Preparation and Data Analysis
A Thermo Scientific iCAP 6000 Series ICP-AES with Thermo iTeva software was
used, and for U measurements the 419 nm emission wavelength was monitored. The
calibration standards used for this project ranged from 2.1 x 10⁻⁵ to 4.2 x 10⁻⁴ M uranium
and were prepared in a 2% nitric acid matrix. The samples for analysis were diluted in
2% HNO3 by appropriate factors (40-5000) in order to achieve U concentrations within
the range of the standard calibration, generally 1-100 ppm which corresponds to
approximately 0.004-0.4 mM U. A calibration was run at the beginning of each use of
the instrument, and this calibration curve was used to correlate the counts/second
detected by the ICP-AES to elemental concentration in solution. All samples were run in
triplicate, and when more than 10 samples were being analyzed using the auto-sampler,
calibration checks were inserted at the end of the deck to ensure proper instrument
operation throughout data collection.
3.4 Titration
3.4.1 Fundamentals
Titration is based on the concept of an equivalence point, where the concentrations of
acid and base are equal, and this occurs where the change in pH is greatest. Titrations
actually measure the end point, a very close approximation of this equivalence point, as
the ideal equivalence point is in an infinitely dilute solution. When titrating a strong acid
with a strong base, the endpoint should occur at a pH of 7 [117]. The acid concentration
of the sample can then be calculated based on the moles of base needed to reach the end
point, assuming sample and titrant volume as well as titrant concentration are known.

38
3.4.2 Sample Preparation and Data Analysis
A Brinkmann Instruments Metrohm Titrino 799 with a 685 Dosimat and Tiamo
software was used for titrations in this work. In most cases, the Micro pH Glass
Electrode 178 mm (6.0234.110) was used as its long length is appropriate for use with the
autosampler. Before titration, the electrode was calibrated with three buffers of pH 4, 7
and 10 to ensure proper operation. Next, an excess of 0.45 M C2K2O4 reagent,
preadjusted to pH 5.55, was added to the titration cell along with a stir bar. Potassium
oxalate, like ammonium oxalate, binds to and prevents the hydrolysis of U(VI) [74]. The
pH electrode was lowered into the stirring solution and allowed to equilibrate for
approximately 3 minutes. The pH of the solution was tested to ensure it was in the range
of 5.50-5.60, if not, appropriate amounts of NaOH or HNO3 were added to achieve the
desired pH. Next, an amount of sample was pipetted into the oxalate solution in order to
adjust the pH to less than 5.3, the solution was allowed to stir for a brief period, then the
pH was measured. If the pH of the solution was below 5.3, titration continued with 0.100
M NaOH as in a standard titration up to the initial pH observed (between 5.50 and 5.60).
If the pH of the solution after adding the sample was greater than 5.3, more sample was
added in order to adjust the pH to lower than 5.3 [118]. The software calculated the
endpoint value, which was used to determine the original acid concentration of each
sample. The calculation was performed by the software by finding the inflection point of
the titration curve.
3.5 Centrifugal Countercurrent Contactors
In a solvent extraction process, two immiscible phases (aqueous and organic) are
mixed, allowing the soluble species to distribute, then separated. At the bench scale,

39
small samples can be prepared manually, vortexed and then centrifuged. When scaled up
to the laboratory or demonstration level, vessels such as mixer-settlers, pulsed columns or
centrifugal contactors facilitate the contacting and separating of the phases [119]. Some
advantages that contactors have over other vessels are that they have a smaller footprint,
lower total volume for a process, shorter contact time, faster approach to steady-state,
process upset tolerance, clean-in-place capability and rapid stage change out [120]. One
downside of the contactors is that they do not tolerate solids, so care must be taken to
properly maintain the vessels by thoroughly cleaning after use. Generally the small
samples are on the order of milliliters, while solvent extraction vessels such as centrifugal
contactors can accommodate flow rates of liters/minute and run continuously. Contactors
can be used for flowsheet development, mass transfer testing, and demonstration and
evaluation of potential commercial processes. A cutaway view is provided in Figure 13.

40
Figure 13: Cutaway view of CINC V-02 contactor [121]
3.5.1 Fundamentals
Development and demonstration of solvent extraction equipment has been ongoing in
the U.S. national laboratory system for almost 40 years. The first centrifugal contactors,
consisting of a vertical centrifuge allowing the mixing and separating of liquids, were
developed at Savannah River National Laboratory. Contactors have also been used in
studies of solvent extraction processes for used nuclear fuel reprocessing internationally
[122, 123]. Contactors can be easily interconnected to allow multistage processing with
two immiscible liquids are fed into the annulus, formed by the spinning rotor and the
stationary housing wall, of each contactor through inlets toward the top of the device.

41
The liquids mixed in the annular region or are pumped into the rotor bottom, then into the
separation zone where the liquids are accelerated to the wall with the heavier fluid going
to the outside and exiting the contactor first. Figure 14 illustrates the counter-current
nature of the contactors as well as how they can be connected as to improve total process
efficiency and separation factors. The efficiency of the solvent extraction, the transfer of
a species between the two phases, depends on the total contacting surface, on the
separation between the two phases, and the time of contact between the phases [124].
Figure 14: Example Diagram of Countercurrent Centrifugal Contactors [125]
Argonne National Laboratory has developed systems of centrifugal contactors that are
reliable, and relatively inexpensive to build, operate and maintain. Due to the compact
contactor stages, the overall liquid holdup is low, the systems can undergo fast startup
and shutdown, and high mass transfer efficiency can be achieved. The interstage lines
are external to the contactor body so that both the aqueous and organic liquids are
accessible as they enter and leave each stage, making stream interrogation physically
easy (Figure 14). There are some undesirable effects seen when the flowrate of liquids is

42
low in the 2-cm contactor, the interstage lines are not fully wetted, thus producing slugs
of solution rather than continuous, steady-state operation. Such flow, which is controlled
by the surface tension of the liquid, is a concern since it will reduce stage efficiency
[126]. Centrifugal contactors have also been used to extract Am(III) with somewhat low
separation factors, however increasing the number of contactors for each stage is known
to increase the overall separation factor [127].
3.5.2 Settings and Options
The contactors used in this work are a set of 3 model V-02 from CINC
Manufacturing, LLC. The V-02 model has a 2 inch rotor, is approximately 9 inches long,
9 inches wide and 25 inches tall, can hold up to 1.9 liters/minute, weighs 25 pounds and
uses a 1/8 horsepower 110 VAC motor [121].
Each of the 3 contactors can be operated independently, allowing flexibility in
experimental design. Masterflex pumps are used to feed solutions into the contactors,
and flowrates are adjusted manually via the pump control console. The pumps and
interstage connections are made with Tygon tubing and stainless steel fittings. Total
flowrates (sum of organic and aqueous flows) through the system are nominally less than
2 liters/minute. Residence time is an important factor to consider when decided on
flowrate for aqueous and organic flows, as it affects both the holdup volume and the
contact/separation time (Figure 15). The selection of flowrate directly affects the
residence time, in this work solutions are pumped through the UNLV contactors in the
range of 300-600 milliliters/minute.

43
0
10
20
30
40
50
60
70
0 0.5 1 1.5 2
Res
iden
ce T
ime
(s)
Flowrate (LPM)
Figure 15: Residence time as a function of flowrate in the V-02 CINC contactor [121]
The organic and aqueous phase outlets are all vented to protect against pressurization
inside the vessels, and so flow between contactors and through the outlets is driven by
gravity. The feed aqueous and organic solutions were stored in covered containers either
underneath the contactor bench or directly adjacent. Sampling from the contactor outlets
can be achieved through the valves attached to the outlet tubing, and sampling from all
contactors is possible through the stage drains.

44
3.6 Raman Spectroscopy
No Raman spectroscopy experiments were performed in this work, however it is
proposed as a method of process monitoring in Chapter 7, therefore instrument
fundamentals and a brief overview of sample preparation and data analysis are provided.
3.6.1 Fundamentals
Raman spectroscopy provides information about the structure and symmetry of
molecules, as well as some data on their vibrational energies. It relies on the inelastic
(Raman) scattering of monochromatic light (not absorption as in UV-Visible
spectroscopy), as from a laser, usually in the visible, near visible or infrared range. The
light interacts with the vibrations of the molecule causing small shifts in the laser
photons’ energy. These shifts are dependent on the chemical structure of the molecules
causing the scattering [128]. Infrared spectroscopy is a complementary technique to
Raman spectroscopy, as molecules that are Raman active are IR inactive, and vice versa.
Raman species are active if the vibrations cause a change in the polarizability of the
molecule, whereas species are IR active if the vibrations yield a change in the dipole
moment [129]. Stretching and bending vibrational modes are shown in Figure 16. Water
does not cause interferences in Raman spectra as it does in IR spectra, allowing for the
potential application of Raman spectroscopy as an online process monitor in areas where
UV-Visible spectroscopy is ineffective or inappropriate.

45
Figure 16: Molecular vibration modes [91]
Raman is not a destructive technique, spectral acquisition is very fast (seconds), it is
adaptable to various sample types (gas, liquid, solid), can be used in relatively extreme
environments (high temperature) and can utilize fiber optic systems for measurement.

46
Thus, Raman spectroscopy has the potential for use as a process monitor in used fuel
reprocessing type scenarios.
3.6.2 Sample Preparation and Data Analysis
Solid, liquid or gas samples can be studied with Raman spectroscopy, with solid
sample preparation including grinding to a fine powder. Generally gaseous samples have
a very low concentration of analyte, in which case a long path length would be necessary.
For liquid samples, spectra can be obtained through glass or plastic sample holders,
where subtraction of a blank spectra can then provide the analyte Raman spectra. In any
case, the sample is irradiated with a source of monochromatic light, often a laser, and the
spectrum of the scattered radiation is measured with a spectrometer, often at a right angle
to the incident beam [91]. Collected Raman spectra are often referred to as “fingerprints”
of the sample, and collections, databases and books of spectra are available for
identification of spectral peaks [130, 131]. Often, however, software such as OMNIC or
LabSpec is used to deconvolute or separate spectra and search spectral libraries to aid in
qualitative Raman spectral analysis (identification). When quantitative Raman spectral
analysis is necessary, peak ratios can be compared as the relative intensities of peaks are
directly proportional to the concentrations in the sample.

47
CHAPTER 4
PROCESS MONITORING UNDER UREX CONDITIONS
Speciation by spectroscopic methods has been demonstrated to have applications to
materials accountability and process monitoring by providing a route to evaluate
radionuclide concentrations and solution conditions [132]. As the chemical form of the
element impacts the absorbance spectra, speciation can be determined from this
technique. UV-Visible spectroscopy is an excellent method for application to the
actinides, as elements such as U, Np, Pu and Am are spectroscopically rich due to their
different oxidation states. Taking this application one step further, speciation by
spectroscopic methods has been demonstrated to have applications to materials
accountability and process monitoring by providing a route to evaluate radionuclide
concentrations and solution conditions [132]. The spectroscopically determined
information can then be used to both verify the extraction system and detect diversion
attempts. Namely, differentiation between PUREX and UREX is of prime importance.
The approach to this differentiation is straightforward as the uranyl UV-Visible spectrum
is shown to change with varying nitrate concentration, which is one of the main
differences between the PUREX and UREX systems [3, 13].
4.1 Introduction
4.1.1 Uranyl Spectroscopy
UV-Visible spectroscopy is directly related to electronic transitions in a species,
where allowed transitions will have a much higher molar absorptivity than forbidden

48
transitions (which can still be detected spectroscopically) [133]. The uranyl nitrate
complex usually exists as the mononitrate or dinitrate, however the uranyl trinitrato
complex has been prepared at upwards of 16 M HNO3 and found to be fairly stable in the
absence of water [134, 135]. The molar extinction coefficient of the tetranitrato salt is
much higher than that of the trinitrato salt or aqueous uranyl nitrate solutions and is
reported to reach upwards of 57 M-1cm-1, as compared to 8-10 M-1cm-1 for the latter
[136]. Uranyl’s molar absorptivity dependence on nitrate is a fundamental premise of the
project. While neither the trinitrato nor tetranitrato species are expected in this work, it
should be noted that the presence of these salts would substantially affect the UV-Visible
absorption spectra. It is assumed that in acidic solutions from pH~0.1 to pH~2, the
uranyl ion UO22+ is exclusively formed [134]. Additionally, uranyl nitrate is strongly
complexed in nitric acid solutions and inhibits Pu(VI) formation when present in high
concentrations, but enhances the formation when present in low concentrations [137].
The spectroscopy of the uranyl ion can be explained by examination of atomic and
electronic structures. The uranyl ion is formally a 5f0 system and consists of a U atom
covalently bound to two oxygen atoms in a linear arrangement. The electronic structure
of the uranyl ion can be described in terms of the molecular orbitals formed by the 5f and
6d valence orbitals of U and the 2s and 2p orbitals of the O atoms (Figure 17). The
g+
u+
g u accommodate the 12 valence electrons of
UO22+
u+ being the highest occupied molecular orbital (HOMO). The lowest
u (fxyz, fz(x2-y2 u,
originating from the 5f orbitals of U. The UV-Visible absorption spectra of uranyl
compounds can be explained in terms of excitat u+
u u
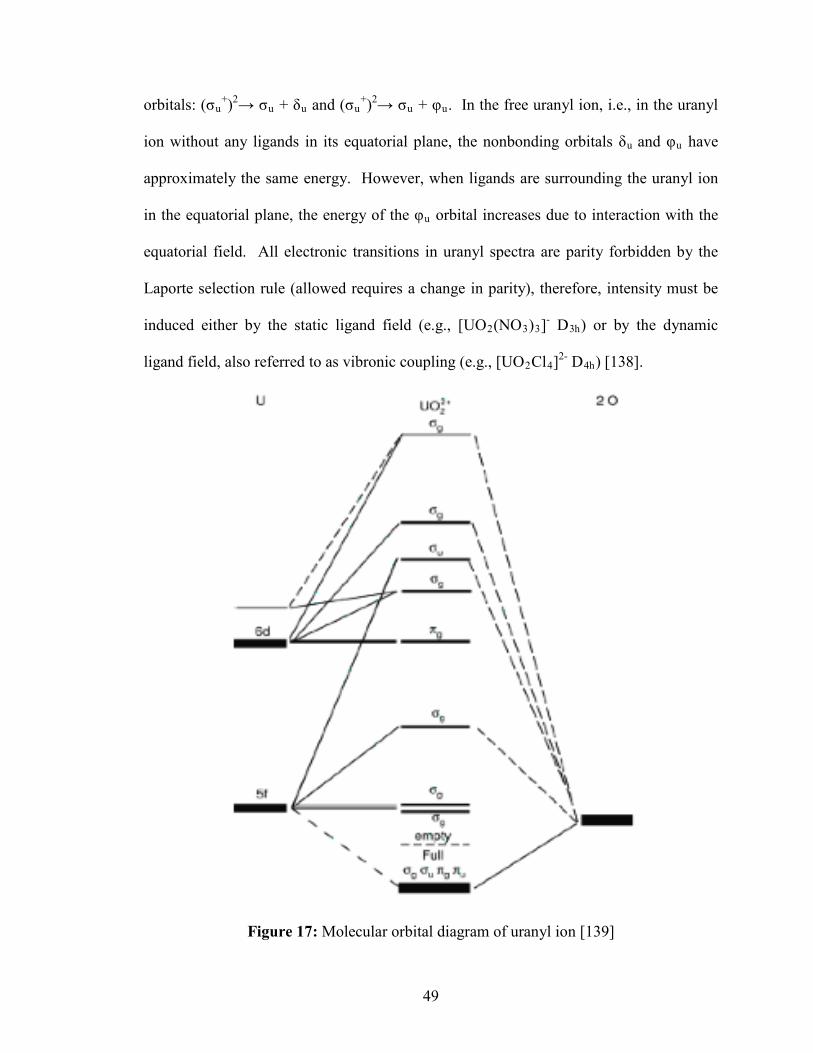
49
u+)2 u u u
+)2 u + u. In the free uranyl ion, i.e., in the uranyl
ion without any ligands in its equatorial plane, the nonbonding orbitals u and u have
approximately the same energy. However, when ligands are surrounding the uranyl ion
u orbital increases due to interaction with the
equatorial field. All electronic transitions in uranyl spectra are parity forbidden by the
Laporte selection rule (allowed requires a change in parity), therefore, intensity must be
induced either by the static ligand field (e.g., [UO2(NO3)3]- D3h) or by the dynamic
ligand field, also referred to as vibronic coupling (e.g., [UO2Cl4]2- D4h) [138].
Figure 17: Molecular orbital diagram of uranyl ion [139]

50
The uranyl ion has characteristic absorption spectra containing three fingerlike peaks
at 403, 414 and 426 nm (Figure 18). The uranyl absorption spectra change shape and
shift absorbance maxima with shifts in speciation, since the spectrophotometer detects
variations in the U electron configuration and transition energies. Changes in speciation
can occur due to ligand and metal concentration variation, with previous work showing
that as nitric acid concentration increases from 2 to 6 M the characteristic uranyl peaks
broaden and merge into one large peak [140]. In the visible U spectrum, the 426 nm
absorption line possesses the greatest sensitivity to nitrate conditions, whereas the 359
nm line exhibits a sensitivity which is only one-third of this value. Overall, the
absorption at all wavelengths increases with nitric acid concentration, the 403, 426, and
416 nm U triplet becomes less defined, as the 426 nm line broadens into a shoulder. In
the literature, the slopes of the curves obtained with varying nitrate were found to be
identical to those obtained with changing nitric acid, with uranyl absorbance
demonstrating a linear relationship with nitrate throughout the U concentration range.
Quantitatively, the absorbance increases linearly at a rate of 0.00145 absorbance units per
degree centigrade for both the 416 and 416 maxima [139].

51
Figure 18: UV-Visible Absorbance of 0.63 M U at 0.01 M HNO3, 0.1 cm pathlength
In general, UV-Visible spectroscopy is a reliable method for U concentration
determination. However, this work exploits a main caveat to this generalization, which is
that uranyl measurement by UV-Visible spectroscopy in nitrate matrices is complex due
to nitrate concentration altering uranyl speciation, and therefore its absorption spectrum
[141, 142]. Thus, the UV-Visible spectroscopy of uranyl nitrate is extremely sensitive to
solution conditions.

52
4.1.2 Relevance to reprocessing
The reprocessing of irradiated fuel from LWRs was initially intended to produce
separated Pu and U products. The speciation of the U and Pu in solution is directly
relevant to the application of UV-Visible spectroscopy as a process monitor. While no
reprocessing is currently underway in the U.S., the Barnwell Nuclear Fuel Plant stored
highly concentrated Pu nitrate solutions and conducted studies to determine the physical
and chemical properties of concentrated (approximately 500 and 700 grams/liter of
Pu(IV) in HNO3) Pu solutions [143]. Typical output streams from the PUREX fuel
recycling process contain from 20-200 grams/liter U, in addition to approximately 4 M
nitric acid and 1 M nitrate. The UV-Visible spectroscopic spectrum of uranyl in TBP in
the presence of acetohydroxamic acid has been studied [144]. This information,
including data on density, viscosity and materials corrosion rates, can be used in
conjunction with any process monitoring of Pu-bearing streams in a reprocessing plant.
In considering the application of spectroscopy in a separations scheme, typical output
streams from the PUREX/UREX fuel recycling process contain up to 300 grams/liter U
-6 M nitric acid and corresponding ranges of
nitrate. In both UREX and PUREX, the organic phase is 30 % tributylphosphate in an
organic diluent, normally dodecane. In UREX, acetohydroxamic acid (AHA) is utilized
along with a reduced acid concentration as compared to PUREX in order to prevent the
extraction of Pu(IV) with U. The difference in the aqueous phases for UREX and
PUREX are summarized in Section 2.3.1. The interaction of AHA with tetravalent Pu
decreases extraction into the organic phase by either complex formation or reduction of
Pu to the trivalent state [145]. In UREX the Tc(VII) is extracted into the organic phase

53
along with U(VI). UREX is generally proposed to be the initial component of a range of
used nuclear fuel reprocessing flowsheets (Section 2.3).
Continuing the consideration of the application of spectroscopy in a separations
scheme, controlling Pu in a reprocessing scheme has been a goal throughout the history
of nuclear fuel cycles [146]. Of relevance to this work, Pu oxidation behavior has been
studied and absorption spectroscopy has been used to characterize nitrate complexes of
Pu(IV) [137, 147, 148]. For UV-Visible spectroscopic applications in cases of low
concentrations of Pu, liquid core waveguides (LCW) can be used to effectively increase
the pathlength of the sample cell. With the lower detection limits of a LCW, the
identification of oxidation states in dilute Pu solutions is possible [149]. A 1.0 meter
LCW was utilized to detect and quantify Pu(III, IV, VI, V) in perchloric acid. Due to the
nature of the LCW, the sample must be pumped through the system, in this case at a flow
rate of 5 milliliter/minute, and through spectral averaging, no flow-rate effects were seen.
The measured molar absorption coefficient for the Pu band at 600 nm was found to be
approximately 34 M-1 cm-1, and this results in a lower limit of detection for Pu(III) of 8.0
x 10-6 M. The absorbed wavelengths for the various oxidation states of Pu and their
respective molar absorptivities can be seen in Table 6.
Table 6: Molar absorptivities and Lower Limit of Detection (LLD) for Pu major absorption bands in 1 M HClO4, diluted from 0.005 M Pu stock
Pu Ion Abs. Wavelength (nm)
Molar Absorptivity (M-1cm-1) [149]
Molar Absorptivity (M-1cm-1) [150]
LLD for 1 cm
III 600 33.8 38 236 IV 470 49.0 55 158 V 568 18.8 19 518 VI 830 288 550 12.4

54
Detection limits for the UV-Visible spectroscopy of Pu were found to be 10-5-10-6 M for
a 1 cm pathlength cell, and this LLD was brought down to the 10-7 M range for a LCW
UV-Visible spectroscopy setup [151].
Centrifugal contactors have been found to be reliable and relatively inexpensive to
build, operate and maintain; therefore have been considered for use in a reprocessing
plant. Due to the compact contactor stages, the overall liquid holdup is low, the systems
can undergo fast startup and shutdown, and high mass transfer efficiency can be achieved
[124, 126, 152, 153]. The contactor interstage lines are external to the contactor body so
that both the aqueous and organic phases are accessible as they enter and leave each
stage, making stream interrogation physically straightforward. Thus, the process
monitoring system described in this work is applied to a contactor setup for a
demonstration of the technology and methodology.
Theoretical proliferant diversions in separations would be accomplished via
deliberate modification of the flowsheet chemistry. Therefore, by confirming proper
operational performance and verifying process integrity throughout the PUREX/UREX
scheme, these diversions can be identified. Online, real time, multiparametric monitoring
of the radiochemical streams in a reprocessing flowsheet can provide rapid detection of
unwanted deviations from normal operation conditions. In order to effectively monitor a
reprocessing scheme, concentration and speciation of the main components under normal
conditions must be identified to have a reference case of key signatures. Additionally,
the stream pH, flow rate, and temperature can be monitored and compared with chemical
libraries of spectroscopic, chemical and physiochemical properties [4, 21, 70, 88, 132].
The work presented in this chapter can be used with other commercial off the shelf

55
technologies that monitor other process variables to provide a robust, comprehensive
process monitor in a reprocessing setting.
4.2 Scoping Experiments and Preliminary Application to Reprocessing
There are two methods for the UV-Visible spectroscopy of the moving solutions: a
fiber optic dip probe can be inserted into the stream or the stream can be diverted to a
cuvette flow-cell placed in a spectrophotometer. Before the fiber optic system was
integrated into a flowing stream, fundamental studies with both a benchtop
spectrophotometer and the fiber optic dip probe were performed to characterize the
uranyl nitrate UV-Visible system. Following these studies, flowing experiments were
carried out with both the fiber optic dip probe and cuvette flow-cells.
The Cary 6000i was used to measure a set of U samples ([U]=1.13, 0.566,
0.113, 0.0566, 0.0113, and 0.00566 M, all at 2 M [H+]) in the single and double beam
configuration with the samples in 1 cm cuvettes. Next, the same instrument was used to
measure the samples with the fiber optic dip probe in the single and double beam
configurations. In this way, effects of the differing setups could be seen and a
comparison of the cuvette to fiber probe measurements revealed any fiber losses of light.
Figure 8 shows an example of the spectra collected from the Cary 6000i. Here, the
same sample ([U] =0.113 M) is measured in a cuvette in both single and double beam
geometries (black and dark green lines). Then the same sample is measured by the fiber
optic dip probe in a centrifuge tube with the 2 mm tip in both single and double beam
geometries, and then with the 10 mm tip in both the single and double beam geometries.
It is evident that within each method – cuvette, 2 mm, 10 mm – quite similar results are
shown in single and double beam settings. For greater detail on the single and double

56
beam methods of UV-Visible spectroscopy, see Section 3.1.1. Previously shown data
(Figure 8) identifies the issue of variation in molar absorptivities. For example, the fiber
optic dip probe with 2 mm tip measurement at the 414 peak (green line, absorbance
~0.29) yields a molar absorptivity of approximately 13. The 414 peak in the single beam
cuvette with 1 cm pathlength (purple line, absorbance ~0.85) arrangement yields a molar
absorptivity of 9.3. The variation here is an experimental introduction to uranyl’s molar
absorptivity dependence on nitrate which is a fundamental premise of the project.
Figure 19: Fiber optic dip probe range study with UO22+

57
In studies for preparation of flowing system measurements, an Ocean Optics fiber
optic dip probe with a 2 mm pathlength tip was inserted into a Swagelok tee. A
diaphragm pump provided solution flow, and the system spanning 0.0113-0.566 M
[UO22+] was investigated with the Ocean Optics USB2000+ UV-Visible spectrometer
system. As seen in Figure 19, the Ocean Optics setup can easily and distinctly resolve
0.04 M differences in UO22+ concentration at levels as low as 0.01 M UO2
2+. It can also
provide some spectral information at concentrations upwards of 0.5 M UO22+, however
the characteristic uranyl shape is lost and peaks cannot be resolved. Thus, the resolution
of this specific Ocean Optics setup is greater than 0.04 M UO22+ over the effective range
of 0.01-0.15 M UO22+.
Figure 20: Effect of addition of NH4OH on UV-Visible spectra

58
In order to determine the effect on UV-Visible spectra from a titration with base, a
0.05 M HNO3/0.12 M UO2(NO3)2 sample and a 0.03 M H (0.05 M HNO3 + 0.02 M
NH4OH) 0.12 M UO2(NO3)2 sample were prepared and compared. Figure 20 shows the
overlay of the spectra produced in the Cary 6000i UV-Visible spectrometer. While some
changes are noticeable below 390 nm, in the area of interest for the uranyl species (400-
430nm), the spectra appear to overlap entirely.
Figure 21: UV-Visible absorption spectra of Nd solution showing the time response study with fiber optic dip probe

59
To continue studies with the fiber optic probe UV-Visible spectroscopy system,
solutions with varying concentrations of Nd were used in order to determine the time
response of the probe in solution. Results indicate instantaneous response from the probe
when presented with 0.02 M differences in concentration of Nd(NO3)3 (Figure 21).
Another time response experiment was conducted with the fiber optic probe setup,
however varying concentrations of uranyl nitrate were used, and the resolution (minimum
distinguishable concentration difference) was found to be 0.002 M UO2(NO3)2 (Figure
22).
Figure 22: Resolution studies of uranyl nitrate solutions (0.023 to 0.115 M) with the fiber optic dip probe in Swagelok flow cell

60
After scoping studies with the Swagelok tee and single pump system, the fiber optic
probe was mounted in the same Swagelok tee design in the aqueous product stream of
bank of twenty 2-cm contactors at ANL for a U-only UREX demonstration (Figure 23).
Figure 23: Fiber optic dip probe mounted in aqueous product outlet
The introduction and growth of the spectra as UO22+ enters the product stream exiting the
last strip stage after approximately 30 minutes is shown in Figure 24. The fiber optic
probe behaved as expected in this demonstration, and the relationship between solution
flow rates and UV-Visible spectra was brought to attention. While there was no effect of
flow rate on spectra in previous experiments with single solution flow, the countercurrent
nature of the contactors combined with the use of multiple solution inlets complicates the
relationship.

61
Figure 24: UO22+ growth in UREX product stream [154]
Specifically, changes in the strip flow rate were found to be inversely proportional to the
concentration changes in the product as seen by the UV-Visible spectrometer (Figure 25).
In general, the flowrate of the solution under fiber optic dip probe investigation should be
explicitly related to the other flowsheet flowrates, and this determined relationship can be
used to explain UV-Visible absorbance value changes due to flowrate variance. One
observation from this setup is that the high surface tension of the aqueous flow dictates
the flow through the tubing, oftentimes pulling a slug of product through, leaving the
aperture of the probe empty.

62
Figure 25: Inverse relationship between strip flow rate adjustment and UO22+
concentration seen in aqueous product stream [154]
4.3 High Fidelity Uranyl Nitrate System Studies
As an alternative to the fiber optic dip probe technique, quartz Hellma flow-through
cuvettes with pathlengths of 0.1, 0.5 and 1.0 cm were coupled with a peristaltic pump
illiliter/minute) and a Cary 6000i Spectrophotometer. These cuvettes are
very similar to standard cuvettes for UV-Visible spectrophotometric measurements.
However, the concept is that a slipstream of the solution of interest can be directed into a
benchtop spectrophotometer to provide higher resolution data. Samples of 0.01, 0.126,
0.262, 0.63, 1 and1.26 M U at 0.01, 0.1, 0.5, 1, 3, and 6 M HNO3 were prepared via
dilution of a single stock uranyl nitrate solution. The solution was prepared

63
gravimetrically by dissolving 141.11 grams of UO2(NO3)2·6H2O in 200 milliliters of DI
H2O to make a 1.4 M stock from which samples were prepared by volumetric dilution
with concentrated HNO3 and DI H2O. Prepared samples were analyzed by ICP-AES
using a NIST traceable standard at 9962 ± 37 ppm for calibration with R2=0.9997 and all
samples were found to have less than 1.5% error across triplicates (selected data shown in
Table 7). The samples were then pumped through the Hellma cuvettes using the
peristaltic pump, and UV-Visible spectra were obtained in triplicate at a flowrate of
approximately 2 milliliters/minute with the Cary 6000i in double beam mode with a
quartz cuvette of DI H2O as a background. Reported spectra are averaged and
background subtracted (Figure 26 and Figure 28).
Table 7: Comparison of calculated and averaged ICP-AES determined values for U concentration
Calculated Averaged ICP-AES STDEV % Difference
0.01 0.0096 0.0005 4.17
0.126 0.1246 0.0028 1.12
0.262 0.2609 0.0078 0.42
0.63 0.6302 0.0216 0.03
1 1.012 0.0549 1.18
1.26 1.257 0.0781 0.24

64
Figure 26: UV-Visible Absorbance of 0.126 0.02 M U at 0.01-8 M HNO3, 0.1 cm pathlength
Table 8: Prepared sample conditions
[HNO3] 2, 4, 5, 7, 8 [UO2
2+] 0.01, 0.126, 0.262, 0.63, 1
Next, samples were prepared at the conditions in Table 8 via volumetric dilution of a
single stock uranyl nitrate solution. In preparation for dilution, the stock solution was
characterized as 1.9 M UO2(NO3)2 by ICP-AES and as 0.9 M HNO3 by titration. Again,

65
all samples were analyzed by ICP-AES using a NIST traceable standard at 9962 ± 37
ppm for calibration with R2=0.9998 (Figure 27) and less than 2.8 % error was found
across triplicates.
Figure 27: Example ICP-AES calibration curve
These samples were titrated along with samples previously prepared using a potassium
oxalate complexation method and a standardized 0.1 M NaOH solution. The average
disagreement between expected and titrated acid concentrations for all samples was
found to be 7.77%. As nitric acid was the only acid used in these experiments, acidities

66
are directly correlated to nitric acid and therefore nitrate concentrations. Again, the
samples were then pumped through the Hellma cuvettes using same experimental setup
and conditions as used previously, with reported spectra averaged and background
subtracted (Figure 26 and Figure 28).
Figure 28: UV-Visible absorbance of 1.26 0.10 M U at 0.01-5 M HNO3, 0.1 cm pathlength

67
Although the calculation of uranyl nitrate speciation is unknown and complex, the
speciation changes can be investigated spectroscopically. In Figure 26, some semblance
of the characteristic uranyl spectra can be seen throughout the range of nitric acid
concentrations (0.01-8 M). However, at 1.26 M UO22+ (Figure 28), the characteristic
uranyl spectrum begins to lose shape immediately as nitric acid concentration increases,
indicating prominent changes in speciation. The combination of 1.26 M UO22+ and 5 M
HNO3 demonstrates the most defined spectral contrast when compared with the 0.126 M
at 0.01 M HNO3. Furthermore, changes in peak ratios are evident even in a cursory
comparison of these figures. In Figure 26, the 403 peak is larger than the 426 peak in the
3) spectra whereas the opposite is true of the same peak comparison
in Figure 28. A calculation of the unit-less peak ratio from Figure 26 yields
approximately 1.125 for the 0.01 M HNO3 data, whereas the same calculation from
Figure 28 yields 0.913. The spectral changes are so great, in addition to free uranyl,
mono-, di-, perhaps even tri- nitrate speciation changes, uranyl-uranyl coordination may
contribute [141, 142]. The complexity of the uranyl nitrate speciation and sensitivity to
chemical environment allow for this method of process monitoring to provide detailed
information on solution chemistry and thus process operations and performance.

68
Figure 29: UV-Visible Absorbance of 0.01-1.26 M U concentrations at 0.01 M HNO3, 0.1 cm pathlength
Overall spectral shape and peak definition are of primary concern in the comparison
across nitric acid concentrations, not absolute absorptivity values as there is a slight
variance in uranyl concentration introduced in sample preparation. Figure 29
demonstrates the consistent characteristic uranyl spectra found at 0.01 M HNO3 across
all uranyl concentrations studied. In sharp contrast, Figure 30 shows the complete lack of
peak definition in the 380-410 nm range and the formation of defined peaks in the

69
previously smooth 440-470 nm region for all uranyl concentration values.
Figure 30: UV-Visible Absorbance of 0.01-1 M U concentrations at 7 M HNO3, 0.1 cm pathlength
Figure 31 describes the uranyl spectra at 3 M HNO3 in mid-transformation from the
characteristic shape observed at 0.01 M HNO3 (Figure 29) to the shifted, unresolved
profile from the 7 M HNO3 condition (Figure 30), with shape atypical of a U system.
From Figure 31, it can be seen that higher U concentrations also negatively affect peak
resolution. Thus, the UV-Visible process monitor would provide the greatest resolution

70
of individual peaks when placed in an environment relatively dilute in U and nitric acid.
However, if used to track peaks and peak ratios over time, the UV-Visible process
monitor can be effective at much higher U and nitric acid concentrations.
Figure 31: UV-Visible Absorbance of 0.01-1.26 M U at 3 M HNO3, 0.1 cm pathlength

71
A calculation of molar absorptivities from UV-Visible absorbance values and known
uranyl concentrations shows the dependence on nitric acid concentration. The trends
seen in Figure 32 are present at the 403 and 426 nm peaks as well, indicating that changes
in nitrate influence all uranyl nitrato species formation in a similar fashion.
Figure 32: Molar absorptivities at 414 nm for uranyl in varied nitric acid solutions
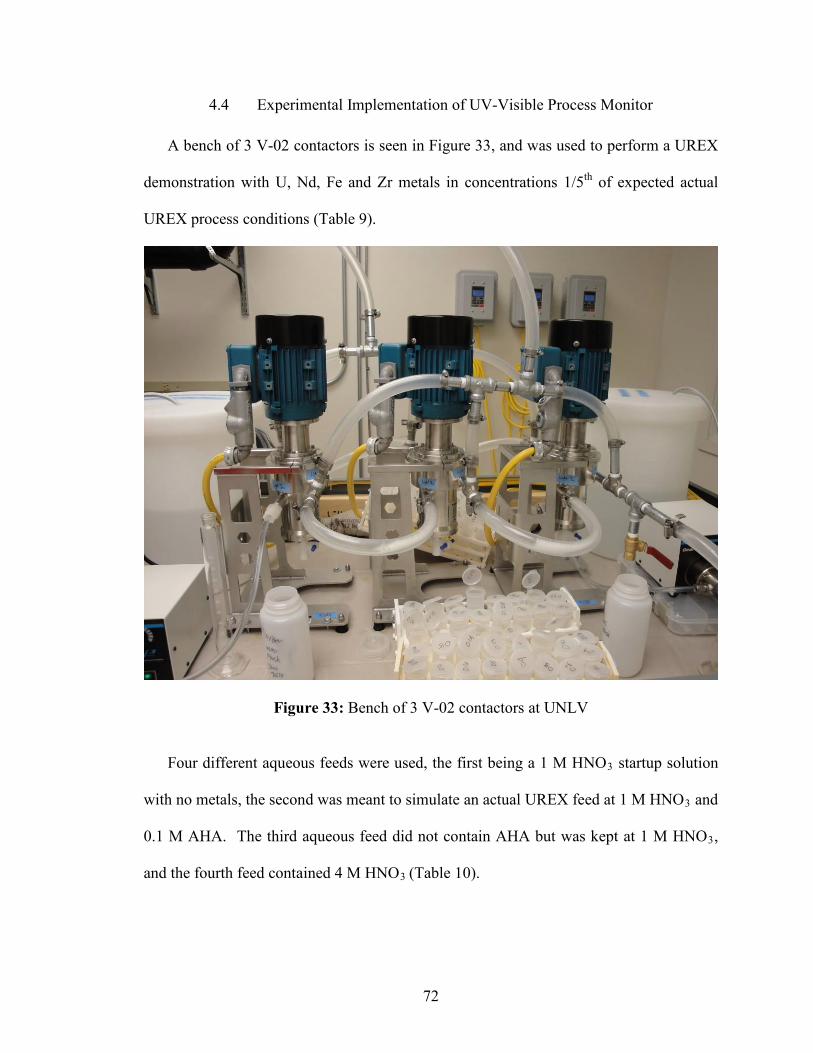
72
4.4 Experimental Implementation of UV-Visible Process Monitor
A bench of 3 V-02 contactors is seen in Figure 33, and was used to perform a UREX
demonstration with U, Nd, Fe and Zr metals in concentrations 1/5th of expected actual
UREX process conditions (Table 9).
Figure 33: Bench of 3 V-02 contactors at UNLV
Four different aqueous feeds were used, the first being a 1 M HNO3 startup solution
with no metals, the second was meant to simulate an actual UREX feed at 1 M HNO3 and
0.1 M AHA. The third aqueous feed did not contain AHA but was kept at 1 M HNO3,
and the fourth feed contained 4 M HNO3 (Table 10).

73
Table 9: Metal concentration in UREX aqueous feeds
Metal Concentration (M) U 0.252 Nd 0.0026 Fe 0.00022 Zr 0.0002
Table 10: Summary of UREX aqueous feed variables
Aqueous Solution [HNO3] [AHA] Cold startup 1 M 0 M
Aqueous feed #2 1 M 0.1 M Aqueous feed #3 1 M 0 M Aqueous feed #4 4 M 0 M
The purpose here was to simulate a change from a UREX to PUREX feed. Two liters of
each aqueous solution was prepared, and the aqueous flowrate was approximately 300
milliliters/minute with an organic flowrate of 600 milliliters/minute. After the cold
startup solution was pumped through the contactors and began to exit the aqueous
product port, the organic phase pump was started. Once solvent was seen exiting the
organic phase outlet port, the pumps were temporarily suspended and aqueous feed was
switched to Aqueous feed #2. This feed lasted approximately 7 minutes, at which point
the pumps were suspended again and the feed was switched to Aqueous feed #3. Again,
after approximately 7 minutes, the pumps were suspended and aqueous inlet was
switched to Aqueous feed #4. Grab samples were collected from the aqueous and
organic outlets every minute by opening a valve installed at the bottom of the outlet
tubing.

74
The UV-Visible spectra of the 403, 414 and 427 uranyl peaks are shown in Figure 34,
plotted every minute for the duration of the 39 minute test. Deviation in metal
concentration in aqueous product are immediately detectable, however the flowrates were
adjusted at several points throughout the test for various reasons. Thus, raw changes in
absorbance values are not simply attributed to the change in aqueous feeds.
Figure 34: UV-Visible absorbance of uranyl peaks over time under UREX process conditions

75
ICP-AES results for the same 1 minute grab samples are plotted to confirm metal
concentration changes as seen by the UV-Visible spectrophotometer (Figure 35). The
ICP-AES detection of U metal concentration over time does correlate well with the UV-
Visible absorbance measurements. Essentially, the ICP-AES measurements confirm the
movement of metals from the aqueous feed solution to the organic phase in the extraction
portion of the experiment (0-17 minutes) and the back-extraction of metals from the
organic to the aqueous phase in the strip portion of the experiment (17-37 minutes).
Figure 35: ICP-AES measured metal concentrations over time in the aqueous product of a UREX extraction (0-17 minutes) and strip (17-37 minutes)

76
The non-steady-state behavior of the U and Fe indicate that the total amount of metal
was either not fully extracted or not fully stripped, respectively, and in either case process
equilibrium was not achieved. Peak to peak ratio measurements help elucidate what peak
absorbance changes can be attributed to change in nitric acid concentration (Figure 36).
Figure 36: Peak ratios over time in UREX extraction and strip

77
Figure 37: Foaming in organic interstage tubing
As in the TRUEX test (Chapter 5), organic phase foaming began within minutes of
two phase flow and continued throughout the duration of the test (Figure 37). No
foaming was observed in the aqueous interstage tubing however, and carryover of
organic into aqueous was minimal (Figure 38). A small amount of aqueous carryover
was observed at the bottom of the solvent outlet tank, on the order of 250 milliliters.

78
Figure 38: No foaming in aqueous interstage tubing
4.5 Conclusions
UV-Visible spectroscopy can be used effectively to discriminate changes in uranyl
and nitric acid concentrations in the 0.01 – 1.26 M U and 0.01 – 8 M nitric acid system.
Alterations of the characteristic uranyl UV-Visible spectral shape at high nitric acid
suggest significant speciation changes, and peak shifts in the high uranyl system similarly
imply an ingrowth of uranyl nitrate species not present at lower uranyl concentrations.
The presence of the differing uranyl nitrate species is expected to substantially affect the
UV-Visible absorption spectra, therefore by coupling with additional spectroscopic
studies, UV-Visible spectral variations can be attributed directly to specific speciation

79
changes. Additionally, uranyl-uranyl coordination may be the basis of the UV-Visible
spectral shifts seen at high U concentrations [93, 141, 142]. By defining uranyl and
nitrate parameters for the various uranyl nitrate species, a continuous model for the UV-
Visible spectra can be developed and used in a process monitoring application. A
milestone for this work is a successful demonstration of the UV-Visible spectroscopy
process monitoring concept in centrifugal contactors under solvent extraction conditions.
On the whole, the continuation of these efforts will enable an online materials
accountability system as well as provide an attribution methodology for identifying
diversion scenarios.
Future work should include the incorporation of other actinides such as Pu,
lanthanides and fission products into the simulated used fuel aqueous feed for UREX
type studies. Following successful benchtop scale studies, experiments can be scaled up
to the metal concentrations expected in process. Collaborations with the national
laboratories should prove to be extremely useful for troubleshooting issues with
centrifugal countercurrent contactors, and utilizing codes such as AMUSE to provide
models for future flowsheet demonstrations. Modeling that incorporates information
such as aqueous feed composition and number of contactors can output expected
separation factors for metals, and aid in rotor speed and flow rate settings for optimum
flowsheet behavior. This prediction of aqueous products and raffinates will allow more
accurate correlation between UV-Visible spectroscopic online monitor results and
specific process changes or upsets.

80
CHAPTER 5
TRUEX EXPERIMENTS
In order to effectively monitor a given solvent extraction process, both the flowsheet
and the related system instrumentation must be well understood and characterized. This
chapter provides detailed information on the setup and testing of a centrifugal
countercurrent contactor system and TRUEX process demonstration. Important factors
for pilot plant and flowsheet development are identified and discussed. The effect of
physical parameters such as holdup volume and solution temperature are relevant both to
flowsheet design and resulting performance, thus their study allows for the optimization
of both physical setup and chemical compositions in processes. Previous works on
flowsheets and centrifugal contactors have seen unexpected results or identified areas for
further research, so another goal of this research is to build upon previous relevant studies
and elucidate discrepancies. Demonstrations such as the one presented in this chapter are
the link between benchtop scale laboratory work and industrial scale commercial
operation. This chapter provides the connection between other benchtop studies
presented in this dissertation and the applicability to industry. The work discussed here is
also used as a basis for the construction of the contactor bank at UNLV (CHAPTER 4) as
well as for identifying potential areas for safeguards in the TRUEX solvent extraction
flowsheet.
Official Use Only is a classification given to information that has the potential to
damage governmental, commercial, or private interests [155]. Applied Technology is a
category given to material in order to preserve the foreign trade value of certain
engineering, development, design, construction, and operational information [156]. In

81
flowsheet testing, design parameters such as number of stages for each process section,
flowrates, organic to aqueous ratio and specific solution compositions are often
characterized as Official Use Only (OUO) or Applied Technology (AT). Therefore,
certain portions of information relevant to the research presented in this chapter will not
be included as they fall under the OUO or AT designation. Generally, results can be
presented if the OUO/AT portion of information is not provided, i.e. the TRUEX
flowsheet can be shown as long as the specific flowrates and concentrations of feed
solutions that fall under OUO/AT are not given.
5.1 Introduction
A pilot plant of 30 annular centrifugal 5 cm CINC V-02 contactors has been
constructed to evaluate various solvent extraction flowsheet applications [157]. In this
work, a TRUEX flowsheet was tested, and both the solvent extraction and contactor
performances were evaluated. Relevant collected data include contactor holdup volumes,
hydraulic performance, temperature profiles, real-time single-stage sampling and metal
distribution values at various locations during transient and at steady-state process
conditions.
The goal of TRUEX is to recover and purify the actinides and lanthanides from
fission products and to prepare a solution for the next separation process (TALSPEAK)
which will separate the actinides from the lanthanides [158, 159]. Previous TRUEX tests
utilized oxalic acid to complex Zr and found that the complexation was incomplete,
resulting in the presence of Zr in most of the process streams including the organic phase.
The resulting organic phase Zr would be fed to the subsequent TALSPEAK in a full
UREX + scheme. Additionally, it was found that significant amounts of the hydrolizable

82
elements in the process precipitated and redissolved at various points during UREX,
TRUEX and TALSPEAK testing [160, 161]. Process monitoring is based on the
concept that a materials accountability and control system can be utilized to detect
excursions from steady-state or expected conditions. Discrepancies between expected
flowsheet results and actual performance mean that these steady-state or expected
conditions are not fully known, therefore any process monitoring system has no control
or base case for a benchmark.
Previous testing of the 30 stage pilot plant included temperature profile measurements
recorded across the cascade using both single-phase and two-phase flow regimes [158,
162]. Previous pilot scale centrifugal contactor studies have been limited to single-stage
performance measurements [163-166]. Most flowsheet tests performed with actual spent
fuel feed solutions are limited to 1 or 2 cm mini-contactors, yielding fairly low reported
stage efficiencies due to flow inconsistencies related to their small size [158]. In
addition, stage-wise sampling at low flows can upset process equilibrium so it is avoided
in mini-contactors. This means that single stage distribution values cannot be analyzed,
leading to an over-estimation of the number of stages required for a particular flowsheet.
In attempts to optimize the flowsheet, one effort is to utilize the minimum necessary
number of contactor stages for the mass transfer efficiencies required, as this reduces size
and cost of the plant as well as volumes of solution for testing. Cold pilot scale testing
provides design data for steady-state operating parameters and stage-wise efficiency for
flowsheets, allowing for the testing of proposed flowsheets and validation of modeling
data from codes such as AMUSE [157]. Again, these studies provide information needed
to enhance solvent extraction flowsheet understanding and performance. This

83
understanding is fundamental to the concept of process monitoring and materials control,
as a process monitor cannot provide useful information on confirmation of flowsheet
chemistry or materials accountability if the steady-state behavior of the method under
investigation is unknown.
5.1.1 Equipment
The mechanical equipment making up the pilot plant includes thirty CINC V-02
centrifugal contactors with frequency drives, five liquid supply pumps, four process
solution heaters with controllers, multiple thermocouples, and assorted fluid flow
components (Figure 39). All of this is mounted on a stainless steel support structure and
is located within a spill containment system. Inlet/outlet interconnective tubing for this
evaluation was 5/8 inch I.D. chemically compatible Tygon tubing. Feed and product
tanks are located directly below the contactor cascade, still within the spill containment
system.

84
Figure 39: Thirty stage centrifugal contactor pilot plant
Each contactor has a 5 cm diameter rotor and a light/heavy phase weir package
attached to a shaft and bearing assembly connected to the motor. The V-02 contactors
have an operating range of 0.1 to 2.0 liters/min and have a variable rotor speed ranging
from 0 to 6000 rpm. The fan-cooled 1/3 horsepower motors are explosion-proof rated
and operate on 208 volt three-phase power. The pilot plant has automated process
control capabilities coupled with a data acquisition system which allow LabVIEW
command of contactor startup and shutdown, rotor speeds, pump flow rates, heater
control and real-time feedback from thermocouples and flowmeters (Figure 39).
Additional information specific to the pumps, flowmeters, signal processing, back
V-02 contactors
Pumps
Heaters Tanks
Spill containment
system

85
pressure valves, heaters, in-line filters, thermocouples, fittings, off-gas vents, process
control and data acquisition systems is available elsewhere [157].
Figure 40: Typical fluid feed system with components
5.2 Experimental Techniques and Setup
5.2.1 TRUEX Flowsheet
The flowsheet tested was a slightly modified version of a previously tested TRUEX
flowsheet [160]. The finalized flowsheet contained organic (light) and aqueous (heavy)
phases that flowed in a counter-current fashion, employed all 30 stages in the pilot plant,

86
and included extraction, scrub, strip, solvent wash and solvent reacidification sections
(Figure 41). It should be noted that all solution inlets are often termed “Feed” and outlets
are “Product” or “Raffinate.” Generally the Extraction section aqueous outlet is the
flowsheet “Raffinate” and the Strip section aqueous outlet is the flowsheet “Product.”
Specific stage numbers and flow rates for the aqueous and organic solutions are Applied
Technology, so will not be included in this document.
Figure 41: Contactor pilot plant flowsheet diagram
The TRUEX solvent used for this test consisted of 0.2 M CMPO (octyl (phenyl)-N,N-
diisobutylcarbamoyl-methylphosphine oxide) in 1.4 M TBP (tri-butyl phosphate)in n-
dodecane hydrocarbon diluent. All chemicals were reagent grade and used as received,
with information on their acquisition from vendors available elsewhere [157]. In a
previous experiment, the TRUEX solvent had been washed with sodium carbonate and
reacidified with dilute nitric acid, with the solvent composition and purity confirmed
using an 241Am purity test [167]. The starting solvent volume for testing was 10 liters.
Based upon previous tests, the aqueous feed solution used was a ~ 4.4 M nitric acid
solution adjusted with ~ 0.07 M oxalic acid to complex the Zr thus minimizing extraction
!"#$%&#'()*
*
+&$,-*
*
+#$'.*
!
/$0%)'&*
!
+&$,-*
!
+#$'.*
*
12*
*
+#$'.*
*
12,3(,4*5336!
7%48*
!
93%&'6:*
!
7%48*
*
93%&'6:*
*
7%48*
!
93%&'6:*
!
/$0%)'&*93&;&<3!

87
[161]. The target and actual concentrations of the lanthanides and fission product
surrogates in the aqueous feed are listed in Table 11.
Table 11: Aqueous feed target and actual compositions
Component Target Concentration (M)
Actual Concentration (M) Parent chemical
Oxalate 0.07 0.07 Oxalic acid H+ 4.2 4.4 Nitric acid
La-3 0.0011 0.0012 La(NO3)3. 6H2O
Ce-3 0.0024 0.0025 Ce(NO3)3. 6H2O
Nd-3 0.0033 0.0035 Nd(NO3)3. 6H2O
Eu-3 0.0002 0.0002 Eu(NO3)3. 5H2O
Cs-1 0.0017 0.0017 CsNO3 Sr-2 0.0057 0.0059 Sr(NO3)2 Zr-2 0.0023 0.0024 ZrO(NO3)2
A nitric acid scrub solution was used to mimic the previous TRUEX test studies
[160]. A TRUEX flowsheet test [159, 168-172] consisted of three scrub sections which
included oxalic acid for Zr complexation followed by a more concentrated nitric acid for
removal of residual oxalic acid then a final dilute nitric acid to reduce acid concentration
prior to the solvent entering the strip section. By addition of the oxalic acid directly to
the aqueous feed, only a single scrub solution consisting of 1.4 M nitric acid was
incorporated.
The loaded solvent was stripped with a buffered diethylenetriaminepentaacetic
acid/lactic acid solution that was pH adjusted. A dilute sodium carbonate wash and dilute
nitric acid reacidification were used to prepare the solvent for recycle, after which it was
reintroduced into the extraction section of the pilot plant.

88
5.2.2 Demonstration and Data Collection
Prior to the actual demonstration, all pumps were calibrated and low-mix sleeves
were installed on the raffinate and strip aqueous phase outlets and the wash and
reacidification organic phase outlets. Low-mix sleeves restrict solution flow to the rotor
portion of the contactor, therefore they are employed to increase phase disengagement
and decrease carryover (aqueous phase in organic phase and vice versa) [173]. The
contactor rotors were started at 3750 rpm initially, with the exception of the low-mix
sleeve contactors which were started at 4000 rpm, as previous hydraulic tests suggested
rotor speeds in the range of 3500-4000 rpm assisted with smooth interstage flow profiles
[153, 163].
For startup, aqueous feed solutions were pumped to their input stages and allowed to
flow through their entire section prior to starting the solvent flow. All aqueous solutions
used for initial startup had the same makeup as the actual experimental test solutions,
with the exception of the aqueous extraction feed which was a blank (no metals) nitric
acid solution representative of the actual experimental extraction feed. Organic phase
foaming was observed almost immediately after solvent flow was introduced, at which
point all rotor speeds were reduced to 3500 rpm. The foaming persisted so the rotor
speeds were further reduced to 3350 rpm and finally 3000 rpm for the remainder of the
testing. Foam was seen in the interstage tubing throughout the pilot plant (Figure 42).
Time zero of the demonstration occurred when the solvent flow first exited the cascade,
approximately 15 minutes from the start of organic flow, at which point the blank
aqueous feed solution was switched to the actual aqueous feed solution with metals.

89
Figure 42: Foaming evident in interstage tubing throughout pilot plant
As a result of the continuous foaming and resulting organic carryover into the
aqueous phase, it became evident that the total solvent volume being recycled was
decreasing noticeably as seen in the solvent tank. Therefore, an additional 2.5 liters of
fresh solvent was added to the recycle tank. This introduced some uncertainty in solvent
turnover rates as calculated for steady-state conditions, therefore steady-state samples
were taken 40 minutes later than originally planned to ensure the system had reached
steady-state. Generally, five solvent turnovers are the estimation for when a solvent
extraction process with recycled organic reaches steady-state [174].
Valves

90
In order to assess the performance of the specific flowsheet and the physical setup of
the contactor pilot plant, over 200 samples were taken throughout the process
demonstration (Table 12). Valves installed at the contactor aqueous and organic
inlet/outlet ports allowed for sampling of individual stages, and valves on the solvent
recycle, aqueous product and raffinate streams provided for their sampling. Selected
stages were sampled very early in the test during the transient phase to support kinetic
modeling efforts to determine approach to steady-state. Following that, samples were
taken from each aqueous product stream every 20 minutes and an entire profile was taken
at 140 minutes, meaning samples from every stage from both phases. This was to
evaluate steady-state conditions and calculate individual stage efficiencies.
Table 12: TRUEX demonstration sample plan summary
Section Phase Time (min) Extraction Aq Product 20, 40, 60, 80, 100, 120, 140, 160 Extraction Both 2, 3, 4, 5, 7 Extraction Feed Inlet 1, 2, 3
Scrub Both 2, 3, 4, 5, 7 Strip Both 2, 3, 4, 5, 7, 20, 40, 60, 80, 100, 120, 140, 160 Wash Aq 20, 40, 60, 80, 100, 120, 140, 160
Reacid. Both 20, 40, 60, 80, 100, 120, 140, 160 All Both 140, 180 All Feed Tanks 0
All Product Tanks 180
Logistically, sampling was achieved by first clearing the valves (see black knobs on
either side of contactor housings in Figure 42) of any stagnant solution purging into waste
container, then collecting a 10-15 milliliter sample of flowing process solution by
opening the valve for approximately 2-3 seconds. The expectation is that this sample
volume will not upset the process during transient, steady-state or shut down operation.
This is true if the proper volumes and organic to aqueous ratios in the contactor setup are

91
maintained during sampling as to not affect extraction, scrub or strip efficiencies. The
steady-state samples obtained at 140 minutes were recontacted at process temperatures
for several hours, separated and analyzed. A total of 176 samples were collected and
analyzed for metal concentrations via Inductively Coupled Plasma-Mass Spectrometry
(ICP-MS). The flowsheet testing lasted for a total of 172 minutes of continuous two
phase flow. To conclude the test, all solution feed pumps and contactor rotors were
shutdown simultaneously. Solutions were collected from each contactor drain and
archived.
5.3 Results and Discussion
The flowsheet test lasted for a total of 172 minutes and generally operated as
expected, with the exception of the organic foaming in light phase interstage tubing
throughout the test. With the addition of the extra 2.5 liters of fresh solvent, the solvent
experienced an estimated 6-8 turnovers, where turnover time is calculated by estimating
the phase holdup volume (liters) of the contactor vessels and interstage tubing, and
dividing by the flowrate of the phase (liters per time). The addition of fresh solvent did
not impact solvent flow between stages and foaming was not observed in the heavy phase
interstage tubing.
Samples taken during testing showed that solvent carryover into the aqueous phase
was occurring, likely due to the foaming (approx. 2% in aqueous raffinate, 0.8% in the
strip product and 0.02% in the reacidification product). This was estimated by placing
select samples in a volumetric flask and observing phase carryover. Organic phase
carryover into the carbonate wash and reacidification effluent as well as aqueous phase
carryover in the solvent was not measurable. As discussed previously, the use of low-

92
mix sleeves is intended to increase phase separation and thus decrease phase carryover.
However, the low-mix sleeves at the raffinate outlet and strip product outlet did prevent
the carryover of solvent in aqueous phase as it was caused by the foam forming in the
lower collection ring of the affected stages.
5.3.1 Steady-State Determination
Metal concentrations in all samples were analyzed with ICP-MS, detection limits
given in Table 13. Figure 43 and Figure 44 display the approach to steady-state plotted
data for the metal concentrations in raffinate outlet and strip product outlet, respectively.
Table 13: Detection limits for ICP-MS metals analysis
Isotope Detection Limit (Mol/Liter)
140Ce 2.51E-09 133Cs 1.93E-10 151Eu 1.46E-09 153Eu 1.22E-09 139La 1.65E-09 143Nd 3.47E-09 145Nd 3.08E-09 146Nd 3.40E-09 88Sr 4.58E-10 90Zr 1.19E-07 91Zr 1.15E-07
The steady-state plots shown in Figure 43 indicate that Cs, Sr and Zr reach steady-
state conditions within 20 minutes. The lanthanides were not included in this graph due
to sample results at or below detection limits indicating they were effectively extracted
by the TRUEX solvent. The samples taken during the transient startup period of the test
indicated that the extraction section was nearly at steady-state conditions after 7 minutes

93
of runtime. The estimation of steady-state can be given when metal concentration
variance over time is less than 10% [174].
0
0.0005
0.001
0.0015
0.002
0.0025
0.003
0.0035
0.004
20 40 60 80 100 120 140 160
Cs
Sr
ZrCon
cent
ratio
n (m
oles
/L)
Time (min)
Figure 43: Steady-state plots for raffinate outlet
The plots of the strip product lanthanide concentrations in Figure 44 show sample
results under steady-state conditions. The noticeable increase in Ce and Nd
concentrations after 60 minutes may be attributed to the increase in system temperatures
as shown in the strip section temperature profiles found in Figure 47 or possible

94
analytical error. Stripping efficiency increases with increasing temperature with the
TRUEX strip solution.
Figure 44: Approach to steady-state at strip product outlet
Concentration profile plots shown in Figure 45 for Ce, Nd, Eu and La indicate the
lanthanides were efficiently extracted and stripped with the number of stages used for this
flowsheet evaluation. The contactor stage numbers cannot be presented in Figure 45 or
Figure 46 as they are OUO, however the presence of metals in the organic phase shown
in the middle section of the plot correspond to the scrub portion of the flowsheet. From

95
Figure 41, it follows that the extraction section precedes the scrub, and the strip section
follows the scrub. The data in Figure 45 suggest that fewer extraction and strip stages
would have been adequate to achieve desired removal efficiencies as the maximum
loading of the organic is seen in the first few scrub stages – immediately after solvent
loading in the extraction section. In addition, the organic phase concentration drops off
immediately in the strip section, indicating that the first few stages are sufficient to strip
the loaded lanthanides from the solvent.
0
0.002
0.004
0.006
0.008
0.01
CeEuLaNd
Con
cent
ratio
n (M
oles
/L)
Contactor Stage
Figure 45: Lanthanide concentration profile across the cascade in organic phase at steady-state

96
Figure 46 shows the concentration profile for Cs, Sr and Zr using aqueous phase
sample results only and indicate the TRUEX solvent did not extract significant quantities
of these metals (fission products). The Zr data indicated it was present in the aqueous
phase of the scrub section in the flowsheet. This would suggest a small fraction of Zr
may have been extracted by the solvent; however, this fraction was scrubbed by the scrub
solution.
0
0.0005
0.001
0.0015
0.002
0.0025
0.003
0.0035
CsSrZr
Con
cent
ratio
n (M
oles
/L)
Contactor Stage
Figure 46: Concentration profiles for fission products across the cascade in aqueous phase at steady-state

97
5.3.2 Removal Efficiencies
Sample results taken from both phases for the full cascade profile were used to
calculate the percentage of metals found in respective effluent streams and the removal
efficiencies (REff) for those metals [157]. Table 14 shows the calculated results. The
percentages of metals found in the raffinate and strip product (both aqueous outlets) were
calculated using Equation 4.
Feed
outletAqoutletAq FlowrateionConcentrat
FlowrateionConcentratMetals
)()(
%100% Equation 4
The metal removal efficiency results were calculated using Equation 5, where for
the lanthanides the numerator is calculated for the raffinate (extraction aqueous outlet)
and for the fission products the numerator is calculated for the strip product.
Feed
outletAqMetal FlowrateionConcentrat
FlowrateionConcentratREff
)()(
1%100 Equation 5
Table 14: Percentage of metals in effluent streams just prior to shutdown and calculated
removal efficiencies.
Effluent stream Ce Eu La Nd Cs Sr Zr
Raffinate < 0.002 < 0.014 < 0.007 < 0.002 >100 98.1 95.5
Strip Product 90.0 91.2 91.5 92.7 <
0.001 < 0.001 0.6
R Eff > 99.9 > 99.9 > 99.9 > 99.9 100. 100. 99.4
The calculated quantity of lanthanides in the strip product indicated nearly a 10 %
loss, however there was no detected lanthanide concentration in the raffinate or in the

98
organic leaving the strip section. The 10 % material loss is likely due to a combination of
flowrate inaccuracies associated with the data acquisition system in conjunction with
flowmeter measurement and analytical error due to matrix interferences. All pump
flowrate calibrations were performed at ambient laboratory temperature, and flowmeters
were designed for measuring water at 20° C. Thus, considerable flowmeter error is
expected for measurement of organic phase at elevated temperatures. The Cs and Sr
were not extracted and thus ended up in the raffinate. Removal efficiencies indicated
very good performance of the tested TRUEX flowsheet with > 99.9% extraction of the
lanthanides without extraction of the Cs and Sr and with minimum Zr extraction (0.6%).
Overall, these results indicated the flowsheet performed well and is suitable for
lanthanide extraction, however future work may include the investigation of a slightly
higher concentration of oxalate to fully suppress Zr extraction. While it is possible that
some small amount of Zr in the organic phase may not adversely affect the solvent
extraction flowshseet, efforts to keep Zr out of the organic phase will continue as part of
flowsheet optimization studies [157].
5.3.3 Mass Transfer Stage Efficiency
Individual stage efficiency calculations were made to further evaluate the overall
performance of the TRUEX flowsheet in the contactor pilot plant. The re-equilibration
samples were prepared by heating the original steady-state samples to test temperatures
recorded at 140 minutes, then contacting appropriate volumes to match organic to
aqueous ratios utilized in the appropriate section of the flowsheet. Analyzed metal
concentrations from aqueous and solvent phase steady-state samples and the re-
equilibrated steady-state samples were used to calculate stage efficiencies. The mass

99
transfer stage efficiencies for selected extraction and strip stages were calculated using
Equation 6 [157].
)()(%100
ineq
in
XXXX
Equation 6
In this case, X is the metal concentration of the effluent, Xin is the inlet metal
concentration, and Xeq is the metal concentration of the effluent following re-
equilibration, where inlet is the stage inlet and effluent is the stage outlet. Lanthanide
stage efficiency results for select stages in the extraction section and in the strip section
are included in Table 15.
Table 15: Individual stage efficiencies for selected stages.
Stage # Ce (%) Eu (%) La (%) Nd (%)
Ext1 88.9 93.6 93.3 92.0
Ext2 93.3 91.8 94.5 93.5
Ext3 61.4 88.5 29.4 89.2
Ext4 ~1001 85.1 92.5 88.3
Ext5 90.2 90.0 89.5 89.9
Strip1 60.0 70.6 59.0 62.7
Strip2 ~1001 84.7 ~1001 99.5
Strip3 ~1001 97.9 ~1001 ~1001 1. Calculated Efficiency was greater than 100% likely as a result of analytical and/or experimental
uncertainty
Individual stage efficiencies in the extraction section range from 85 % to 95 %
excluding Ext3 results for Ce and La and Ext4 results for Ce. The low and greater than
100% results are likely due to erroneous analytical results as good agreement was
obtained for the individual lanthanide stage efficiencies throughout the rest of the

100
analyzed stages. The efficiencies are slightly lower than the expected range of 95% to
100% [157]; however, they are certainly high enough to achieve good separation and
thus the flowsheet performance is considered successful. The strip section stage
efficiencies range from 59 % to 100 %. It is unclear why Strip1 efficiencies are lower but
it is speculated that they may be due to analytical error, again because good agreement
was seen through the rest of the section and measured stage efficiencies increase to near
100% in later strip stages.
5.3.4 Temperature Profiles
Temperature profile data recorded with the data acquisition system was plotted for the
duration of the flowsheet testing. Aqueous phase temperature profiles for the extraction,
scrub, and strip sections are included in Figure 47.

101
Figure 47: Aqueous and organic phase temperature (°C) profile averaged across respective extraction, scrub and strip sections
Generally, temperatures in all stages increased during the first 20 minutes of testing,
which is attributed to the test startup procedure where freshly prepared (elevated
temperature) nitric acid solutions were used. After the initial temperature increase at
about 20-30 minutes, stage solution temperatures leveled off and started to trend slightly
upward as the averaged ambient laboratory temperature increased throughout the
morning. The increase of temperature over time is likely due to a combination of
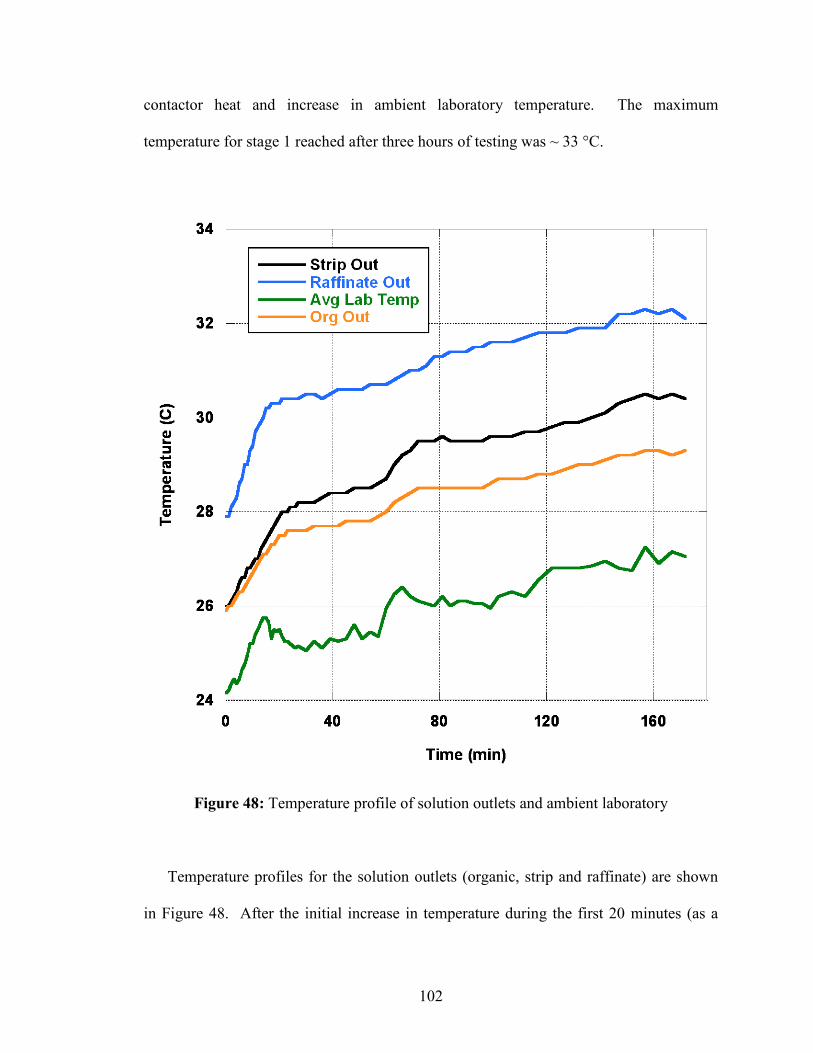
102
contactor heat and increase in ambient laboratory temperature. The maximum
temperature for stage 1 reached after three hours of testing was ~ 33 °C.
Figure 48: Temperature profile of solution outlets and ambient laboratory
Temperature profiles for the solution outlets (organic, strip and raffinate) are shown
in Figure 48. After the initial increase in temperature during the first 20 minutes (as a

103
result of freshly prepared startup solution entering the system), the continuous trend of
increasing solution temperature with increasing ambient laboratory temperature is
evident. Again, the temperature profiles are extremely relevant to flowsheet testing as
extraction parameters and efficiencies are based on temperature. Flowsheet parameters,
operation and chemistry under steady-state and transient conditions must be known for an
online process monitor to have a benchmark for comparison. Expected flowsheet
behavior must be known for a materials accountability and process control system to be
able to notify of a deviation from normal. The similarity between the contactor
temperature trend and the averaged laboratory temperature indicates that after initial
temperature equilibrium is reached, solution temperatures across the cascade are more
dependent on ambient laboratory temperature than equipment-generated heat. Evidenced
by comparing the average laboratory temperature plot with flowsheet section temperature
plots, there was a small but comparable temperature increase that occurred within 20
minutes followed by a very similar upward temperature gain of ~ 2-3° C over the
remainder of the testing. The maximum solvent temperature was determined to be below
35 ºC for the duration of the test. The intermittent addition of ambient temperature
aqueous solutions throughout the cascade minimizes temperature increases, and the
recycling of organic provides for some normalization of temperature increase in that
phase.
Results from previous ambient lamp oil/water, two-phase temperature profile testing
indicated the maximum solution temperature measured was approximately 32° C, under a
total flowrate of 1.4 liters/minute, rotor speeds of 4000 rpm, and an average laboratory

104
temperature of 25° C [162]. Thus, the results from this TRUEX demonstration are in
agreement with previous literature values under similar operating conditions.
5.4 Conclusions
An evaluation of the performance of the TRUEX process in a 30 stage centrifugal
contactor pilot plant has been completed. The overall equipment operation, actual
flowsheet performance including steady-state data, removal efficiencies, individual stage
mass transfer efficiency, as well as temperature profiles were measured and reported.
Overall the flowsheet performed as expected, and all equipment operated as designed.
Metal concentration data indicate the cascade was operating at steady-state condition
within twenty minutes. Removal efficiencies indicate > 99.9% of the Ce, La, Eu, and Nd
was partitioned to the strip product stream. TRUEX is not designed for Cs/Sr separation,
and as expected these metals were not extracted by the TRUEX solvent. The calculated
removal efficiency for Zr indicates that ~ 0.6 % of the metal may have extracted.
Organic phase foaming was observed in the light phase interstage tubing almost
immediately after solvent flow had begun, with the expected cause being high rotor speed
causing air to be mixed with solvent. Other causes of foaming are high solvent flowrates
or if the contactors are inadequately vented. Foaming in the light phase collector ring
was also verified by inspection of samples taken of the aqueous raffinate and strip
product streams. These aqueous samples contained small amounts of solvent. Foam
volume can build in the light phase collector ring and eventually be pushed up to the
heavy phase collector ring where it is discharged with the organic constituent. At 3000
rpm the solvent flow remained steady; however, some foaming was still observed. The
use of low-mix sleeves did not alleviate organic in aqueous carryover. No foaming was

105
observed in the heavy phase interstage tubing. An estimated solvent in aqueous
carryover of ~ 2% was measured in the raffinate while ~ 0.8% carryover was measured in
the strip product (approximations from pumping out solution tanks). These foaming and
carryover issues suggest further evaluation of pilot plant operating conditions and/or
equipment design, specifically the installed off-gas ventilation tubing and the solution
flow path design.
The flowmeter measurements of the organic phase did indicate a continuous small
increase in solvent flowrate throughout the entire TRUEX demonstration, with the
maximum reaching approximately 117% of the target flowrate. In contrast, aqueous
solution recorded flowrates indicated minimal increases (all <5%) over the
demonstration, with the exception of the aqueous feed which increased by approximately
7%. Again, the increases in flowrates were likely due to changes in solution properties as
temperatures increased, resulting in a deviation from pump calibration conditions and
reduction in flowmeter accuracy.
Individual stage mass transfer efficiency results ranged from 85 % to 95 % in selected
extraction stages and from 59-100 % in selected strip stages. It is speculated that the
lower efficiencies reported for a stage in the strip section are attributed to analytical
uncertainty, as higher efficiencies were calculated throughout the remainder of stages.
Temperature profile graphed data for the TRUEX flowsheet testing agreed with previous
temperature profile data reported using a lamp oil/water solvent pairing at ambient
solution operating temperature.
The success of the TRUEX demonstration was used directly for the setup and
demonstration of a UREX flowsheet (Chapter 4). Lessons learned from the TRUEX test

106
include slight physical changes to the contactor setup such as employing a steeper angle
flow path between contactors is desired an adjustment of offgas outlets to minimize
foaming. Through the TRUEX experimental demonstration, these improvements can be
incorporated into the contactor system and following flowsheet tests for demonstration of
online process monitoring. The foaming issues and anomalies in stage mass transfer
efficiencies show that further flowsheet testing is warranted. These issues, along with the
temperature profile, can be used as the basis for further research and analysis of
flowsheet data such as from the UREX demonstration. Moreover, a flowsheet must be
fully characterized and understood in order for an appropriate process monitor to be
developed and successful at detecting diversion scenarios. For example, deviations in
flowsheet performance due to temperature changes must be documented and attributed to
specific temperature values so that when deployed, a process monitor (or user) can
differentiate between expected changes in process conditions due to physical
circumstances and actual material diversion or process upset.

107
CHAPTER 6
DEVELOPMENT OF A DRY PROCESSING FLOWSHEET AND SAFEGUARDS
APPROACH
The motivation for the work presented in this chapter is to develop a dry process for
recycling of used fuel for General Atomics’ Energy Multiplier Module (EM2) reactor.
The goal is to recycle both existing LWR used fuel stockpiles and EM2 discharge.
Towards this end, the technical feasibility of dry fuel treatment options previously
studied must be considered. From an extensive review of previous dry processing
technologies, an EM2 flowsheet was developed and corresponding options for materials
accountability and safeguards were proposed. The composition of recycled used fuel
from this flowsheet was modeled and used to aid in next generation EM2 core
calculations. The waste materials from the proposed flowsheet were also modeled and
categorized according to the existing nuclear waste framework. As the EM2 reactor is a
proposed design from a commercial vendor, straightforward engineering and favorable
economics are highly valued. Though the proposed EM2-based dry processing fuel cycle
has not been experimentally tested yet, the goal of this development study is to reduce the
used fuel generated per kWe as compared with the current open fuel cycle while
incorporating a higher level of proliferation resistance than closed fuel cycles utilizing
wet reprocessing technologies.
6.1 Introduction to EM2
As in solvent-extraction based reprocessing, dry recycling technology can be applied
to used LWR fuel to remove certain fission products, allowing the bulk of used nuclear

108
fuel to be recycled into new nuclear fuel. One option for the utilization of this recycled
LWR fuel is the General Atomics EM2 reactor design. In this work, EM2 is
representative of one of the newest trends in nuclear reactors, the small modular reactor,
and is used to provide the basis for a dry processing based modified open fuel cycle. The
EM2 is a modified version of General Atomics’ high-temperature, He-cooled reactor, with
each module producing about 240 MWe of power at 850°C. The initial “starter” section
of the EM2 core would be enriched to approximately 12% 235U and provide the neutrons
required to convert used nuclear fuel or depleted U into fissile fuel. The core life
expectancy is ~30 years (using used nuclear fuel and depleted U) without refueling [175].
Reactor specifics beyond these general characteristics and those relevant to fuel
composition will not be discussed. Safeguards will be necessary in the utilization of any
used fuel reprocessing technology, but are technology- and flowsheet- specific, so
proliferation resistance methods must be developed for each used fuel treatment option.
In order to design safeguards for a used fuel treatment process, the process itself must be
understood, and from there areas for materials accountability and process monitoring can
be identified.
The scope of this work is to evaluate the fuel cycle of LWR discharge dry processed
for recycling, and identify potential areas for safeguards in the dry processing scheme. A
thorough review of the literature provides confirmation of the dry processing
(AIROX/OREOX) technical feasibility, while a study of experimental conditions and
fission product removal percentages allows a dry processing scheme to be developed and
tailored for LWR discharge for recycle into an EM2 reactor, and for EM2 discharge for
recycle into a new EM2 core. Benefits of this advanced fuel cycle include reducing the

109
mass and possibly the number of waste packages of current UNF needing to be disposed
of as HLW, minimizing nuclear waste in general, reusing valuable parts of used nuclear
fuel to maximize the energy derived from U ore and potentially deplete or control
weapons-material inventories, while maintaining proliferation resistance [62].
6.1.1 EM2 fuel cycle goals
Several universal goals among used fuel processing technologies include
maximization of energy recovery, minimization of radioactive waste that needs long-term
disposal, economic feasibility and proliferation resistance [53, 176-178]. The EM2-
based modified-open fuel cycle proposes to meet all of these goals through recycling of
U, Pu and transuranics (TRU) and minimizing the amount of used fuel needing long term
management. Additionally, the need for HLW repositories is directly linked to the
production and accumulation of UNF from commercial nuclear power production, with
the current inventory estimated to match the legislated repository capacity of 70,000
MTHM [24].
EM2 deployment is proposed to utilize existing UNF stockpiles while meeting U.S.
energy demands, so the current proportion of electricity generated by nuclear power is
used as a benchmark. Three nuclear marketshare scenarios are considered in Figure 49,
with information on current U.S. energy demand and nuclear proportion of electricity
generation taken from literature [179]. Shown in blue are continued 2010 levels with no
annual growth. Shown in green are a maintenance of 20% marketshare and 1% annual
energy demand growth. Shown in red is an increase to 35% marketshare with 1% annual
energy demand growth. Two nuclear reactor deployment scenarios are presented. The
solid lines represent all the LWRs generation of all nuclear energy. The dotted lines

110
represent all LWRs being replaced by EM2s in an incremental fashion: 100% LWRs from
2010-2030, 50% LWRs and 50% EM2s from 2030-2050 and 100% from 2050-2100. The
fundamental assumption for generation of UNF from LWRs is that at the 2010 nuclear
energy level, the production of UNF is 2000 MT/year. Key points to note are that if
existing LWR technologies are used to continue to provide nuclear power at 2010 levels,
the accumulation of UNF will require at least 3 repositories in the next 90 years.
0
1 105
2 105
3 105
4 105
5 105
6 105
7 105
2020 2040 2060 2080 2100
Yucca Mtn. CapacityContinuing 2010 NE Generation20% Marketshare, 1% Annual Growth35% Marketshare, 1% Annual GrowthContinuing 2010 NE Generation LWR+EM220% Marketshare, 1% Annual Growth LWR+EM235% Marketshare, 1% Annual Growth LWR+EM2
MT
UN
F
Year Figure 49: Used nuclear fuel accumulation scenarios

111
If existing LWR technologies are deployed to keep up with a 20% nuclear marketshare
and a 1% annual energy demand growth, it is likely that 5 repositories will be necessary
within a century. If existing LWR technologies are deployed more aggressively to attain
a 35% nuclear marketshare and keep up with a 1% annual energy demand growth, at least
8 repositories will be needed by 2100. Generally, the combination fleet of LWRs and
EM2s produces UNF at a slower rate than the all-LWR fleet case. As EM2s burn LWR
used fuel and have a much longer core life than LWRs (~30 years), more aggressive EM2
deployment would increase the reduction rate of UNF total inventory.
As EM2 is proposed to exploit LWR UNF as a new fuel supply as well as recycle its
own discharge, the elemental makeup of both resources must be characterized.
Approximately 96% of LWR used nuclear fuel mass is recyclable material, 95% as U and
1% as the TRUs (Np, Pu, Am, Cm) with the remaining 4% being the fission products
(FPs). A full elemental breakdown of LWR and EM2 UNF is shown in Figure 50 [180].

112
0
2 105
4 105
6 105
8 105
1 106
0 20 40 60 80 100
LWR 60 GWd/tEM2 140 GWd/t
g/M
THM
Z
Figure 50: Elemental makeup of LWR and EM2 used fuel [180]
For EM2 discharge, the fission products make up approximately 15% of the mass, due to
higher burnup (nominally 140 GWd/t). A dry fuel cycle that recycles used LWR fuel can
provide maximum utilization of energy from the original mined U ore, reduction of
potential repository source term, simplified processing design and robust proliferation
resistance.
6.2 Previous dry processing studies
Discharged LWR fuel can be recycled in a dry process and utilized as fuel for future
nuclear reactor cores. The general dry process is based on voloxidation, AIROX,

113
OREOX and DUPIC technologies previously studied for recycle of used LWR fuel.
After dry processing, if further separations are desired, solvent extraction systems can be
coupled with AIROX/OREOX/DUPIC to produce highly separated used fuel [160, 181].
Voloxidation is often proposed as a head-end step for multiple types of fuel to precede
more extensive used fuel separations such as electrorefining or solvent extraction [182-
184]. In addition to studies on dry processing as related to used nuclear fuel treatment,
contamination of areas such as the Hanford site have led to studies focused on the
extraction of 137Cs, 90Sr, 60Co and U from Portland cement by means of volatility
processes. However, to date these studies have shown limited success with only 137Cs
successfully being removed at temperatures of 1200°C or greater [185].
Fission products are often classified as volatiles or semivolatiles in dry processing
literature. Volatilization depends on the chemical form and volatility of fission products,
which is determined by Gibbs-energy minimization. Semivolatiles (Cs and Ru) have
boiling points above that of water, while volatiles have boiling points of less than 200°C
and include 3H, Xe, Kr and I. Metals such as Sr, Y, Zr, Nb, Mo, Tc, Rh, Pd, Ba, La, Ce,
Pr and Nd are considered to be relatively nonvolatile, however they can form volatile
species [186, 187]. Volatiles generally are able to diffuse through the fuel matrix, while
low-volatile fission products depend on the partial pressures of the chemical forms of the
fission products in order to be released from the used fuel. An additional mechanism of
release results from the volatilization of the fuel matrix itself as UO3. Other release
behaviors can be restricted (such as that of Te and Sb) due to chemical trapping in
Zircaloy cladding [29].

114
Following the voloxidation and volatilization of fission products from used fuel, the
radionuclides must be trapped from the gas for effective wasteform production. A
relevant study focused on an off-gas treatment system proposed to trap volatile fission
products present from the oxidation of irradiated (PWR ~37 GWd/t, 27 year cooled) UO2
to U3O8 [188]. Individual filters in distinct zones were used to trap I, Tc and Cs in order
to separate the radionuclides from the used fuel and each other. Granular zeolites or
aluminosilicate disks were used to selectively trap the fission products, with multiple
tests demonstrating up to 100% I trapping, 71% Cs trapping and 72% Tc trapping. The
physical setup had 2.5 cm sections of UO2 oxidizing at the bottom of a column under
flowing oxygen or air (0.5 liters/minute) at 500 °C for 3 hours. As the fission products
moved up the column, they passed through a 800-1000 °C zone which trapped the Cs, a
600 °C zone which trapped the Tc and lastly a 150 °C zone trapping the I [188]. These
trapping technologies will need to be utilized to capture AIROX/OREOX volatilized
fission products to provide a comprehensive EM2 flowsheet for used fuel treatment.
6.2.1 AIROX
AIROX was initially developed in the 1960s as a dry, pyrochemical, low-
decontamination method for recycling used LWR fuel and has gone through several
cycles of process demonstration including fuel refabrication and irradiation [189-191]. It
simultaneously declads and pulverizes the spent fuel, which is then reenriched
(depending on reactor, not shown in figure), repelletized and recycled to the reactor. One
benefit of AIROX processing, on top of the fairly straightforward process design, is the
reduction in radioactivity. As a reference, used fuel cooled for 20 years AIROX-
processed has about the same total dose for used fuel cooled for 93 years [192].

115
Variations in the literature exist for AIROX process conditions such as temperature,
pressure, and gas atmosphere and as a result a wide variety of fission product removal
percentages are reported. Generally, the process begins with removing used LWR UO2
fuel pins from the fuel assembly and mechanically puncturing them every 1-4 cm in order
to allow gaseous reactants access to the fuel. Then, the used fuel is exposed to an oxygen
rich atmosphere at about 400°C where the UO2 is converted to U3O8. A sample AIROX
flowsheet is provided (Figure 51).
Figure 51: Sample AIROX flowsheet [57]
Complete oxidation to U3O8 is not necessary to obtain sufficient volume expansion of
approximately 30%, which ruptures the clad and cracks the fuel. If oxidation is carried
out too rapidly, the U3O8 on the surface of the fragments inhibits further oxidation and
pulverization. One study showed that pulverization with complete decladding could be
116
accomplished in less than 1 hour when oxidation began at 480°C and then decreased to
425°C [59]. Care should be employed during oxidation, as U3O8 begins to sinter at
temperatures around 450°C [193]. Sintering would result in the fusing of U3O8 powder,
which is undesirable as it still needs to be blended with enriched U or Pu oxides before
being fabricated into new fuel.
While one oxidation stage has been proposed to achieve complete decladding,
oxidation and reduction cycles may be repeated multiple times to ensure complete
pulverization of the used fuel and release of volatile fission products. After treatment, the
fuel can be ball-milled to ensure pulverization to 2 mm particle size and complete fuel-
cladding separation. Volatile and semivolatile fission products can be removed by
flowing various gases over the used fuel at temperatures of 400-1800°C. After the
processing for fission product removal is complete, the U3O8 is put under a hydrogen-
rich (hydrogen in argon, hydrogen in nitrogen) atmosphere at approximately 600°C to
reduce it back to UO2. The reduced UO2 is then mixed with enriched U or Pu oxides,
resintered and refabricated into new fuel. Studies show that AIROX recycling of LWR
used fuel produces a new LWR fuel that is approximately 75% by volume used nuclear
fuel [193].
The size of the used fuel powder that is AIROX-processed affects the success of
volatile and semivolatile fission product removal, and therefore the results of the
preliminary oxidation and reduction steps on used fuel powder must be considered.
While different processing conditions have led to variations in pulverization
effectiveness, all of the resulting used fuel is less than 2 mm in particle size, with over
70% being smaller than 297 microns [58]. Very little product is less than 297 microns

117
and greater than 74 microns. This indicates that once pulverization begins, the used fuel
rapidly goes to powder <74 microns. In contrast, the amount of material less than 5
microns is negligible [58].
While a number of AIROX studies have been published, discrepancies exist in the
fission product removal data, such as removal fractions for Ag, Cd, Cs, In, Ir, Mo, Pd,
Rh, Ru, Se, Tc and Te (Figure 53 and Figure 54). A substantial portion of the neutron
absorbing fission products, especially lanthanides and Rh, in used fuel should be
removed. One study found that the volatile fission products removed during AIROX
processing decrease the parasitic neutron absorption by about 25% in the LWR scenario
[189]. However, the effect of AIROX processing in a fast reactor used fuel recycling
scheme is expected to be significantly higher. In one reference case for 20 year decayed
fuel, the large elemental negative reactivity contributors are rare earth fission products
including Gd, Sm, Nd and Eu, followed by the metallic inclusions of Mo, Ru, Rh, Tc and
Pd. As applied to fast reactors, the presence of fission products both increases the
parasitic neutron absorption but also results in the physical displacement of fertile
material, decreasing the breeding ratio [189]. Fertile material percentage is important as
it is converted to fissile material during reactor operation, and fast reactors rely on this to
provide longer burnup times and core life. The breeding ratio is the number of fissile
atoms created per fission event, thus when fertile material is converted to fissile material,
the breeding ratio would increase.
Overall, commonly agreed-upon (in the literature) AIROX removals include 100% of
Xe, Kr and I, 90% of Cs and Ru, 75% of Cd, Te and In, and 30% of the slowly saturating
lumped fission products [193]. Detailed studies on fission product removals suggest

118
that oxidative vaporization can remove Tc, Mo and some Ru. Due to lanthanides being
incorporated into a solid solution with UO2, any separation requires complete
pulverization of used fuel. Chlorination of a pulverized oxide at 1100-1200 °C has been
shown to vaporize substantial portions of Nd, Eu, Gd and Rh. A fraction of the U would
also likely vaporize, however no significant loss of Pu during dry processing and
refabrication has been found [189]. In another study employing used fuel with a burnup
of 50 MWd/kg HM, up to to 99% of 3H, 75% of I and 98% of the Kr and Xe were
expected to be released from a single oxidation cycle. This study also put forth that Cs,
Te, Ru, Tc, Cd and In were also removed to a significant extent during pellet sintering.
Overall, through the oxidation and reduction cycles, more than 99.9% of the UO2 was
removed from cladding. Other experiments of note include one in which Te was partially
removed, Ru could be volatilized by having one oxidation step above 725 °C and rare
earths remain with the U. In these studies, medium and low volatility fission products
such as Ba, Sr, Ce, La, Pd and Zr remained in the fuel along with the U, Pu and higher
actinides. The thermodynamic data relevant to volatility processing for some fission
products is lacking, however some reported boiling points for certain fission product
species are available (Table 16). The two boiling points for Tc are presented for Tc2O7
(311 °C) and TcO2 (1000 °C) species expected to be relevant in used nuclear fuel.

119
Table 16: Selected boiling points reported for fission products [192]
Element Boiling Point (°C) Ag 2200 Cd 770 Cs 670 In 2072 Ir 4428
Mo 4639 Pd 2963 Rh 3695 Ru 4150 Se 685 Tc 311, 1000
Kilogram-scale experimental studies were performed on unirradiated UO2, both with
and without simulated fission products and small scale hot experiments were conducted
on pellets with burnups up to 31,000 MWd/MTU [57]. Experimental results indicated
that simulated high burnup and multiple recycles did not significantly affect the
pulverization of the UO2 pellets and actually enhanced pellet sintering. Cold small scale
decladding experiments were conducted on sections of UO2 pellets clad in stainless steel
and zircaloy tubes, and larger sections of UO2 pellets in stainless steel cladding. Results
indicated that fuel rods punctured at 2.5 cm intervals and exposed to oxygen at 400 °C for
2 hours were completely declad. Repeating the cycle of oxidation and reduction provided
99.9% mechanical separation of fuel from cladding. Hot tests indicated that oxidation,
reduction and decladding rates for irradiated UO2 pellets are similar to unirradiated UO2
pellets, and that 3H, Kr and I were released during the oxidation and reduction cycles,
with large fractions of semivolatile fission products (95% of Cs and 50% of Ru) released
during pellet sintering. Smaller amounts of Te, Tc, Cd and In were also volatilized

120
during the sintering [193]. In another set of experiments, stable fission products
equivalent to 20,000 MWd/MTU burnup were added during five cycles to yield an
equivalent burnup of 100,000 MWd/MTU. In this case, about 58% of the volatile fission
products were removed when the fuel capsule was ruptured (punctured and oxidized),
with the remainder of the volatile fission products removed during AIROX [58]. As an
alternative to adding stable fission products to produce an equivalent burnup of used fuel,
SIMFUEL was produced for some time to simulate the composition and microstructure
of high burnup UO2 [193].
The lanthanides in new fuel physically displace fertile fuel, and they are also
especially important to remove in the fast spectrum due to their neutron absorption
properties. Several attempts at lanthanide removal from used fuel have been studied,
such as fluoride volatility, supercritical fluids, glass solubility, plasma-based separations,
magnetic separation, high temperature fluorination, and electrostatic separation. The
electrostatic separation technique is promising for the separation of Rh and other noble
metal poisons such as Mo, Tc, Ru and Pd, from the U oxide [192]. However, one study
in particular reported removal percentages of up to 69% for Sm, 68% for Nd and 89% for
Gd, demonstrating experimentally the promise of the dry processing practice [194].
After all fission product removal is complete, the AIROX-processed used fuel must
be mixed with virgin enriched fuel which can come from diluted weapons grade material
(either HEU previously destined for a reactor or weapons stockpiled material). In this
way, AIROX not only extends U reserves by better utilization of the original U ore, it can
also allow for the depletion of stockpiled weapons material and HEU globally [57]. The
dependence on weapons grade material is not sustainable, however disposition of this

121
material and the transition away from HEU-fueled reactors are currently priorites in U.S.
policy [20, 22].
6.2.2 OREOX and DUPIC
The Direct Use of PWR fuel In CANDU (DUPIC) process has been investigated.
CANDU reactors generally utilize natural U as a fuel, so LWR used fuel, though less
enriched than fresh LWR fuel, contains enough 235U to be effective as a CANDU fuel. In
general, the 235U content in used LWR fuel is less than the content of freshly enriched
fuel (3-5%), but greater than the content of natural U (0.72%) [195]. However, the used
LWR fuel does contain fission products which must be removed to some extent in order
for the fuel to be effective in the CANDU reactor. The existence of residual fission
products in fresh DUPIC fuel also means that due to the high radioactivity, all the
manufacturing processes must be performed remotely in a highly shielded facility. While
increasing cost, this enhances proliferation resistance simply due to the difficulties of
physical access and diversion of materials in a self-contained processing facility with all
special nuclear material (SNM) contained in hot cells or other highly shielded facilities.
In the LWR regime, the DUPIC process generates approximately 20% less HLW than
other wet reprocessing and 60% less HLW than direct disposal. It also uses two times
higher burnup fuel meaning overall reduction in waste production and better utilization of
energy resources [18].
For fission product removal, DUPIC adopts volatilization followed by three cycles of
Oxidation and REduction of OXide fuel (OREOX). Oxidation occurs at 450°C under an
air atmosphere and reduction under 4% H2 in Ar at 700°C [179]. As in AIROX, volatile
fission products are released along with some semivolatiles. The goal for OREOX in

122
DUPIC is for Cs, Ru, Mo and Tc removal in order to reduce operating cost and
radioactivity level. Removal of the long-lived 99Tc and 129I is beneficial because this
reduces the time that the used fuel must be actively monitored and protected in storage
[56].
The OREOX process has been tested with voloxidation performed for 5-10 hours at
500°C in air, followed by three oxidation and reduction cycles [196]. High burnup used
fuel rods were mechanically slit open, and then oxidized at 700°C for 5 hours in order to
completely retrieve spent fuel material. With this method, over 99.9% recovery was
achieved. Experimental testing has shown that the density of sintered pellets fabricated
with high burnup used fuel was lower than those fabricated with conventional burnup
used fuel. This indicates that fuel fabricated from higher burnup materials will have
different material properties than conventional fuel. Two burnups, 65,000 MWd/tU, and
27,300 MWd/tU, 15 years older, of used PWR fuel were studied. Sintering was
performed at 1800°C for 7 hours in 4% H2/Ar. It was found that these higher
temperatures were needed to remove fission products. In all tests, 85Kr started to be
released at 350°C during the first voloxidation, with its release behavior showing strong
dependence on temperature and not gas atmosphere. It was found that when processing
used fuel with higher burnups, a longer process time was required to completely release
85Kr [197]. The release behavior of 14C was found to be similar to that of 85Kr, with
release beginning at 300°C. Higher burnup used fuel required longer operation time for
complete removal of 14C.
In another study, release fractions during a voloxidation at 500°C showed over 99%
for 3H, 17-22% for 14C, 7-17% for 85K and <8% for 129I. The release of 137Cs during a

123
voloxidation at 500°C was not observed; however at 800°C, Cs release began with
estimated fraction of 16% after reaching 1000°C. Approximately 90% of Cs was
released after reaching 1250°C in air. The percent of UO2 successfully oxidized to U3O8
has been shown to directly affect the release percentages of 85Kr and 14C fission gases
during voloxidation at 500°C, but the effect may be less pronounced at higher
voloxidation temperatures. Additionally, for certain radionuclides, a higher burnup used
fuel showed higher voloxidation release fractions than lower burnup fuel [196].
Fission products were removed from 25 year old PWR oxide fuel through OREOX.
These experiments found that the extent of fission product removal increased with
increasing operating temperature and decreasing pressure. Rh, Ru, Tc, Mo, Te and Cs
were removed to some extent through the oxidation process, with less than expected
removal fractions attributed to partial vaporization, incomplete oxidation or the formation
of non-volatile complex oxides. Molybdenum volatility was found to be especially
dependent on the pressure of the system, with no removal under pressures greater than
0.789 atmospheres, however partial removal was observed below 0.001 atmospheres
[181].
In another OREOX experiment, 500 PSI O2 at 600°C was used to produce a
U3O8+PuO2 phase from which more than 99% of the 3H was released. About 98% of I
and Kr were volatilized from highly irradiated fuel specimens, but more typical releases
were around 45% Kr and 75% I. In an attempt to achieve complete removal of 3H, I, Xe
and Kr, tests were conducted in a hot cell with temperatures up to 850°C with He, air or
O2, on short and long-cooled fuel with burnups up to 100,000 MWd/t. The Pu
concentration of the used fuel and the type of fabrication were found to affect the amount

124
of fuel disintegration and release of noble gases. Other relevant factors were found to be
the homogeneity of U-Pu mixture, chemical form of the fuel, anion to metal ratio, method
of fuel preparation, physical fuel form, burnup, neutron energy, enrichment, temperature
of irradiation and degree of fuel restructuring [59]. Successful oxidation and
pulverization of a homogeneous U/PuO2 ceramic fuel was determined to be dependent on
Pu/M ratio, quality of the ceramic and physical size of sample. Sol-gel pellets and
microspheres were found to be the most difficult to pulverize. This is pertinent to the
EM2 fuel cycle because the proposed fuel fabrication process is based on a sol-gel
technique. Voloxidation was found to have no effect on Pu dissolution [59], meaning
that dry processing does not limit further fuel treatment options in the event that Pu
recovery is desired.
6.2.3 CARBOX/CARDIO
The EM2 design requires a carbide fuel, so the few dry processes investigated for
application to these fuels are especially relevant. The CARBOX process is essentially the
AIROX process applied to carbide fuels, with oxidation converting U carbide to the
oxide, then further oxidation to achieve UO2 to U3O8 conversion. After fission product
volatility, the U3O8 is reduced back to UO2 in the presence of carbon, and then converted
to the carbide [15].
The CARDIO process was also investigated as relating to carbide fuels (CARbon
DIOxide oxidation) under a CO2 atmosphere. A CARDIO processing experiment
examined removal fractions for Ag, Cs, Mo, Ru, Gd, Nd, Rh and Sm. Two runs at
1000°C and two runs at 1600°C were both held at temperature for 5 hours with 80 mg of
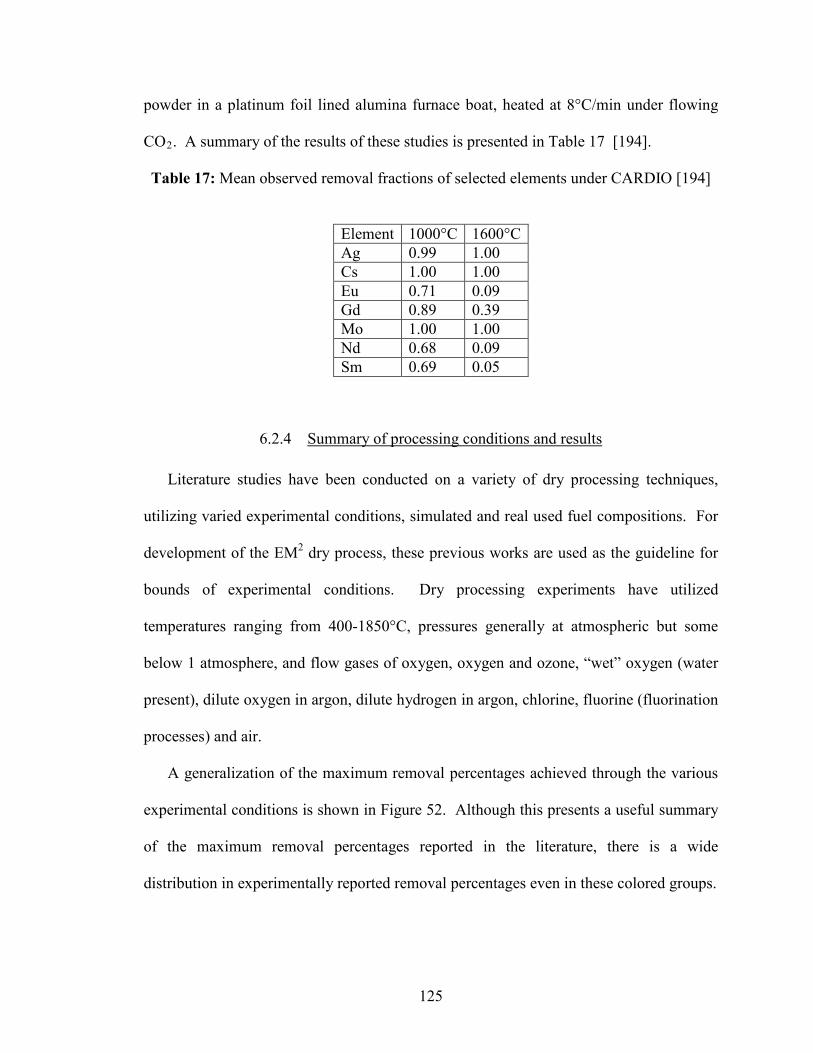
125
powder in a platinum foil lined alumina furnace boat, heated at 8°C/min under flowing
CO2. A summary of the results of these studies is presented in Table 17 [194].
Table 17: Mean observed removal fractions of selected elements under CARDIO [194]
Element 1000°C 1600°C Ag 0.99 1.00 Cs 1.00 1.00 Eu 0.71 0.09 Gd 0.89 0.39 Mo 1.00 1.00 Nd 0.68 0.09 Sm 0.69 0.05
6.2.4 Summary of processing conditions and results
Literature studies have been conducted on a variety of dry processing techniques,
utilizing varied experimental conditions, simulated and real used fuel compositions. For
development of the EM2 dry process, these previous works are used as the guideline for
bounds of experimental conditions. Dry processing experiments have utilized
temperatures ranging from 400-1850°C, pressures generally at atmospheric but some
below 1 atmosphere, and flow gases of oxygen, oxygen and ozone, “wet” oxygen (water
present), dilute oxygen in argon, dilute hydrogen in argon, chlorine, fluorine (fluorination
processes) and air.
A generalization of the maximum removal percentages achieved through the various
experimental conditions is shown in Figure 52. Although this presents a useful summary
of the maximum removal percentages reported in the literature, there is a wide
distribution in experimentally reported removal percentages even in these colored groups.

126
Figure 52: Summary of maximum removal percentages reported in the literature for dry
For example, a summary of the experimental data for the removal percentages of
elements with reported maximum values Figure 53. Similarly, a
summary of the experimental data for the removal percentages of elements with reported
maximum values between 65% and 75% is shown in Figure 54. As seen in these figures,
any dry process must be developed and tailored specifically to a fuel cycle because
depending on the reactor, desired fuel type and burnup, the desired composition of the
input fuel will vary. Thus, the dry process treatment of UNF must be adapted to provide
a fuel input for a reactor in order to provide the desired composition under any cost, input
material, waste output or fabrication constraints.

127
0
20
40
60
80
100
0 500 1000 1500 2000
AgBrCCsH3IIrKrMoRbRuSeTcTeXe
Rem
oval
%
Temp (C)
Figure 53: Literature reported removal percentages for elements with maximum reported
The reported removal percentages of Am, Ba, Ce, La, Np, Pr, Pu, Sr, and Y are all
between 0% and 5%. Due to the variety of experimental conditions studied, there is no
clear-cut temperature dependence of removal percentages for any element. In order to
elucidate a trend or pattern from this data, unsuccessful or inappropriate data points are
removed from the data sets. In this way, the removal percentages of Ag, C, Cs, 3H, I, In,
Kr, Mo, Rh, Ru, Tc and Te all demonstrate some form of positive dependence on
temperature – that is, as temperature increases, so does the removal percentage. In many
cases, there is not enough data to demonstrate a temperature dependence. Some elements

128
show no temperature dependence and some even show a correlation between increasing
fission product removal and decreasing temperature.
Figure 54: Summary of removal percentages for elements with maximum removal
percentages between 65% and 75%
6.3 Development of EM2 flowsheet
This task included the development of a dry processing flowsheet specific to the EM2
reactor design. Additionally, this flowsheet can be used to assess areas for safeguards
and process monitoring. The dry processing options presented in Section 6.2 can be
applied to the LWR and EM2 used nuclear fuels described in Section 6.1.1 order to

129
produce such used fuel treatment flowsheets. These flowsheets are generally developed
with the aim of achieving specific goals, such as those outlined in Section 6.1.1. In
addition to these, overall goals of a fuel cycle can include balancing removal percentages
with new LWR core needs and waste streams generated [60, 61, 198]. Also, the decay
times for LWR discharges need to be considered. A longer decay time results in total
activity reduction, but must be weighed with cost of on-site storage and new core needs.
Table 18: EM2 dry process flowsheet fission product removal goals
% Removal Element Proposed Wasteform Waste Classification 100 3H, 14C cement LLW 90 Te glass GTCC 75 Cd, lanthanides glass GTCC
With these considerations in mind, the sample process flowsheet (Figure 55) is
designed to achieve at a minimum the removal percentages shown in Table 18. During
these processes, likely other radionuclides will volatilize as well including 90% of the Tc,
100% of the I, 90% of the Cs and 100% of the Kr and Xe. Another possibility to
consider is to remove as little as possible Tc and I and keep in the fuel for transmutation
as these are the main environmentally mobile concerns in wasteforms, however under
certain processing conditions, volatilization will be inevitable.

130
Figure 55: Flowsheet for dry processing of used nuclear fuel for recycle into EM2
As shown in Figure 55, proposed dry processing of EM2 used fuel begins with a
conversion from the carbide to the oxide under an oxygen atmosphere in argon. After
this step, the dry treatment of EM2 used fuel is the same as material from other reactor
types. Three cycles of oxidation with O2 in Ar or air at 400°C and reduction with H2 in
Ar at 600°C are used to remove the fuel from the cladding. In these first oxidation and
reduction steps, it is expected that 100% of the 3H, I, Kr, and Xe will volatilize. Due to
the fairly low fission product content of LWR used fuel, additional FP removal yields are
not expected to be high. However, with the larger presence of fission products in EM2
used fuel, further dry processing will likely result in added fission product volatilization.
In either case, to produce the best product for new fuel fabrication, higher temperature
removal steps are proposed. Thus, the used fuel will be exposed to CO2 at approximately
1000°C to yield 75% removal of Eu, Gd, Nd, Sm, and perhaps other lanthanides. This
CO2 step can be cycled multiple times in an effort to achieve greater removal

131
percentages. High temperature fuel sintering would volatilize additional fission products,
so an 1800°C processing step before sintering should remove approximately 90% of the
Cs, Tc and Te, 75% of the Cd and <50% of the In and minimize fission product
volatilization during fuel fabrication.
6.4 Characterization of waste and recycled streams
The products and wastes from dry processing must be identified and assessed for
materials accountability and to identify potential safeguards approaches. A summary of
the expected elemental composition of the volatilized fission products and recycled heavy
metals and non-volatilized fission products from the LWR recycle process is shown
(Figure 56).
Figure 56: Normalized elemental composition of recycled and waste streams from dry processing of LWR discharge

132
The ORIGEN computer code has been used to provide isotopics, related activities,
masses and thermal power for EM2 fuel (assuming 140 GWd/t burnup over 30 years) at
discharge, and after 5 and 10 years of decay time (Table 19). As values for over 1000
isotopes are produced, a summary of the elements present in highest mass percentage in
EM2 discharge fuel is shown in Table 20 [180].
Table 19: Selected summary of EM2 used fuel at Discharge, 5 and 10 years
Activity(Ci) Mass (g) Thermal Power (W) Isotope Disch. 5 yr 10 yr Disch. 5 yr 10 yr Disch. 5 yr 10 yr
14C 5.0E-04 5.0E-04 5.0E-04 1.1E-04 1.1E-04 1.1E-04 1.5E-07 1.5E-07 1.5E-07 242Cm 3.7E+03 4.6E+00 2.9E+00 1.1E+00 1.4E-03 8.8E-04 1.4E+02 1.7E-01 1.1E-01 137Cs 4.3E+05 3.8E+05 3.4E+05 4.9E+03 4.4E+03 3.9E+03 4.8E+03 4.2E+02 3.8E+02
3H 3.3E+03 2.5E+03 1.9E+03 3.4E-01 2.6E-01 2.0E-01 1.1E-01 8.5E-02 6.4E-02 129I 1.5E-01 1.6E-01 1.6E-01 8.7E+02 8.8E+02 8.8E+02 7.1E-05 7.2E-5 7.2E-05
94Nb 6.8E-04 6.8E-04 6.8E-04 3.6E-03 3.6E-03 3.6E-03 6.9E-06 6.9E-06 6.9E-06 241Pu 6.6E+04 5.2E+04 4.1E+04 6.4E+02 5.0E+02 4.0E+02 2.1E+00 1.6E+00 1.3E+00 90Sr 3.1E+05 2.7E+05 2.4E+05 2.3E+03 2.0E+03 1.8E+03 3.6E+02 3.2E+02 2.8E+02 99Tc 5.7+01 5.7E+01 5.7E+01 3.3E+03 3.4E+03 3.4E+03 2.8E-02 2.9E-02 2.9E-02
Table 20: Summary of selected elements present in EM2 discharge fuel
Element Mass (g/MT) Element Mass
(g/MT) U 7.74E+05 Pr 4.52E+03 Pu 7.82E+04 Pd 4.31E+03 Xe 1.82E+04 Sr 3.97E+03 Cs 1.56E+04 Np 3.55E+03 Zr 1.49E+04 Sm 3.40E+03 Zr 1.49E+04 Tc 3.34E+03 Nd 1.48E+04 Te 2.36E+03 Mo 1.31E+04 Rh 2.27E+03 Ce 1.18E+04 Y 2.02E+03 Ru 1.07E+04 Kr 1.65E+03 Ba 5.83E+03 Rb 1.46E+03 La 5.13E+03 I 1.24E+03

133
For the waste stream, the isotopics of the fission products must be examined to
determine half life, heat produced and radiotoxicity, as all relate to the choice of waste
form and ultimate disposal options. Short lived fission products such as 137Cs and 90Sr,
both with approximate half lives of 30 years, are expected to decay quickly enough that
they are the significant contributors to heat loading in a wasteform but can be stored
separately for a relatively short time (~300 years) and do not need long term geologic
burial [199]. Long lived fission products (Table 21) however, do need a long term
management plan. As some of these isotopes are not present in any significant quantity
and may be ignored at present, those listed in Table 21 are noteworthy contributors. In
addition to long lived fission products in the waste stream, any tramp or carry-over of
heavy metals will affect the classification and therefore disposition of process wastes. In
Table 21, while some elements listed are naturally occurring and/or stable, if they are
present with a radioactive isotope of the same element, they will be included in the waste
stream (as separations are non-isotopic) and thus contribute the waste and recycled
products.

134
Table 21: Isotopes expected in LWR dry processing waste and recycled streams in quantities greater than g/MTHM with half lives greater than 100,000 years
6.5 Proliferation resistance in dry processing
While reduction in UNF inventories and production is a mainstay of a future nuclear
fuel cycle, proliferation resistance is of utmost importance, as no system will be adopted
unless proven to meet rigorous U.S. nonproliferation objectives [19]. Additionally,
reduction of proliferation risk relative to wet reprocessing has been stated as a DOE
nuclear fuel cycle goal [20]. The internationally accepted definition of proliferation
resistance describes “that characteristic of a nuclear energy system that impedes the
diversion or undeclared production of nuclear material or misuse of technology by States
in order to acquire nuclear weapons or other nuclear explosive devices [68].” Essentially,
Recycled Stream Isotope Half-life (yr)
142Ce 5.00E+16 50Cr 1.80E+17
135Cs 2.30E+06 144Nd 2.29E+15 150Nd 1.10E+19 237Np 2.14E+06 107Pd 6.50E+06 242Pu 3.73E+05 147Sm 1.06E+11 148Sm 7.00E+15 149Sm 2.00E+15 126Sn 1.00E+05 99Tc 2.11E+05 128Te 2.20E+24 130Te 7.90E+20 234U 2.46E+05 183W 1.10E+17 184W 3.00E+17 93Zr 1.53E+06 96Zr 3.80E+19
Waste Stream Isotope Half-life (yr)
142Ce 5.00E+16 129I 1.57E+07
115In 4.41E+14 100Mo 1.00E+19 144Nd 2.29E+15 150Nd 1.10E+19 87Rb 4.75E+10 79Se 1.13E+06 82Se 1.08E+20
147Sm 1.06E+11 148Sm 7.00E+15 149Sm 2.00E+15 99Tc 2.11E+05 128Te 2.20E+24 130Te 7.90E+20 136Xe 2.36E+21

135
proliferation resistance is describing the extent to which the characteristics and
safeguards of a nuclear energy system impede proliferation, with the understanding that a
proliferation-proof system does not exist. The dry processing system described in this
chapter must be examined with proliferation resistance criteria in mind and potential
safeguards developed.
A basic premise of SNM safeguards is that all nuclear materials, regardless of how
attractive, are candidates for diversion, therefore all require steps toward avoiding
proliferation. Dry processing increases proliferation resistance by allowing the fuel
material to retain a full component of fission products. The material remains highly
radioactive requiring fully remote handling. Further, dry processing with enrichment
permits utilization of residual Pu in fuel without complete separation [189].
Safeguarding dry fuel cycles is inherently simpler than wet fuel cycles mainly because
when material is moved it is a discrete mass. Even waste and scrap are handled as
discrete, tracked and weighed items [55]. Therefore, throughout the dry process,
inspection and accountancy are straightforward. There is also a scale difference between
the dry and wet recycle technologies. Dry recycle processes utilize relatively small scale
process equipment, meaning transportation of the material is reduced to a minimum and
physical security is enhanced [58, 68, 189, 200-202].
In general, dry processing for used nuclear fuel recycling is considered to be
inherently more proliferation resistant than wet processing due to several factors. Dry
processing requires discrete, batch treatments of used fuel, allowing for direct materials
accountancy and prohibiting some of the flowsheet modifications possible in a wet
recycling scheme [58]. Also, dry processing does not allow for U/Pu separations

136
chemistry, and all streams originating from a dry process will have fission product
contamination. This means there is some level of self-protection due to radioactivity.
The fission product contamination in the product stream of a dry process makes the
material less desirable for diversion and easier to detect. While all of these
characteristics make a dry process more proliferation resistant, the introduction of process
monitoring to a dry process scheme should be considered as a safeguard and path to
increase proliferation resistance. Just as UV-Visible spectroscopy can be applied as an
online process monitor in a wet reprocessing scheme, Raman spectroscopy provides the
same potential for dry processing of used nuclear fuel [83, 203, 204].
Dry processing reduces the attractiveness of used fuel as a weapons feedstock due to
the inclusion of transuranics and fission products [68]. Qualitatively, nonproliferation
assessment methodology depends on attractiveness of nuclear material, proliferation
technical difficulty, proliferation time and cost along with detection probabilities.
Quantitatively, values for neutron emission, heat generation, gamma emission and bare
sphere critical mass can be used to assess proliferation risks, with higher values
complicating weapons physics and making detection of proliferation attempts easier
[205]. To improve physical security, the transuranics should be kept together as much as
practical due to their higher heat, gamma and neutron emission rates, and the inclusion of
U with the recycled transuranics increases the bare sphere critical mass [62]. In all dry
processing scenarios the actinides are kept together, further enhancing proliferation
resistance of the fuel cycle.
In the AIROX/OREOX scheme, approximately 40-60% of the fission product
radioactivity escapes as volatile materials [201]. The remaining fission products and

137
minor actinides in used fuel provide substantial decay heat and self-protect with alpha,
beta, gamma and neutron emitters (self protection criterion of 1 W of gamma power or 1
Sv/h at 1 meter) [206, 207]. In addition to meeting the self-protection requirement, the
material itself is more easily detected than various HEU and 239Pu sources due to the
presence of multiple sources of radiation. In the event of a diversion of fast reactor used
fuel, any PUREX type processing plant would need to be physically modified to meet
more stringent criticality limits and provide for greater heat removal in order to perform
separations on the material [55].
In a comparison study with MOX, PWR once through, and PWR/MOX combination
used fuel, the DUPIC/dry processed fuel was considered to be the most proliferation
resistant [57, 58]. Among these used fuels, MOX contains the largest Pu per MTHM,
with DUPIC containing the lowest fissile Pu content. Dry processed fuel with a high Pu
content has the highest dose rate of the used fuels under consideration here. This means
that shielding would be necessary during all phases of diversion of this material [200].
Another study quantitatively examined proposed protracted and abrupt proliferation
scenarios for dry processing. Material is diverted over several months in the protracted
case and days or weeks in the abrupt case [64]. Again, for any diverted used fuel powder
from dry processing, further reprocessing facilities would be necessary to recover pure
Pu. Using IAEA units and criterion to look at a protracted diversion scenario: to obtain 8
kg of Pu in 3 months, 2-3 PWR assemblies or 50 CANDU bundles would be necessary.
On top of requiring a PUREX facility to process the diverted materials, sophisticated
remote operation would be necessary to divert powder from the hot cells. Additionally,
the high temperature furnaces and controlled atmospheres would be disrupted and the

138
accountancy systems would be disturbed, all increasing the probability of detection. The
diverter could not extract the Pu from the powder while still in the hot cell as the aqueous
reagents required would be incompatible with AIROX/OREOX cell designs. This would
certainly disrupt temperatures, controlled atmospheres and accountancy systems. In
addition, during a protracted diversion attempt, the transport of small amounts of used
fuel material over a long period of time would be fairly easy to detect due to the high
radiation field. An abrupt diversion scenario would mean diversion of 8 kg of Pu in
approximately 1 MT of material in the process line. This is a considerable mass and
volume of material and its loss would be readily detectable by mass balances, pressure
changes, off-gas systems, or other methods [201].
6.5.1 Raman spectroscopy for dry process monitoring
An evaluation of the elemental makeup of the waste and recycling streams from dry
processing is used to identify potential targets for process monitoring. Due to their
relatively high concentration in used nuclear fuel, elements considered as candidates for
process monitoring through online Raman spectroscopic measurements are shown in
Table 22.
Table 22: Selected elements in used nuclear fuel and relative concentrations
>1000 g/MT UNF >100g/MT UNG but <1000 g/MT UNF Xe, Cs, Nd, Mo, Ru, Tc Te, Pd, Rh, Rb, Sm, I, Kr, Gd, Eu, C, Ag, Ba, Cd, Ce, La
Raman spectroscopy has been used for process monitoring in fields such as
pharmaceuticals, agrochemistry and quality control [81, 82, 208, 209]. Also, in the
quality control of commercial pesticide formulations, vibrational spectroscopy has been

139
used for the quantitative analysis of certain formula components. These techniques are
used because of the short analysis time, non-destructive nature, accuracy and opportunity
for direct analysis of solid and aqueous samples, similar to UV-Visible spectroscopy.
Therefore, it follows that Raman spectroscopy is also quite relevant to these process
monitoring and safeguards in reprocessing studies and can be applied to a dry process or
even a wet reprocessing scheme. The investigation of Raman spectroscopy as a process
monitor is meant to augment the proposed UV-Visible spectroscopy safeguards work.
Fiber optic samples probes, compact designs, high efficiency detectors and fast
electronics all allow for Raman spectroscopy to be used for real-time, multi-component
chemical analysis, as in this proposed application of process monitoring. Raman requires
no sample preparation, can be used noninvasively to test materials in containers, requires
minimally trained personnel and as water is a weak Raman scatterer, aqueous solutions
can be analyzed along with the gaseous and solid phases [83, 128, 203, 204]. Raman
spectroscopy of aqueous solutions has been reported in conditions greater than 180 °C
[209], which is relevant to the application to used fuel processing as the waste and
product streams coming out of a dry process will inherently be above room temperature
(400-1800 °C). Raman experimental spectra have also been shown, in ideal situations, to
have excellent agreement with theoretical calculations, indicating a possible avenue for
continued research and development of this subject [209]. Near Infrared (NIR) was used
in a process monitoring application to probe an In-Sn-oxide etching solution, and in this
case the spectroscopic monitoring was actually achieved directly through existing Teflon
lines [84]. Naturally, the nuclear industry would prefer not having monitoring or
safeguards equipment interfere directly with process flow [210], so any spectroscopy that

140
can be achieved without perturbing the system under consideration will be favored. Even
if a slipstream is necessary, the ability to spectroscopically probe a system without
removing samples from the gaseous or liquid solution, and therefore without opening up
a potential avenue for diversion, is highly valuable.
As for monitoring of the actinide-rich recycled stream from a dry process, U
chemistry has been researched extensively due to its mining industry and nuclear fuel
reprocessing. In mining, a variety of uranyl minerals have been studied with Raman,
NIR and IR spectroscopy [211]. Uranyl’s IR spectra are found to be complex. However,
coupling multiple spectroscopic methods allows for elucidation of spectral results [212].
A variety of uranyl nitrate complexes in solid and solution phases have been studied with
IR and Raman spectroscopy. The degree of dentateness, IR and Raman vibrational
frequencies in both solid and in CCl4 and CH3OH have are reported for the uranyl nitrate
tributyl phosphine oxide complex (UO2(NO2)·2TBPO, Table 23) [213]. Specifically, the
bands associated with the vibrations of the nitrate groups are isolated in IR spectra, and
the resulting structure of the coordination sphere of uranyl is extrapolated. Similar to
TBP, TBPO can be used as a ligand for transition metal separations.

141
Table 23: Vibrational frequencies (cm-1) of UO2(NO2)·2TBPO [213]
Solid Solution in CCl4 Solution in CH3OH IR Raman IR IR 2930, 2920, 2885
1530, 1505 1527, 1507 1525
1398, 1355, 1300 1452, 1314 1480, 1465, 1402, 1380, 1345
1465, 1400, 1380, 1345, 1305
1290, 1275 1280 1270 1230, 1220, 1098 1108 1225, 1110 1225, 1120
1020, 1070 1096, 1076 1100 1070 1052 1056 1050 1050 1030 1032 1030 1025 965 965 965
923, 918 930 930, 925 903 900, 905 903 905
866, 842 845 825 823
808, 810 810 745, 740 752 745
720 725 470, 450, 440, 420 480,465
380, 375 390 395 259, 250
200 202
Previous to this work, Raman spectra for UO2(NO3)2-6H2O and UO2(ClO4)2-7H2O
solids and aqueous salt solutions were reported over a wide range of solution
composition. The lack of ion-pair formation was noted in uranyl perchlorate as was the
weak complex of uranyl nitrate [49, 92, 105, 214]; for reference, molecules of
[UO2(NO3)3]- and [UO2Cl4]2- are shown in Figure 57 and Figure 58. Raman
depolarization experiments indicated monodentate and bidentate linkage of nitrate to
uranyl [214]. Electron redistribution in the uranyl nitrate complexes resulting in large
changes in the molar scattering efficiencies of the nitrate modes, which, combined with
the spectral information on dentateness, indicates the potential of this type of

142
spectroscopy for online process monitoring of dry and wet used fuel reprocessing
streams.
Figure 57: [UO2(NO3)3]- molecule [14]
Figure 58: [UO2Cl4]2- molecule [14]
O
O
U
Cl
Cl
Cl
Cl

143
Together, Raman and NIR spectroscopies can be complementary process analytical
technology tools and previous work on uranyl nitrate in aqueous and organic media have
been reported [83, 203, 211]. These fast, noninvasive, nondestructive techniques were
used to provide online monitoring of a freeze-drying process. Both Raman and NIR
measurements were taken in a freeze dryer chamber, with the resulting spectra analyzed
with both principal component analysis and multivariate curve resolution. The
importance of the positions of the probes was demonstrated, as certain positioning of the
NIR probe resulted in saturated Raman spectra, and the complementary nature of the
techniques allowed for mutual confirmation of online monitoring results [83].
Raman spectroscopy has also been used in analysis of gaseous phases including
relevant lanthanides and fission products [128, 130, 204, 215-220]. Raman spectra of the
trivalent lanthanide sesquioxalates were reported. From the results, information on
metal-ligand coordination, lanthanide contraction and changes in the coordination of
water molecules was obtained [204]. Again, this approach is directly relevant and
parallels the suggested method of utilizing Raman, NIR and IR spectroscopies as
complements to existing UV-Visible spectroscopy work and as online process monitors.
The goal is to produce a reprocessing flowsheet with techniques and spectroscopically
active species identified throughout for online monitoring, safeguards and process
control. Methods of principal component analysis and multivariate curve resolution must
then be used to analyze the spectroscopic data and provide meaningful, real-time
information relevant to process streams. Using polarized Raman data and the
depolarization ratio (DPR) appears promising as a way to extract more molecular

144
information. The DPR is the intensity ratio between the perpendicular component and
the parallel component of the Raman scattered light, and thus is sensitive to molecular
properties and insensitive to sample and experimental variations. For dispersive
vibrational modes, a wavenumber-dependant change of the DPR may result from a small
energy shift of an allowed electronic transition [208]. These analysis approaches must be
investigated further in order to propose a more detailed plan for using Raman, NIR and
IR data to obtain useful molecular information from used fuel reprocessing.
6.6 Classification of dry processed waste products
In order to provide a comprehensive analysis of the proposed EM2 flowsheet for
treatment of used fuel, the classification for the waste stream from recycling must be
investigated. As the exact flowsheet has not been experimentally tested, possible
variations in waste stream composition and resulting benefits and/or drawbacks in waste
classification are also discussed.
The regulatory framework for classification of waste is largely governed by the
Nuclear Waste Policy Act, however other regulations such as the Atomic Energy Act, the
Uranium Mill Tailings Radiation Control Act, the Code of Federal Regulations
(10CFR40.4, 10CFR61.55, 10CFR61.56), the Low Level Waste Policy Act, the Resource
Conservation and Recovery Act, the EPA and the NRC all play parts in nuclear waste
classification and management [221]. The Nuclear Waste Policy Act of 1982 states that
highly radioactive material resulting from reprocessing of spent nuclear fuel is high level
waste and as such must be stored in a repository. If not classified as high level waste,
nuclear waste is classified according to 10 CFR 61.55 text and tables, which demonstrate
the complexity and comprehensiveness of waste classification guidelines [222].

145
U recovery from UNF can reduce the mass of waste and possibly the number of waste
packages that require geologic disposal. Recycle of all TRU reduces long term
environmental burden, reduces heat load to repositories, extracts more energy from the
original U ore and has significant proliferation resistance and physical security
advantages. Recovery of the short lived (half lives approximately 30 years) fission
products 137Cs and 90Sr can allow them to be managed separately due to their high decay
heat and activity, likely decaying to LLW in facilities tailored to that need, rather than
geologic disposal. Recovery of the dominant and long-lived 99Tc and 129I can allow them
to be sent to a geologic disposal in improved waste forms (i.e. borosilicate glass).
Transmutation of Tc and I is also an alternative. For LWR UNF, recycling the actinides
can reduce the mass of waste by a factor of 20, with HLW volume reduced by keeping
long lived contaminants such as Tc and I out of short lived wastes. Pu and Am comprise
about 90% of the long-term heat commitment in a repository, and removing them along
with the TRUs, Cs and Sr would reduce the commitment by a factor of 100 [62].
In 1987, the NWPA was amended, selecting Yucca Mountain as the geologic
repository site. While specific limits for Yucca Mountain are discussed here, any
proposed repository design will include statutory capacity limits, dose limits and space
capacity limits. Yucca’s statutory capacity is 70,000 MTHM, and the technical space
capacity limits are undetermined as they are based on mass of the waste, volume of waste
packaging, tunnel wall temperature and temperature in the rock between tunnels.
Temperatures for the technical space capacity should be considered from decades to
centuries [62]. Yucca’s proposed dose limits are 15 mrem/yr from when waste is
emplaced to 10,000 years, and 350 mrem/yr from 10,000 years to 1,000,000 years.

146
Radiotoxicity and mobility factor in to calculating potential contribution to dose limits,
with 99Tc and 129I being the main examples of more mobile but less radiotoxic component
of used nuclear fuel.
While these guidelines are extremely intricate and dependent on waste isotopic
composition and radioactivity, wasteform, wasteform loading and mixing of
radionuclides, several studies have attempted to determine the classification of AIROX-
produced wastes. Included in the extensive laboratory testing of AIROX as applied to the
LWR fuel cycle in the early 1960s, a fuel cycle picture, complete with hypothetical
AIROX processing plant and resulting waste streams, was developed. In this scheme,
used LWR hardware and cladding would be Greater Than Class C (GTCC) waste due to
59Ni, 61Ni and 94Nb and would be crushed/melted into ingots for disposal. Isotopes such
as 129I would be trapped and stored for transmutation. Recovered noble fission product
gases would be trapped in a similar fashion to that of I, then be cryogenically distilled,
bottled and stored, prior to LLW disposal. 3H and 14C would also be trapped in a manner
similar to that of I, then combined and immobilized in cement or grout wasteform as
LLW. Any remaining mixture of I2, Xe, or Kr would be passed over a heated bed of
silver-impregnated zeolite to chemisorb silver iodide/iodate. The remaining Xe and Kr
would then be passed through a cryogenic distillation unit to condense from the Ar carrier
gas. Semivolatiles would be recovered by high temperature metal filters and high
temperature HEPA filters, then immobilized together in a borosilicate glass waste form as
GTCC waste with all of the used UO2 recycled and reconstituted in process.
Assumptions include 100% volatilization of 3H, Kr, Xe, I and C, 90% removal of
semivolatiles 134Cs, 137Cs and 106Ru, and 75% removal of Te, Cd, and In (volatilized

147
during pellet sintering). This study also modeled an AIROX plant with capacity of 200
MTIHM/yr with 0.9 MTIHM/day processing, where the production rate of new PWR and
BWR assemblies would be 1.5 and 1.8 assemblies/day, respectively. The resulting
wastes, per MTHM used fuel and at the end of one year of operation, are summarized in
Table 24.
Table 24: Resulting wastes from AIROX plant [57]
Quantity/MTHM UNF Composition Waste type Form After 1 year
0.29 MT Cladding and hardware GTCC Ingot 145 MT
0.103 MT Semivolatiles GTCC Glass 30.5 canisters
41 moles K and Xe Cylinder storage Gaseous 330
cylinders 0.19 m3 14C LLW Concrete 5000 drums 1.89 m3 Rags, ash, etc. LLW Trash 221 g I LLW Zeolite 0.6 m3
For all of the flowing systems, the use of low off-gas flow rates and Ar as carrier
would be highly advantageous for designing off-gas cleanup system. Approximately 1
drum of LLW per MTHM would be generated from process off-gases [57]. Overall,
while AIROX-processed fuel would have approximately twice the decay heat of
conventional fuel, there would be one half of the number of AIROX-recycled used fuel
assemblies and several orders of magnitude less HLW waste.
For disposal paths, any radioactive waste that does not qualify as LLW would go to a
federal repository, and extra care should be taken to minimize this waste stream (GTCC
and HLW). Investigations into recycling of cladding and hardware could yield a
reduction in HLW and higher heat loadings for GTCC glass wasteforms would be

148
possible if Cs was allowed to decay (must compare cost of storage and decay time vs.
direct disposal of GTCC). 129I could be disposed of as LLW or as GTCC, but due to
water transport mechanisms, 99Tc and 129I are estimated to account for more than 99.99%
of hypothetical population dose from repository [57].
6.7 Conclusions
A flowsheet to recycle used LWR and used EM2 fuel via dry processing was
developed based on previous literature (Figure 55). It is expected that the volatile fission
products are released during processing, and some of the semivolatile fission products are
released during higher-temperature pellet sintering [57]. Medium and low-volatility
fission products generally remain in the fuel along with the actinides (Section 6.2). The
waste stream from the flowsheet was characterized in order to provide a comprehensive
analysis of the EM2 fuel cycle.
Benefits of the dry processing scenario proposed in this chapter include waste volume
minimization, avoiding the production of high level liquid waste streams, reduced U
demand allowing extension of U reserves and increasing the proliferation resistance and
nuclear security of the U.S. nuclear fuel cycle [58]. Proliferation resistance is increased
due to the discrete nature of a dry process, lack of chemical separation of Pu, utilization
of a hot cell for all processing and the accelerated buildup of 238Pu. Although the need
for a repository does not disappear with dry processing, the waste radiotoxicity is
reduced, diminishing potential environmental release and public exposure [57]. In the
event that further separations beyond dry processing are desired in the future, reducing
the amount of fuel requiring chemical separation could lead to simplified aqueous or
pyrochemical reprocessing approaches that could be integrated directly into the dry

149
processing fuel cycle [189]. Additionally, one study has found that in fuel cost analysis,
dry processing with zone separation based on fuel location in the core (and thus burnup)
reduces fuel cost as compared with the once through cycle [202]. The dry processing fuel
cycle is an advanced concept to meet ever-increasing energy demands while addressing
nonproliferation concerns and reducing waste management burdens [223].
All of these benefits are accomplished in a highly proliferation-resistant manner as
the dry processes do not allow U/Pu or isotopic separations and yield self-protecting
product and waste streams. Additionally, the process design that cannot be easily
manipulated to allow SNM separations, so a clandestine reprocessing plant would be
necessary following a diversion in order to extract pure U or Pu. The addition of Raman
spectroscopy as a process monitor of both the waste and recycled streams of a dry
process further the robust safeguards in this system. As Raman spectroscopy has already
been used as a process monitor in other industries, has been applied to fission product,
actinide and lanthanide elements and is a commonly used laboratory technique, its
application in this scenario is straightforward. Depending on experimental results, the
EM2-based dry processing fuel cycle may offer a reduction of used fuel generated per
kWe as compared with the current open fuel cycle and is may be more proliferation
resistant than closed fuel cycles utilizing wet reprocessing technologies.
6.8 Future work
Experimental testing of the discussed processes needs to be performed. While much
research has been conducted on dry processing technologies, disagreements are in the
literature. Laboratory experiments are needed to resolve this issue. To begin, this should
consist of preparing simulated used fuel and analysis of the volatility of its components

150
[224]. Following successful demonstration of concepts at the laboratory scale, larger
scale experiments with simulated used fuel and then actual used fuel can be
demonstrated. Similarly, the development of the Raman spectroscopic process monitor
can follow the laboratory-to-bench-scale path forward.
In addition to evaluating experimental parameters such as temperature, carrier gas,
time at temperature, and temperature ramp rate, several other areas should be
investigated. The actual composition of individual LWR used fuel bundles will be
dependent on reactor type, burnup, cooling time and any unique storage or pretreatment
steps. The transition from the oxide-based to carbide-based dry processing regime should
be explored. Carbide fuels react rapidly with oxygen and moisture. The Gibbs free
energy for the possible reactions at room temperature is negative, as expected, since often
UC samples must be handled and stored under moisture-free inert atmosphere [225].
Therefore, while the application of oxide-based separations processes to the EM2 carbide
fuels must be proven, no technical issues are expected.
In the same vein, all previous dry processing studies have utilized the fuel pellet and
rod design common to LWRs, not the EM2-specific fuel design. The application of dry
processing to EM2 UNF must be proven. However, as long as a large fuel surface area
can be obtained for interaction with the various oxidizing and reducing conditions, no
concerns should arise. An approximate goal for the recycle of EM2 UNF is the removal
of 60% reactivity. Reactivity is a parameter that characterizes a reactor’s deviation from
criticality and is a function of UNF isotopic composition and related interaction cross
sections. Determination of several possible conditions yielding 60% reactivity removal
(i.e. sample percentages of isotopes present) will allow for consideration of multiple

151
options of dry processing and may result in higher waste reduction abilities and/or more
favorable economics.
One issue that is mentioned sparsely in the literature is the effect that fissile/fertile
distribution in the used fuel has on the temperatures at which volatilization occurs. In the
LWR thermal neutron flux, the outer portion of the fuel pellet shields the central portion
of the pellet, resulting in a substantially higher Pu content in the outer restructured zone.
In the fast neutron regime, the flux is essentially constant across the pellet which results
in a much higher temperature near the pellet center. In stoichiometric fuel, Pu has been
shown to migrate up the thermal gradient, yielding a much higher concentration in the
center of used fast fuel. In addition to this Pu inhomogeneity, restructuring of the fuel
occurs in the high temperature region, leaving relatively unstructured fuel in the lower
temperature region. In dry processing, restructured fuel pulverizes into larger particles
than the unrestructured fuel, and combined with the Pu migration with this restructuring
phenomenon, the larger particle fraction will have much higher fissile content [202].
Successive dry processing should continue to increase the fissile content of recycled fuel,
but the effect of the restructuring and Pu migration on dry processing removal fractions
should be explored further. Lastly, a cost analysis should be conducted to compare HLW
reduction and resulting decrease in repository space requirements with the hotter used
fuel that will eventually be produced in the higher burnup, dry recycle case [57, 226]. In
general, keeping waste classified as LLW is desired as it is less costly to dispose of than
HLW or mixed waste. Likely development beyond laboratory scale is necessary to
develop an accurate cost-benefit scheme.

152
CHAPTER 7
CONCLUSIONS
Demonstrated concepts for spectroscopic process monitoring for safeguards in used
nuclear fuel recycling scenarios are presented in this dissertation. Relevant background
information such as the composition of discharged fuel, used nuclear fuel treatment
methods and previous research on process monitoring for safeguards is reviewed.
UREX, TRUEX and dry processing used fuel treatment methods are evaluated
specifically, and opportunities for process monitoring by applications of spectroscopic
techniques identified.
7.1 Process Monitoring Under UREX Conditions
In order to detect a process change from the UREX to PUREX flowsheet, differences
in their chemistry are presented, along with corresponding UV-Visible spectroscopy for
application in process monitoring for safeguards. UREX uses the same basic solvent
extraction flowsheet as PUREX, but has a lower acid concentration throughout and adds
AHA as a complexant/reductant to the feed solution to prevent the extraction of Pu [39].
By evaluating the impact of process conditions, such as acid concentration, metal
concentration and flow rate, on the sensitivity of the UV-Visible detection system, the
process-monitoring concept is developed from an advanced application of fundamental
spectroscopy. Systematic benchtop-scale studies investigated the system relevant to
UREX or PUREX type reprocessing schemes, encompassing 0.01-1.26 M U and 0.01-8
M HNO3. Based on this foundation, a laboratory-scale UREX experiment was
performed. A fiber optic dip probe for UV-Visible spectroscopy was integrated into a

153
bank of three counter-current centrifugal contactors to demonstrate the online process
monitoring concept. Nd, Fe and Zr were added to the uranyl nitrate system to explore
spectroscopic interferences and identify additional species as candidates for online
monitoring. Changes in metal concentration and solution chemistry were successfully
detected in a counter current contactor system with a UV-Visible spectroscopic process
monitor. This milestone is a demonstration of the potential of the developed
spectroscopic technique which lies in the ability to simultaneously and directly monitor
the chemical process conditions in a reprocessing plant, providing inspectors with another
tool to detect nuclear material diversion attempts.
Future work in the UREX regime includes addition of more fission products,
actinides and lanthanides, followed by a scale up to actual expected metal concentrations.
UV-Visible spectroscopic investigations can be expanded to the organic phase, and
perhaps online process monitors inserted between contactors for materials tracking
through the contactor bank. It should be noted that many UNF solvent extraction
flowsheets in the U.S. and abroad are similar to UREX, therefore much of the work
discussed here could be extrapolated and applied to other TBP-nitric acid extraction
systems [40, 41]. A solvent extraction code such as AMUSE can be used to provide a
model for further flowsheet demonstrations, and thus give a guideline for expected
aqueous product compositions and extraction efficiencies. The presence of foam in the
countercurrent contactor system is an issue that needs to be resolved as all solvent
extraction studies are based upon liquid-liquid interactions, however this likely requires
an engineering and design modification from the contactor vendor. Collaborations with
other CINC V-02 contactor users could help elucidate specific design changes to alleviate

154
foam production.
7.2 TRUEX Experiments
An evaluation of the performance of the TRUEX process in a 30 stage centrifugal
contactor pilot plant has been completed. The overall equipment operation, actual
flowsheet performance including steady-state data, removal efficiencies, individual stage
mass transfer efficiency, as well as temperature profiles were measured and reported.
Overall the flowsheet performed as expected, and all equipment operated as designed.
Metal concentration data indicate the cascade was operating at steady-state condition
within twenty minutes. Removal efficiencies indicate > 99.9% of the Ce, La, Eu, and Nd
was partitioned to the strip product stream. The Cs and Sr separation was negligible as
these metals were not extracted by the TRUEX solvent. The calculated removal
efficiency for Zr indicates that ~ 0.6 % of the metal may have extracted. Organic phase
foaming was observed in the light phase interstage tubing almost immediately after
solvent flow had begun, with the expected cause being high rotor speed causing air to be
mixed with solvent. Other causes of foaming are high solvent flowrates or if the
contactors are inadequately vented. Individual stage mass transfer efficiency results
ranged from 85 % to 95 % in selected extraction stages and from 59-100 % in selected
strip stages. Temperature profile graphed data for the TRUEX flowsheet testing agreed
with previous temperature profile data reported using a lamp oil/water solvent pairing at
ambient solution operating temperature.
Lessons learned from the TRUEX test include slight physical changes to the contactor
setup such as employing a steeper angle flow path between contactors and an adjustment
of offgas outlets to minimize foaming. Through the TRUEX experimental

155
demonstration, these improvements can be incorporated into the contactor system and
following flowsheet tests for demonstration of online process monitoring. The foaming
issues and anomalies in stage mass transfer efficiencies show that further flowsheet
testing is warranted. These issues, along with the temperature profile, can be used as the
basis for further research and analysis of flowsheet data such as from the UREX
demonstration.
7.3 Dry processing flowsheet and safeguards approach
Dry processing of used nuclear fuel is often used as a head-end step before solvent
extraction-based separations such as UREX or TRUEX [13, 42, 43]. Reconstituting used
LWR and used EM2 fuel via dry processing is technically feasible. Literature suggests
that the volatile fission products (Kr, Xe, I, 3H) are released during processing, and some
of the semi-volatile fission products (Cs and Ru) are released during pellet sintering.
Medium and low-volatility fission products (Ba, Sr, Fe, La, Pd, Zr) generally remain in
the fuel along with the U, Pu and actinides. Proliferation resistance is increased due to
the discrete nature of a dry process, lack of chemical separation of Pu, utilization of a hot
cell for all processing and the accelerated buildup of 238Pu which makes the used fuel
isotopically less desirable. The addition of Raman spectroscopy as a process monitor of
both the waste and recycled streams of a dry process may further the robust safeguards in
this system. As Raman spectroscopy has already been used as a process monitor in other
industries, has been applied to fission product, actinide and lanthanide elements and is a
commonly used laboratory technique, its application in this scenario is expected to be
straightforward.

156
Future development work should include experimental testing AIROX recycling of
used nuclear fuel both from LWRs and EM2. Following successful recycling tests,
AIROX-recycling of high burnup used fuel should also be examined. In both cases,
trapping technologies for volatilized fission products should be evaluated, as well as the
integration of process monitoring for safeguards requirements. In addition to evaluating
experimental parameters such as temperature, carrier gas, time at temperature, and
temperature ramp rate, several other areas should be investigated. The actual
composition of individual LWR used fuel bundles will be dependent on reactor type,
burnup, cooling time and any unique storage or pretreatment steps. The transition from
the oxide-based to carbide-based dry processing regime should be explored. In the same
vein, all previous dry processing studies have utilized the fuel pellet and rod design
common to LWRs, not the EM2-specific fuel design. An approximate goal for the
recycle of EM2 UNF is the removal of 60% reactivity (parameter describing proximity to
criticality). Determination of several possible conditions yielding 60% reactivity removal
will allow for consideration of multiple options of dry processing and may result in
higher waste reduction abilities and/or more favorable economics.

157
NOMENCLATURE
AIROX Atomics International Reduction Oxidation CANDU Canadian Deuterium Uranium CARDIO Carbon Dioxide oxidation CMPO Octyl (phenyl)-N,N-diisobutylcarbamoyl-methylphosphine oxide CFR Code of Federal Regulations DUPIC Direct Use of PWR In CANDU EM2 Energy Multiplier Module GTCC Greater Than Class C HEU High Enriched Uranium HLW High Level Waste HM Heavy Metal ICP-AES Inductively Coupled Plasma Atomic Emission Spectroscopy ICP-MS Inductively Coupled Plasma Mass Spectrometry IFR Integral Fast Reactor LLW Low Level Waste LEU Low Enriched Uranium LWR Light Water Reactor MA Minor Actinides MOX Mixed OXide MTHM Metric Tonnes Heavy Metal MTU Metric Tonnes Uranium MWd/GWd Megawatt-day/Gigawatt-day O/A Organic to Aqueous ratio OREOX Oxidation Reduction PWR Pressurized Water Reactor REM Roentgen Equivalent Man SNF Spent Nuclear Fuel SNM Special Nuclear Material SQ Significant Quantity SRNL Savannah River National Laboratory TBP TriButyl Phosphate TGA-MS Thermal Gravimetric Analyzer Mass Spectrometry TRU TRansUranic TRUEX TRansUranic EXtraction UNF Used Nuclear Fuel UREX URanium EXtraction UV-Vis UltraViolet-Visible spectroscopy

158
REFERENCES
1. Lascola, R.; Sharma, V. Application of Absorption Spectroscopy to Actinide
Process Analysis and Monitoring. Plutonium Futures - The Science Proceedings,
Keystone, CO, September 19-23, 2010, 2010.
2. Lascola, R. J.; Livingston, R. R.; Sanders, M. A.; McCarty, J. E.; Cooper, G. A.
On Line Spectrophotometric Measurement of Uranium and Nitrate in H Canyon;
WSRC-TR-2002-00334; 2002.
3. Lascola, R. J.; Cooper, G. A. Feasibility of Uranium Concentration
Measurements for H Canyon Tank 16.7; Westinghouse Savannah River
Company: Aiken, SC, 2002.
4. Lascola, R.; Livingston, R. R.; Sanders, M. A.; McCarty, J. E.; Dunning, J. L.
Online Spectrophotometric Measurements of Uranium and Nitrate Concentrations
of Process Solutions for Savannah River Site's H-Canyon. Journal of Process
Analytical Chemistry. 2002, 7 (1), 14-20.
5. Van Uffelen, M.; Jucker, P.; Fenaux, P. Radiation resistance of fiberoptic
components and predictive models for optical fiber systems in nuclear
environments. IEEE Trans.Nucl.Sci. 1998, 45 (3 pt 3), 1558-1565.
6. Evans, B. D.; Sigel Jr., G. H. Radiation Resistant Fiber Optic Materials and
Waveguides. IEEE Transactions on Nuclear Science. 1975, NS-22 (6), 2462.
7. Peters, M. T. Advanced Nuclear Fuel Cycles Presentation (unpublished). Argonne
National Laboratory, 2008.

159
8. Deutch, J. M.; Forsberg, C. W.; Kadak, A. C.; Kazimi, M.; Moniz, E. J.; Parsons,
J. E. Update of the MIT 2003 Future of Nuclear Power; Massachusetts Institute of
Technology: Cambridge, MA, 2009.
9. Kazimi, M.; Moniz, E. J.; Forsberg, C. W.; Ansolabehere, S.; Deutch, J. M.;
Driscoll, M. J.; Golay, M. J.; Kadak, A. C.; Parsons, J. E.; Regalbuto, M. C.;
Apostolakis, G.; Hejzlar, P.; Shwageraus, E. MIT Study on the Future of the
Nuclear Fuel Cycle; Massachusetts Institute of Technology: Cambridge, MA,
2010.
10. Rohlf, T.; Van Schepen, B.; Zmolek, L. Nuclear Power.
http://wiki.uiowa.edu/display/greenergy/Nuclear, May 29, 2011.
11. Edwards, C. R.; Oliver, A. J. Uranium Processing: A Review of Current Methods
and Technology. Journal of the Minerals, Metals and Materials Society. 2000, 52
(9), 12-20.
12. Mittag, S.; Kliem, S. Burning plutonium and minimizing radioactive waste in
existing PWRs. Annals of Nuclear Energy. 2011, 38 (1), 98.
13. Paviet-Hartmann, P.; Benedict, B.; Lineberry, M. J. Nuclear Fuel Reprocessing.
Nuclear Engineering Handbook, CRC Press, Taylor and Francis Group: USA,
2009; 317.
14. Chandler, S. Thesis: Comparison of Reprocessing Methods for Light Water
Reactor Fuel. Master of Science, Georgia Institute of Technology, 2006.
15. Selvaduray, G.; Goldstein, M. K.; Anderson, R. N. Survey of nuclear fuel
reprocessing technologies. CONSERV.RECYCL. 1979, 3 (2), 93-134.

160
16. Kobayashi, H.; Amano, O.; Kawamura, F.; Aoi, M.; Hoshino, K.; Sasahira, A.;
Kani, Y. Fluorex reprocessing system for the thermal reactors cycle and future
thermal/fast reactors (coexistence) cycle. Prog.Nucl.Energy. 2005, 47 (1-4), 380-
388.
17. Navratil, J. D.; Wei, Y. Z. Actinide ion exchange technology in the back end of
the nuclear fuel cycle. Nukleonika. 2001, 46 (2), 75-80.
18. Hwang, Y. S.; Kang, C. H.; Kim, S. G.; Park, H. S. Progress of radioactive waste
management in Korea. Prog.Nucl.Energy. 2003, 42 (2), 159-177.
19. The U.S. Department of Energy's Office of Nuclear Energy Fuel Cycle Research
and Development. May 20, 2011.
http://www.ne.doe.gov/pdfFiles/factSheets/2012_FCRD_Factsheet_final.pdf
20. Mullen, M. Nuclear Energy R&D Objective 4: Understanding and Minimizing the
Risks of Nuclear Proliferation and Terrorism. Materials Protection and Control
Technology Working Group Meeting, Gaithersburg, MD, September 15-16, 2010.
21. Orton, C. R.; Fraga, C. R.; Christensen, R. N.; Schwantes, J. M. Proof of concept
simulations of the Multi-Isotope Process monitor: An online, nondestructive,
near-real-time safeguards monitor for nuclear fuel reprocessing facilities. Nuclear
Instruments and Methods in Physics Research Section A: Accelerators,
Spectrometers, Detectors and Associated Equipment. 2011, 629 (1), 209-219.
22. Holdren, J. P.Radioactive-Waste Management in the United States: Evolving
Policy Prospects and Dilemmas. Annu.Rev.Energy Environ. 1992, 17, 235-259.

161
23. Kikuchi, M.; Yoshida, T.; Matsuda, M.; Kanai, H. Developing Technologies for
Nuclear Fuel Cycles: Radioactive Waste Treatment and Spent Fuel Storage.
Hitachi Review. 1999, 48 (5), 277-284.
24. U.S. Energy Information Administration Total U.S. Commercial Spent Nuclear
Fuel Discharges, 2011.
http://eia.doe.gov/cneaf/nuclear/spent_fuel/ussnfdata.html#table1
25. U.S. Department of Energy. Final Environmental Impact Statement for the
Disposal of Spent Nuclear Fuel and High-Level Radioactive Waste at Yucca
Mountain, Nye County, Nevada, Appendix A; 2002.
26. GE Reports The Mark I Containment System in BWR Reactors.
http://www.gereports.com/the-mark-i-containment-system-in-bwr-reactors/
November 1, 2011.
27. Buongiorno, J.; Ballinger, R.; Driscoll, M.; Forget, B.; Forsberg, C.; Golay, M.;
Kazimi, M.; Todreas, N.; Yanch, J. Technical Lessons Learned from the
Fukushima-Daichii Accident and Possible Corrective Actions for the Nuclear
Industry:
An Initial Evaluation; MIT-NSP-TR-025 Rev. 1; Center for Advanced Nuclear
Energy Systems: Cambridge, MA, 2011.
28. AREVA; Mitsubishi Heavy Industries; Japan Nuclear Fuel Limited; Babcock &
Wilcox Technical Services; Battelle Energy Technology; URS Washington
Division Integrated U.S. Used Fuel Strategy - Analyses Performed by the
International Nuclear Recycling Alliance; International Nuclear Recycling
Alliance: 2008.

162
29. Lewis, B. J.; Corse, B. J.; Thompson, W. T.; Kaye, M. H.; Iglesias, F. C.; Elder,
P.; Dickson, R.; Liu, Z. Low volatile fission-product release and fuel
volatilization during severe reactor accident conditions. J.Nucl.Mater. 1998, 252
(3), 235-256.
30. Neeb, K. Radionuclides in the Reactor Core. The Radiochemistry of Nuclear
Power Plants with Light Water Reactors, de Gruyter: Berlin, Germany, 1997; 66-
133.
31. Agnew, S.; Garzenne, C.; Gilleland, J.; Greenspan, E.; Papay, L.; Pluche, H.;
Wagoner, J.; Lebreton, P. Potential Applications of the Archimedes Filter
Technology to the Nuclear Fuel Cycle - UREX Process and UREX-AFP Process.
Unpublished, 2005.
32. Lebreton, P. Potential Applications of the Archimedes Filter Technology to the
Nuclear Fuel Cycle - Spent Nuclear Fuel Contents Hypothesis and Assessments.
Unpublished, 2005.
33. Notz, K. J.; Carter, W. L.; Kibbey, A. H. Integrated Data Base for Spent Fuel and
Radwaste: Inventories. ANS Proceedings, Los Angeles, CA, June 6-11, 1982,
1982.
34. Notz, K. J. Characteristics of Spent Nuclear Fuel. Fourth International
Symposium on Ceramics in Nuclear Waste Management, Indianapolis, IN, 1988.
35. Ando, Y.; Nishihara, K.; Takano, H. Estimation of spent fuel compositions from
light water reactors. J Nucl Sci Technol. 2000, 37 (10), 924-933.
36. Campbell, D. O.; Burch, W. D. The Chemistry of Fuel Reprocessing: Present
Practices, Future Trends. J.Radioanal.Nucl. 1990, 142 (1), 303-320.

163
37. Loveland, W. D.; Morrissey, D. J.; Seaborg, G. T.; Modern Nuclear Chemistry;
Eds,; John Wiley and Sons: New Jersey, 2005.
38. Schneider, M.; Marignac, Y. Report: Spent Nuclear Fuel Reprocessing in France;
Princeton University: Princeton, 2008.
39. Nash, K. L.; Barrans, R. E.; Chiarizia, R.; Dietz, M. L.; Jensen, M. P.; Rickert, P.
G.; Moyer, B. A.; Bonnesen, P. V.; Bryan, J. C.; Sachleben, R. A. Fundamental
Investigations of Separations Science for Radioactive Materials. Solvent
Extraction and Ion Exchange. 2000, 18 (4), 605-631.
40. Selvaduray, G.; Goldstein,M. K.; Anderson,R. N.: Reprocessing and Recycling:
Separation Technologies Reviewed, 35-40, 1978.
41. Regalbuto, M. C.; Copple, J. M.; Leonard, R.; Pereira, C.; Vandegrift, G. F.
Solvent Extraction Process Development for Partitioning and Transmutation of
Spent Fuel. Actinide and Fission Product Partitioning and Transmutation Eight
Information Exchange Meeting, Las Vegas, NV, November 9-11, 2004.
42. Vandegrift, G. F.; Regalbuto, M. C.; Aase, S. B.; Arafat, H. A.; Bakel, A. J.;
Bowers, D. L.; Byrnes, J. P.; Clark, M. A.; Emery, J. W.; Falkenberg, J. R.;
Guelis, A. V.; Hafenrichter, L. D.; Leonard, R. A.; Pereira, C.; Quigley, K. J.;
Tsai, Y.; Pol, M. H. V.; Laidler, J. J. Lab-Scale Demonstration of the UREX+
Process. Proceedings of Waste Management Symposia. Tucson, AZ, 2004.
43. Lanham, W. B.; Runion, T. C. PUREX Process for Uranium and Plutonium
Recovery; ORNL-479; Oak Ridge National Laboratory: 1949.
44. Vandegrift, G. F.; Regalbuto, M. C.; Aase, S.; Bakel, A.; Battisti, T. J.; Bowers,
D.; Byrnes, J. P.; Clark, M. A.; Cummings, D. G.; Emery, J. W.; Falkenberg, J.

164
R.; Gelis, A. V.; Pereira, C.; Hafenrichter, L.; Tsai, Y.; Quigley, K. J.; Vander
Pol, M. H. Designing and Demonstration of the UREX+ Process Using Spent
Nuclear Fuel. ATALANTE, Nimes, France, 2004.
45. Rudisill, T. S.; Thompson, M. C.; Norato, M. A.; Kessinger, G. F.; Pierce, R. A.;
Johnson, J. D. Demonstration of the UREX solvent extraction process with
Dresden reactor fuel. Transactions of the American Nuclear Society, 2003.
46. Schroeder, N. C.; Attrep, M. Technetium and Iodine Separations in the UREX
Process; Accelerator Transmutation of Waste Program WBS 1.24.01.01; Los
Alamos National Laboratory: 2003.
47. Healy, T. V.; McKay, H. A. C. The Extraction of Nitrates by Tri-Normal-Butyl
Phosphate (TBP) 2. The Nature of the TBP Phase. Transactions of the Faraday
Society. 1956, 52 (5), 633-642.
48. Fedorov, Y. S.; Zilberman, B. Y.; Kopyrin, A. A.; Arkhipov, S. A. Uranium(IV)
Complexes Formed in Extraction with Tributyl Phosphate from Nitric Acid
Solutions. Radiochemistry. 2001, 43 (2), 166-171.
49. Woodhead, J. L.; McKay, H. A. C. Uranium (IV) Nitrate and Perchlorate Species
in Tri-n-Butyl Phosphate Solutions. Journal of Inorganic and Nuclear Chemistry.
1965, 27, 2247-2254.
50. Pereira, C.; Vandegrift, G. F.; Regalbuto, M. C.; Aase, S.; Bakel, A.; Bowers, D.;
Brynes, J. P.; Clark, M. A.; Emery, J. W.; Falkenberg, J. R.; Gelis, A. V.;
Hafenrichter, L.; Leonard, R.; Quigley, K. J.; Tsai, Y.; Vander Pol, M. H.;
Laidler, J. J. Lab-Scale Demonstration of the UREX+2 Process Using Spent Fuel.
Proceedings of Waste Management Symposia. Tucson, AZ, 2005.

165
51. Wright, A. D. Thesis: Nitrate Ion Effects on Uranium Chemistry in the TBP-
Dodecane System. M. S., UNLV, 2008.
52. Pereira, C. UREX+ Process Overview. Personal communication, September 19,
2008.
53. Laidler, J. J.; Battles, J. E.; Miller, W. E.; Gay, E. C. Development of IFR
Pyroprocessing Technology. Proceedings of GLOBAL 1993, Seattle, WA,
September 12-17, 1993.
54. Nash, K. L. Twenty-First Century Approaches to Actinide Partitioning.
Separations for the Nuclear Fuel Cycle in the 21st Century, American Chemical
Society: 2006; 21-40.
55. Hannum, W. H.; Wade, D.; Stanford, G. Self-Protection in Dry Recycle
Technologies; Argonne National Laboratory: Argonne, 1995.
56. Nuclear Energy Agency. Pyrochemical Separations in Nuclear Applications - A
Status Report; Organisation for Economic Cooperation and Development: Paris,
2004.
57. Majumdar, D.; Jahshan, S. N.; Allison, C. M.; Kuan, P.; Thomas, T. R. Recycling
of Nuclear Spent Fuel with AIROX Processing; DOE Idaho Field Office: 1992.
58. Grantham, L. F.; Clark, R. G.; Hoyt, R. C.; Miller, J. R. AIROX Dry
Pyrochemical Processing of Oxide Fuels - A Proliferation-Resistant Reprocessing
Method. ACS Symp.Ser. 1980, (117), 219-232.
59. Baybarz, R. D.; Clinton, S. D.; Farrar, L. G.; Fitzgerald, C. L.; Haire, R. G.;
Tennery, V. J.; Vaughen, V. C. A.; Watson, C. D. Voloxidation-Removal of

166
Volatile Fission Products From Spent LMFBR Fuels; ORNL-TM-3723; Chemical
Technology Division, ORNL: Oak Ridge, Tennessee, 1973.
60. Jahshan, S. N.; McGeehan, T. J. Evaluation of the deployment of AIROX-
recycled fuel in pressurized water reactors. Nucl Technol. 1994, 106 (3), 350-359.
61. Allison, C. M.; Jahshan, S. N.; Wade, N. L. Neutronics and Fuel Behavior of
AIROX-Processed Fuel Recycled into Light Water Reactors; EGG-M--93267;
CONF-930913--17; EG&G Idaho, Inc., INEL: 1993.
62. Piet, S.; Bjornard, T.; Dixon, B.; Gombert, D.; Laws, C.; Matthern, G. Which
elements should be recycled for a comprehensive fuel cycle? 2007.
63. International Atomic Energy Agency. About the IAEA.
http://www.iaea.org/About/ October 5, 2011.
64. IAEA. The Present Status of IAEA Safeguards on Nuclear Fuel Cycle Facilities;
IAEA Bulletin Volume 22 Number 3/4; 1980.
65. Kang, J. Proliferation resistance of PEACER system. Progress in Nuclear
Energy. 2007, 49, 115.
66. Pereira, C.; Leite, E. M. Non-proliferating reprocessed nuclear fuels in
pressurised water reactors: Fuel cycle options. Ann.Nucl.Energy. 1998, 25 (12),
937-962.
67. Hannum, W. H.; Wade, D. C.; Mcfarlane, H. F.; Hill, R. N. Nonproliferation and
Safeguards Aspects of the IFR. Progress in Nuclear Energy. 1997, 31 (1/2), 203.
68. Bari, R.; Cheng, L. Y.; Phillips, J.; Pilat, J.; Rochau, G.; Therios, I.; Wigeland, R.;
Wonder, E.; Zentner, M. Proliferation Risk Reduction Study of Alternative Spent

167
Fuel Processing. INMM Annual Meeting Proceedings, Tucson, AZ, July 12-16,
2009.
69. Pomeroy, G.; Bari, R.; Wonder, E.; Zentner, M.; Haas, E.; Killeen, T.; Cojazzi,
G.; Whitlock, J. Approaches to Evaluation of Proliferation Resistance of Nuclear
Energy Systems. Proceedings of the 49th Annual Meeting of the Institute of
Nuclear Materials Management, Nashville, TN, July 13-17, 2008.
70. Ooyama, K.; Keta, S.; Kanou, M.; Moriyama, T.; Okamura, Y.; Ogaki, K.; Noda,
K. Monitoring of Radioactive Gaseous and Liquid Wastes at Rokkasho
Reprocessing Plant. Pacific Basin Nuclear Conference, 2006.
71. Polovov, I. B.; Volkovich, V. A.; Charnock, J. M.; Kralj, B.; Lewin, R. G.;
Kinoshita, J.; May, I.; Sharrad, C. A. In Situ Spectroscopy and
Spectroelectrochemistry of Uranium in High-Temperature Alkali Chloride Molten
Salts. Inorg.Chem. 2008, 47 (17), 7474-7482.
72. Zhemzhurov, M. L.; Levadnyi, V. A. Gamma Spectrometry in Continuous
Monitoring of the Impurity Concentration in the Coolant of a Reactor Circuit.
Atomic Energy. 1991, 70 (3), 176.
73. Walker, D. M.; Mullin, D. S. Updating of a Gamma Spectroscopy-based Failed Fuel
Monitor. IEEE Conference Record 1996 Nuclear Science Symposium, Anaheim,
CA, Nov 2-9, 1996.
74. Sundar, U.; Sivadasan, P. C.; Yadav, R. B.; Gopalan, B.; Syamsundar, S. Rapid
titrimetric determination of free acidity in process samples of uranyl nitrate.
Analyst. 1998, 123, 1875-1877.

168
75. Moulin, C.; Decambox, P.; Mauchien, P.; Pouyat, D.; Couston, L. Direct
Uranium(VI) and Nitrate Determinations in Nuclear Reprocessing by Time-
Resolved Laser-Induced Fluorescence. Anal.Chem. 1996, 68 (18), 3204-3209.
76. Yamamoto, T.Spectrophotometric determination of plutonium with
chlorophosphonazo III. Mikrochim.Acta. 1974, 62 (5), 871-877.
77. Moyers, R. Photometric Determination of Uranium Concentration. INMM Annual
Meeting Proceedings, Baltimore, MD, July 11-15, 2010.
78. Hines, J. W.; Henkel, J. J.; Upadhyaya, B. R. Process Monitoring Techniques for
Nuclear Material Diversion Detection. J.Nucl.Mater.Manage. 2009, XXXVII (3),
4-13.
79. Goddard, B.; Charlton, W. S.; McDeavitt, S. M. Real-Time Detection of
UREX+3a Extraction Streams for Materials Accountancy. Journal of Nuclear
Materials Management. 2009, 38 (1).
80. Carrott, M. J.; Wai, C. M. UV-Visible Spectroscopic Measurement of Solubilities
in Supercritical CO Using High-Pressure Fiber-Optic Cells. Anal.Chem. 1998, 70
(11), 2421-2425.
81. Armenta, S.; Quintás, G.; Garrigues, S.; Guardia, M. d. l. Mid-infared and
Raman spectrometry for quality control of pesticide formulations. Trends in
Analytical Chemistry. 2005, 24 (8), 772-781.
82. Vankeirsbilck, T.; Vercauteren, A.; Baeyens, W.; Weken, G. V. d.; Verpoort, F.;
Vergote, G.; Remon, J. P. Applications of Raman spectroscopy in pharmaceutical
analysis. Trends in Analytical Chemistry. 2002, 21 (12), 869-877.

169
83. De Beer, T. R. M.; Vercruysse, P.; Burggraeve, A.; Quinten, T.; Ouyang, J.;
Zhang, X.; Vervaet, C.; Remon, J. P.; Baeyens, W. R. G. In-Line and Real-Time
Process Monitoring of a Freeze Drying Process Using Raman and NIR
Spectroscopy as Complementary Process Analytical Technology (PAT) Tools.
Journal of Pharmaceutical Sciences. 2009, 98 (9), 3430.
84. Nah, S.; Ryu, K.; Cho, S.; Chung, H.; Namkung, H. Simple and robust near-
infared spectroscopic monitoring of indium-tin-oxide (ITO) etching solution using
Teflon tubing. Anal.Chim.Acta. 2006, 556 , 208-215.
85. Biddle, P.; Miles, J. H. Rate of Reaction of Nitrous Acid with Hydrazine and with
Sulphamic Acid - Its Application to Nitrous Acid Control in 2-Phase Industrial
Systems. Journal of Inorganic & Nuclear Chemistry. 1968, 30 (5), 1291.
86. Kawamura, K.; Nagayoshi, H.; Yao, T. In situ analysis of proteins at high
temperatures mediated by capillary-flow hydrothermal UV-vis spectrophotometer
with a water-soluble chromogenic reagent. Analytica Chimica Acta. 2010, 667,
88.
87. Bulatov, A. V.; Ivasenko, P. A.; Moskvin, L. N. Simultaneous Stepwise Injection
- Photometric Determination of Nitrite and Nitrate Ions in Aqueous Media.
Journal of Analytical Chemistry. 2010, 65 (8), 816.
88. Bryan, S.; Levitskaia, T. Monitoring of UREX Radiochemical Processes for
Enhanced Safeguards in Reprocessing Plant; Pacific Northwest National
Laboratory: Battelle, 2007.

170
89. Smith, N. A. UV/Visible Spectroscopy-based Process Monitoring, Fundamental
Chemistry for Process Control, MC&A. GNEP Safeguards Working Group,
PNNL, March, 2008.
90. Strong, F. C.Theoretical Basis of Bouguer-Beer Law of Radiation Absorption.
Anal.Chem. 1952, 24 (2), 338-342.
91. Skoog, D.; Holler, F. J.; Neiman, T.; Principles of Instrumental Analysis; Eds,;
Fifth; Harcourt Brace & Company: USA, 1998.
92. Bell, J. T.; Biggers, R. E. The Absorption Spectrum of the Uranyl Ion in
Perchlorate Media: Part III. Resolution of the Ultraviolet Band Structure; Some
Conclusions Concerning the Excited State of UO22+. J.Mol.Spectrosc. 1968, 25,
312-329.
93. Bell, J. T.; Biggers, R. E. The Absorption Spectrum of the Uranyl Ion in
Perchlorate Media: Part II. The Effects of Hydrolysis on the Resolved Spectral
Bands. J.Mol.Spectrosc. 1967, 1967 (22), 262-271.
94. Bell, J. T.; Biggers, R. E. The Absorption Spectrum of the Uranyl Ion in
Perchlorate Media: Part I. Mathematical Resolution of the Overlapping Band
Structure and Studies of the Environmental Effects. J.Mol.Spectrosc. 1965, 18,
247-275.
95. Steele, H.; Taylor, R. J. A theoretical study of the inner-sphere disproportionation
reaction mechanism of the pentavalent actinyl ions. Inorg.Chem. 2007, 46 (16),
6311-6318.

171
96. Tsushima, S.; Wahlgren, U.; Grenthe, I. Quantum chemical calculations of
reduction potentials of AnO22+/AnO2
+ (An = U, Np, Pu, Am) and Fe3+/Fe2+
couples. Journal of Physical Chemistry A. 2006, 110 (29), 9175-9182.
97. Ankudinov, A. L.; Ravel, B.; Rehr, J. J.; Conradson, S. D. Real-space multiple-
scattering calculation and interpretation of x-ray-absorption near-edge structure.
Physical Review B. 1998, 58 (12), 7565-7576.
98. de Jong, W. A.; Apra, E.; Windus, T. L.; Nichols, J. A.; Harrison, R. J.; Gutowski,
K. E.; Dixon, D. A. Complexation of the carbonate, nitrate, and acetate anions
with the uranyl dication: Density functional studies with relativistic effective core
potentials. Journal of Physical Chemistry A. 2005, 109 (50), 11568-11577.
99. Barnes, C. E.; Shin, Y.; Saengkerdsub, S.; Dai, S. EXAFS study of uranyl nitrate
dimer at high and low temperature. Inorg.Chem. 2000, 39 (4), 862-864.
100. Karim, D. P.; Georgopoulos, P.; Knapp, G. S. EXAFS Studies of Actinide Ions in
Aqueous Solution; Argonne National Laboratory: Argonne, 1979.
101. Allen, P. G.; Shuh, D. K.; Bucher, J. J.; Edelstein, N. M.; Palmer, C. E. A.; Silva,
R. J.; Nguyen, S. N.; Marquez, L. N.; Hudson, E. A. Determinations of uranium
structures by EXAFS: Schoepite and other U(VI) oxide precipitates.
Radiochimica Acta. 1996, 75 (1), 47-53.
102. Allen, P. G.; Shuh, D. K.; Bucher, J. J.; Edelstein, N. M.; Reich, T.; Denecke, M.
A.; Nitsche, H. EXAFS determinations of uranium structures: The uranyl ion
complexed with tartaric, citric, and malic acids. Inorg.Chem. 1996, 35 (3), 784-&.

172
103. Allen, P. G.; Bucher, J. J.; Shuh, D. K.; Edelstein, N. M.; Reich, T. Investigation
of Aquo and Chloro Complexes of UO2 2+, NpO2 +, Np4+, and Pu3+ by X-ray
Absorption Fine Structure Spectroscopy. Inorg.Chem. 1997, 36 (21), 4676-4683.
104. Gaillard, C.; Chaumont, A.; Billard, I.; Hennig, C.; Ouadi, A.; Wipff, G. Uranyl
coordination in ionic liquids: The competition between ionic liquid anions, uranyl
counterions, and Cl- anions investigated by extended X-ray absorption fine
structure and UV-visible spectroscopies and molecular dynamics simulations.
Inorg.Chem. 2007, 46 (12), 4815-4826.
105. Ikeda-Ohno, A.; Hennig, C.; Rossberg, A.; Funke, H.; Scheinost, A. C.; Bernhard,
G.; Yaita, T. Electrochemical and complexation behavior of neptunium in
aqueous perchlorate and nitrate solutions. Inorg.Chem. 2008, 47 (18), 8294-8305.
106. Di Giandomenico, M. V.; Le Naour, C.; Simoni, E.; Guillaumont, D.; Moisy, P.;
Hennig, C.; Conradson, S. D.; Den Auwer, C. Structure of early actinides(V) in
acidic solutions. Radiochimica Acta. 2009, 97 (7), 347-353.
107. Chan, S. K.; Knapp, G. S. Extended X-Ray Absorption Fine Structure (EXAFS)
Studies of the Actinides. 3rd International EXAFS Conference, Stanford, CA. July
16-20, 1984.
108. Denecke, M. A.; Dardenne, K.; Marquardt, C. M. Np(IV)/Np(V) valence
determinations from Np L3 edge XANES/EXAFS. Talanta. 2005, 65 (4), 1008-
1014.
109. Fillaux, C.; Berthet, J. C.; Conradson, S. D.; Guilbaud, P.; Guillaumont, D.;
Hennig, C.; Moisy, P.; Roques, J.; Simoni, E.; Shuh, D. K.; Tyliszczak, T.;
Castro-Rodriguez, I.; Den Auwer, C. Combining theoretical chemistry and

173
XANES multi-edge experiments to probe actinide valence states. Comptes Rendus
Chimie. 2007, 10 (10-11), 859-871.
110. Conradson, S. D.; Abney, K. D.; Begg, B. D.; Brady, E. D.; Clark, D. L.; den
Auwer, C.; Ding, M.; Dorhout, P. K.; Espinosa-Faller, F. J.; Gordon, P. L.; Haire,
R. G.; Hess, N. J.; Hess, R. F.; Keogh, D. W.; Lander, G. H.; Lupinetti, A. J.;
Morales, L. A.; Neu, M. P.; Palmer, P. D.; Paviet-Hartmann, P.; Reilly, S. D.;
Runde, W. H.; Tait, C. D.; Veirs, D. K.; Wastin, F. Higher order speciation effects
on plutonium L-3 X-ray absorption near edge spectra. Inorg.Chem. 2004, 43 (1),
116-131.
111. Conradson, S. D.; Manara, D.; Wastin, F.; Clark, D. L.; Lander, G. H.; Morales,
L. A.; Rebizant, J.; Rondinella, V. V. Local structure and charge distribution in
the UO2-U4O9 system. Inorg.Chem. 2004, 43 (22), 6922-6935.
112. Servaes, K.; Hennig, C.; Billard, I.; Gaillard, C.; Binnemans, K.; Gorller-
Walrand, C.; Van Deun, R. Speciation of uranyl nitrato complexes in acetonitrile
and in the ionic liquid 1-butyl-3-methylimidazolium
bis(trifluoromethylsulfonyl)imide. European Journal of Inorganic Chemistry.
2007, (32), 5120-5126.
113. Newville, M.: Fundamentals of XAFS Report. Chicago, IL, pp1-40, 2004.
114. Argonne National Laboratory: Advanced Photon Source For Prospective Users:
Learn about X-ray Research. http://www.aps.anl.gov/Users/Prospective/, May 19,
2011.
115. Ressler, T.WinXAS: a program for X-ray absorption spectroscopy data analysis
under MS-Windows. Journal of Synchrotron Radiation. 1998, 5, 118-122.

174
116. Baltic University Environmental Science Chapter 12: Metal Flows and
Environmental Impact, Figure 12.21.
http://www.balticuniv.uu.se/environmentalscience/ch12/chapter12_g.htm, 2011.
117. Harris, D.C. Quantitative Chemical Analysis; Eds,; W.H. Freeman and Co: 2003.
118. Determination of the Acidity of Aqueous Solutions Containing Hydrolyzable
Metal Ions Using Oxalate Complexation; Allied-General Nuclear Services, Eds,;
1978.
119. Paviet-Hartmann, P. Lecture 8: Notions of Chemical Engineering. Presented at
CHEM 793: Reprocessing, UNLV, Spring Semester, 2009.
120. Todd, T. INL Research Fact Sheets: Advanced Separation Technologies.
http://www.inl.gov/research/advanced-separation-technologies/, May 19, 2011.
121. CINC Industries, L. V-02 Operating Manual.
http://www.cincmfg.com/v/vspfiles/downloadables/Manual%20V-02.swf, 2011.
122. Serrano-Purroy, D.; Baron, P.; Christiansen, B.; Glatz, J. -.; Madic, C.;
Malmbeck, R.; Modolo, G. First demonstration of a centrifugal solvent extraction
process for minor actinides from a concentrated spent fuel solution. Separation
and Purification Technology. 2005, 45 (2), 157-162.
123. Takeuchi, M.; Ogino, H.; Nakabayashi, H.; Arai, Y.; Washiya, T.; Kase, T.;
Nakajima, Y. Extraction and stripping tests of engineering-scale centrifugal
contactor cascade system for spent nuclear fuel reprocessing. J Nucl Sci Technol.
2009, 46 (3), 217-225.

175
124. Padial-Collins, N. T.; Zhang, D. Z.; Zou, Q.; Ma, X. Centrifugal Contactors:
Separation of an Aqueous and an Organic Stream in the Rotor Zone (LA-UR-05-
7800). Sep.Sci.Technol. 2006, 41, 1001-1023.
125. Pereira, C. Argonne National Laboratory, General Contactor Slides - Personal
Communication, 2008.
126. Leonard, R. A.; Chamberlain, D. B.; Conner, C. Centrifugal Contactors for
Laboratory-Scale Solvent Extraction Tests. Sep.Sci.Technol. 1997, 32 (1), 193-
210.
127. Bilancia, G.; Facchini, A.; Ferrando, M.; Giola, M.; Maluta, F.; Mariani, M.;
Mazzuccato, M.; Madic, C.; Sabbioneda, S. Selective actinide extraction with a
tri-synergistic mixture using a centrifugal contactor battery. Solvent Extraction
and Ion Exchange. 2005, 23 (6), 773-780.
128. Weber, A., Eds.; Topics in Current Physics: Raman Spectroscopy of Gases and
Liquids. Springer-Verlag: Germany, 1979; 11, 318.
129. Siesler, H. W., Ozaki, Y., Kawata, S., Heise, H. M., Eds.; Near-Infrared
Spectroscopy. Wiley-VCH: Germany, 2002; 348.
130. Nakamoto, K.; Eds. Infrared and Raman Spectra of Inorganic and Coordination
Compounds. John Wiley & Sons, Inc.: USA, 1997; Fifth Ed. Part A: Theory and
Applications in Inorganic Chemistry, 387.
131. Nakamoto, K.; Eds. Infrared and Raman Spectra of Inorganic and Coordination
Compounds. John Wiley & Sons, Inc.: USA, 1997; Fifth Ed. Part B: Applications
in Coordination, Organometallic, and Bioinorganic Chemistry, 384.

176
132. Smith, N. A.; Cerefice, G. S.; Czerwinski, K. Application of Optical Techniques
for On-Line Materials Accountability in the UREX Solvent Extraction Process.
47th Annual Institute for Nuclear Materials Management Annual Meeting, 2006.
133. Atkins,P.W.; Paula,J.D. Physical Chemistry; Eds,; W.H. Freeman: 2002.
134. Ahrland, S.On the Complex Chemistry of the Uranyl Ion, Part I. The Hydrolysis
of the Six-valent Uranium in Aqueous Solutions. Acta Chem.Scand. 1949, 3, 374-
400.
135. Ahrland, S.On the Complex Chemistry of the Uranyl Ion, Part VI. The
Complexity of Uranyl Chloride, Bromide and Nitrate. Acta Chem.Scand. 1951, 5,
1271-1282.
136. Ryan, J. L.Anion Exchange and Non-Aqueous Studies of the Anionic Nitrato
Complexes of the Hexavalent Actinides. J.Phys.Chem. 1961, 65 (7), 1099-1107.
137. Crocker, I. H.Oxidation of Pu(IV) to Pu(VI) in Solutions of Nitric Acid,
Aluminum Nitrate, Sodium Nitrate, and Uranyl Nitrate. CRDC-657. 1957.
138. Nockemann, P.; Servaes, K.; Deun, R. V.; Hecke, K. V.; Meervelt, L. V.;
Binnemans, K.; Grller-Walrand, C. Speciation of Uranyl Complexes in Ionic
Liquids by Optical Spectroscopy. Inorg.Chem. 2007, 46 (26), 11335-11344.
139. Grenthe, I.; Drozdzynski, J.; Fujino, T.; Buck, E. C.; Albrecht-Schmitt, T. E.;
Wolf, S. F. Uranium. The Chemistry of the Actinide and Transactinide Elements,
Springer: The Netherlands, 2006; 3, 577.
140. Bostick, D. T.The Simultaneous Analysis of Uranium and Nitrate; Oak Ridge
National Laboratory Analytical Chemistry Division: Oak Ridge, 1978.

177
141. Meinrath, G.Uranium (VI) Speciation by Spectroscopy. J.Radioanal.Nucl. 1997,
224 (1-2), 119-126.
142. Meinrath, G.; Klenze, R.; Kim, J. I. Direct Spectroscopic Speciation of Uranium
(VI) in Carbonate Solutions. Radiochimica Acta. 1996, 74, 81-86.
143. Gray, J. H.; Swanson, J. L. Report: Properties of Concentrated Plutonium Nitrate
Solutions; Allied-General Services: 1978.
144. Tkac, P.; Paulenova, A.; Gable, K. P. Spectroscopic Study of the Uranyl-
Acetohydroxamate Adduct with Tributyl Phosphate. Appl.Spectrosc. 2007, 61 (7),
772-776.
145. Taylor, R. J.; May, I. Advances in actinide and technetium kinetics for
applications in process flowsheet modeling. Sep.Sci.Technol. 2001, 36 (5-6),
1225-1240.
146. Birkett, J. E.; Carrott, M. J.; Fox, O. D.; Jones, C. J.; Maher, C. J.; Roube, C. V.;
Taylor, R. J.; Woodhead, D. A. Controlling Neptunium and Plutonium within
Single Cycle Solvent Extraction Flowsheets for Advanced Fuel Cycles. J Nucl Sci
Technol. 2007, 44 (3), 337-343.
147. Nitsche, H.; Lee, S. C.; Gatti, R. C. Determination of Plutonium Oxidation States
at Trace Levels Pertinent to Nuclear Waste Disposal. J.Radioanal.Nucl. 1988, 124
(1), 171-185.
148. Veirs, D. K.; Smith, C. A.; Zwick, B. D.; Marsh, S. F.; Conradson, S. D.
Characterization of the nitrate complexes of Pu(IV) using absorption
spectroscopy, 15N NMR and EXAFS. 1993.

178
149. Wilson, R. E.; Hu, Y.; Nitsche, H. Detection and Quanitification of Pu(III, IV, V
and VI) Using a 1.0-meter Liquid Core Waveguide. Radiochimica Acta. 2005, 93
(4), 203-206.
150. Silva, R. J.; Nitsche, H. Actinide Environmental Chemistry. Radiochimica Acta.
1995, 70/71, 377.
151. Burger, S.; Banik, N. L.; Buda, R. A.; Kratz, J. V.; Kuczewski, B.; Trautmann, N.
Speciation of the oxidation states of plutonium in aqueous solutions by UV/Vis
spectroscopy, CE-ICP-MS and CE-RIMS. Radiochimica Acta. 2007, 95 (8), 433-
438.
152. Masaumi, N.; Sano, Y.; Koma, Y.; Kamiya, M.; Shibata, A.; Koizumi, T.;
Koyama, T. Separation of actinide elements by solvent extraction using
centrifugal contactors in the NEXT process. J Nucl Sci Technol. 2007, 44 (3),
373-381.
153. Meikrantz, D.; Garn, T.; Mann, N.; Law, J.; Todd, T. Hydraulic performance and
mass transfer efficiency of engineering scale centrifugal contactors. GLOBAL
2007: Advanced Nuclear Fuel Cycles and Systems, Boise, ID, September 9-13,
2007.
154. Krebs, J. F. Figures for Warburton, personal communication, September 19, 2008.
155. Department of Energy Understanding Official Use Only.
http://www.hss.doe.gov/classification/QualityMgt/understandingouo.pdf, May 20,
2011.
156. Department of Energy Controlled Unclassified Scientific and Technical
Information. http://www.osti.gov/stip/controlled, May 20, 2011.

179
157. Law, J. D.; Garn, T. G.; Meikrantz, D. H.; Warburton, J. Pilot-scale truex
flowsheet testing for separation of actinides and lanthanides from used nuclear
fuel. Sep.Sci.Technol. 2010, 45 (12), 1769-1775.
158. Pereira, C.; Vandegrift, G.; Regalbuto, M.; Bakel, A.; Bowers, D.; Gelis, A.;
Hebden, A.; Maggos, L.; Stepinski, D.; Tsai, Y.; Laidler, J. Lab-Scale
Demonstration of the UREX+1a Process Using Spent Fuel. Proceedings of Waste
Management '07, Tucson, AZ, February 25-March 1, 2007.
159. Chamberlain, D. B.; Conner, C.; Hutter, J. C.; Leonard, R. A.; Wygmans, D. G.;
Vandegrift, G. F. TRUEX processing of plutonium analytical solutions at
Argonne National Laboratory. Sep.Sci.Technol. 1997, 32 (1-4), 303-326.
160. Felker, L. K.; Binder, J. L.; Benker, D. E.; Collins, E. D.; Bailey, P. D.; Bell, G.
L.; Jubin, R. T.; Spencer, B. B.; Del Cul, G. D.; Vedder, R. L.; Walker, E. A.;
Voit, S. L. Results, Evaluation, and Lessons Learned from the Coupled End to
End Project Campaign 1 Using Dresden BWR Used Fuel; GNEP-SEPA-PMO-
M1-DV-2008-000131, ORNL/GNEP/LTR-2008-044; 2008.
161. Jubin, R.; Collins, E.; Felker, K.; Spencer, B.; Walker, E.; Vedder, R.; Taylor, R.;
Binder, J. CETE R&D at Oak Ridge National Laboratory Supporting
Management of Nuclear Waste. Proceedings of Waste Management '09, Phoenix,
AZ, March 1-5, 2009, .
162. Garn, T. G.; Meikrantz, D. H.; Greenhalgh, M.; Law, J. D. Temperature Profile
Measurements in a Newly Constructed 30-Stage 5 cm Centrifugal Contactor Pilot
Plant; INL/EXT 08-14861; 2008.

180
163. Meikrantz, D. H.; Law, J. D.; Herbst, R. S.; Garn, T. G.; Mann, N. R.; Todd, T. A.
Hydraulic and Mass Transfer Testing of Commercial 5 cm Annular Centrifugal
Contactors at INL; INL/EXT 05-00793; 2005.
164. Garn, T. G.; Mann, N. R.; Meikrantz, D. H.; Law, J. D.; Todd, T. A. Hydraulic
and Reliability Tests of the CINC C-05TA-CIP 12.5 cm Annular Centrifugal
Contactor; INL/EXT 06-11958; 2006.
165. Mann, N. R.; Garn, T. G.,; Meikrantz, D. H.; Law, J. D.; Todd, T. A. Clean In
Place Testing of a Commercial 12.5 cm Annular Centrifugal Contactor at the
INL; INL/EXT 06-111533; 2006.
166. Garn, T. G.; Meikrantz, D. H.; Law, J. D.; Mann, N. R.; Todd, T. A. Mass
Transfer Efficiency Testing of a Single Stage Commercial 12.5 cm Annular
Centrifugal Contactor at the INL; INL/EXT 07-12739; 2007.
167. Brewer, K. N.; Herbst, S. R.; Tranter, T. J.; Todd, T. A. CMPO Purity Tests in the
TRUEX Solvent Using Americium-241; WINCO-1177; 2008.
168. Gelis, A. V.; Vandegrift, G. F.; Bakel, A.; Bowers, D. L.; Hebden, A. S.; Pereira,
C.; Regalbuto, M. Extraction behaviour of actinides and lanthanides in
TALSPEAK, TRUEX and NPEX processes of UREX+. Radiochimica Acta.
2009, 97 (4-5), 231-232.
169. Fujii, T.; Aoki, K.; Yamana, H. Effect of nitric acid distribution on extraction
behavior of trivalent f-elements in a TRUEX system. Solvent Extraction and Ion
Exchange. 2006, 24 (3), 347-357.

181
170. Brewer, K.; Herbst, R.; Tranter, T.; Todd, T. CMPO Purity Test in the TRUEX
Solvent Using Americium-241; WINCO-1177; Westinghouse Idaho Nuclear
Company: 1993.
171. Schulz, W. W.; Horwitz, E. P. The TRUEX Process: Removal/Recovery of TRU
elements from acidic waste solutions, Extraction 87. The Recovery of High Value
Materials. 1987, 103, 245.
172. Vandegrift, G. F.; Chamberlain, D. B.; Conner, C.; Copple, J. M.; Dow, J. A.;
Everson, L.; Hutter, J. C.; Leonard, R. A.; Nunez, L.; Regalbuto, M. C.; Sedlet, J.;
Srinivasan, B.; Weber, S.; Wygmans, D. G. Development and Demonstration of
the TRUEX Solvent Extraction Process. Technology and Programs for
Radioactive Waste Management and Environmental Restoration. 1993, 2, 1045.
173. Meikrantz, D. H.; Federici, A. G.; Macaluso, L. L.; Sams, H. W. Rotor Sleeve for
a Centrifugal Separator. U.S. Patent 5.571.070, 1996.
174. Garn, T. G. Idaho National Laboratory, Estimation of steady-state conditions by
calculating solvent turnovers, unpublished, June 2009.
175. General Atomics EM2 - Nuclear Waste to Energy.
http://www.ga.com/energy/em2/ 2011.
176. Lineberry, M. J.; McFarlane, H. F. The EBR-II Spent Fuel Treatment Program.
Proceedings of GLOBAL 1995, Versailles, France, September 11-14, 1995.
177. Laidler, J. J.; Battles, J. E.; Miller, W. E.; Ackerman, J. P.; Carls, E. L.
Development of Pyroprocessing Technology. Progress in Nuclear Energy. 1997,
31 (1/2), 131.

182
178. McPheeters, C. C.; Pierce, R. D.; Mulcahey, T. P. Application of the
Pyrochemical Process to Recycle of Actinides from LWR Spent Fuel. Progress in
Nuclear Energy. 1997, 31 (1/2), 175.
179. US Energy Information Administration Electricity Net Generation: Total (All
Sectors), 1949-2009. http://www.eia.gov/electricity/data.cfm, 2010.
180. Choi, H. General Atomics, ORIGEN burnup calculations, personal
communication, July 2010.
181. Westphal, B. R.; Bateman, K. J.; Lind, B. P.; Howden, K. L.; Del Cul, G. D.
Fission Product Removal from Spent Oxide Fuel by Head-End Processing.
Proceedings of GLOBAL 2005, Tsukuba, Japan, October 9-15, 2005, 2005.
182. Benedict, R. W.; Solbrig, C.; Westphal, B.; Johnson, T. A.; Li, S. X.; Marsden,
K.; Goff, K. M. Pyroprocessing Progress at Idaho National Laboratory.
Proceedings of GLOBAL 2007, Boise, ID, September 9-13, 2007.
183. Westphal, B. R.; Vaden, D.; Li, S. X.; Frederickson, G. L.; Mariani, R. D. Fate of
Noble Metals During the Pyroprocessing of Spent Nuclear Fuel. Proceedings of
GLOBAL 2009, Paris, France, September 6-11, 2009.
184. Lee, J. H.; Shim, J. B.; Kim, E. H.; Yoo, J. H. A Feasibility Study for the
Development of Alternative Methods to Treat a Spent TRISO Fuel. Nuclear
Technology. 2008, 162, 250.
185. Spalding, B. P.Volatility and extractability of strontium-85, cesium-134, cobalt-
57, and uranium after heating hardened Portland cement paste. Environmental
Science and Technology. 2000, 34 (23), 5051-5058.

183
186. Lewis, B. J.; Andre, B.; Ducros, G.; Maro, D. A Model For Non-Volatile Fission
Product Release During Reactor Accident Conditions; 30000528; Commissariat a
l'Energie Atomique.
187. Lewis, B. J.; Corse, B. J.; Thompson, W. T.; Kaye, M. H.; Iglesias, F. C.; Elder,
P.; Dickson, R.; Liu, Z. Vaporization of Low-Volatile Fission Products Under
Severe CANDU Reactor Accident Conditions; 31006089; Royal Military College
of Canada.
188. Westphal, B. R.; Park, J. J.; Shin, J. M.; Park, G. I.; Bateman, K. J.; Wahlquist, D.
L. Selective trapping of volatile fission products with an off-gas treatment system.
Sep.Sci.Technol. 2008, 43 (9-10), 2695-2708.
189. Asquith, J. G.; Grantham, L. F. Low-Decontamination Approach To A
Proliferation-Resistant Fuel Cycle. Nucl Technol. 1978, 41 (2), 137-148.
190. Hanson, L. A.Removal of Irradiated UO2 Fuel From the Cladding by Controlled
Oxidation; NAA-SR-3591; Atomics International: 1959.
191. Brand, G. E.; Murbach, E. W. Pyrochemical Reprocessing of UO2 by AIROX
Summary Report; NAA-SR-11389; Atomics International: 1965.
192. Reynard, M. P.; Czerwinski, K. R. MIT Contribution to the LDRD AIROX
Project: Examination of Waste Issues. Massachusetts Institute of Technology,
1999.
193. Christian, J.; Sterbentz, J.; Abbott, D.; Czerwinski, K. R.; Cacciapouti, R.
Concepts for dry processing of spent nuclear fuel for recycling to light-water
reactors. Scientific Basis for Nuclear Waste Management XXIII, Boston, MA,
USA, November 29-December 2, 1999, 2000.

184
194. Plaue, J. Thesis: Evaluation of Uranium Carbide and Sulfide Fuels for a Gas-
Cooled Fast Reactor utilizing Dry Reprocessing. M.S., MIT, 2003.
195. The Nuclear Regulatory Commission: Uranium Enrichment.
http://www.nrc.gov/materials/fuel-cycle-fac/ur-enrichment.html, November 6,
2011.
196. Song, K. C.; Park, G. I.; Lee, J. W.; Park, J. J.; Yang, M. S. Fractional release
behavior of volatile and semivolatile fission products during a voloxidation and
OREOX treatment of spent PWR fuel. Nucl Technol. 2008, 162 (2), 158-168.
197. Park, G. I.; Lee, J. W.; Yang, M. S. Release behavior of Kr-85 from spent fuel
during OREOX process. Transactions of the American Nuclear Society. 2004, 91,
521.
198. Choi, H.; Baxter, A. A comparative study on recycling spent fuels in gas-cooled
fast reactors. Annals of Nuclear Energy. 2010, 37 (5), 723.
199. Bresee, J. Advanced Fuel Cycle R&D, Separations and Waste Forms. Advanced
Reactor, Fuel Cycle and Energy Products Workshop for Universities,
Gaithersburg, MD, unpublished.
200. Ko, W. I.; Kim, H. D. Analysis of Nuclear Proliferation Resistance of DUPIC
Fuel Cycle. J Nucl Sci Technol. 2001, 38 (9), 757-765.
201. Pillay, K. K. S. Safeguards and Nonproliferation Aspects of a Dry Fuel Recycling
Technology. International conference and Technology Exhibition Global 1993,
Seattle, Washington, September 12-17, 1993, 1993.
202. Hoyt, R. C.; Grantham, L. F. A Proliferation-Resistant Method of Recycling
Fissile-Rich Spent Fuel. Transactions of the American Nuclear Society, 1979.
185
203. Brooker, M. H.; Huang, C.; Sylwestrowicz, J. Raman spectroscopic studies of
aqueous uranyl nitrate and perchlorate systems. Journal of Inorganic and Nuclear
Chemistry. 1980, 42 (10), 1431-1440.
204. Morris, D. E.; Hobart, D. E. Raman Spectra of the Lanthanide Oxalates. Journal
of Raman Spectroscopy. 1988, 19, 231.
205. Baron, P.; Brown, C.; Kaiser, B.; Matthews, B.; Mukaiyama, T.; Omberg, R.;
Peddicord, L.; Salvatores, M.; Walter, A. An Evaluation of the Proliferation
Resistant Characteristics of Light Water Reactor Fuel with the Potential for
Recycle in the United States; Pacific Northwest National Laboratory, 2004.
206. Argonne National Laboratory: The Reduced Enrichment for Research and Test
Reactors (RERTR) Program. http://www.rertr.anl.gov/index.html, November 6,
2011.
207. Pond, R. B.; Matos, J. E. Photon Dose Rates From Spent Fuel Assemblies With
Relation To Self-Protection (Rev. 1); ANL/RERTR/TM-25; Argonne National
Laboratory RERTR Program: Argonne, IL, 1996.
208. Hassing, S.; Jernoshoj, K. D.; Hedegaard, M. Solving chemical classification
problems using polarized Raman data. Journal of Raman Spectroscopy. 2010, 42
(1), 21.
209. Hanoune, B.; Paccou, L.; Delcroix, P.; Guinet, Y. Raman identification of H2CO
in aqueous solutions. Journal of Raman Spectroscopy. 2010, 42 (3).
210. Murray, P. AREVA, MPACT Working Group Meeting Discussion. Gaithersburg,
MD, September 15, 2010.

186
211. Frost, R. L.; Palmer, S. J.; Reddy, B. J. Raman spectroscopic study of the uranyl
titanate mineral euxenite (Y, Ca, U, Ce, Th)(Nb, Ta, Ti)2O6. Journal of Raman
Spectroscopy. 2011, 42 (3).
212. Frost, R. L.; Cejka, J. A Raman spectroscopic study of the uranyl mineral
rutherfordine - revisited. Journal of Raman Spectroscopy. 2009, 40 (9), 1096.
213. Dik, T. A.Spectral Properties of Uranyl Nitrate Complexes with Tertiary
Aliphatic Phosphine Oxides. Journal of Applied Spectroscopy. 2001, 68 (1), 55-
60.
214. Ikeda-Ohno, A.; Hennig, C.; Tsushima, S.; Scheinost, A. C.; Bernhard, G.; Yaita,
T. Speciation and structural study of U(IV) and -(VI) in perchloric and nitric acid
solutions. Inorg.Chem. 2009, 48 (15), 7201-7210.
215. Kruglik, S. G.; Lambry, J. -.; Martin, J. -.; Vos, M. H.; Negrerie, M. Sub-
picosecond Raman spectrometer for time-resolved studies of structural dynamics
in heme proteins. J.Raman Spectrosc. 2011, 42 (3), 265-275.
216. Lucazeau, G.; Le Bacq, O.; Pasturel, A.; Bouvier, P.; Pagnier, T. High-pressure
polarized Raman spectra of Gd2(MoO4)3: Phase transitions and amorphization.
J.Raman Spectrosc. 2011, 42 (3), 452-460.
217. Merten, C.; Li, H.; Lu, X.; Hartwig, A.; Nafie, L. A. Observation of resonance
electronic and non-resonance-enhanced vibrationalnatural Raman optical activity.
J.Raman Spectrosc. 2010, 41 (12), 1563-1565.
218. Okita, Y.; Katagiri, T.; Matsuura, Y. A Raman cell based on hollow optical fibers
for breath analysis, Progress in Biomedical Optics and Imaging – Proceedings of
SPIE, (7559), 2010.

187
219. Smardzewski, R. R.; Andrews, L. Raman spectra of the products of rubidium and
cesium atom argon matrix reactions with oxygen molecules. J.Phys.Chem. 1973,
77 (6), 801-804.
220. Selig, H.; Fried, S. Raman spectra of technetium heptoxide. Inorganic and
Nuclear Chemistry Letters. 1971, 7 (4), 315-323.
221. Cerefice, G. S. Lecture 6: Regulations and Waste Management. Presented at
ME656: Nuclear Waste Management, UNLV, 2009.
222. U.S. NRC NRC Regulations, Title 10 Code of Federal Regulations Part 61.55
Waste Classification. http://www.nrc.gov/reading-rm/doc-
collections/cfr/part061/part061-0055.html, 2011.
223. Barrett, L. H. United States used Nuclear Fuel Management: Future Options.
Proceedings of the Institute for Nuclear Materials Management 51st Annual
Meeting, Baltimore, MD, July 11-15, 2010.
224. Lucuta, P. G.; Verrall, R. A.; Matzke, H. J.; Palmer, B. J. Microstructural features
of SIMFUEL - Simulated high-burnup UO2-based nuclear fuel. Journal of
Nuclear Materials. 1991, 178, 48.
225. Asuvathraman, R.; Rajagopalan, S.; Ananthasivan, K.; Mathews, C. K.; Mallya,
R. M. Surface studies on uranium monocarbide using XPS and SIMS.
J.Nucl.Mater. 1995, 224 (1), 25-30.
226. Lee, J.; Lee, J. I.; Chang, W. J.; Chang, S. H. Comparative cost analysis of direct
disposal versus pyro-processing with DUPIC in Korea. Annals of Nuclear Energy.
2010, 37 (12), 1699.

188
VITA
Jamie Lee Warburton
Degrees: Bachelor of Science, Nuclear Science and Engineering, 2003 Massachusetts Institute of Technology
Special Honors and Awards: Nonproliferation Graduate Fellow – PNNL contractor to NNSA, 2010-2011 Nuclear Forensics Graduate Fellow – Sponsored by DNDO and DTRA, 2008-2011 Roy G. Post Foundation Scholarship Recipient, 2010 Professional Women in ANS Funding Award, 2010 Innovations in Fuel Cycle Research Award, 1st Place MC&A, 2010 J. D. Williams Student Paper Award, INMM, 2nd Place, 2010 Women In Nuclear Sponsored Student, 2010 Internships:
General Atomics, 2010 Idaho National Laboratory, 2009 Argonne National Laboratory, 2008
Publications:
Warburton, J. L.; Czerwinski, K.: Demonstration of UV-Visible Spectrsocopic Online Process Monitoring Under UREX Conditions, Proceedings of the 52nd Annual Meeting of the Institute for Nuclear Materials Management, Palm Desert, CA, July 17-21, 2011. Warburton, J.; Smith, N.; Czerwinski, K.: Method for online process monitoring for use in solvent extraction and actinide separations. Separation Science and Technology, 45, 1763-1768, 2010. Law, J. D.; Garn, T. G.; Meikrantz, D. H.; Warburton, J.: Pilot-scale TRUEX flowsheet testing for separation of actinides and lanthanides from used nuclear fuel. Separation Science and Technology, 45, 1769-1775, 2010. Warburton, J.L., Use of UV-Visible Spectroscopy to Determine Solution Chemistry Under Spent Nuclear Fuel Reprocessing Conditions, Proceedings of the 51st Annual Meeting of the Institute for Nuclear Materials Management, Baltimore, MD, July 11-15, 2010.
Dissertation Title: Spectroscopic Methods of Process Monitoring for Safeguards of Used
Nuclear Fuel Separations Dissertation Examination Committee:
Chairperson, Ken Czerwinski, Ph. D.

189
Committee Member, Patricia Paviet-Hartmann, Ph. D. Committee Member, Paul Forster, Ph. D. Committee Member, Mary Anne Yates, Ph. D. Graduate Faculty Representative, Anthony Hechanova, Ph. D.