Embed Size (px)
Citation preview
Spectrochimica Acta Part B 66 (2011) 604–609
Contents lists available at ScienceDirect
Spectrochimica Acta Part B
j ourna l homepage: www.e lsev ie r.com/ locate /sab
Laser Ablation Molecular Isotopic Spectrometry: Parameter influence on boronisotope measurements
Xianglei Mao a, Alexander A. Bol'shakov b, Dale L. Perry a, Osman Sorkhabi a, Richard E. Russo a,⁎a Lawrence Berkeley National Laboratory, University of California, Berkeley, CA 94720, USAb Applied Spectra, Inc., 46661 Fremont Boulevard, Fremont, CA 94538, USA
⁎ Corresponding author.E-mail address: [email protected] (R.E. Russo).
0584-8547/$ – see front matter © 2011 Elsevier B.V. Adoi:10.1016/j.sab.2011.06.007
a b s t r a c t
a r t i c l e i n f oArticle history:Received 8 April 2011Accepted 18 June 2011Available online 30 June 2011
Keywords:Optical isotopic measurementLaser ablation plasmaMolecular emission spectraLIBSLAMIS of boron isotopesBoron isotope
Laser Ablation Molecular Isotopic Spectrometry (LAMIS) was recently reported for optical isotopic analysis ofcondensed samples in ambient air and at ambient pressure. LAMIS utilizes molecular emissions which exhibitlarger isotopic spectral shi ts than in atomic transitions. For boron monoxide 10BO and 11BO, the isotopic shiftsextend from 114 cm−1 (0.74 nm) to 145–238 cm−1 (5–8 nm) at the B 2Σ+ (v=0)→X 2Σ+ (v=2) and A 2Πi
(v=0)→X 2Σ+ (v=3) transitions, respectively. These molecular isotopic shifts are over two orders ofmagnitude larger than the maximum isotopic shift of approximately 0.6 cm−1 in atomic boron. This paperdescribes how boron isotope abundance can be quantitatively determined using LAMIS and how atomic, ionic,and molecular optical emission develops in a plasma emanating from laser ablation of solid samples withvarious boron isotopic composition. We demonstrate that requirements for spectral resolution of themeasurement system can be significantly relaxed when the isotopic abundance ratio is determined usingchemometric analysis of spectra. Sensitivity can be improved by using a second slightly delayed laser pulsearriving into an expanding plume created by the first ablation pulse.
ll rights reserved.
© 2011 Elsevier B.V. All rights reserved.
1. Introduction
Laser Ablation Molecular Isotopic Spectrometry (LAMIS) wasrecently reported for real-time isotopic analyses of samples atambient pressure [1]. LAMIS involves the generation of a laserinduced plasma andmeasurement of molecular spectra of the radicalsthat are produced following ablation into the atmosphere. Thetraditional approach to using optical emission spectrometry in laserablation plasma is known as Laser-Induced Breakdown Spectroscopy(LIBS), which is primarily used for elemental analysis of condensedphase samples using atomic spectroscopy [2–6]. In a number ofprevious studies, some molecular emissions were used for laserinduced plasma diagnostics [7,8] and as additional spectral features inLIBS applications for identifying organic materials (pathogenicbacteria, explosive residues, biological and chemical agents) [9,10].Quantitative analytical LIBS measurements using molecular emissionat atmospheric pressure have been only recently demonstrated oncomplex organic matrices [11].
The benefits of laser plasma spectrometry are well established;real-time elemental analysis at atmospheric pressure, no samplepreparation, and no consumables. The technology can be used in alaboratory or field environment for contact and open-path stand-offmeasurements [10,12–14]. Nevertheless, laser plasma spectrometry is
generally not utilized as a source for isotope detection for thefollowing reasons: (1) broadening of spectral lines due to Stark andDoppler effects, and (2) relatively small isotope splitting for atomicspecies. For example, the isotopic shift for 10B and 11B atomic resonanttransition at 208.9 nm is only 2.5 pm, while Stark broadening of thisline in typical LIBS plasmas can be larger than 100 pm. 235U and 238Uhave an isotopic shift of 25 pm for the ionic emission line at 424.4 nm.For the plutonium isotopes 239Pu and 240Pu, the isotopic shift is 5 pmfor the emission line at 594.5 nm.
There are several proven ways to overcome these challenges: (1)performing laser ablation with the sample in vacuum or noble gasenvironments [15–18], (2) using plasma sources – such as ICP(inductively coupled plasmas) – that have lower electron numberdensities [19–21], (3) using chemometric analysis [22], and now, usingLAMIS [1]. Recent work at the National Research Council in Canadademonstrated that a relatively low resolution spectrometer was able tomeasure the235U/238U ratio at 424.4 nm using chemometric analysis ofthe spectra from a laser plasma at atmospheric pressure [22]. Isotopemeasurements using optical emission have been reported in otherplasma sources that have lower electron density than the laser plasma[19–21]. For example, the electron number density in ICP istypically ~1015 cm−3 compared to ~1017 cm−3 in the laser ablationplasmas used in LIBS. Hence, a high-resolution spectrometerwas able toresolve the uranium isotopes of 233, 235, 236 and 238 at the same424.4 nm electronic transition in ICP [23]. These studies relied on theelectronic transition of the ionized uranium atom that has a relativelylarge 235/238 isotopic shift of 25 pm. Isotopic shifts for other elements

605X. Mao et al. / Spectrochimica Acta Part B 66 (2011) 604–609
are commonly only a few picometers [24]. LAMIS on the other hand isbased on the measurement of molecular emission bands in the laserplasmawhich exhibit large isotopic splitting due to contributions of therotational and vibrational states of the molecule. For 10B and 11B, wepredicted and measured an isotopic shift of 744 pm (114 cm−1) in theBO emission band (0,2) B→X at 255–256 nm; more than two orders ofmagnitude greater than the isotopic splitting of 2.5 pm (0.57 cm−1) inthe atomic boron prominent line at 208.89 nm.
Boron and its isotopes are emphasized in this work because of thesignificance of boron in a number of analytical and technicaldisciplines. Coatings enriched in 10B are widely used in the materialssciences of neutron detection materials [25–28], since neutroncapture cross section of 10B is six orders of magnitude higher thanthat of 11B and significantly higher than that of any other materials.Owing to such unique nuclear properties, natural and isotope-enriched boron is often utilized as neutron shielding and neutronabsorbing materials in nuclear reactors. Isotopic boron also has wideapplications in medical technology, with one major application ofneutron capture therapy [29,30]. Boron isotopes are the centerpiecefor the entire field of boron nuclear magnetic resonance (10B and 11BNMR) spectroscopy andmagnetic resonance imaging diagnostics [31–33]. Boron ingredients have been shown necessary for both humanand animal nutrition [34,35]. Boron also is the basis for several majorareas of materials chemistry, including boranes [36], amine-boranes[37], and elemental borides [33,38].
LAMIS extends the previously established advantages of LIBStechnology into the new field of isotopic analysis. Using commercialLIBS instruments [39,40] with a technique of LAMIS, one can rapidlyscan over either surface or depth distributions of a specific isotope inany material, structure or tissue with lateral resolution of ~50 μm anddepth resolution of ~20 nm. The nominal sample quantity can be lessthan 1 μg. Three-dimensional isotopic mapping with fine spatialresolution is necessary in boron radio-chemotherapeutic cancerresearch, in which neutron capture by 10B-loaded targeted drugsgenerate lethal radiation that damages DNA within individualmalignant cells. Presently, isotopic mapping at the scale of tens ofmicrons can be obtained with laser ablation – inductively coupledplasma – mass spectrometry (LA-ICP-MS) or secondary ion massspectrometry (SIMS), both involving large and expensive instrumen-tation. In contrast, LAMIS can be implemented as a fieldable device.Application of LAMIS for localized boron isotope determination is ofinterest in the development of handheld semiconductor-basedneutron sensors, in which a layer of 10B-enriched boron carbidewith thickness of 1.5 to 100 μm is deposited on top of a regular silicon-based diode [28]. Other neutron detection devices lined, coated orloaded with 10B can be rapidly tested by LAMIS for isotopic andelemental composition, hetero- or homogeneity, and possible defectsfor the purpose of quality assessment and quality control. In nuclearreactors with boron neutron capturers or boric acid added coolants,the ability to measure the 10B and 11B content by LAMIS will beparticularly useful. By analogy with LIBS [41], such monitoring can beachieved remotely through a small window.
Because of the importance of boron in research, its chemistry andmaterials science aspects, and technology in a number of fields, LAMISshould play an important role in the general analytical chemistry ofthe element and in research of boron with respect to isotope-basedexperiments. LAMIS can be applicable in studies where differentisotopes are used as tracers during reaction chemistry and also formonitoring the feedstock or analyzing the reaction products that canbe in bulk as well as in thick or thin films. Isotope exchange reactions,interfacial reactions involving fluids, and studies of solid stateinterfaces of boron materials are but a few types of experiments.
This manuscript reports quantitative results for boron isotopicanalysis using LAMIS. Also discussed are the effects of acquisitiondelay time on the measurement of boron monoxide in the laserplasma, measurement and calibration of standard samples with
known 10B/11B isotope ratios using partial least squares (PLS)regression, and the influence of spectral resolution on the predictionof abundance ratio. Application of two closely successive laser pulses(a double-pulse approach) is shown to improve sensitivity.
2. Experimental
Samples with known boron isotopic ratio were ablated using a Nd:YAG laser with a wavelength of 1064 nm, pulse energy of 50–100 mJ,and a pulse duration of 4 ns. The laser beam was focused onto thesample with a quartz lens to a spot diameter of ~100 μm. A second lenswasused to collect the laser-inducedplasmaemissiononto the entranceof a fiber optic cable coupled to a Czerny-Turner spectrometer with anIntensified Charge-Coupled Device (ICCD). The signal acquisition delayafter the laser pulse was varied to demonstrate the relative intensitiesfor atomic, ionic and molecular emission. The spectra representaccumulation of single or multiple laser pulses; the number of pulsesfor each measurement is noted in figure captions. Additional measure-ments were performed at different spectral resolution by changing theentrance slit width of the spectrometer. The spectral resolution isdetermined by measuring the full width at half maximum (FWHM) ofthe Hg line. All measurements were performed in air at atmosphericpressure.
A double-pulse LAMIS setup consisted of two lasers and adetection system. The wavelength of the ablation laser was 355 nm,and its pulse energy 8.5 mJ. The second laser's wavelength was1064 nm with pulse energy 75 mJ. The second laser propagatedorthogonal to the first ablation laser. The time delay between the twolaser pulses was 2.4 μs. The second laser pulse was focused inside thefirst laser induced plasma at a height approximately 1 mm above thesample surface. The ICCD acquired spectra at 8 μs delay after theablation laser. The gated acquisition time was 30 μs.
Boron nitride (BN) pressed-powder disks with natural isotopicabundance were used as samples. These BN disks were commercialsputtering targets designed for film deposition in the electronics andoptical industry (obtained fromAlfa Aesar, 99.99% purity). Additionally,isotope-enriched samples of 10B2O3 and 11B2O3 (99% 10B and 95% 11B)were used as reference standards. The boron oxide samples werepurchased from Cambridge Isotope Laboratories, Inc. (Andover, MA,USA). To prepare the different isotope ratio boron oxide referencesamples, we mixed different amounts of isotope-enriched B2O3 andpressed them with 7 ton pressure for 4 min into one-centimeterdiameter pellets.
3. Results and discussion
We demonstrated that isotopic shifts can be orders of magnitudelarger in molecular versus atomic optical emission [1]. In LAMIS, anablating laser pulse is impinged on the sample surface that results inexplosive vaporization, atomization and partial ionization of matterfrom the sample and surrounding air. After the plasma in a plume coolsdown sufficiently, the molecular radicals form. In particular, thediatomic oxide radicals form when atoms evaporated from the samplereact with dissociated atmospheric oxygen. A small deviation in plasmachemistry of different isotopes of the same element may occur but ingeneral, all isotopes undergo very similar reactions. Quantitativecalibration then relates the measured spectra of isotopomeric radicalsin an ablation plume to the original abundances of isotopes in thesample.
In the first experiment, a BN sample was ablated with an infraredNd:YAG laser. The ejected boron atoms reacted with oxygen from airand formed BO radicals in a laser ablation plume. The spectra in Fig. 1show the laser plasma optical emission spectra of the boronmonoxidetransition B 2Σ+ (v=0)→X 2Σ+ (v=2) in the wavelength region of255 to 259 nm. In Fig. 1a, the black and red traces are the simulatedemission spectra of 11B16O and 10B16O, respectively. This simulation

(a)
(b)
254.5 255.0 255.5 256.0 256.5 257.0 257.5 258.0 258.5 259.0
254.5 255.0 255.5 256.0 256.5 257.0 257.5 258.0 258.5 259.0
4000
4500
5000
5500
6000
6500
7000
7500
8000
8500
9000
10B16O
11B16O
Em
issi
on In
tens
ity (
arb.
uni
t)
Wavelength (nm)
5000
5500
6000
6500
7000
7500
8000
8500
9000
9500
Em
issi
on In
tens
ity (
arb.
uni
t)
Wavelength (nm)
Experiment Calculation
Fig. 1. Experimental and simulated emission spectra of boron monoxide, BO. (a) Theblack and red traces are the simulated emission spectra of 11BO and 10BO, respectively.(b) The black spectrum represents the measured spectrum with natural isotopicabundance of boron accumulated from 100 laser pulses; the red trace is a sum ofsimulated 11BO and 10BO spectra with a fitted abundance of 20.24% for 10BO. Thespectral resolution is 70 pm.
0.1 1 10
100
101
102
103
104
105
106
107
Em
issi
on In
tens
ity (
arb
Uni
t)
Time (µs)
B Ionic Emission B Atomic Emission BO Molecular Emission (A-X) BO Molecular Emission (B-X) Continuum Emission
Fig. 2. Emission intensities of boron atomic and ionic lines, boron monoxide lines andcontinuum radiation versus delay time from the moment of laser ablation. ICCD gatewidth was the same as the delay but the presented data was normalized by the gatewidth and the number of accumulated spectra. Black squares for the intensity of boronionic line at 345.13 nm; red circles for the boron atomic line at 249.77 nm; greentriangles for the BO molecular emission at 572 nm (0,3 band of A→X); blue diamondsfor the BO molecular emission at 256 nm (0,2 band of B→X); and stars for thecontinuum background radiation at 255 nm.
606 X. Mao et al. / Spectrochimica Acta Part B 66 (2011) 604–609
included a natural isotopic abundance factor of 80.2% and 19.8% for11B and 10B, respectively. In Fig. 1b, the black and red tracescorrespond respectively to the experimentally measured spectrumand to a combined sum of both simulated isotopic spectra from Fig. 1a.The spectrometer resolution used in these measurements was 70 pm.The band head isotopic shift of ~740 pm is easily observed atatmospheric pressure for this spectral emission. In contrast, theisotopic shift for atomic boron emission at 208.9 nm is only 2.5 pm;almost three hundred times smaller than in the B→X transition of BO.Among other atomic boron transitions, the line at 208.9 nm has one ofthe largest known isotopic shifts in B on the scale of energy or wavenumbers (0.57 cm−1). The only one other boron line at 821.2 nm hasslightly larger isotopic shift of 0.61 cm−1 [42]; such small shifts inatomic spectral lines cannot be easily resolved at atmosphericpressure.
The simulations of boron monoxide spectra presented in Fig. 1were performed as previously described [1]. The laser plasma at longdelays after the laser pulse was assumed to reach local thermody-namic equilibrium (LTE) with a uniform and quasi-steady-statetemperature of 5000 K. The minor differences in the measured(black) and simulated (red) spectra discernible in Fig. 1b can occurdue to possible inaccuracy inmolecular constants whichwe have used
[43], and also due to neglected plasma kinetics and gradients intemperature that actually drops in time. If more accurate molecularspectral simulations were available and a kinetic plasma model wasapplied, we would be able to further address the non-equilibriumnature of the plasma that can cause measurable differences in thespectra. However, we achieved a reasonable agreement betweenexperimental and simulated spectra using a regular steady-state LTEmodel. The latter fact justifies our simple initial assumptions.
Thus, we calculated the abundance of the minor boron isotope byfitting the simulated B→X emission of BO to the experimentalspectra. The abundance of 10B was determined as 20.2% from thisLAMIS spectrumby using a least squares fitting technique. The value iswithin the 10B natural abundance range of 19.3% to 20.2% (with themean of 19.8%) [44]. An estimated detection limit for the minor 10Bisotope was approximately 1% as directly measured in our solid boronnitride sample. Even if the ablated sample was boron nitride, no BNmolecular emission was observed in the range of 200–900 nm. Moreaccurate molecular constants, if available and a more sophisticatedmodeling of plasma conditions and molecular formation can possiblyimprove the fit and accuracy of the isotope abundance determination.A different approach to determine the isotopic concentration isdescribed later in this work.
The data in Fig. 2 show how atomic, ionic, molecular andcontinuum emission evolve with time in the laser plasma; thebehavior is specific to the conditions (laser energy, energy density,pulse duration) used in these experiments. The intensity scale in thisfigure is normalized to the ICCD gate width and the number ofaccumulated signal acquisitions. As generally known and as measuredhere, atomic emission persists longer than ionic; and molecularemission increases after the atomic and ionic begin to decrease.Molecular emission can persist for tens of microseconds after the laserpulse. Accurate measurements of molecular emission are facilitatedby the fact that a plasma continuum background drops rapidly at longdelays, making feasible the registration of molecular emission with anextended acquisition gate width.
Molecular emission in these experiments was measured laterthan ~1 μs after the ablating laser pulse because of high continuumbackground fluctuations at earlier times. Temporal behavior of tworesolved molecular lines is displayed in Fig. 2: one measured at

(a)
90
120
150
180
607X. Mao et al. / Spectrochimica Acta Part B 66 (2011) 604–609
255 nm corresponding to an individual rotational line of the BOtransition B 2Σ+ (v=0)→X 2Σ+ (v=2), and the other measured at572 nm corresponding to an individual rotational line of the A 2Πi
(v=0)→X 2Σ+ (v=3) transition. These two particular rotationallines were chosen because they are well-resolved from other featuresin the spectra. The emission at 572 nm of the A→X transition isapproximately two orders of magnitude more intense than theemission at 255 nm of the transition B→X (Fig. 2). This fact indicatesthat the lower electronic states of BO molecules are more populatedthan the higher excited states of BO in the laser plasma. The upperenergy level (Te) of the B 2Σ+ state is 43173 cm−1, and that of the A2Πi is 23897 cm−1. The emission intensity is proportional to theexponential function of upper energy level over temperature inaccordance with the Boltzmann distribution.
As expected, the emission intensities of individual molecularrotational lines are weaker than intensities of the prominent spectrallines (249.77 and 345.13 nm in Fig. 2) of neutral and ionized boronatoms. However, if the overall intensity of the BO molecular bandswas spectrally integrated, then the collectivemolecular intensity (e.g.,unresolved, summed up) would be comparable to the intensity ofatomic and ionic emissions. In the present study, no such spectralintegration of the molecular spectra was performed. While molecularemission intensified with time, the continuum radiation leveldecreased more than 1000 times in the plasma from 1 to 32 μs.From the measurements presented in Fig. 2, we chose a fixed gatewidth of 30 μs and a gate delay of 4 μs after the laser pulse for thesubsequent quantitative measurements of isotopic concentrations.
The calculated isotopic shifts between 10B16O and 11B16O bandorigins for the B 2Σ+→X 2Σ+ and A 2Πi→X 2Σ+ transitions are listedin Table 1. Calculations of the shifts for several vibrational bands in thespectra of 10BO and 11BO were performed following Ref. [1], Eq. 3within Herzberg's framework of molecular spectra [45]. The simulatedBO spectra indicated that the isotopic shift at the band origin of thetransition A 2Πi (v=0)→X 2Σ+ (v=3) should be 165 cm−1 (5 nm).With the rotational quantum number about J=50 in the tail of this(0,3) vibrational band at the wavelength around 580 nm, the isotopic
Table 1The calculated isotopic shifts in band origins of molecules 10B16O and 11B16O. Only thebands experimentally observed in LAMIS are listed.
Transition ν′ ν″ Wave number(cm−1)
Wavelength(nm)
Isotope shift-1×(pm)
Isotope shift(cm−1)
B 2Σ+-X 2Σ+ 0 1 41011 243.765 369 620 2 39172 255.207 744 1140 3 37357 267.608 1181 1651 0 44133 226.518 −140 −271 1 42271 236.497 146 261 3 38617 258.873 864 1291 4 36826 271.470 1313 1782 1 43510 229.761 −45 −92 2 41672 239.899 250 433 1 44728 223.505 −210 −423 2 42889 233.087 54 10
A 2Πι-X 2Σ+ 0 1 21723 460.210 1323 620 2 19885 502.761 2895 1140 3 18069 553.265 5056 1651 0 24823 402.731 −426 −261 1 22962 435.389 515 271 2 21123 473.285 1774 792 0 26039 383.924 −888 −603 0 27233 367.096 −1253 −934 0 28404 351.958 −1540 −1245 0 29553 338.276 −1766 −1546 0 30680 325.855 −1944 −183
Isotopic shifts were calculated following Ref. [1], Eq. 3 giving an opposite sign for theshifts in wavelength and those in wave numbers. Wave numbers were calculated usingthe energy terms difference Te′−Te″+G(ν′)−G(ν″). Molecular constants were takenfrom Ref. [43]. BO isotope mass coefficient ρ=1.029 was used. The wave numbers arein vacuum; the wavelengths are in air.
shift will be 200–240 cm−1 (7–8 nm) depending on the divergencebetween the P, Q and R branches (see Ref. [1], Eq. 4).
We performed multivariate calibration using reference sampleswith known isotopic ratio. The spectral interval of 579–585 nm waschosen because a significant difference in the spectra of 10BO and 11BOisotopomeric radicals was clearly observed in this wavelength region(Fig. 3). The spectrometer resolution was initially set at 20 pm.Spectra were recorded after each ablating laser pulse and thenaveraged over 100 measurements. Several vertical dashed lines inFig. 3 indicate the wavelength positions at which the differencesbetween 10BO and 11BO spectra are the most apparent.
We prepared several mixtures of the two enriched samples of10B2O3 and 11B2O3 (99% 10B and 95% 11B) and used them as referencestandards for quantitative calibration. These mixtures with knownboron isotopic abundances were (10B0.99\11B0.01)2O3, (10B0.8\11B0.2)2O3, (10B0.52\11B0.48)2O3, (10B0.05\11B0.95)2O3. Boron nitrite ofnatural isotope abundance (10B0.2\11B0.8)N was also used as astandard.
We used a PLS linear regression routine to match a spectrum of theunknown sample to one of the reference spectra. We applied this PLSroutine as a progressive approach to obtain multivariate calibrationthat takes into account all intensities at every pixel within the region579–585 nm, as opposed to traditional univariate calibration that isbuilt using only one pre-selected spectral line (or other single spectralfeature) at a specific wavelength. The multivariate approach is moreaccurate, robust and reliable in comparison to univariate calibration.Multivariate calibration can be performed correctly even whenspectra are only partially resolved. The later aspect is particularlyimportant for molecular spectra.
579 580 581 582 583 584
60
90
120
150 (e)
(b)
LAM
IS In
tens
ity (
arb.
uni
t)
Wavelength (nm)
60
90
120
150
180 (d)60
90
120
150
180 (c)
60
90
120
150
180
60
Fig. 3. BO spectra from samples of different boron isotope concentration. (a)10B0.99
11B0.01O, (b) 10B0.811B0.2O, (c) 10B0.52
11B0.48O, (d) 10B0.211B0.8O, and (e)
10B0.0511B0.95O. The vertical dashed lines indicate the wavelength positions at which thedifferences between 10BO and 11BO spectra are the most apparent.
579 580 581 582 583 58460
90
120
150
180
Spectral Resolution (100 pm)
Spectral Resolution (27 pm)
Spectral Resolution (20 pm)
LAM
IS In
tens
ity (
arb.
uni
t)
Wavelength (nm)
60
90
120
150
180
60
90
120
150
180
60
90
120
150
180Spectral Resolution (230 pm)
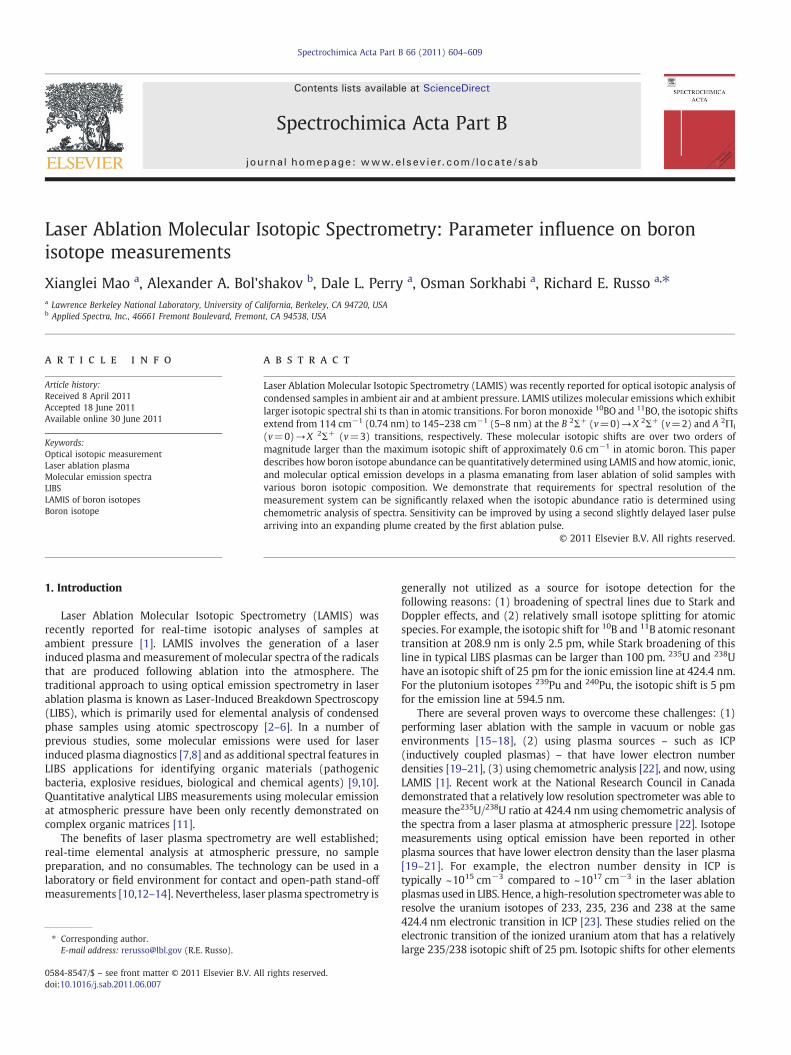
Fig. 5. BO emission spectra from laser ablation of BN sample measured with differentspectral resolution (20, 27, 100, and 230 pm). Delay 4 μs, gate width 30 μs.
608 X. Mao et al. / Spectrochimica Acta Part B 66 (2011) 604–609
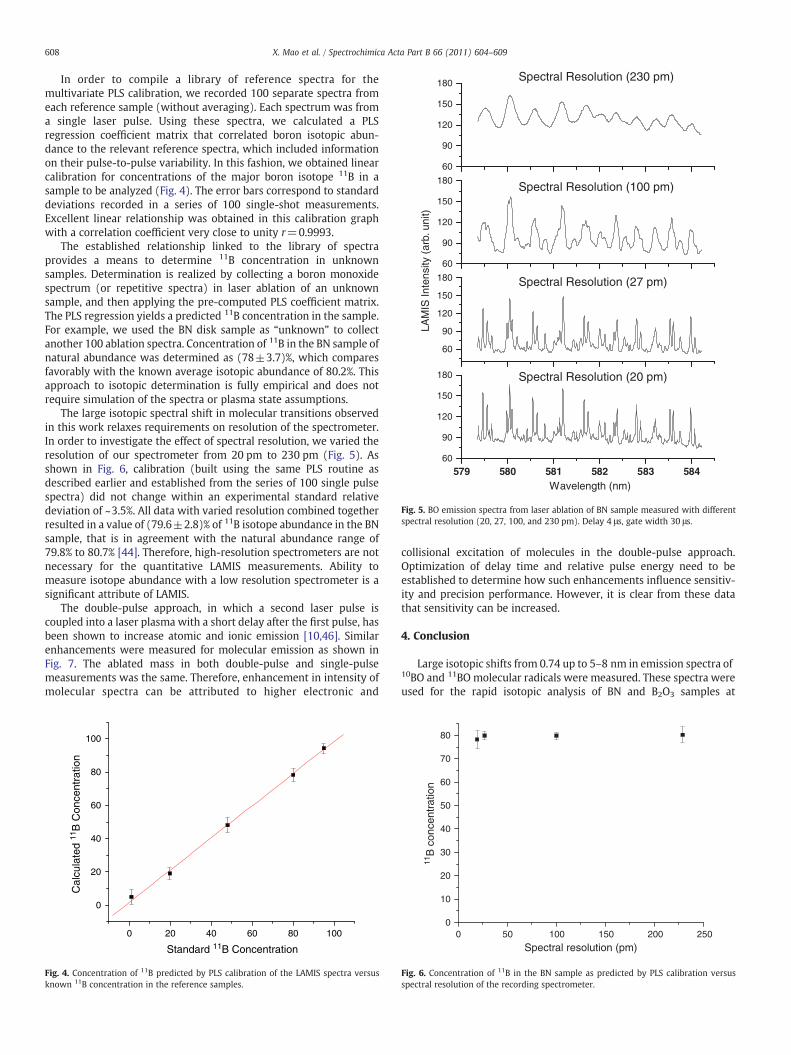
In order to compile a library of reference spectra for themultivariate PLS calibration, we recorded 100 separate spectra fromeach reference sample (without averaging). Each spectrum was froma single laser pulse. Using these spectra, we calculated a PLSregression coefficient matrix that correlated boron isotopic abun-dance to the relevant reference spectra, which included informationon their pulse-to-pulse variability. In this fashion, we obtained linearcalibration for concentrations of the major boron isotope 11B in asample to be analyzed (Fig. 4). The error bars correspond to standarddeviations recorded in a series of 100 single-shot measurements.Excellent linear relationship was obtained in this calibration graphwith a correlation coefficient very close to unity r=0.9993.
The established relationship linked to the library of spectraprovides a means to determine 11B concentration in unknownsamples. Determination is realized by collecting a boron monoxidespectrum (or repetitive spectra) in laser ablation of an unknownsample, and then applying the pre-computed PLS coefficient matrix.The PLS regression yields a predicted 11B concentration in the sample.For example, we used the BN disk sample as “unknown” to collectanother 100 ablation spectra. Concentration of 11B in the BN sample ofnatural abundance was determined as (78±3.7)%, which comparesfavorably with the known average isotopic abundance of 80.2%. Thisapproach to isotopic determination is fully empirical and does notrequire simulation of the spectra or plasma state assumptions.
The large isotopic spectral shift in molecular transitions observedin this work relaxes requirements on resolution of the spectrometer.In order to investigate the effect of spectral resolution, we varied theresolution of our spectrometer from 20 pm to 230 pm (Fig. 5). Asshown in Fig. 6, calibration (built using the same PLS routine asdescribed earlier and established from the series of 100 single pulsespectra) did not change within an experimental standard relativedeviation of ~3.5%. All data with varied resolution combined togetherresulted in a value of (79.6±2.8)% of 11B isotope abundance in the BNsample, that is in agreement with the natural abundance range of79.8% to 80.7% [44]. Therefore, high-resolution spectrometers are notnecessary for the quantitative LAMIS measurements. Ability tomeasure isotope abundance with a low resolution spectrometer is asignificant attribute of LAMIS.
The double-pulse approach, in which a second laser pulse iscoupled into a laser plasma with a short delay after the first pulse, hasbeen shown to increase atomic and ionic emission [10,46]. Similarenhancements were measured for molecular emission as shown inFig. 7. The ablated mass in both double-pulse and single-pulsemeasurements was the same. Therefore, enhancement in intensity ofmolecular spectra can be attributed to higher electronic and
0 20 40 60 80 100
0
20
40
60
80
100
Cal
cula
ted
11B
Con
cent
ratio
n
Standard 11B Concentration
Fig. 4. Concentration of 11B predicted by PLS calibration of the LAMIS spectra versusknown 11B concentration in the reference samples.
collisional excitation of molecules in the double-pulse approach.Optimization of delay time and relative pulse energy need to beestablished to determine how such enhancements influence sensitiv-ity and precision performance. However, it is clear from these datathat sensitivity can be increased.
4. Conclusion
Large isotopic shifts from 0.74 up to 5–8 nm in emission spectra of10BO and 11BO molecular radicals were measured. These spectra wereused for the rapid isotopic analysis of BN and B2O3 samples at
0 50 100 150 200 2500
10
20
30
40
50
60
70
80
11B
con
cent
ratio
n
Spectral resolution (pm)
Fig. 6. Concentration of 11B in the BN sample as predicted by PLS calibration versusspectral resolution of the recording spectrometer.

579 580 581 582 583 5840
20
40
60
80
100
120
140
160
180
Single IR Laser
Single UV Ablation Laser
Double Pulsed Laser ConfigurationLA
MIS
(A
rb. U
nit)
Wavelength (nm)
Fig. 7. BO emission spectra from laser ablation of the BN sample measured in thedouble-pulse scheme. The green trace shows the effect of firing the second laserwithout the first ablation pulse. The red spectrum corresponds to single laser pulseablation. The black spectrum corresponds to application of the two laser pulsesseparated by 2.4 μs: emission enhanced by additional heating of laser plasma. All datarecorded accumulating 100 spectra.
609X. Mao et al. / Spectrochimica Acta Part B 66 (2011) 604–609
atmospheric pressure. Quantitative determination of boron isotopesin laser ablation plasmas was performed using two differentapproaches, both of which yielded accurate results. High spectralresolution of molecular spectra was not required for quantitativecalibration of the LAMIS technique. The dynamic range of isotopicquantification was from ~1% to 100% in boron-containing solidsamples. Double pulse and other plasma heating methods havebeen found to enhance S/N for achieving lower detection limits.
Acknowledgment
This work was supported by the Defense Threat ReductionAdministration (DTRA) of the U. S. Department of Defense underFederal Awards No. LB09005541 and LB09005541A, and Contract no.DE-AC02-05CH11231 awarded by the U.S. Department of Energythrough the National Nuclear Security Administration (NNSA); andNASA Contract no. NNX10CA07C awarded to Applied Spectra Inc.
References
[1] R.E. Russo, A.A. Bol'shakov, X. Mao, C.P. McKay, D.L. Perry, O. Sorkhabi, Laserablation molecular isotopic spectrometry, Spectrochim. Acta Part B 66 (2011)99–104.
[2] D.M. Wong, A.A. Bol'shakov, R.E. Russo, Laser induced breakdown spectroscopy,in: J. Lindon, G. Tranter, D. Koppenaal (Eds.), Encyclopedia of Spectroscopy andSpectrometry, 2nd Edition, Academic Press, 2010, pp. 1281–1287.
[3] J.P. Singh, S.N. Thakur (Eds.), Laser-Induced Breakdown Spectroscopy, Elsevier,Amsterdam, Oxford, 2007.
[4] D.A. Cremers, L.J. Radziemski, Handbook of Laser-Induced Breakdown Spectros-copy, J. Wiley & Sons, New York, 2006.
[5] A.W. Miziolek, V. Palleschi, I. Schechter (Eds.), Laser-Induced BreakdownSpectroscopy (LIBS), Fundamentals and Applications, Cambridge UniversityPress, UK, 2006.
[6] Y.-I. Lee, K. Song, J. Sneddon, Laser-Induced Breakdown Spectroscopy, NovaScience Publishers, Huntington, NY, 2000.
[7] C.G. Parigger, G. Guan, J.O. Hornkohl, Measurement and analysis of OH emissionspectra following laser-induced optical breakdown in air, Appl. Opt. 42 (2003)5986–5991.
[8] C.G. Parigger, J.O. Hornkohl, A.M. Keszler, L. Nemes, Measurement and analysis ofatomic and diatomic carbon spectra from laser ablation of graphite, Appl. Opt. 42(2003) 6192–6198.
[9] J. Diedrich, S.J. Rehse, S. Palchaudhuri, Pathogenic Escherichia coli straindiscrimination using laser-induced breakdown spectroscopy, J. Appl. Phys. 102(2007) 014702.
[10] J.L. Gottfried, F.C. De Lucia, C.A. Munson, A.W. Miziolek, Double-pulse standofflaser-induced breakdown spectroscopy for versatile hazardous materials detec-tion, Spectrochim. Acta Part B 62 (2007) 1405–1411.
[11] F.R. Doucet, P.J. Faustino, M. Sabsabi, R.C. Lyon, Quantitative molecular analysiswith molecular bands emission using laser-induced breakdown spectroscopy andchemometrics, J. Anal. At. Spectrom. 23 (2008) 694–701.
[12] R.E. Russo, X. Mao, C. Liu, J. Gonzalez, Laser assisted plasma spectrochemistry:laser ablation, J. Anal. At. Spectrom. 19 (2004) 1084–1089.
[13] R.E. Russo, X. Mao, S.S. Mao, The physics of laser ablation in microchemicalanalysis, Anal. Chem. 74 (2002) 70A–77A.
[14] R.W. Bogue, Boom time for LIBS technology, Sens. Rev. 24 (2004) 353–357.[15] W. Pietsch, A. Petit, A. Briand, Isotope ratio determination of uranium by optical
emission spectroscopy on a laser-produced plasma — basic investigations andanalytical results, Spectrochim. Acta Part B 53 (1998) 751–761.
[16] C.A. Smith, M.A. Martinez, D.K. Veirs, D.A. Cremers, Pu-239/Pu-240 isotope ratiosdetermined using high resolution emission spectroscopy in a laser-inducedplasma, Spectrochim. Acta Part B 57 (2002) 929–937.
[17] H. Niki, T. Yasuda, I. Kitazima, Measurement technique of boron isotopic ratio bylaser-induced breakdown spectroscopy, J. Nucl. Sci. Technol. 35 (1998) 34–39.
[18] L. Mercadier, J. Hermann, C. Grisolia, A. Semerok, Plume segregation observed inhydrogen and deuterium containing plasmas produced by laser ablation of carbonfiber tiles from a fusion reactor, Spectrochim. Acta Part B 65 (2010) 715–720.
[19] F.R. Doucet, G. Lithgow, R. Kosierb, P. Bouchard, M. Sabsabi, Determination ofisotope ratios using Laser-Induced Breakdown Spectroscopy in ambient air atatmospheric pressure for nuclear forensics, J. Anal. At. Spectrom. 26 (2011)536–541.
[20] L.A. Kaledin, M.C. Heaven, Electronic spectroscopy of UO, J. Mol. Spectrosc. 185(1997) 1–7.
[21] M.C. Edelson, V.A. Fassel, Isotopic abundance determinations by inductivelycoupled plasma atomic emission spectrometry, Anal. Chem. 53 (1981)2345–2347.
[22] P.S. Goodall, S.G. Johnson, Isotopic uranium determination by Inductively CoupledPlasma Atomic Emission Spectrometry using conventional and laser ablationsample introduction, J. Anal. At. Spectrom. 11 (1996) 57–60.
[23] M. Krachler, P. Carbol, Validation of isotopic analysis of depleted, natural andenriched uranium using high resolution ICP-OES, J. Anal. At. Spectrom. 26 (2011)293–299.
[24] R.C. Stern, B.B. Snavely, The Laser isotope separation program at LawrenceLivermore laboratory, Ann. N. Y. Acad. Sci. 267 (1976) 71–79.
[25] B.W. Robertson, S. Adenwalla, A. Harken, P. Welsch, J.L. Brand, P.A. Dowben, J.P.Claassen, A class of boron-rich solid-state neutron detectors, Appl. Phys. Lett. 80(2002) 3644–3646.
[26] A.N. Caruso, P.A. Dowben, S. Balkir, N. Schemm, K. Osberg, R.W. Fairchild, O.B. Flores,S. Balaz, A.D. Harken, B.W. Robertson, J.L. Brand, The all boron carbide neutrondetector: comparison with theory, Mater. Sci. Eng. B 135 (2006) 129–133.
[27] J.P. Chaminade, O. Viraphong, F. Guillen, C. Fouassier, B. Czirr, Crystal growth andoptical properties of newneutron detectors Ce3+:Li6R(BO3)3 (R=Gd, Y), IEEE Trans.Nucl. Sci. 48 (2001) 1158–1161.
[28] K.Osberg,N. Schemm, S. Balkir, J.I. Brand,M.S.Hallbeck, P.A. Dowben,M.W.Hoffman,A handheld neutron detection sensor utilizing a new class of boron carbide diode, J.IEEE 6 (2006) 1531–1538.
[29] R.F. Barth, D.E. Carpenter, A.H. Solloway, Advances in Neutron Capture Therapy,Springer, New York, 1993.
[30] R.F. Barth, J.A. Coderre, M.J.H. Vicente, T.E. Blue, Boron neutron capture therapy ofcancer: current status and future prospects, Clin. Cancer Res. 11 (2005) 3987.
[31] D. Reed, The role of NMR in boron chemistry, Chem. Soc. Rev. 22 (1993) 109–116.[32] P. Bendel, Biomedical applications of 10B and 11B NMR, NMR Biomed. 18 (2005)
74–82.[33] B.J. Suh, X. Zong, Y. Singh, A. Niazi, D.C. Johnston, 11B NMR in the layered diborides
OsB2 and RuB2, Phys. Rev. B 76 (2007) 144511–144514.[34] H.E. Goldbach, B. Rerkasem, B.A. Wimmer, P.H. Brown, M. Thellier, R.W. Bell,
Boron in plant and animal nutrition, Springer, New York, 2002.[35] F.H. Nielsen, Boron in animal and human nutrition, Plant Soil 193 (1997) 199–208.[36] P.V. Ramachandran, H.C. Brown, Recent Advances in Borane Chemistry, ACS
Symposium Series, Organoboranes for Syntheses, 783, American ChemicalSociety, Washington, DC, 2001, pp. 1–15, in Chapter 1.
[37] B.S. Burnham, Synthesis and pharmacological activities of amine-boranes, Curr.Med. Chem. 12 (2005) 1995–2010.
[38] C.C.Wang, S.A. Akbar,W. Chen, V.D. Patton, Electrical properties of high-temperatureoxides, borides, carbides, and nitrides, J. Mater. Sci. 30 (1995) 1627–1641.
[39] A.A. Bol'shakov, J.H. Yoo, C. Liu, J.R. Plumer, R.E. Russo, Laser-induced breakdownspectroscopy in industrial and security applications, Appl. Opt. 49 (2010)C132–C142.
[40] Applied Spectra instruments, www.appliedspectra.com/products/.[41] A.I. Whitehouse, J. Young, I.M. Botheroyd, S. Lawson, C.P. Evans, J. Wright, Remote
material analysis of nuclear power station steam generator tubes by laser-inducedbreakdown spectroscopy, Spectrochim. Acta Part B 56 (2001) 821–830.
[42] B. Edlén, A. Ölme, G. Herzberg, J.W.C. Johns, Ionization potential of boron, and theisotopic and fine structure of 2s2p2 2D, J. Opt. Soc. Am. 60 (1970) 889–891.
[43] F. Mélen, I. Dubois, H. Bredohl, The A–X and B–X transitions of BO, J. Phys. B 18(1985) 2423–2432.
[44] Y.-K. Xiao, E.S. Beary, J.D. Fassett, An improved method for the high-precisionisotopic measurement of boron by thermal ionization mass spectrometry, Int. J.Mass Spectrom. Ion Processes 85 (1988) 203–213.
[45] G. Herzberg, Molecular spectra and molecular structure, I. Spectra of DiatomicMolecules, 2nd Ed., Van Nostrand Reinhold, New York, 1950.
[46] J. González, C. Liu, J. Yoo, X. Mao, R.E. Russo, Double-pulse laser ablationinductively coupled plasma mass spectrometry, Spectrochim. Acta Part B 60(2005) 27–31.