Embed Size (px)
Citation preview

86 Progress of Theoretical Physics Supplement No. 161, 2006
Spectral Mixing in Nervous Systems: Experimental Evidence andBiologically Plausible Circuits
David Kleinfeld1,2,3,∗) and Samar B. Mehta2,3
1Dept. of Physics, University of California at San Diego, La Jolla, CA 92093, USA2Neurosciences Graduate Program, University of California at San Diego, La Jolla,
CA 92093, USA3Center for Theoretical Biological Physics, University of California at San Diego,
La Jolla, CA 92093, USA
(Received September 14, 2005)
The ability to compute the difference frequency for two periodic signals depends on anonlinear operation that mixes those signals. Behavioral and psychophysical evidence sug-gest that such mixing is likely to occur in the vertebrate nervous system as a means tocompare rhythmic sensory signals, such as occurs in human audition, and as a means to lockan intrinsic rhythm to a sensory input. Electrophysiological data from electroreceptors inthe immobilized electric fish and somatosensory cortex in the anesthetized rat yield directevidence for such mixing, providing a neurological substrate for the modulation and demod-ulation of rhythmic neuronal signals. We consider an analytical model of spectral mixingthat makes use of the threshold characteristics of neuronal firing and which has featuresconsistent with the experimental observations. This model serves as a guide for constructingcircuits that isolate given mixture components. In particular, such circuits can generatenearly pure difference tones from sinusoidal inputs without the use of band-pass filters, inanalogy to an image-reject mixer in communications engineering. We speculate that suchcomputations may play a role in coding of sensory input and feedback stabilization of motoroutput in nervous systems.
§1. Introduction
Oscillations are a hallmark of neuronal activity. When two neuronal oscillatorsinteract through synaptic connections, their respective spike patterns often synchro-nize or lock with a non-zero phase shift. A dramatic example concerns two corticalneurons that interact via reciprocal inhibitory connections and spike in anti-phase atlow firing rate but synchronize at high firing rate.1) This remarkable shift in behaviorwas predicted2),3) using the theory of weakly coupled oscillators that was pioneeredby Prof. Kuramoto and elucidated so clearly in Chemical Oscillations, Waves andTurbulence.4) This theory has provided further insight through its application to thedynamics of networks of neurons,5) where collective behavior can lead to linear wavesof electrical activity in a central olfactory organ6)–8) and rotating waves of electricalactivity in visual cortex9) and in neocortical slices under epileptic-like states.10) Ata still higher level, the Kuramoto model has been used to study neuronal synchro-nization in stimulus coding,11)–14) as appears to occur in the processing of multiplestimuli by visual cortex.15)
It is our belief that the application of Prof. Kuramoto’s ideas to coupled neurons
∗) E-mail: [email protected]

Spectral Mixing in Nervous Systems 87
represents one of the only two intellectual threads that systematically connects single-cell behavior to network behavior. For weakly coupled neuronal oscillators, thisis achieved by the reduction of the full dynamics of each cell to dynamics of asingle phase variable that describes the state of a neuron along its limit cycle. Thephase variables for different cells are coupled through a sensitivity function, whichcorresponds to Kuramoto’s Z-function, and an interaction function, each of whichis described in terms of phase variables so that the output of one cell affects thephase of other cells.5) For completeness, the second intellectual thread is the strongcoupling of neurons with independent Poisson-spike statistics, either in the limit oflarge networks16) or slow synapses;17) both cases result in a firing rate descriptionthat is the key ingredient of attractor neural networks.18)–20)
Here we turn our attention to a functional consequence of interactions betweenoscillators in pursuit of the computational role they may play in sensorimotor sys-tems. Motivated by experimental findings, we consider the spectral mixing thatcan occur between two periodic signals. Mixing provides a mechanism for com-puting the differences and sums of the frequency content of two signals. This caneasily be seen when mixing is accomplished by the multiplication of two sinusoids,cos(2πfat) × cos(2πfbt) = 1
2 cos[2π(fa − fb)t] + 12 cos[2π(fa + fb)t]. When combined
with a means for isolating the difference term, spectral mixing allows the compar-ison of even small differences in the frequency content between two signals. Thisphenomenon is commonly witnessed in audition, where human subjects are sensitiveto the beat, or difference, frequency between two simultaneous pure tones.21) Theperception persists when the frequencies are presented to different ears, indicatinga neural rather than a biomechanical substrate for the mixing. Similar computa-tions may be performed in various ethological tasks, including: (i) Electroreception,where animals sense the difference in frequency between their own rhythmic elec-trical discharge and that of a neighboring fish;22),23) (ii) Echolocation, where therelative speed of flight between a bat and its prey is encoded in the difference infrequency between outgoing and reflected acoustic waves;24) and (iii) Pitch determi-nation, where animals recognize the fundamental frequency of a sound based on aharmonic stack, even when the stack is missing the fundamental.25)
If we extend the example to the case in which the two sinusoids are at thesame frequency but have a phase difference, we obtain, cos(2πft)× cos(2πft− φ) =12 cos(φ) + 1
2 cos(4πft − φ). Here, isolating the DC term allows measurement of therelative phase between two signals. Such a function can also be relevant for sensoryprocessing, as in (i) Audition, where the phase difference that results from the time ittakes for a sound to reach the two ears serves as a measure of source angle;26),27) and(ii) Vibrissa somatosensation in rats, where the relative phase between a rhythmicmotor signal and a touch signal may be used to decode the position of an objectrelative to the head.28)
§2. Electrophysiological evidence for spectral mixing
While spectral mixing would appear to be a useful computation in several sys-tems, we only know of three neurophysiological studies that have observed this phe-

88 D. Kleinfeld and S. B. Mehta
nomenon. We first review these experimental findings and use the data as motivationfor a minimal model of spectral mixing by neurons. We then raise a conjecture aboutcircuits that make use of phase shifts, rather than filtering, to isolate desired fre-quency components after the mixing has occurred.
2.1. Human vision
An experiment by Regan and Regan29) recorded electroencephalograms (EEGs)across visual cortical areas in human subjects as they attended to two superimposed,modulated visual gratings. An analysis of the EEG signals showed that the spectrumcontained a term at a frequency of 2f1 + 2f2, where f1 and f2 were the temporalmodulation frequencies of the two gratings and the factor of 2 is due to the presenceof both light-to-dark and dark-to-light transitions.
2.2. Fish electroreception
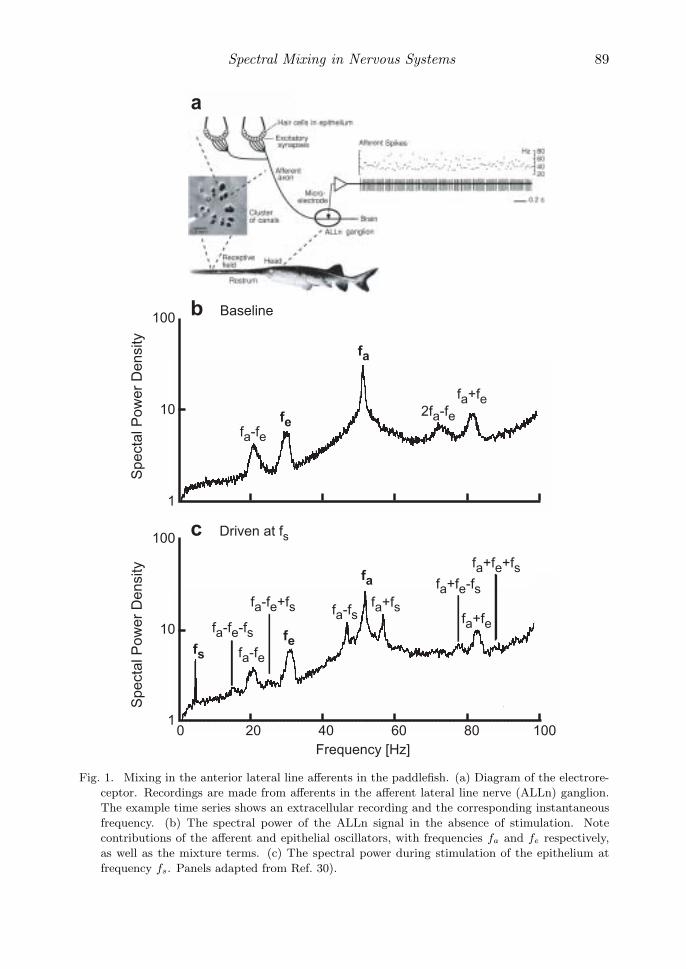
The sense organ of the paddlefish Polyodon Spathula, a species of electric fish,consists of electroreceptors that cover the animal’s rostrum, a flat structure thatprojects from the head (Fig. 1(a)). Neiman and Russell30) demonstrate that thiselectroreceptor system contains two distinct oscillators. One oscillator exists withina cluster of canals in the epithelia of the sensor and produces oscillations in the rangeof 10 to 30 Hz. The second oscillator arises from the axon terminals and producesan oscillation in the range of 30 to 70 Hz.
The authors made extracellular recordings from the anterior lateral line nerve(ALLn) (Fig. 1(a)), reporting spiking from a single sensory cell. Their recordingscontained rhythmic contributions from both the epithelium, with frequency fe, andfrom the afferents, with frequency fa (Fig. 1(b)). Critically, the authors found mix-ture terms at frequencies fa + fe, fa − fe, and 2fa − fe. Introduction of a sinu-soidal external stimulus, with frequency fs, led to mixing among all three oscillators(Fig. 1(c)). The authors note that this behavior is consistent with mixing of the os-cillators, although they prefer an explanation based on synaptic modulation of oneoscillator by the other.
2.3. Rat somatosensation
The somatosensory cortex in rat has a prominent region, known as the vib-rissa primary somatosensory (S1) cortex, that is devoted to the processing of tac-tile stimuli from the animal’s large facial whiskers, or vibrissae (Fig. 2(a)). Ratsmove their vibrissae in 5 to 15 Hz exploratory movements and such moving sen-sors pose a sensory challenge: the spatial meaning of a contact event dependson its phase relative to the oscillating vibrissa position. A plausible model32) forthis problem approximates the position and touch signals as sinusoids, i.e., Motion∝ 1 + cos(2πfmotiont− φmotion), where φmotion is the preferred phase of a given neu-ron31) and Contact ∝ 1 + cos[2πfmotion(t − tcontact)] + higher-order terms,∗) wheretcontact is the time of contact. Spectral mixing of these two signals leads to anoutput that contains the phase difference term cos(2πfmotiontcontact − φmotion), as
∗) Higher order terms are needed here to enforce causality, as a periodic touch signal cannot be
symmetric about tcontact.
Spectral Mixing in Nervous Systems 89
0 20 40 60 80 1001
10
100
100
10
1
Frequency [Hz]
Spe
ctal
Pow
er D
ensi
tyS
pect
al P
ower
Den
sity
b Baseline
c Driven at fs
fs
fa-fe
fa
fe
fa+fe2fa-fe
fa-fe
fa
fefa+fe
fa+fsfa-fsfa-fe+fs
fa-fe-fs
fa+fe+fsfa+fe-fs
a
Fig. 1. Mixing in the anterior lateral line afferents in the paddlefish. (a) Diagram of the electrore-
ceptor. Recordings are made from afferents in the afferent lateral line nerve (ALLn) ganglion.
The example time series shows an extracellular recording and the corresponding instantaneous
frequency. (b) The spectral power of the ALLn signal in the absence of stimulation. Note
contributions of the afferent and epithelial oscillators, with frequencies fa and fe respectively,
as well as the mixture terms. (c) The spectral power during stimulation of the epithelium at
frequency fs. Panels adapted from Ref. 30).
90 D. Kleinfeld and S. B. Mehta
discussed in the introduction above. If this term is isolated, the resulting spike ratewill be highest when contact occurs at particular phase relative to vibrissa motion;preliminary data provides evidence for such a signal in behaving animals.33)
an external stimulus with frequency fs was turned on at time zero.In our laboratory, Ahrens et al.34) studied the underlying computation by intro-
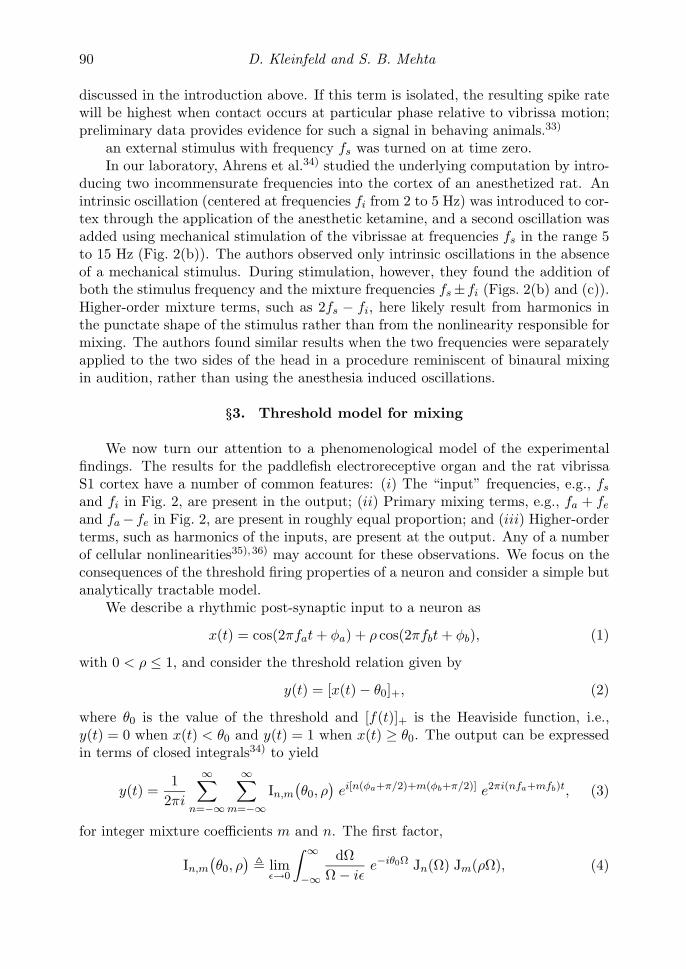
ducing two incommensurate frequencies into the cortex of an anesthetized rat. Anintrinsic oscillation (centered at frequencies fi from 2 to 5 Hz) was introduced to cor-tex through the application of the anesthetic ketamine, and a second oscillation wasadded using mechanical stimulation of the vibrissae at frequencies fs in the range 5to 15 Hz (Fig. 2(b)). The authors observed only intrinsic oscillations in the absenceof a mechanical stimulus. During stimulation, however, they found the addition ofboth the stimulus frequency and the mixture frequencies fs±fi (Figs. 2(b) and (c)).Higher-order mixture terms, such as 2fs − fi, here likely result from harmonics inthe punctate shape of the stimulus rather than from the nonlinearity responsible formixing. The authors found similar results when the two frequencies were separatelyapplied to the two sides of the head in a procedure reminiscent of binaural mixingin audition, rather than using the anesthesia induced oscillations.
§3. Threshold model for mixing
We now turn our attention to a phenomenological model of the experimentalfindings. The results for the paddlefish electroreceptive organ and the rat vibrissaS1 cortex have a number of common features: (i) The “input” frequencies, e.g., fs
and fi in Fig. 2, are present in the output; (ii) Primary mixing terms, e.g., fa + fe
and fa −fe in Fig. 2, are present in roughly equal proportion; and (iii) Higher-orderterms, such as harmonics of the inputs, are present at the output. Any of a numberof cellular nonlinearities35),36) may account for these observations. We focus on theconsequences of the threshold firing properties of a neuron and consider a simple butanalytically tractable model.
We describe a rhythmic post-synaptic input to a neuron as
x(t) = cos(2πfat + φa) + ρ cos(2πfbt + φb), (1)
with 0 < ρ ≤ 1, and consider the threshold relation given by
y(t) = [x(t) − θ0]+, (2)
where θ0 is the value of the threshold and [f(t)]+ is the Heaviside function, i.e.,y(t) = 0 when x(t) < θ0 and y(t) = 1 when x(t) ≥ θ0. The output can be expressedin terms of closed integrals34) to yield
y(t) =1
2πi
∞∑n=−∞
∞∑m=−∞
In,m
(θ0, ρ
)ei[n(φa+π/2)+m(φb+π/2)] e2πi(nfa+mfb)t, (3)
for integer mixture coefficients m and n. The first factor,
In,m
(θ0, ρ
) lim
ε→0
∫ ∞
−∞
dΩΩ − iε
e−iθ0Ω Jn(Ω) Jm(ρΩ), (4)

Spectral Mixing in Nervous Systems 91
1050
Depth[µm]
150250350450550650750850950
11501250135014501550
aaa
Time after Stimulus Onset [s]
-2 -1 0 1 2
No Stimulation fs = 8.0 Hz
Spe
ctra
l Pow
er D
ensi
ty in
CS
D
No Stimulation
Frequency [Hz]0 10 20
c
Current Source Density, CSD Power in CSD [log scale]fs - fi
3fs2fsfsfi
Frequency [Hz]
0 5 10 15 20 25
2fi
No Stimulationfi 2fi 3fi
fifs
2fi
fs-fi2fs 3fsfs
2fs3fs
1
10-2
10-4
10-2
10-4
1
10-2
10-4
1
10-2
10-4
Frequency [Hz]0 10 20
fs = 8.0 Hz fs = 8.0 Hzfs+fi
2fs+fi
fs + fi
fi
fifs-fi fs+fi
Spe
ctra
l Pow
er D
ensi
ty in
CS
D
b
Vibrissa Motion
Fig. 2. Mixing in the vibrissa primary sensory cortex from rat. (a) Cartoon showing the vibrissae
and their axis of motion. (b) Example recordings from different depths in vibrissa S1 cortex.
The data on the left are time series of the the current source density (CSD), which is the discrete
second derivative of the measured voltage and approximates the divergence of current flow (scale
bar 10 mV/mm2). An external stimulus with frequency fs was turned on at time zero. The
panel on the right shows the spectral power for the same depths during stimulation. Note the
presence of mixture frequencies fs ± fi. (c) The spectral power before (top panels) and after
(bottom panels) stimulation at a depth of 450 µm. Higher order mixture terms and harmonics
due to the non-sinusoidal nature of both intrinsic and stimulus-induced oscillations give rise to
the peaks indicated by gray text. Gray bands correspond to 95% confidence intervals. Panels
(b) and (c) adapted from Ref. 34).

92 D. Kleinfeld and S. B. Mehta
0 5 10 15 20 25
1
10-2
10-4
0
1
Time
2.0
-2.0
0
fa = 5 Hz and fb = 8 Hz
Frequency [Hz]
fb af- fb af+fbaf
Input = cos(2πfat) + cos(2πfbt)
Output = [Input - θo]+
Time1 s
Spectral PowerDensity of Output
θo
Fig. 3. Threshold mixer example. The top panel shows the summed input signals and threshold
level θ0 (gray band). The middle panel shows the result of applying the transformation in Eq. 2
to the input. The bottom panel shows the power spectrum computed from a 10 sec output
time series. The gray band here indicates approximately one decade below the power of the
fundamentals. Parameters were set to ρ = 1.0, fa = 5 Hz, fb = 8 Hz, and θ0 = 0.8. Panels
adapted from Ref. 34).
is an integral over Bessel functions that sets the magnitude of each mixture term,and must, in general, be evaluated numerically. The second factor sets the phaseof each term in the sum and the final factor represents a sinusoid at one of themixing frequencies, |mfa ± nfb|. We recall that Jk(Ω) = (−1)kJ−k(Ω), so thatIn,−m
(θ0, ρ
)= (−1)mIn,m
(θ0, ρ
)and sum and difference terms of the same order
have equivalent magnitudes. The spectral representation for the output of the modelis given by
y(f) ∫ ∞
−∞e2πifty(t) dt
=1
2πi
∞∑n=−∞
∞∑m=−∞
In,m
(θ0, ρ
)ei[n(φa+π/2)+m(φb+π/2)] δ[f − (nfa + mfb)],
(5)
where δ() is the Dirac delta function. We see that y(f) has contributions at allpossible mixture frequencies. Numerical calculations show that the magnitude ofthe I1,±1
(θ0, ρ
)terms, and thus the spectral power in the sum and difference modes,
is maximized for ρ = 1.0 and θ0 = 0.8.34) An example of the threshold process andresulting power spectrum is shown for these parameters in Fig. 3.

Spectral Mixing in Nervous Systems 93
§4. Multi-stage mixers for isolation of spectral components
The output from the threshold-based mixer contains components at the fun-damental frequencies, their harmonics, the sum and difference mixture terms, andhigher order mixtures. In principle, a band-pass filter could be used to isolate oneof these components. This method is limited, however, as the frequencies of neigh-boring components may be close to each other in value. An alternative method usesinterference effects in a manner analogous to the structure of image-reject mixersin communications engineering.37) The inputs to two or more threshold units arephase-shifted and the outputs summed, in such a way that undesired componentscancel. This requires that we introduce additional circuit elements that can shiftthe phase of each of the two inputs. Although a simple delay line could accomplishthis for a fixed frequency, we describe next a solution that works over a range offrequencies.
4.1. Phase shifters
We first consider the special but useful cases of shifts of φ = π radians, φ = π/2radians, and φ = −π/2 radians.
Phase shifting by a factor of π radians can be accomplished with a fast inhibitorysynapse, so that the corresponding post-synaptic input to the threshold unit is neg-ative going rather than positive going (Fig. 4(a)). Then,
φoutput = φinput + π, (6)
corresponding to inversion of the signal.A phase shift of π/2 radians arises naturally in the neuronal implementation
of a phase-locked loop (PLL),38)–41) which is a feedback circuit that adjusts thefrequency of a local oscillator to match that of an input signal.42) A generic analogPLL consists of three components. First, a mixer multiplies the input oscillator bythe output of a local oscillator. Second, a low-pass filter K(t) isolates the error term,ε(t), where
ε(t) ∝∫ t
−∞dτ K(t − τ) cos(2πfinputτ + φinput) cos(2πflocalτ + φlocal − π/2).
Third, the frequency of the local oscillator is shifted so that flocal = f0 +gε(t), wheref0 is a center frequency and g is a gain factor. When the PLL locks, flocal ≈ finput
and ε(t) ∝ sin(φinput − φlocal).Self-consistency requires that the measured phase, φout, at the output of a locked
PLL is of the approximate form
φout ≈ φinput +π
2+ sin−1
(finput − f0
G
), (7)
where the constant G is proportional to the gain factor g.∗) The local oscillator andthe input will tend to be π/2 radians out of phase when either the gain g, and thus
∗) The factor of π/2 is commonly implicit in textbook formulas, as the local oscillator is described
by a sine function while the external input is given as a cosine. This factor was inadvertently dropped
in Eq. (10) of Ref. 41).

94 D. Kleinfeld and S. B. Mehta
Mixer LocalOscillator
Low Pass Filter, K(t)
Input × Local Oscillator
Loop Gain, g
Input
Error signal, ε(t)
Output
cos(2πfinputt)cos(2πfinputt - π/2)
Input Output
cos(2πfinputt)cos(2πfinputt - π)
InhibitoryCell
a
b
= - cos(2πfinputt)
= sin(2πfinputt)
Fig. 4. Phase shifter circuits. (a) Shift of π radians via an inhibitory interneuron that functions as
an inverting but otherwise linear input-output device. (b) Shift of π/2 radians with a phase-lock
loop that consists of 3 neurons: one operating as a mixer, one acting as a low-pass filter, and
an oscillator whose frequency is a monotonically increasing function of its input.
the constant G, is large or the input frequency finput is close to the intrinsic frequencyf0. Intuitively, the shift of π/2 radians occurs because for a PLL at steady-state,the product of the input sinusoid and the local oscillator must average to zero whenthe PLL is at steady-state.
With the above results, we note that a phase shift of −π/2 is readily achievedby following a phase shift of π/2 (Eq. (7)) with an inversion (Eq. (6)).
4.2. A circuit to isolate the difference frequency
We use a mixer in combination with phase shifters of π and ±π/2 radians to con-struct outputs that differ only in the phase term expi[n(φa + π/2) + m(φb + π/2)]from Eqs. (3) and (5). The phase shifts are chosen so that summation of the out-puts leads to a cancellation of the input sinusoids, their harmonics, and the sumfrequency, as in an image-reject mixer.37)
As a step toward the design of the difference circuit, we first consider the can-cellation of the fundamental frequencies. We start with two inputs of equal ampli-tude, labeled a and b, and two threshold units, labeled 1 and 2. We then define

Spectral Mixing in Nervous Systems 95
cos(2πfa +φa,1), as the input a, phase-shifted by φa,1, to threshold unit 1; analogousexpressions apply for all combinations of inputs and outputs. From the phase termabove, we find that the output at each input frequency, corresponding to mixtureterms (n = 1, m = 0) and (n = 0, m = 1), is simply phase-shifted by π/2 relative tothe input. We thus choose, e.g.,
φa,1 = 0 and φb,1 = π,
φa,2 = π and φb,2 = 0,
with the result that the output terms for the fundamentals cancel when summed.The summed output, Y (t) = y1(t) + y2(t), is given by
Y (t) =i
πI0,0
(θ0, 1
) − i
π
cos[2π(fa + fb)t] + cos[2π(fa − fb)t]
I1,1
(θ0, 1
)+O(|n| + |m| > 2). (8)
Apart from the constant term, the output is similar to that for multiplication.We now move to the case of maintaining only the primary difference term. In
principle, this can be done with three mixers and phase shifts of φ = 0, +2π/3 and−2π/3 radians, but such shifts are difficult to generate. We consider an alternativescheme with four threshold units, where the phase of the input to each unit is givenby
φa,1 = 0 and φb,1 = π,
φa,2 = π and φb,2 = 0,
φa,3 = +π/2 and φb,3 = −π/2,
φa,4 = −π/2 and φb,4 = +π/2.
The summed output, Y (t) = y1(t) + y2(t) + y3(t) + y4(t), is then
Y (t) =2i
πI0,0
(θ0, 1
)+
4i
πcos[2π(fa − fb)t] I1,1
(θ0, 1
)+ O(|n| + |m| > 2). (9)
The difference circuit is illustrated schematically in Fig. 5(a), together with thecalculated results for the spectral power density for the choices fa = 8 Hz and fb = 5Hz (Fig. 5(b)), demonstrating that the fundamentals are almost entirely suppressed.
We note that a straightforward modification of this circuit will preserve the sumrather than the difference terms.
§5. Discussion
Spectral mixing is an integral aspect of electronic communication, as it providesa means to detect and isolate specific frequency components. Certain designs, suchas double-balanced mixers and image-reject mixers, exploit the summation of phase-shifted replicas to cancel out designated terms, much as interference effects are usedto direct radio signals from antenna arrays and to produce patterned illuminationin optics. It is of interest that despite the central role played by oscillators in ner-vous systems, analogies to these spectral mixers have not been identified in vivo.

96 D. Kleinfeld and S. B. Mehta
θ0
xa(t) = cos(2πfat)
θ0
θ0
θ0
PhaseShifters
ThresholdMixers
Summed Output
Σ
Y(t)∝cos[2π(fa-fb)t]
Spe
ctra
l Pow
er
1 10 100Frequency [Hz]
fafbfa - fb
0.001
0.01
0.1
1
0.0001
π
π
π/2−π/2
−π/2
π/2
Inputs
+ higher order terms
InputOutput
a
b
y2(t)
y1(t)
y4(t)
y3(t)
xb(t) = cos(2πfbt)
Fig. 5. Neuronal image-reject mixer circuit. (a) Schematic of the circuit, which consists of phase-
shifters of π, π/2 and −π/2 radians (Eqs. (6) and (7)), threshold units that act as mixers
(Eq. (5)), and a linear summation element. (b) Spectral analysis of the output of the mixer
circuit in Eq. (9) for input sinusoids with fa = 8 Hz and fb = 5 Hz, and where θ0 = 0. The
gray band indicates the power in the largest of the higher-order components.
Given the presence of mixing terms in the experiments cited above, it is temptingto conjecture that spectral mixing plays a role in neuronal computations. We thusattempted here to demonstrate an implementation that is biologically plausible, al-though experimental evidence for a neuronal implementation of a PLL is admittedlyweak.
As a technical issue, one weakness of our scheme is the need for constant phaseshifts over a broad range of frequencies. We choose to use phase-locked loops, acommon element in communication and control circuits,42) but even these engineer-ing implementations have limitations. Locking will not occur if the loop gain is toosmall, while a PLL will lock to a harmonic if the loop gain is too large. In engineer-
Spectral Mixing in Nervous Systems 97
ing applications, the latter issue typically limits the useful frequency range of a PLLin the absence of additional circuitry. For example, initial locking may require thatthe intrinsic frequency be swept, starting near f0 = 0, so that locking occurs at thefundamental.
Our focus has been on mixing to form the difference and sum terms fa±fb, whichare prevalent in the experimental data summarized here. Other mixing terms are alsoof potential interest, however, such as a 2fa−fb term that arises in psychoacoustics.43)
Although these terms can be generated by spectral mixing, alternative formulationsare possible. For example, mixing terms can also arise if one oscillator directlyprovides synaptic modulation to another,30) rather than two oscillators summing ina third threshold unit. As an example of such a system, and as a closing nod to theKuramoto model, we consider a system of two phase oscillators with unidirectionalcoupling:
dφ
dt= 2π
[f0 + K sin(2πfdt − φ)
], (10)
where φ(t) is the phase of the driven oscillator, f0 is its intrinsic frequency, fd is thefrequency of the driving oscillator, and K is the coupling strength.
The dimensionless ratio K/|f0 − fd| determines the behavior of this system. Ifthis ratio is smaller than one, the driven oscillator will not entrain to the drive andinstead undergoes phase walk-through.44) In this case, we obtain an explicit solutionfor φ(t) as
φ(t) = 2πfdt
−4π tan−1
K+
√(f0−fd)2 − K2 tan
[12
√(f0−fd)2 − K2(t + C)
]f0−fd
,
(11)
where C is a constant. A sinusoidal oscillator with this phase can be shown tocontain spectral components at frequencies given by fd ± m
√(f0−fd)2 − K2, for
integer m. In the limit that K |f0 − fd|, the driven oscillator has power atfrequencies fd, f0, 2f0−fd, f0−2fd, · · · , demonstrating another plausible route togenerating nonlinear mixing terms from the interaction of neuronal oscillators.
Acknowledgements
We thank the NIMH (DK), the NCRR (DK), and the HHMI (SBM) for support.
References
1) J. R. Gibson, M. Beierlein and B. W. Connors, J. Neurophys. 93 (2005), 467.2) D. Hansel, G. Mato and C. Meunier, Europhys. Lett. 23 (1993), 367.3) C. von der Vreeswijk, L. F. Abbott and G. B. Ermentrout, J. Comput. Neurosci. 4 (1994),
313.4) Y. Kuramoto, Chemical Oscillations, Waves and Turbulence (Springer Verlag, New York,
1984).5) G. B. Ermentrout and D. Kleinfeld, Neuron 29 (2001), 1.6) K. R. Delaney, A. Gelperin, M. S. Fee, J. A. Flores, R. Gervais, D. W. Tank and D. Kle-
infeld, Proc. Natl. Acad. Sci. 91 (1994), 669.

98 D. Kleinfeld and S. B. Mehta
7) G. B. Ermentrout, J. Flores and A. Gelperin, J. Neurophys. 79 (1998), 2677.8) R. W. Friedrich, C. J. Habermann and G. Laurent, Nature Neurosci. 7 (2004), 862.9) J. C. Prechtl, L. B. Cohen, P. P. Mitra, B. Pesaran and D. Kleinfeld, Proc. Natl. Acad.
Sci. 94 (1997), 7621.10) X. Huang, W. C. Troy, Q. Yang, H. Ma, C. R. Laing, S. J. Schiff and J. Y. Wu, J. Neurosci.
24 (2004), 9897.11) H. G. Schuster and P. Wagner, Biol. Cybernetics 64 (1990), 77.12) H. G. Schuster and P. Wagner, Biol. Cybernetics 64 (1990), 83.13) H. Sompolinsky, D. Golomb and D. Kleinfeld, Phys. Rev. A 43 (1991), 6990.14) E. R. Grannan, D. Kleinfeld and H. Sompolinsky, Neural Computation 5 (1993), 550.15) C. M. Gray, P. Konig, A. K. Engel and W. Singer, Nature 338 (1989), 334.16) O. Shriki, D. Hansel and H. Sompolinsky, Neural Computation 15 (2003), 1809.17) B. Ermentrout, Neural Computation 6 (1994), 679.18) H. R. Wilson and J. D. Cowan, Biophys. J. 12 (1973), 1.19) J. J. Hopfield, Proc. Natl. Acad. Sci. 79 (1982), 2554.20) D. J. Amit, Modeling Brain Function: The World of Attractor Neural Networks (Cam-
bridge University Press, Cambridge, 1989).21) G. Oster, Scientific American 229 (1973), 94.22) T. H. Bullock and W. Heiligenberg, Electroreception (Wiley, New York, 1987).23) W. Heiligenberg and G. Rose, J. Neurosci. 5 (1985), 515.24) N. Suga, Y. Zhang and J. Yan, J. Neurophys. 77 (1997), 2098.25) D. J. Levitin and S. E. Rogers, Trends in Cognitive Science 9 (2005), 26.26) J. L. Pena and M. Konishi, Science 292 (2001), 249.27) J. L. Pena and M. Konishi, J. Neurosci. 24 (2004), 8907.28) E. Ahissar and D. Kleinfeld, Cerebral Cortex 13 (2003), 53.29) D. Regan and M. P. Regan, Vision Reserach 27 (1987), 2181.30) A. B. Neiman and D. F. Russell, J. Neurophys. 92 (2004), 492.31) M. S. Fee, P. P. Mitra and D. Kleinfeld, J. Neurophys. 78 (1997), 1144.32) S. B. Mehta and D. Kleinfeld, Neuron 41 (2004), 181.33) J. Curtis and D. Kleinfeld, in Barrels XVIII (2005).34) K. F. Ahrens, H. Levine, H. Suhl and D. Kleinfeld, Proc. Natl. Acad. Sci. 99 (2002), 15176.35) C. Koch and T. Poggio, in Single Neuron Computation, ed. T. McKenna, J. Davis and S.
E. Zornetzer (Wiley, New York, 1992).36) F. Gabbiani, H. G. Krapp, N. Hatsopoulos, C. H. Mo, C. Koch and G. Laurent, J. Physi-
ology (Paris) 98 (2004), 19.37) P. Horowitz and W. Hill, The Art of Electronics (Cambridge University Press, Cambridge,
1989).38) E. Ahissar and E. Vaadia, Proc. Natl. Acad. Sci. 87 (1990), 8935.39) E. Ahissar, Neural Computation 10 (1998), 597.40) F. C. Hoppensteadt, An Introduction to the Mathematics of Neurons. Modeling in the
Frequency Domain (Cambridge University Press, Cambridge, 1997).41) D. Kleinfeld, R. N. S. Sachdev, L. M. Merchant, M. R. Jarvis and F. F. Ebner, Neuron 34
(2002), 1021.42) R. E. Best, Phase-Locked Loops: Theory, Design, and Applications (McGraw-Hill, New
York, 1984).43) W. M. Hartmann, Signals, Sound, and Sensation (American Institute of Physics, Wood-
bury, 1997).44) G. B. Ermentrout and J. Rinzel, Am. J. Physiol. 246 (1984), R102.