Embed Size (px)
Citation preview

Spectra1) Excitation Spectrum – fluorescence or
phosphorescence intensity (at fixed λ) as a function of excitation λ or absorption λ
2) Fluorescence Emission Spectrum -fluorescence emission intensity vs. λ for a fixed excitation λ (= absorption λ, max.)
3) Phosphorescence Emission Spectrum –phosphorescence emission intensity vs. λ for a fixed excitation λ (= absorption λ, max.)

PhenanthreneSpectra
Excitation Fluorescence Phosphorescence

Fluorescence and Phosphorescence spectra are at longer λ’s because the transition ∆from S1 � So or G is smaller than the absorption ∆ from So (G) to some upper vibrational level of S1
Degree of structure in fluorescence spectrum is due to the degree of solvation as discussed for absorption
The rigidity of the phenanthrene molecule and its inherent lack of interaction with the solvent also plays a role in spectrum

Spectra4) Excitation Emission Matrix (EEM) or
Total Luminescence Spectrum – 3D plot of emission for all possible combinations of excitation λ and emission λ
FluorescenceEmissionIntensity
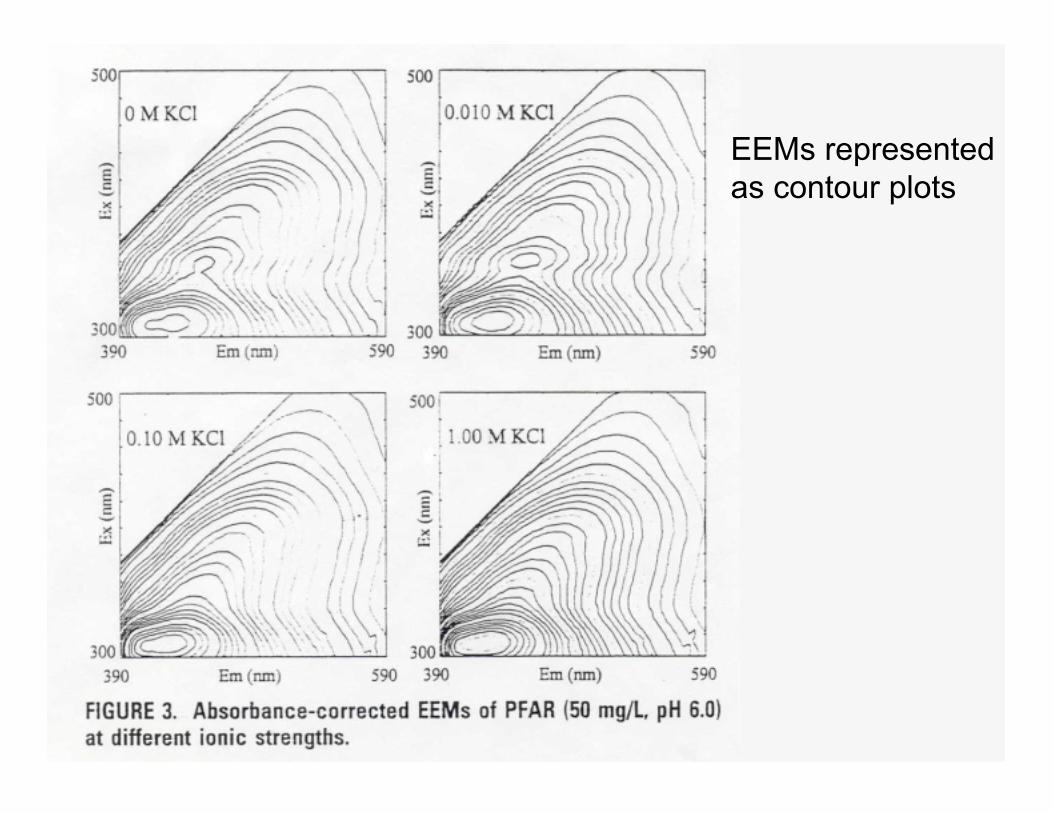
EEMs representedas contour plots

Spectra5) Synchronous Scan Spectrum – record
fluorescence intensity while scanning both excitation and emission λ, usually at a constant offset (∆λ)
Synchronousscans of naturalorganic matterwith ∆λ = 25 nmat pH 4 & 9 (solidline)

Fluorescence Efficiency or Quantum Yield (ФF)
Number of photons emittedФF = -------------------------------------------
Number of photons absorbed
Fluorescence efficiency depends on the rate offluorescence relative to the rates of otherprocesses involving excited state deactivation
KF 1ФF = ----------------------- KF = ----
KF + KIC + KIS τF
rate of fluorescence
rate of radiationlessdeactivation or internal conversion
rate of intersystemcrossing fluorescence
lifetime

Clearly anything that affects any of the rates involved in photophysical processes will affect ΦF
e.g. temperature increases cause a decrease in ΦF � higher temp increases KIC which reduces ΦF, KF doesn’t vary significantly with temp
KF ФF = -----------------------KF + KIC + KIS
Heating of solutions can be a problem with intense sources

Relationship between fluorescence intensity and concentration
IF = KΦF (Io – I)
Substitute Beer’s Lawlog Io/I = εbC or I = Ioe-εbC
ResultIF = K ΦF Io (1 - e-εbC)
IF = K ΦF Io ε b C
Fluorescence intensity
Instrumental factorFluorescence quantum efficiency
Incident light intensity
Transmitted light intensityemerging from sample
unabsorbed
This term in parenthesesresults in a seriesexpansion of the form(2.3 ε b C)n where---------------- + …n! n = an
integerincreasingfrom 1
For εbC (i.e. A) < 0.05terms past the firstAre dropped giving
Note dependence on ΦF, Io, ε, b

Inner Filter Effects – if the absorbance of the sample is above 0.05, fluorescence intensity is decreased in two ways:
1) Primary Inner Filter Effect – excitation energy is decreased by absorption at the λof excitation which decreases fluorescence
2) Secondary Inner Filter Effects – emitted fluorescence is absorbed by the sample at the emission λ which also reduces the amount of fluorescence measured

Primary Inner Filter EffectAt high ε b C
The front part of the cell is illuminated more efficiently than the back part � get less fluorescence from the back part of the cell
Incident Beam Io
Sample Cuvette
TransmittedBeam I
RepresentsAbsorptioni.e. inner filter effect

Inner Filter Effects – conclusions- Inner filtering results in curved calibration
curves- Must know or measure absorbance at both
the excitation and emission wavelengths- Fluorescence is basically a trace technique
having 1 - 3 orders of magnitude lower detection limits than absorbance
- Upper limit of fluorescence occurs around lower limit of absorbance (complimentary)
- Inner filtering is also called quenching

Excited State Chemistry – it should be recognized that an electronic excited state is a distinct chemical entity with its own chemical properties
Sometimes fluorescence & phosphorescence emission are complicated by things that the excited states do, e.g.:
1) Chemical Reactions – the excited state can undergo chemical reactions that the ground state can’t, e.g. dyes fade in sunlight � this is photochemistry �

In chemical analysis, photodecomposition is a serious problem – rate of photo-decomposition is proportional to number of excited states, i.e. source intensity
2) Acid-Base Chemistry – Ka for excited singlet state can differ by as much as 106
from Ka for ground statee.g. Phenol ground state pKa = 10.0
excited singlet pKa = 4.00At pH’s between 4 & 10 you see fluorescence
characteristics of phenolate anion = good way to study excited state chemistry

Effects of other solutes on excited state emission � can promote radiationlessreturn to ground state = quenching
1) Energy Transfer1A* + Q � A + 1Q*
or 1A* + Q � 1{AQ}*Occurs by
a) Q absorbs the emission of Ab) Collisional non-radiative transfer of energy � obeys Stern-Volmer Law
Where A = Analyte(species of interest)which absorbs andQ = quencher1A* & 1Q* designatefirst excited singlet& 1{AQ}* = complex
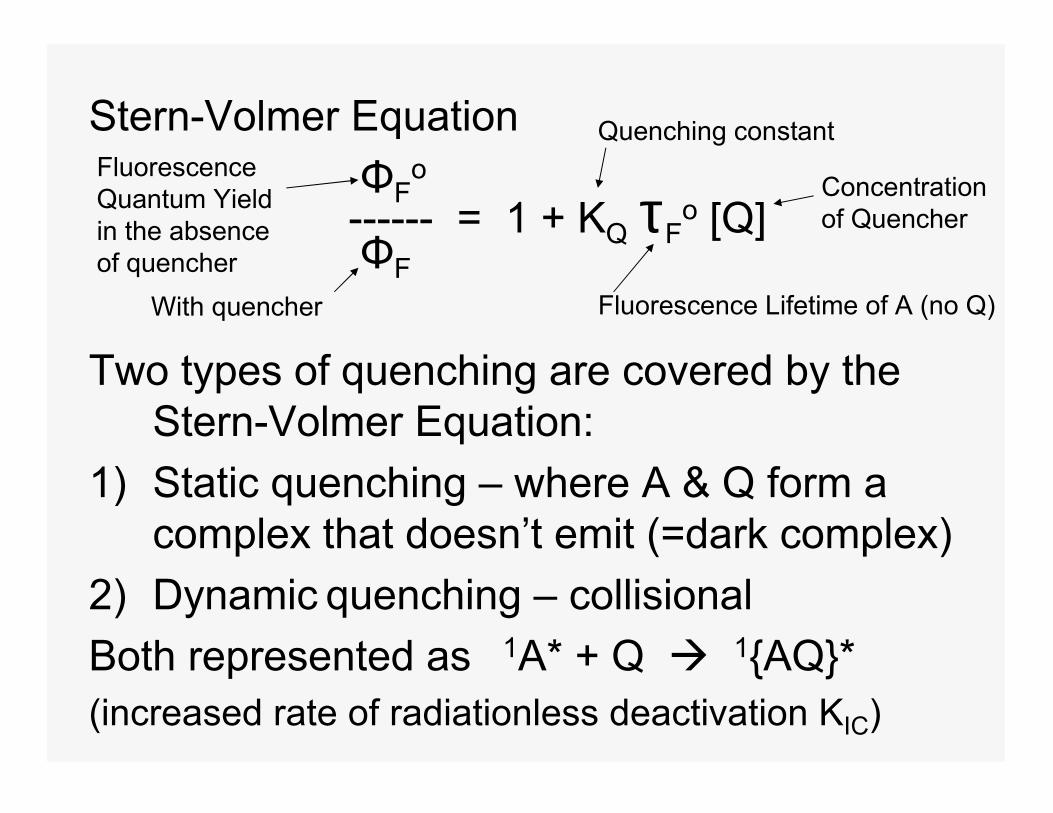
Stern-Volmer EquationΦF
o
------ = 1 + KQ τFo [Q]
ΦF
Two types of quenching are covered by the Stern-Volmer Equation:
1) Static quenching – where A & Q form a complex that doesn’t emit (=dark complex)
2) Dynamic quenching – collisionalBoth represented as 1A* + Q � 1{AQ}*(increased rate of radiationless deactivation KIC)
FluorescenceQuantum Yieldin the absenceof quencher
With quencher
Quenching constant
Fluorescence Lifetime of A (no Q)
Concentrationof Quencher

Fluorescence Quenching of Fulvic Acid, Q = Cu2+
Hays, 1996
Emission scans of 15 mg/LFulvic Acid with varying [Cu2+]and excitation at 340 nm


1:1 Complex Formation
M + L = ML
[ML]K = -------------
[M] [L]
Where M = metal ion; L = ligand; ML = complex

Equations for Fitting Data

Fluorescence Quenching Curves
Hays, 1996
15 mg/L of Fulvic Acid withvarying Cu(II) concentrationsat pH 5 (o), 6 (∇∇∇∇ ) & 7 (��������
Added Copper Concentration (M x105)
Rel
ativ
e Fl
uore
scen
ce In
tens
ity
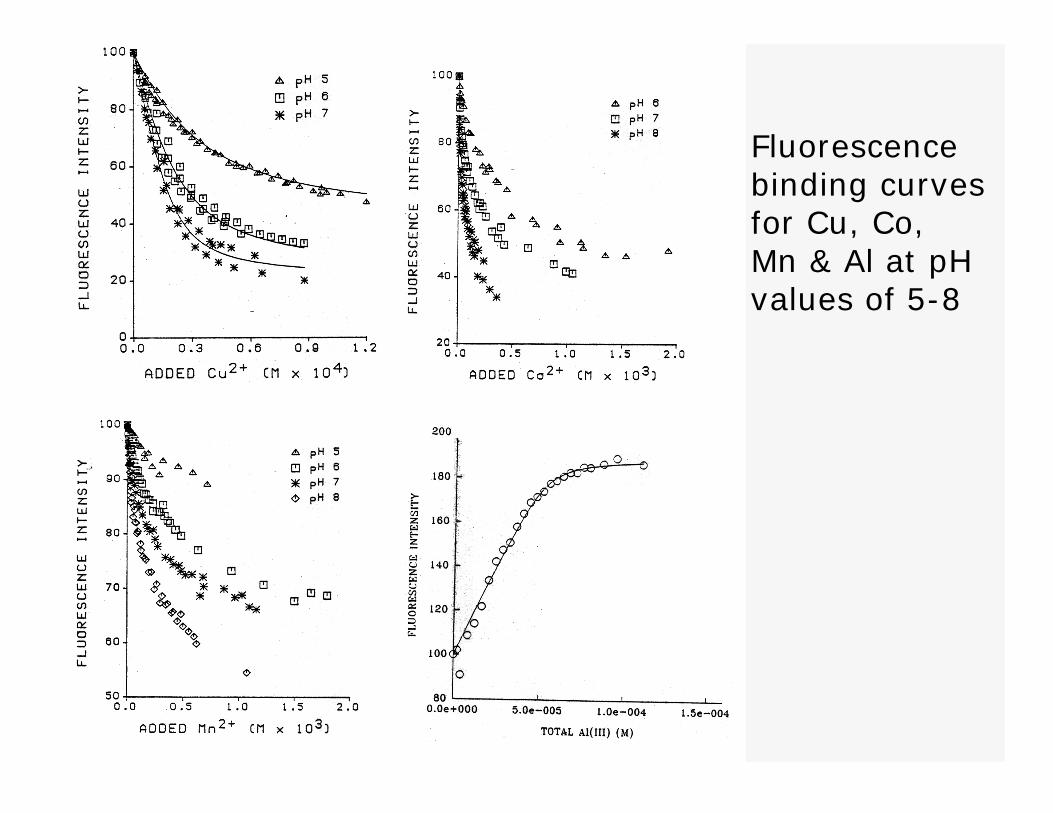
Fluorescencebinding curvesfor Cu, Co,Mn & Al at pHvalues of 5-8
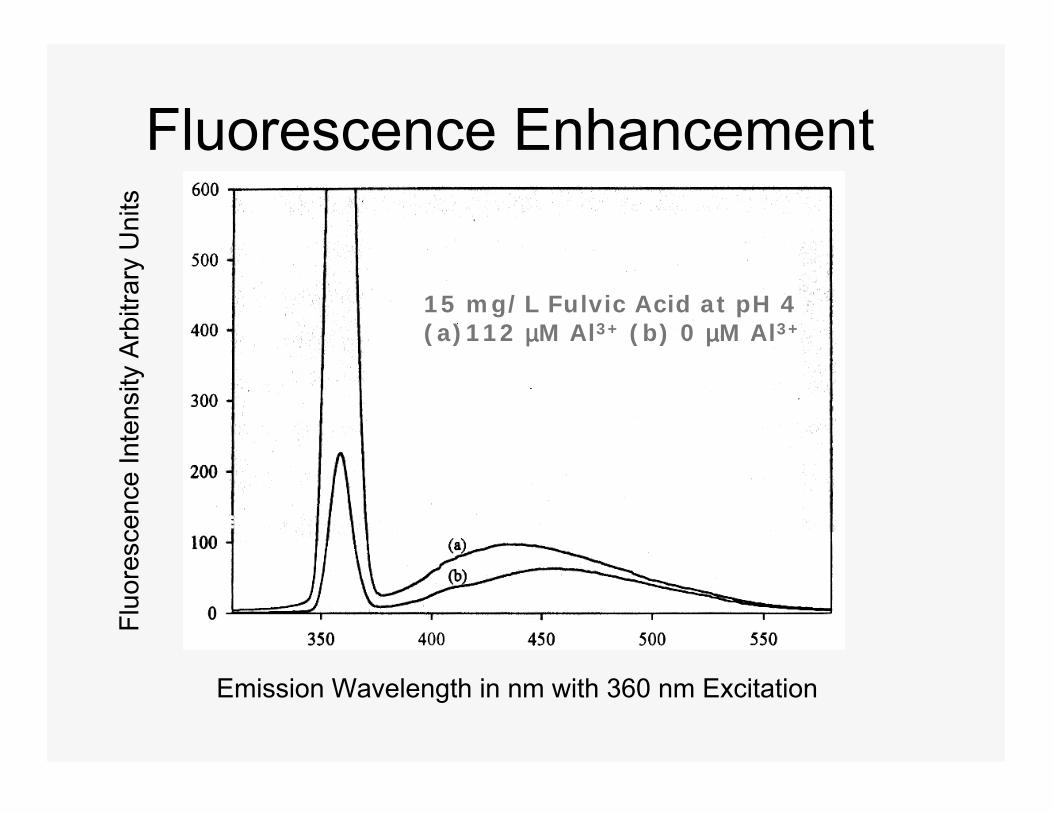
Fluorescence Enhancement
15 mg/L Fulvic Acid at pH 4(a)112 µµµµM Al3+ (b) 0 µµµµM Al3+
Emission Wavelength in nm with 360 nm Excitation
Fluo
resc
ence
Inte
nsity
Arb
itrar
y U
nits

Fluorescence Enhancement
15 mg/L Fulvic Acid at pH 4(a)112 µµµµM Al3+ (b) 0 µµµµM Al3+
Emission Wavelength in nm with 340 nm Excitation
Fluo
resc
ence
Inte
nsity
Arb
itrar
y U
nits

Excitation Emission Matrix
15 mg/L FulvicAcid at pH 4with no Al(III)

Excitation Emission Matrix
15 mg/L FulvicAcid at pH 4with Al(III)

Fluorescence Enhancement Curvewith One-Site Model
15 mg/L of Fulvic Acidwith increasing Al(III)concentrations at pH 4 (o)
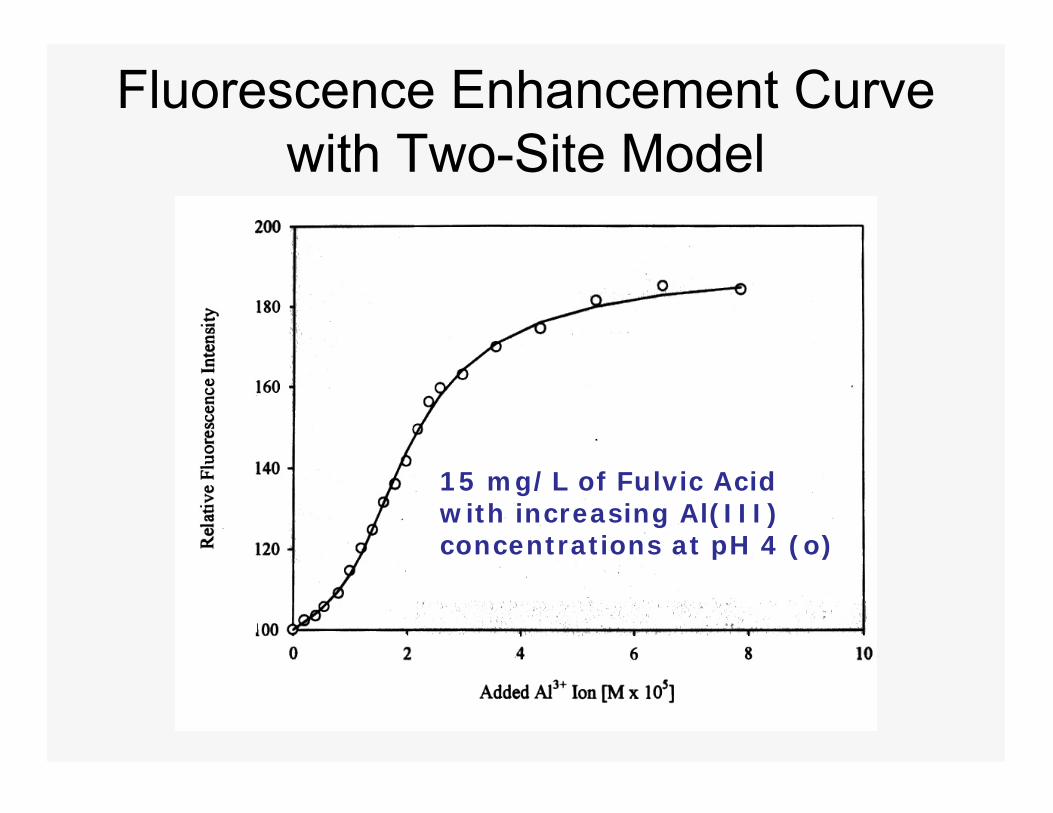
Fluorescence Enhancement Curvewith Two-Site Model
15 mg/L of Fulvic Acidwith increasing Al(III)concentrations at pH 4 (o)

Individual Fluorescence IntensitiesMaking Up the Overall “I”
I = IL1 + IML1 + IL2 + IML2