Embed Size (px)
Citation preview
ORIGINAL ARTICLE
doi:10.1111/j.1558-5646.2011.01501.x
SPECIFIC INTERACTIONS BETWEEN HOSTAND PARASITE GENOTYPES DO NOT ACT ASA CONSTRAINT ON THE EVOLUTION OFANTIVIRAL RESISTANCE IN DROSOPHILAJennifer A. Carpenter,1,2 Jarrod D. Hadfield,1 Jenny Bangham,1,3 and Francis M. Jiggins1,4
1Institute of Evolutionary Biology, University of Edinburgh, West Mains Rd, Edinburgh EH9 3JT, United Kingdom2E-mail: [email protected]
3Department of History and Philosophy of Science, University of Cambridge, Free School Lane, Cambridge CB2 3RH,
United Kingdom4Department of Genetics, University of Cambridge, Downing Street, Cambridge CB2 3EH, United Kingdom
Received August 20, 2010
Accepted September 27, 2011
Genetic correlations between parasite resistance and other traits can act as an evolutionary constraint and prevent a population
from evolving increased resistance. For example, previous studies have found negative genetic correlations between host resistance
and life-history traits. In invertebrates, the level of resistance often depends on the combination of the host and parasite genotypes,
and in this study, we have investigated whether such specific resistance also acts as an evolutionary constraint. We measured
the resistance of different genotypes of the fruit fly Drosophila melanogaster to different genotypes of a naturally occurring
pathogen, the sigma virus. Using a multitrait analysis, we examine whether genetic covariances alter the potential to select for
general resistance against all of the different viral genotypes. We found large amounts of heritable variation in resistance, and
evidence for specific interactions between host and parasite, but these interactions resulted in little constraint on Drosophila
evolving greater resistance.
KEY WORDS: Drosophila melanogaster, genetic variation, genetic variance–covariance matrix, host–parasite coevolution, sigma
virus.
BackgroundIf a parasite is common and harmful, it will impose selection
for increased host resistance. To predict whether the population
will respond to this selection pressure by evolving increased re-
sistance, we need to understand what constrains the evolution of
resistance. Genetic constraints exist when a trait’s response to se-
lection is limited by selection on another genetically correlated
trait. These genetic correlations are thought to arise mainly be-
cause of pleitropic effects—when a gene has an effect on two or
more traits (Falconer and Mackay 1996)—and result in pheno-
typic change that is a consequence both of direct selection on a
trait and indirect selection on traits that genetically covary. And
so, if traits are negatively genetically correlated and selected in the
same direction, the overall response to selection will be reduced.
Under certain circumstances, this has the potential to act as an
absolute constraint, preventing any evolutionary change in either
trait.
Genetic constraints on the ability to evolve resistance can
be caused by trade-offs with other components of fitness (Boots
and Begon 1993; Groeters et al. 1994; Kraaijeveld and Godfray
1997; Webster and Woolhouse 1999; Hosken 2001), or trade-offs
in resistance against other pathogens (or pathogen genotypes). In
1C© 2011 The Author(s).Evolution

Jenni fer A. CARPENTER ET AL.
the search for the latter, there are a growing number of examples
of specific host–parasite interactions, where host genotypes are
resistant to one parasite genotype but susceptible to another (Gross
et al. 1980; Siegel and Gross 1980; Gehad et al. 1999; Johnsen and
Zuk 1999; Gill et al. 2000). However, in these studies, it is usually
unclear if these specific interactions constrain the evolution of
general resistance to all parasite genotypes. One of the difficulties
in interpreting these studies is that often too few host genotypes
have been sampled to accurately estimate genetic correlations
between resistance to different pathogen genotypes.
Another reason that it is difficult to assess the importance
of genetic constraints is that previous studies have tended to ex-
amine trade-offs between pairs of traits, and, by doing so, they
may miss the role of constraints on the evolution of resistance
in nature where selection acts simultaneously on many different
traits. This is important for the evolution of host resistance, as
there can be complex genetic correlations both between multiple
aspects of the immune response and between the immune system
and life-history traits (Cotter et al. 2004). When selection oper-
ates on multiple traits simultaneously, even small pairwise genetic
correlations can result as absolute genetic constraints (Dickerson
1955; Charlesworth 1984; Blows and Hoffmann 2005). This is be-
cause there may be directions in multivariate trait space where no
genetic variation is available to selection—even when individual
traits display substantial genetic variation. And if selection acts
in that direction, then evolutionary change will not be possible.
In this study, we examine whether trade-offs in resistance
against different pathogen genotypes acts to constrain the evo-
lution of increased resistance. To investigate this, we measured
the variation in transmission of five different viral isolates in
Drosophila melanogaster lines with different X, second, and third
chromosomes. Our aim is threefold: First, to measure the amount
of genetic variation affecting transmission rates for each chro-
mosome separately, second, to determine what proportion of this
variation affects transmission of all five viruses, and what propor-
tion affects transmission of particular viruses; and third, to assess
whether the evolution of general resistance is constrained by the
specific interactions that we find.
To do this, we have used a multivariate statistical approach,
based on Lande’s G-matrix, to describe patterns of genetic vari-
ation in the rate that the virus is transmitted (Lande 1979). By
calculating the genetic covariances between the rates at which
different isolates of the virus are transmitted, it is possible to pre-
dict how selection for resistance to one virus will cause a change in
resistance to the others. However, when more than two viruses are
measured, it becomes difficult to interpret the increasing numbers
of covariances. Therefore, we have used eigen analysis to analyze
G matrices. This involves generating two new variables: eigen-
vectors, which are linear combinations of the original traits (i.e.,
the genetic variances and covariances); and eigenvalues, which
reflect the amount of genetic variance associated with each vec-
tor (see [McGuigan (2006)] for a review of this approach). This
makes it simple to assess the relative importance of each of the
eigenvectors, and therefore the proportion of the total genetic vari-
ation in the population that will increase resistance to all the viral
strains.
Material and MethodsFLY STOCKS, VIRAL ISOLATES, AND GENERAL
METHODS
The effect of the D. melanogaster X, second, and third chromo-
somes on sigma virus transmission was measured independently
using three panels of chromosome substitution lines. Using dif-
ferent chromosomes lines allowed the virus to be crossed in with
balancer chromosomes (see below) and allowed us to compare
the contribution of different regions of the genomes to resistance.
In these lines, a given chromosome taken from the wild was
made homozygous and crossed into the same isogenic genetic
background.
We used 69 X chromosome substitution lines that were cre-
ated by Tony Long from a population in California (U.S.A.)
in 1998. These lines were created by crossing isogenic
C(1)DXy1 f 1; bw1; st1 flies to the wild-type flies, and then back-
crossing F1 males back to C(1)DXy1 f 1; bw1; st1. The resulting
+; bw1; st1 males (where + is the X chromosome from California)
were maintained in a stock with C(1)DXy1 f 1; bw1; st1 females.
We used 77 second chromosome substitution lines that were cre-
ated by (Lazzaro et al. 2004) from flies collected in Pennsylvania
(U.S.A.) in 1998 and 1999. These lines have been previously
genotyped for a polymorphism in a gene called ref(2)P that is
known to affect the susceptibility of D. melanogaster to the sigma
virus (Banghetam et al. 2007). We used 67 third chromosome
substitution lines that we created ourselves from flies collected
in North Carolina (U.S.A.) in 1997 by Trudy Mackay. To make
these third chromosome substitution lines, we backcrossed the
Mackay-collected flies to a w1118; TM3,Sb/TM6B, Tb stock that
has the isogenic Canton-S B genetic background (Bellen et al.
2004; Harbison et al. 2004) for six generations, and then crossed
siblings to obtain w1118; + flies (where + is the homozygous
chromosome from North Carolina).
Because the sigma virus is transmitted vertically, we created
fly stocks that were infected with the sigma virus, and used these
to cross the virus into the chromosome substitution lines. We used
five different viral isolates that were chosen to maximize phylo-
genic and geographic diversity; the lines were collected in the
United States (AP30), Spain (GC20), Greece (PF115), the United
Kingdom (E27), and France (Hap23). Their collection is described
in (Carpenter et al. 2007). The fly stocks that were infected were
the same as those used to create the chromosome substitution
2 EVOLUTION 2011
SPECIFIC INTERACTIONS BETWEEN HOST AND PARASITE GENOTYPES
lines, and therefore have the same genetic background. To create
the infected stocks, we took infected females from the five differ-
ent wild-caught lines and backcrossed them for six generations
to either SM5/Pm; spapol males (for the second chromosome
experiment) or w1118; TM3, Sb/TM6B, Tb males (for the third
chromosome experiment). For the X chromosome experiment,
we took infected males from the same five different wild-caught
lines and crossed them to C(1)DX y1 f 1; bw1; st1 females and
then backcrossed F1 females to bw1; st1 males. We checked that
the backcrossed lines were infected with the virus every gen-
eration. To measure the transmission of the virus, we crossed
infected males to a standard isogenic strain called P18 (Bangham
et al. 2008). The methods we used to rear flies at constant density
are described by (Bangham et al. 2008). The sigma virus makes
infected flies die or become paralyzed after exposure to CO2, so
we tested flies for infection by exposing them to CO2 for 15 min
at 12◦C (see Bangham et al. 2008).
SIGMA VIRUS TRANSMISSION IN SECOND AND
THIRD CHROMOSOME SUBSTITUTION LINES
Here, we describe the experiment to measure transmission
in the second chromosome substitution lines. However, this
is identical to the experiment measuring transmission in
the third chromosome substitution lines, except the balancer
stock used to infect third chromosome substitution lines was
w1118; TM3, Sb/TM6B, Tb, not SM5/Pm; spapol .
Infected SM5/Pm;spapol virgin females were collected from
the standard-density bottle cultures. After three days, pairs of
females were placed in vials with pairs of males from each of
the second chromosome substitution lines. Between two and four
replicate crosses were set up for each second chromosome sub-
stitution line. After two days, the parents were removed from the
vials and we checked that the female parent was infected; if ei-
ther female was uninfected, the vial was discarded. The infected
SM5/+; spapol female F1 offspring were aged for four days and
then backcrossed to the chromosome substitution line +;spapol .
Between one and four replicates were set up from each vial. As
before, the flies were left to lay for two days and then the par-
ents were removed and females were checked to ensure that they
were infected, with vials being discarded if they were not. We
collected F2 offspring that were homozygous for the wild-type
second chromosome from this cross. These flies were genetically
identical to the second chromosome substitution lines, but had
been infected with the virus. Some males were put aside to be
used to measure the rate of sigma virus transmission by infected
males (see below). Fifteen days after the cross was set up, the
remainder of the F2 flies were tested for infection. This provided
an estimate of the effect of the wild-type second chromosome
on transmission from a heterozygous female (SM5/+;spapol ) to
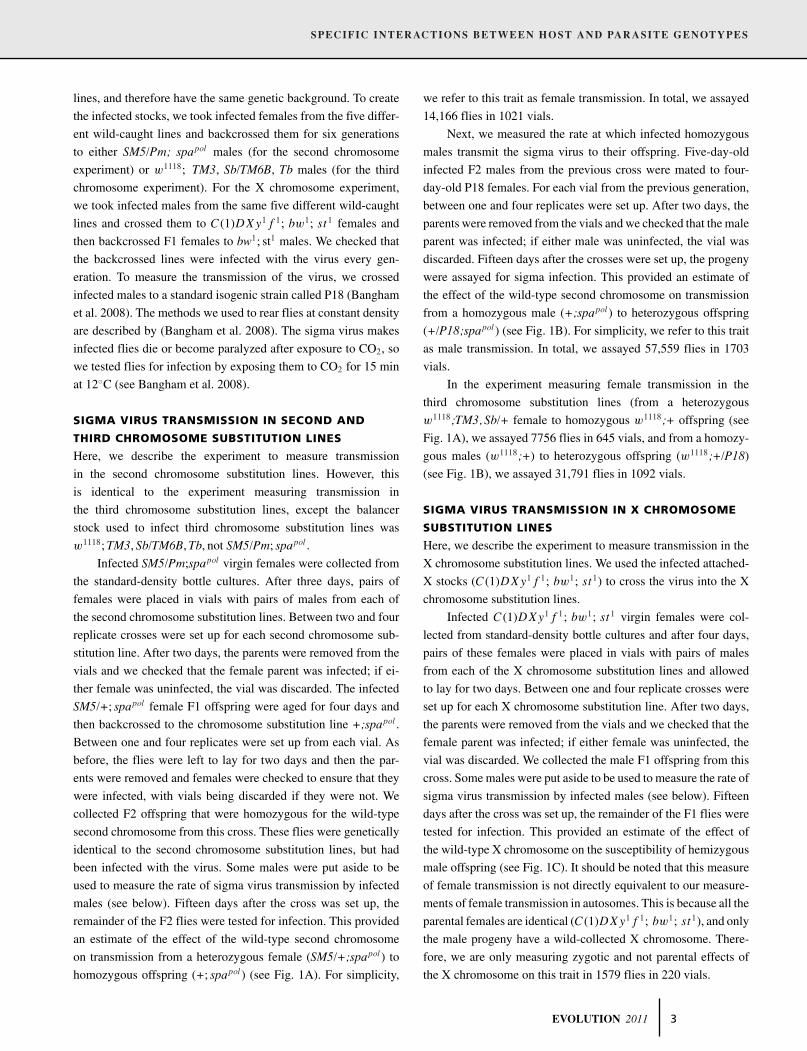
homozygous offspring (+; spapol ) (see Fig. 1A). For simplicity,
we refer to this trait as female transmission. In total, we assayed
14,166 flies in 1021 vials.
Next, we measured the rate at which infected homozygous
males transmit the sigma virus to their offspring. Five-day-old
infected F2 males from the previous cross were mated to four-
day-old P18 females. For each vial from the previous generation,
between one and four replicates were set up. After two days, the
parents were removed from the vials and we checked that the male
parent was infected; if either male was uninfected, the vial was
discarded. Fifteen days after the crosses were set up, the progeny
were assayed for sigma infection. This provided an estimate of
the effect of the wild-type second chromosome on transmission
from a homozygous male (+;spapol ) to heterozygous offspring
(+/P18;spapol ) (see Fig. 1B). For simplicity, we refer to this trait
as male transmission. In total, we assayed 57,559 flies in 1703
vials.
In the experiment measuring female transmission in the
third chromosome substitution lines (from a heterozygous
w1118;TM3, Sb/+ female to homozygous w1118;+ offspring (see
Fig. 1A), we assayed 7756 flies in 645 vials, and from a homozy-
gous males (w1118;+) to heterozygous offspring (w1118;+/P18)
(see Fig. 1B), we assayed 31,791 flies in 1092 vials.
SIGMA VIRUS TRANSMISSION IN X CHROMOSOME
SUBSTITUTION LINES
Here, we describe the experiment to measure transmission in the
X chromosome substitution lines. We used the infected attached-
X stocks (C(1)DXy1 f 1; bw1; st1) to cross the virus into the X
chromosome substitution lines.
Infected C(1)DXy1 f 1; bw1; st1 virgin females were col-
lected from standard-density bottle cultures and after four days,
pairs of these females were placed in vials with pairs of males
from each of the X chromosome substitution lines and allowed
to lay for two days. Between one and four replicate crosses were
set up for each X chromosome substitution line. After two days,
the parents were removed from the vials and we checked that the
female parent was infected; if either female was uninfected, the
vial was discarded. We collected the male F1 offspring from this
cross. Some males were put aside to be used to measure the rate of
sigma virus transmission by infected males (see below). Fifteen
days after the cross was set up, the remainder of the F1 flies were
tested for infection. This provided an estimate of the effect of
the wild-type X chromosome on the susceptibility of hemizygous
male offspring (see Fig. 1C). It should be noted that this measure
of female transmission is not directly equivalent to our measure-
ments of female transmission in autosomes. This is because all the
parental females are identical (C(1)DXy1 f 1; bw1; st1), and only
the male progeny have a wild-collected X chromosome. There-
fore, we are only measuring zygotic and not parental effects of
the X chromosome on this trait in 1579 flies in 220 vials.
EVOLUTION 2011 3

Jenni fer A. CARPENTER ET AL.
Figure 1. Schematic describing the four types of transmission experiment carried out.
Next, we measured the rate at which infected hemizygous
males transmit the sigma virus to their offspring. Four-day-old
infected F1 males from the previous cross were mated to five-
day-old P18 females. For each vial from the previous generation,
between one and eight replicates were set up. After two days,
the parents were removed from the vials and we checked that
the male parent was infected; if either male was uninfected, the
vial was discarded. Seventeen days after the crosses were set up,
the progeny were assayed for sigma infection. This provided an
estimate of the effect of the wild-type first chromosome on trans-
mission from a hemizygous male (+;bw1;st1) to heterozygous
offspring (+/P18: bw1/P18;st1/P18) (see Fig. 1D). As with the
autosomes, we refer to this trait as male transmission although it
is not strictly analogous. In total, we assayed 71,440 flies in 1260
vials.
QUANTITATIVE GENETIC ANALYSIS
Because there was little genetic variation in maternal transmis-
sion, we analyzed the data on this trait using nonparametric
statistics. There was more genetic variation in paternal trans-
mission, and so we investigate the nature of this variation
by estimating the matrix of genetic variances and covariances
(the G matrix) with respect to the five different viruses for each
chromosome separately. Our data consist of numbers of infected
and uninfected flies which we treat as a binomial response in a
generalized linear mixed model (GLMM).
For the X chromosome, the models were formulated as fol-
lows: let νi, j,k be the probability of flies in vial i from line j being
susceptible to virus k.
νi, j,k = logit−1(x�
i β + α j,k + εi, j,k), (1)
4 EVOLUTION 2011

SPECIFIC INTERACTIONS BETWEEN HOST AND PARASITE GENOTYPES
where β is a vector of fixed effects such as the effect of virus
type and day, and x�i is a row vector relating the fixed effects to
vial i . α j,k is the effect of virus k on line j . These effects were
treated as random and were assumed to be multivariate normally
distributed:
⎡⎢⎢⎢⎢⎢⎣
α j,1
α j,2
α j,3
α j,4
α j,5
⎤⎥⎥⎥⎥⎥⎦
∼ N
⎛⎜⎜⎜⎜⎜⎝
⎡⎢⎢⎢⎢⎢⎣
0
0
0
0
0
⎤⎥⎥⎥⎥⎥⎦
,
⎡⎢⎢⎢⎢⎢⎣
σ21 σ1,2 σ1,3 σ1,4 σ1,5
σ2,1 σ22 σ2,3 σ2,4 σ2,5
σ3,1 σ3,2 σ23 σ3,4 σ3,5
σ4,1 σ4,2 σ4,3 σ24 σ4,5
σ5,1 σ5,2 σ5,3 σ5,4 σ25
⎤⎥⎥⎥⎥⎥⎦
⎞⎟⎟⎟⎟⎟⎠ (2)
where σ2m is the between-line variance in susceptibility to virus
m, and σm,n is the between-line covariance in susceptibility to
virsuses m and n.
εi, j,k is a residual that captures over-dispersion within each
vial due to unaccounted heterogeneity between vials in the proba-
bility of susceptibility. The residuals were assumed to be normally
distributed with a separate variance estimated for each virus type.
The model for autosomes was identical to that of the X chro-
mosome except f2rep (f2rep represents replication of chromo-
some substitution lines) was fitted as an additional random effect
with a constant variance over virus types. For the second chro-
mosome, we also ran an additional model where an interaction
between the ref(2)P allele and the American virus—no other viral
lines showed sensitivity to this allele—was fitted as a fixed effect.
The parameters of the model were estimated using the
R library MCMCglmm (Hadfield 2010), which uses Bayesian
Markov chain Monte Carlo (MCMC) techniques. Each model
was run for 1.8 million iterations with a burn-in of 300,000 and a
thinning interval of 100. Diffuse normal priors were used for the
fixed effects with null mean vector and large variances (106) and
improper flat priors were used for the variances and covariance
matrices. Because inferences regarding (co)variances are known
to be sensitive to putatively weak prior specifications (Gelman
2006), we also fitted the models with degree of belief parameters
set to 6 and covariance matrices close to null matrices (diagonal
matrices with 1−6 along the diagonal). This prior specification
is approximately flat on the interval [−1,1] for the correlation.
Confidence limits on variance, covariances, and heritability were
calculated from highest posterior density intervals.
Although systematic biases are not expected in eigenvector
loadings (i.e., the orientation of G), there is a well-known upward
bias in the variance of the sample eigenvalues which increases
with decreasing power (e.g., [Hill & Thompson 1978] in the con-
text of genetic covariance matrices). The estimates of the leading
eigenvalues are therefore, on average, larger than the true values,
although the large sample sizes employed should minimize this
bias.
ResultsWe measured the effect of the three major chromosomes of
Drosophila on the transmission from an infected mother to her
offspring. For the second chromosome, there is very low variation
in the proportion of offspring infected for all viruses except for the
U.S. isolate, which has a bimodal pattern of transmission—lines
with the ref(2)P susceptible allele had a mean rate of transmission
of 94%, whereas the subset of lines carrying the ref(2)P resistant
allele had a mean transmission rate of 7% (Wilcoxon rank-sum test
W = 798.5, nsusceptible = 50, nresistant = 16, P < 0.001) (Fig. 2).
This gene therefore makes flies specifically resistant to one of
the five viral isolates. We think that the American isolate may be
a remnant viral type that existed before a new viral-type spread
in response to the increasing frequency of the resistant ref(2)P
allele in D. melanogaster populations. In the last 30 years, Euro-
pean sigma populations have undergone replacement of one viral
type that was sensitive to the resistant ref(2)P gene by another
viral type that is not affected by this gene (Fleuriet 1990; Fleuriet
and Sperlich 1992). In support of this idea, Carpenter et al. 2007
showed that the American viral isolate is phylogenetically distinct
from the other viruses used in this study.
For the other two chromosomes, there is very low variation
in the proportion of offspring infected across all viruses (a mean
of 98% across all viruses, and for each of the viral strains, there
was very low variation among chromosome lines [Fig. 2]).
GENETIC VARIANCE IN PATERNAL TRANSMISSION
Next, we examined how the five viruses were transmitted through
sperm rather than eggs. As for maternal transmission, the resistant
ref(2)P allele significantly reduces transmission of the American
virus—lines with the ref(2)P susceptible allele had a mean rate
of transmission of 23%, whereas the subset of lines carrying
the ref(2)P resistant allele had a mean transmission rate of 8%
(Wilcoxon rank-sum test W = 385, nsusceptible = 50, nresistant =11, P < 0.04) (Fig. 3).
However, in contrast to maternal transmission, there was sub-
stantial genetic variation in transmission rates caused by all three
chromosomes against all the viruses (Fig. 3). This is reflected in
the variances in Table 1, which shows that there is significant vari-
ation in susceptibility of flies to the different viruses (diagonals
in matrices have 95% credible intervals considerably greater than
0). Why the discrepancy between the maternal and paternal trans-
mission rates? One possibility might lie in the size differences
between male and female gametes (Bangham et al. 2008). Sigma
virus is found in the cytoplasm of cells and because male gametes
deliver smaller quantities of cytoplasm to their offspring than fe-
males (Brun and Plus 1998), they transmit fewer viral particles.
Therefore, genes that reduce viral titers could have larger affects
when the virus is transmitted through sperm than eggs. There is
EVOLUTION 2011 5

Jenni fer A. CARPENTER ET AL.
Figure 2. Sigma virus maternal-transmission rates across chromosome-extracted lines of D. melanogaster for five viruses. The bars show
the means with equal weights to each vial.
Figure 3. Sigma virus paternal-transmission rates across chromosome-extracted lines of D. melanogaster for five viruses. The bars show
the means with equal weights to each vial.
greater variation in transmission rates for the second and third
chromosomes compared to the X chromosome, which we expect,
as the X is roughly half the size of the autosomes.
From the genetic variance (Vg) and residual variance (Vr ),
we estimated broad sense heritability on the latent scale (h2) for
the paternal transmission rate using the following equation: h2 =Vg
Vg+Vr + π23
, where π2
3 is the variance of a logistic distribution (the
cumulative distribution function of the logistic distribution is the
inverse logit function—the link function used in the model (Lee
and Nelder 2001; Nakagawa and Schielzeth 2010), and Vg is half
the between-line variance (because our lines are homozygous).
We found that the heritability of viral transmission was similar
for each of the five viruses and was relatively high, indicating that
this trait has the potential to respond to selection (Table 3).
GENETIC COVARIANCE BETWEEN VIRUSES IN RATES
OF TRANSMISSION
To investigate whether trade-offs in resistance against different
viral isolates exist, we looked to see whether the genetic vari-
ation in transmission of the virus is general to all viruses or
specific to particular viruses. To do this, we calculated eigen-
vectors and eigenvalues for each of the five principle compo-
nents. We found, at least for the second and third chromosomes,
that most of the variation in transmission is explained by the
first eigenvector (∼80%) (see Fig. 4), and that the viruses con-
tribute more or less equally to this first vector (Table 4), indicat-
ing that most of the variation that we found is general to all five
viruses.
In contrast, far less of the variation in transmission for the
X chromosome is explained by the first eigenvector (∼50%) (see
Fig. 4), and the viruses are not contributing equally to each of
the eigenvectors (Table 4). In fact, a single virus is contribut-
ing a significant amount of the variation to each of the five
eigenvectors in turn, indicating that most of the variation is not
general to all viruses, but is instead associated with a specific
virus.
To allow comparison of the variation in transmission rates
between chromosomes, we have used the first three eigenvectors
6 EVOLUTION 2011

SPECIFIC INTERACTIONS BETWEEN HOST AND PARASITE GENOTYPES
Table 1. G-matrices for X, second, and third chromosomes showing variances (bold) and correlations. Confidence limits (in brackets) are
calculated from HPD intervals.
[U.S.A.] [U.K.] [Spain] [France] [Greece]
X chromosome[U.S.A.] 0.324 (0.176, 0.558)[U.K.] 0.232 (−0.142, 0.590) 0.558 (0.289, 0.977)[Spain] −0.021 (−0.519, 0.499) −0.116 (−0.561, 0.465) 1.461 (0.427, 3.326)[France] −0.023 (−0.404, 0.369) 0.072 (−0.298, 0.480) 0.001 (−0.494, 0.561) 1.029 (0.510, 1.753)[Greece] 0.125 (−0.233, 0.472) 0.197 (−0.153, 0.533) 0.093 (−0.333, 0.625) 0.148 (−0.200, 0.445) 3.029 (1.871, 4.563)
Second chromosome[U.S.A.] 3.873 (2.331, 6.240)[U.K.] 0.432 (0.189, 0.664) 2.068 (1.418, 3.047)[Spain] 0.416 (0.176, 0.651) 0.825 (0.725, 0.930) 1.657 (1.129, 2.420)[France] 0.741 (0.558, 0.876) 0.712 (0.543, 0.853) 0.660 (0.473, 0.820) 1.105 (0.686, 1.731)[Greece] 0.755 (0.591, 0.908) 0.708 (0.527, 0.867) 0.707 (0.531, 0.855) 0.795 (0.650, 0.930) 3.957 (2.099, 6.719)
Third chromosome[U.S.A.] 3.299 (1.800, 5.522)[U.K.] 0.875 (0.785, 0.968) 3.636 (2.076, 5.948)[Spain] 0.866 (0.734, 0.953) 0.874 (0.800, 0.971) 3.817 (2.242, 6.463)[France] 0.712 (0.512, 0.929) 0.790 (0.623, 0.942) 0.799 (0.640, 0.945) 4.157 (2.322, 6.949)[Greece] 0.788 (0.618, 0.939) 0.833 (0.682, 0.950) 0.847 (0.688, 0.953) 0.873 (0.759, 0.971) 5.150 (2.853, 8.984)
Note: HPD, highest probability interval.
Table 2. G-matrices for second chromosome calculated from paternal transmission rates with a model allowing an interaction between
ref(2)P and the American viral isolate. Variances (bold) and correlations. Confidence limits (in brackets) are calculated from HPD intervals.
[U.S.A.] [U.K.] [Spain] [France] [Greece]
Second chromosome[U.S.A.] 3.697 (2.238, 5.905 )[U.K.] 0.418 (0.172, 0.647) 2.078 (1.378, 2.997 )[Spain] 0.401 (0.148, 0.649) 0.833 (0.534, 0.862) 1.675 (1.083, 2.472 )[France] 0.718 (0.543, 0.871) 0.714 (0.148, 0.649) 0.666 (0.539, 0.858) 1.107 (0.693, 1.692 )[Greece] 0.761 (0.595, 0.903) 0.712 (0.722, 0.926) 0.695 (0.465, 0.827) 0.804 (0.647, 0.925) 4.170 (2.090, 7.502)
to define a subspace that contains most of the genetic variation
associated with each chromosome. It is clear from Figure 5, where
these subspaces are overlain to allow comparison between the
different chromosomes, that the patterns of variation associated
with the second and third chromosomes are very similar, whereas
the X chromosome seems most different.
If we assume that the genetic variation is additive, we can
sum all three chromosomes together to estimate the total ge-
netic variation in transmission across the whole genome. We find
that most of the variation in transmission is general (∼70% of
the genetic variation is explained by the first eigenvector and
the viruses contribute more or less equally to it, see Fig. 4 and
Table 4).
The importance of general resistance may be overestimated
in these analyses, as there is an upward bias in the estimation
of the leading eigenvalues (e.g., [Hill & Thompson1978] in the
context of genetic covariance matrices). However, this bias only
affects the magnitude and not the direction of the eigenvectors,
and is greatest when the power is low (our sample sizes are
not small). Therefore, it is unlikely to qualitatively affect our
conclusions.
The use of homozygous lines may also have affected our
results. Under an additive model, G from inbred lines should be
the same as G arising in a randomly mating population (Robertson
1952). With nonadditive effects, the effect of inbreeding on G is
likely to be complex, as is found following population bottlenecks
(Lopez-Fanjul et al. 2004). In particular, if inbreeding depression
primarily affects general resistance to all sigma virus strains rather
than strain-specific resistance, it may cause us to overestimate the
importance of general resistance (i.e., overestimate the genetic
EVOLUTION 2011 7

Jenni fer A. CARPENTER ET AL.
Figure 4. The scree plot displays the eigenvalues for each of the five principle components for the different chromosomes and all
chromosomes together.
Table 3. Measures of the trait mean, and heritability (h2) in vi-
ral transmission in Drosophila melanogaster, confidence limits (in
brackets) are calculated from HPD intervals.
Virus Mean transmission (%)* h2**
U.S.A. 0.37 (0.38, 0.42) 0.553 (0.458, 0.634)U.K. 0.61 (0.55, 0.67) 0.488 (0.404, 0.577)Spain 0.71 (0.60, 0.80) 0.455 (0.338, 0.554)France 0.60 (0.52, 0.67) 0.450 (0.352, 0.547)Greece 0.05 (0.03, 0.07) 0.551 (0.459, 0.636)
*Trait means (x) were back-transformed from the logit scale into percent-
ages with the link function x = 11+ 1
ex.
∗∗Assuming the genetic variance is additive, the total heritability is calcu-
lated
by summing the genetic variance of the three chromosomes and using the
mean of the residual variance.
correlations). However, empirical work on Drosophila wing shape
in inbred lines found good agreement with theoretical predictions
under the additive model. Whether these results are relevant to our
data is unclear, as there is little inbreeding depression for wing
shape (Whitlock and Fowler 1999) whereas inbreeding depression
commonly affects parasite resistance (Gerloff et al. 2003; Bello-
Bedoy and Nunez-Farfan 2011).
RESPONSE TO SELECTION ON EACH OF THE FIVE
VIRUSES
We investigated how specific resistance affects the response to
selection in our traits—the change in rate of transmission of each
of the five viruses. This was done by exerting a selection pressure
on any one virus and predicting the change in the transmission
rate of both the virus under selection, and the correlated change in
the transmission rate of the other viruses. Ignoring ref(2)P, there
is negligible genetic variation in maternal transmission, so the
response to selection is determined solely by selection acting on
males. Therefore, we can calculate the response to selection by
applying the multivariate breeder’s equation, �z = 0.5Gβ, where
G is the additive genetic variance–covariance matrix (Table 1), β
is the vector of selection; and �z, the vector of predicted responses
to selection. We performed this analysis on the combined G matrix
from all three chromosomes.
Selection on each virus in turn indicates that no antagonism
exists between resistance to each of the viruses as all of the viruses
show a positive change in their trait mean, although the relative
response varies across viruses (Table 5). However, in most cases,
if we compare the response of a virus when it is being directly
selected on to its response when another virus is being selected
on, we can see that its correlated response is less than expected
from the direct response.
We also examined the response to selection from a mixed
population of all five viruses, as might occur in the wild. We found
that there is roughly a 20% reduction in the response to selection
from a mixed population of viruses compared to a single genotype
(Table 5, comparing numbers in bold to the column entitled “Virus
selected on simultaneously”).
THE EFFECT OF ref(2)P ON PATERNAL TRANSMISSION
Because the resistant ref(2)P allele was associated with a 14%
drop in the rate of transmission of the American virus, we have ex-
amined whether the interaction between ref(2)P and the American
isolate might account for the remaining variation on the second
8 EVOLUTION 2011

SPECIFIC INTERACTIONS BETWEEN HOST AND PARASITE GENOTYPES
Table 4. Eigenvectors, which are the linear combinations of the
original traits (i.e., the variance and covariances) for each of the
viruses for X, second, and third chromosomes separately and to-
gether. The columns are the first five principle components.
[PC1] [PC2] [PC3] [PC4] [PC5]
X chromosome[U.S.A.] −0.045 0.036 −0.042 0.339 0.938[U.K.] −0.098 0.158 0.019 0.921 −0.343[Spain] −0.096 −0.981 0.075 0.150 −0.018[France] −0.124 0.082 0.987 −0.031 0.046[Greece] −0.982 0.068 −0.132 −0.118 −0.013
Second chromosome[U.S.A.] −0.541 0.692 0.384 0.157 0.236[U.K.] −0.367 −0.538 0.402 −0.495 0.410[Spain] −0.322 −0.480 0.153 0.794 −0.108[France] −0.304 −0.008 0.242 −0.294 −0.873[Greece] −0.614 −0.033 −0.780 −0.113 0.036
Third chromosome[U.S.A.] −0.394 −0.551 0.045 0.170 0.714[U.K.] −0.429 −0.318 −0.261 0.541 −0.595[Spain] −0.444 −0.264 −0.072 −0.816 −0.250[France] −0.448 0.619 −0.588 0.015 0.264[Greece] −0.513 0.377 0.761 0.110 −0.066
All three chromosomes[U.S.A.] −0.981 0.177 0.388 0.666 1.888[U.K.] −0.894 −0.698 0.160 0.967 −0.527[Spain] −0.862 −1.725 0.155 0.128 −0.376[France] −0.876 0.693 0.641 −0.309 −0.563[Greece] −2.108 0.412 −0.152 −0.122 −0.044
chromosome, which is unexplained by the first eigenvector. To in-
vestigate this, paternal transmission rates were re-analysed with a
model allowing an interaction between ref(2)P and the American
viral isolate and the estimated genetic variation in transmission
rates was compared with those estimated from the former model
that did not allow this interaction. We found little difference in
estimates of the amount of genetic variation in transmission rates
between these two models, indicating that this variation is not
attributable to the ref(2)P–American isolate interaction (compare
Table 2 with Table 1).
DiscussionDO GENETIC SPECIFICITIES CONSTRAIN THE
EVOLUTION OF GENERAL RESISTANCE?
In many species, resistance to pathogens is specific, meaning that
host genotypes are resistant to one parasite genotype and suscep-
tible to another (Gross et al. 1980; Siegel and Gross 1980; Gehad
et al. 1999; Johnsen and Zuk 1999; Gill et al. 2000; Cotter et al.
2004; Dybdahl et al. 2008). These specific interactions mean that
genetic correlations in resistance to different parasite genotypes
may be low or negative. This means that although there is abun-
dant genetic variation in resistance to any one parasite genotype,
there may be very little genetic variation in general resistance
(resistance against all parasites genotypes simultaneously). This
will act as an evolutionary constraint, and prevent, or slow, the
evolution of increased host resistance.
Using a host that is known to be resistant to specific parasite
genotypes, we tested whether these specific interactions signifi-
cantly constrain the evolution of increased resistance, and found
that they do not.
We found large amounts of heritable variation in the rate that
different D. melanogaster lines transmit five different isolates
of the sigma virus. This genetic variation in transmission was
partitioned roughly equally across the genome, with the X chro-
mosome having about half as much variation as the second and
third chromosomes—as expected given that the X contains half
as many genes as the other two chromosomes. The correlation
between chromosome size and the amount of genetic variation
suggests that multiple genes spread evenly across the genome
control resistance. These findings, along with the results from
two previous studies (Bangham et al. 2007, 2008), indicate that
resistance to the sigma virus is a trait with high levels of genetic
variation. In males, this variation translates into high heritability
of between ∼40% and ∼50% for the different viruses.
We know that there is selection for increased resistance in
natural populations, as sigma virus infections are costly to the
fly, causing lower female fecundity and reduced over-wintering
survival (Seecof 1966; Fleuriet 1981b, a; Yampolsky et al. 1999).
Given that resistance is highly heritability and under selection,
we expect resistance to the sigma virus to increase in the pop-
ulation. Whether this occurs will depend on the constraints on
the evolution of resistance. One possible type of constraint is
that trade-offs exist between resistance against different pathogen
genotypes, preventing the evolution of resistance to all the viral
genotypes in a population.
We found evidence of specific resistance, where host genes
do not affect all the viruses in the same way. The clearest ex-
ample, which has been described before, involves the fly gene
ref(2)P which confers resistance to some viral isolates but not
others (Fleuriet 1988; Contamine et al. 1989; Dru et al. 1993;
Wayne et al. 1996; Bangham et al. 2007). Additionally, the ge-
netic correlations between resistance to different viruses were
less than one, indicating that specific genetic interactions exists
elsewhere in the genome. However, the majority of the variation
on the second and third chromosomes that affected transmission
rates was general to all five viruses—contrary to the idea that
trade-offs exist between resistance against different viruses. The
effects of variation on the X chromosome on transmission rates
tend to be specific to single viruses, but this may be an artifact
EVOLUTION 2011 9

Jenni fer A. CARPENTER ET AL.
Figure 5. The plots show the distribution of line effects for three of the five original dimensions in a three-dimensional subspace. The
subspace is defined by the first three eigenvectors of the first matrix (identified from the suffix of the first estG) which is plotted in red.
The distribution of line effects for a second chromosome (identified from the suffix of the second estG) is plotted in blue. The % refers
to the amount of variation that lies in this subspace compared to the total.
Table 5. Predicted change in the transmission rate in response to selection for resistance to a single virus or to a mixture of five viruses.
The numbers in bold show the direct response to the virus used for selection.
Viruses selected on in turn
Viruses U.S.A. U.K. Spain France Greece Viruses selected on simultaneously
U.S.A. −0.014 −0.013 −0.015 −0.013 −0.002 −0.013U.K. −0.008 −0.019 −0.017 −0.013 −0.001 −0.013Spain −0.008 −0.015 −0.025 −0.012 −0.001 −0.012France −0.008 −0.013 −0.015 −0.019 −0.001 −0.013Greece −0.012 −0.018 −0.021 −0.018 −0.003 −0.003
For each virus, we defined a selection gradient (β) that results in an equivalent strength of selection for reduced transmission (i.e., that which would occur
if the viruses had the same prevalence and virulence in the population). This was done by calculating selection gradients that produce an equal drop (in
percentage) in the probability that an infected male transmits the virus to his offspring. This assumes that infected males and females rarely mate.
of small genetic variances for the X chromosome leading to poor
estimates of the variances and covariances.
We conclude that most of the genetic variation in transmis-
sion rates is general, even though a small amount of genetic vari-
ation on each chromosome is involved in specific interactions
with particular viruses. Although we selected viral isolates to
maximize their phylogenetic diversity, our results are likely to
hold within wild populations where there is a similar amount of
genetic variation between viruses in their transmission rates as
we observed (Wilfert and Jiggins 2010). Furthermore, using the
multivariate breeder’s equation, we were able to show that fly
populations have the potential to evolve general resistance to all
five of these viral isolates. It thus seems unlikely that trade-offs in
resistance against these viral isolates are a constraint preventing
the evolution of resistance in D. melanogaster populations.
In light of these results, we ask: Why are flies not more
resistant to the sigma virus? Well perhaps the role of genetic cor-
relations and specificities should not be ruled out entirely. We
found that although selection for general resistance (to all five
viruses) is possible, the rate at which selection can increase resis-
tance will tend to be slowed by specific interactions with particu-
lar viruses. This becomes important when you consider parasites,
1 0 EVOLUTION 2011

SPECIFIC INTERACTIONS BETWEEN HOST AND PARASITE GENOTYPES
which evolve rapidly and offer a constantly shifting target for
selection (Woolhouse 2002). This shifting target, combined with
the slow rate of evolution toward that moving target, will reduce
the average resistance of hosts to their parasites. Another pos-
sibility is that trade-offs exist with other components of fitness;
growth rate, fecundity, competitive ability, to name a few, could
all contribute to constraining the evolution of resistance against
the sigma virus.
ACKNOWLEDGMENTSThis project was funded by a Wellcome Trust Project Grant and RoyalSociety University Research Fellowship to FMJ. JAC was supported bya NERC studentship, JDH by a NERC postdoctoral fellowship and JBby a BBSRC research grant. We would like to thank M. R. Robinson,D. Halligan, L. Bayer-Wilfert for help with analysis, and A. Fytrou,M. Magwire, C. Webster, R. Young, D. Walker, and S. Carpenter forassistance during the experiment. We would also like to thank T. Long,B. Lazzaro, and T. Mackay for flies, and two anonymous referees forcomments on the manuscript.
LITERATURE CITEDBangham, J.,Obbard, D., Kim, K., Haddrill, P., and Jiggins, F. 2007. The
age and evolution of an antiviral resistance mutation in Drosophilamelanogaster. Proc. R. Soc. Lond. B 274: 2027–2034.
Bangham, J., Kim, K., Webster, C. L., and Jiggins, F. M. 2008. Geneticvariation affecting host-parasite interactions: different genes affect dif-ferent aspects of sigma virus replication and transmission in Drosophila
melanogaster. Genetics 178: 2191–2199.Bellen, H., Levis, R., Liao, G., He, Y., Carlson, J., Tsang, G., Evans-Holm,
M., Hiesinger, P., Schulze, K., Rubin, G. et al. 2004. The BDGP genedisruption project: single transposon insertions associated with 40% ofDrosophila genes. Genetics 167: 761–781.
Bello-Bedoy, R., and Nunez-Farfan, J. 2011. The effect of inbreeding ondefence against multiple enemies in Datura stramonium. J. Evol. Biol.24: 518–530.
Blows, M. W., and Hoffmann, A. A. 2005. A reassessment of genetic limitsto evolutionary change. Ecology 86: 1371–1384.
Boots, M., and Begon, M. 1993. Trade offs with resistance to a granulosis-virusin the indian meal moth, examined by a laboratory evolution experiment.Funct. Ecol. 7: 528–534.
Brun, P., and Plus, N. 1980. The viruses of Drosophila. 2nd ed, pp. 625–702. in Ashburner, M. and Wright, T., eds. The genetics and biology ofDrosophila. Academic Press, London.
Carpenter, J. A., Obbard, D., Maside, X., and Jiggins, F. M. 2007. Therecent spread of a vertically transmitted virus through populations ofDrosophila melanogaster. Mol. Ecol. 16: 3947–3954.
Charlesworth, B. 1984. The evolutionary genetics of life-histories. pp. 117–133. in Shorrocks, B., ed. Evolutionary ecology. Blackwell ScientificPublications, Oxford, U.K.
Contamine, D., Petitjean, A. M., and Ashburner, M,. 1989. Genetic resis-tance to viral infection: the molecular cloning of a Drosophila gene thatrestricts infection by the rhabdovirus sigma. Genetics 123:525–533.
Cotter, A., Kruuk, A., and Wilson, A. 2004. Costs of resistance: geneticcorrelations and potential trade offs in an insect immune system. J.Evol. Biol. 17: 421–429.
Dickerson, G. E. 1955. Genetic slippage in response to selection for multipleobjectives. Cold Spring Harb. Symp. Quant. Biol. 20: 213–224.
Dru, P., Bras, F., Dezelee, S., Gay, P., Petitjean, A. M., Pierre-Deneubourg,A., Teninges, D., and Contamine, D. 1993. Unusual variability of theDrosophila melanogaster ref(2)P protein which controls the multiplica-tion of sigma rhabdovirus. Genetics 133: 943–954.
Dybdahl, M., Jokela, J., Delph, L., Koskella, B., and Lively, C. 2008. Hybridfitness in a locally adapted parasite. Am. Nat. 172:772–782.
Falconer, D., and Mackay, T. 1996. Introduction to quantitative genetics.Longman Group, Harlow, Essex, UK.
Fleuriet, A. 1981a. Comparison of various physiological traits in flies(Drosophila melanogaster) of wild origin, infected or uninfected bythe hereditary rhabdovirus sigma. Arch. Virol. 69:261–272.
———. 1981b. Effect of overwintering on the frequency of flies infectedby the rhabdovirus sigma in experimental populations of Drosophila
melanogaster. Arch. Virol. 69:253–260.———. 1988. Maintenance of a hereditary virus—the sigma-virus in popu-
lations of its host, Drosophila melanogaster. Evol. Biol. 23:1–30.———. 1990. Evolution of natural-populations in the Drosophila
melanogaster sigma system .2. Northern And Central France.Genetica 81:33–41.
Fleuriet, A., and Sperlich, D. 1992. Evolution of the Drosophila melanogastersigma virus system in a natural-population from Tubingen. Theor. Appl.Genet. 85:186–189.
Gehad, A., Mashaly, M., Siegel, H., Dunnington, E., and Siegel, P. 1999. Effectof genetic selection and MHC haplotypes on lymphocyte proliferationand interleukin-2 like activity in chicken lines selected for high andlow antibody production against sheep red blood cells. Vet. Immunol.Immunopathol. 68:13–24.
Gelman, A. 2006. Prior distributions for variance parameters in hierarchicalmodels. Bayesian Anal. 1:515–533.
Gerloff, C. U., Ottmer, B. K., and Schmid-Hempel, P. 2003. Effects of in-breeding on immune response and body size in a social insect, Bombusterrestris. Funct. Ecol. 17:582–589.
Gill, H., Altmann, K., Cross, M., and Husband, A. 2000. Induction of T helper1-and T helper 2-type immune responses during Haemonchus contortusinfection in sheep. Immunology 99:458–463.
Groeters, F., Tabashnik, B., Finson, N. and Johnson, M. 1994. Fitness costs ofresistance to Bacillus-thuringiensis in the Diamondback moth (Plutellaxylostella). Evolution 48:197–201.
Gross, W., Siegel, P., Hall, R., Domermuth, C., and Duboise, R. 1980. Pro-duction and persistence of antibodies in chickens to sheep erythrocytes.2. Resistance to infectious-diseases. Poult. Sci. 59:205–210.
Hadfield, J. 2010. MCMC methods for multi–response generalised lin-ear mixed models: the MCMCglmm R package. J. Stat. Softw. 33:1–22.
Harbison, C. T., Gordon, D. B., Lee, T. I., Rinaldi, N. J., Macisaac, K. D.,Danford, T. W., Hannett, N. M., Tagne, J.-B., Reynolds, D. B., Yoo,J. et al. 2004. Transcriptional regulatory code of a eukaryotic genome.Nature 431:99–104.
Hill, W. G., and Thompson, R. 1978. Probablilities of non-positive defi-nite between-group or genetic covariance matrices. Biometrics 34:429–439.
Hosken, D. 2001. Sex and death: microevolutionary trade offs between repro-ductive and immune investment in dung flies. Current Biology 11:R379–R380.
Johnsen, T. S., and Zuk, M. 1999. Parasites and tradeoffs in the immuneresponse of female red jungle fowl. Oikos 86:487–492.
Kraaijeveld, A. R., and Godfray, H. C. J. 1997. Trade off between parasitoidresistance and larval competitive ability in Drosophila melanogaster.Nature 389:278–280.
Lande, R. 1979. Quantitative genetic analysis of multivariate evolution, ap-plied to brain: body size allomtry. Evolution 33:402–416.
EVOLUTION 2011 1 1

Jenni fer A. CARPENTER ET AL.
Lazzaro, B. P., Sceurman, B. K., and Clark, A. G. 2004. Genetic basis ofnatural variation in D. melanogaster antibacterial immunity. Science303:1873–1876.
Lee, Y., and Nelder, J. A. 2001. Hierarchical generalised linear models: a syn-thesis of generalised linear models, random-effect models and structureddispersions. Biometika 88:987–1006.
Lopez-Fanjul, C., Fernandez, A., and Toro, M. A. 2004. Epistasis and thetemporal change in the additive variance-covariance matrix induced bydrift. Evolution 58:1655–1663.
Luong, L., Heath, B., and Polak, M. 2007. Host inbreeding increases suscep-tibility to ectoparasitism. J. Evol. Biol. 20:79–86.
McGuigan, K. 2006. Studying phenotypic evolution using multivariate quan-titative genetics. Mol. Ecol. 15:883–896.
Nakagawa, S., and Schielzeth, H. 2010. Repeatability for Gaussian andnon-Gaussian data: a pratical guide for biologists. Biol. Rev. 85:935–956.
Robertson, A. 1952. The effect of inbreeding on the variation due to recessivegenes. Genetics 37:188–207.
Seecof, R. L. 1966. Low titers in Drosophila that regularly transmit the sigmavirus infection. Genetics 53:79–83.
Siegel, P., and Gross, W. 1980. Production and persistence of antibodies in
chickens to sheep erythrocytes .1. Directional selection. Poul. Sci. 59:1–5.
Wayne, M., Contamine, D., and Kreitman, M. 1996. Molecular populationgenetics of ref(2)P, a locus which confers viral resistance in Drosophila.Mol. Biol. Evol. 13:191–199.
Webster, J., and Woolhouse, M. 1999. Cost of resistance: relationship betweenreduced fertility and increased resistance in a snail-schistosome host-parasite system. Proc. R. Soc. Lond. B 266:391–396.
Whitlock, M. C., and Fowler, K. 1999. The changes in genetic and environ-mental variance with inbreeding in Drosophila melanogaster. Genetics152:345–353.
Wilfert, L., and Jiggins, F. M. 2010. Host-parasite coevolution: genetic varia-tion in a virus population and the interaction with a host gene. J. Evol.Biol. 23:1447–1455.
Woolhouse, M. 2002. Population biology of emerging and re-emergingpathogens. Trends Microbiol. 10:3–7.
Yampolsky, L. Y., Webb, C. T., Shabalina, S. A., and Kondrashov, A. S.1999. Rapid accumulation of a vertically transmitted parasite triggeredby relaxation of natural selection among hosts. Evol. Ecol. Res. 1:581–589.
Associate Editor: M. Wayne
1 2 EVOLUTION 2011