Embed Size (px)
Citation preview
Specific behaviour problems in children with FASD in remote Australian Aboriginal communitiesResults from the Lililwan Project
Paediatrics & Child HealthUniversity of Sydney Medical School
Elizabeth ElliottDr. Tracey W Tsang
and the Lililwan Project Team

Study authors:› Tracey Tsang, Heather Carmichael-Olson, Marmingee HandLililwan Chief Investigators:› Elizabeth Elliott, June Oscar, Maureen Carter, James
Fitzpatrick, Jane Latimer. Funders:› NHMRC; Australian Government Dept. Families, Housing,
Community Services & Indigenous Affairs; Dept. Health & Ageing; University Sydney
2
Email: [email protected]

Meta-analysis No FASD vs FASD (n=16)T-scores: Total, Internalizing, Externalizing problems
Total
Internalizing
Externalizing
12.10
6.32
12.46
Tsang, Carmichael-Olsen, Elliott et al. Pediatrics, 2016

Background & Purpose
› FASD associated with problematic behaviours- Behaviour challenges in Aboriginal children with FASD ?- Aboriginality and remote living associated with:
- Early life trauma; disadvantage› Secondary outcomes of FASD:
- Poor academic achievement; Unemployment; trouble with the law; poor QOL and health
› What do we need to know?:- Behaviour challenges at home and in school- Differences between FASD vs. No FASD
4
Behaviour in FASD

The Lililwan Project. Fitzroy Valley, WA, 2009-13Elliott E, Latimer J, Oscar J, Fitzpatrick J, Carter M
• First population-based study of FASD prevalence
• Fitzroy Valley• 4,500 mainly Aboriginal• 45 discrete communities• 5 language groups• Community consultation
5
Lililwan is a Kimberley Kriol word meaning ‘all the little ones’
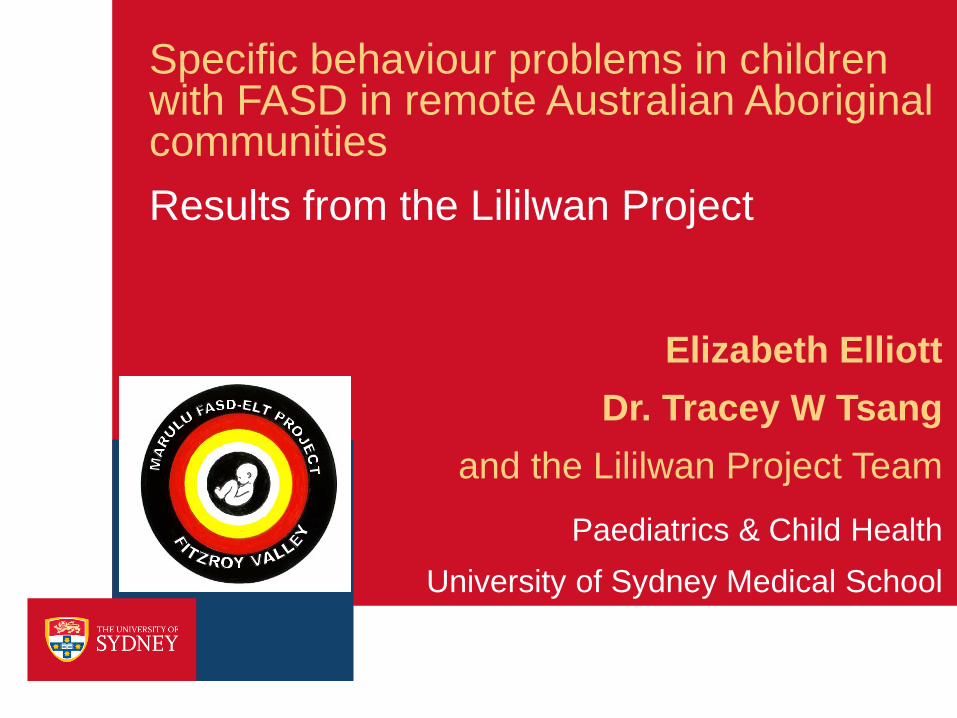
Background
› Community-initiated, population-based study
› Objectives:1. FASD prevalence (2002-3)2. Relationships between
prenatal alcohol exposure & neurodevelopmental and behavioural outcomes
3. Assessment, diagnosis, health, education management plans
6
Lililwan Project

The Lililwan Project
7
Stage 1Identify all children born
2002 or 2003 living in Fitzroy Valley;
Interview parents/carers
April-Aug 2010127 of 134 eligible
(95% participation rate)
Stage 2Interdisciplinary
assessment; Achenbach: CBCL, TRF; Development of individual
management plans
Nov 2010Trial of clinical
assessments (N=6)
May-Nov 2011Interdisciplinary
assessment of cohort

Interdisciplinary assessment
Robyn Doney
Barb Lucas
James Fitzpatrick
Heather Carmichael-Olsen
Clare Salter

The Lililwan Project; Fitzpatrick et al. Elliott. PRENATAL ALCOHOL EXPOSURE
n = 11555% drank93% high riskMost T1-T3
19% FASD100% ELT

Achenbach: CBCL simplified structure
10
• - - - - -• - - - - -• - - - - -• - - - - -• - - - - -
• - - - - -• - - - - -• - - - - -• - - - - -
• - - - - -• - - - - -• - - - - -
• - - - - -• - - - - -
Individual Qs(“items”)
Scale score A
Scale score D
Scale score C
Scale score B
Scale scores
Broad summary score 1
Broad summary score 2
Broad summary scores
…(113 items: 12 Critical)
…(24 CBCL scales)
…(4 CBCL scores)

Cohort & Methods
› N = 108: CBCL: N=97; TRF: N=106› Age: 8.7 ± 0.6 y (range: 7.4 to 9.6 y)› FASD 21 (19%)› Child Protection: FASD 40%; Non-FASD 14.5% (p<0.05)› CBCL trained community navigators› TRF self-administered› Analyses: FASD v Non-FASD
- Proportions with “Normal”, & “Borderline / Clinical” scores- Total scores- Critical items
11
Behaviour data

Results: Total Cohort
12
“Borderline / Clinical” behaviours (%)
39.2% 38.2%
34%
29.9%
24% 23.7%21.6%
0
5
10
15
20
25
30
35
40
Conductproblems
Totalcompetence
Externalizingproblems
Internalizingproblems
Activitiescompetence
Totalproblems
Withdrawn/Depressed
CBCL (parent-rated)
Dark blue – compositeLight blue – sub-scales

Results: Total Cohort
13
“Borderline / Clinical” range behaviours (%)
73.3%
48.1%
36.8%
29.3%22.6% 21.7% 20.8%
0
10
20
30
40
50
60
70
80
Academicperformance
Adaptivefunction
Externalizingproblems
Totalproblems
Internalizingproblems
Aggressivebehavior
Rule-breakingbehavior
TRF (teacher-rated)
Dark green – compositeLight green - subscales

Results: Total Cohort
24%
34%
30%29%
37%
23%
0
5
10
15
20
25
30
35
40
Total problems Externalizing problems Internalizing problems
CBCLTRF
14
Composite Scores: “Borderline / Clinical” (%); Parent & Teacher)

› Prior to correction, FASD > no-FASD:- “Borderline / Clinical” range: Attention problems- Total scores:
• Social problems, Attention problems• DSM-oriented scale: ADHD
› After statistical adjustment for multiple comparisons:- No significant differences between FASD v Non-FASD:
• “Borderline / Clinical” scores• Total scores• Critical items
CBCL Results: FASD vs Non-FASD
15
Parent ratings
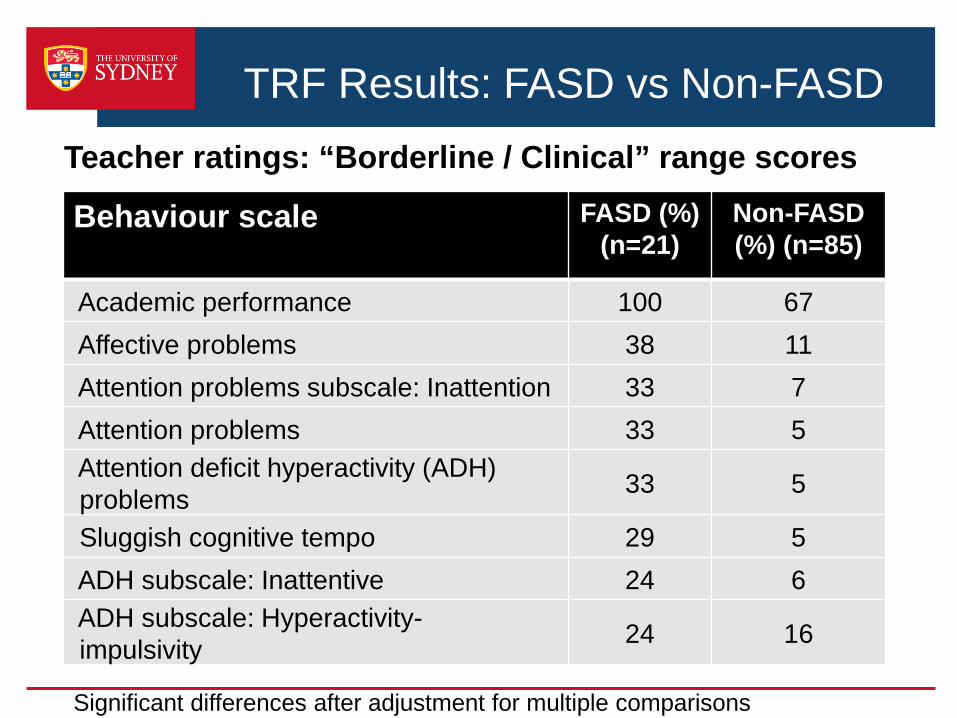
TRF Results: FASD vs Non-FASDTeacher ratings: “Borderline / Clinical” range scores
Behaviour scale FASD (%) (n=21)
Non-FASD (%) (n=85)
Academic performance 100 67Affective problems 38 11Attention problems subscale: Inattention 33 7Attention problems 33 5Attention deficit hyperactivity (ADH) problems 33 5
Sluggish cognitive tempo 29 5ADH subscale: Inattentive 24 6ADH subscale: Hyperactivity-impulsivity 24 16
Significant differences after adjustment for multiple comparisons
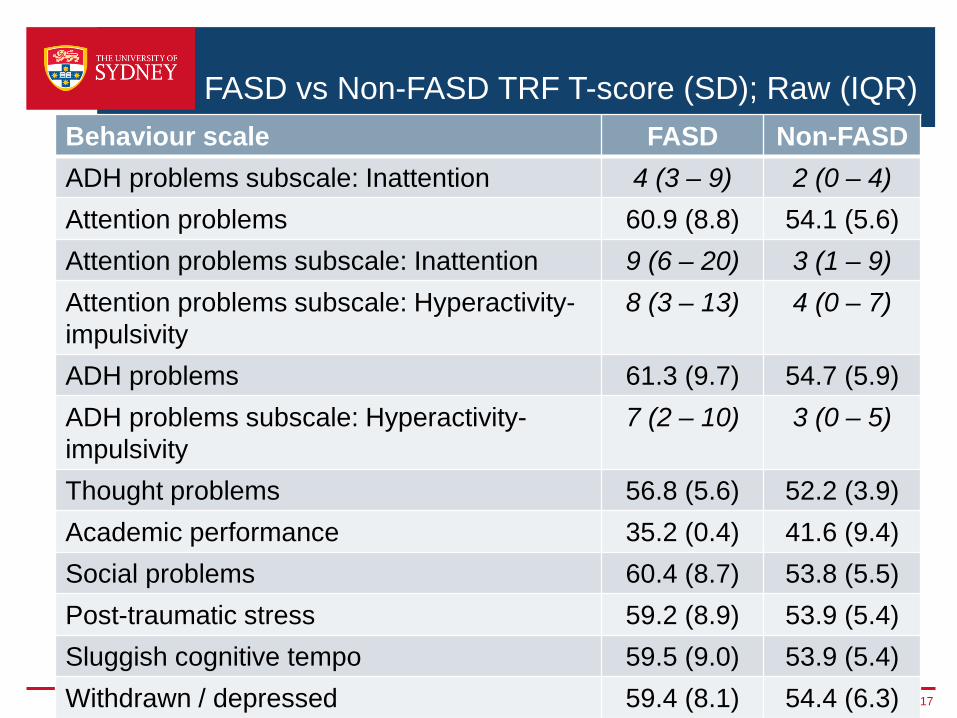
FASD vs Non-FASD TRF T-score (SD); Raw (IQR) Behaviour scale FASD Non-FASDADH problems subscale: Inattention 4 (3 – 9) 2 (0 – 4)Attention problems 60.9 (8.8) 54.1 (5.6)Attention problems subscale: Inattention 9 (6 – 20) 3 (1 – 9)Attention problems subscale: Hyperactivity-impulsivity
8 (3 – 13) 4 (0 – 7)
ADH problems 61.3 (9.7) 54.7 (5.9)ADH problems subscale: Hyperactivity-impulsivity
7 (2 – 10) 3 (0 – 5)
Thought problems 56.8 (5.6) 52.2 (3.9)Academic performance 35.2 (0.4) 41.6 (9.4)Social problems 60.4 (8.7) 53.8 (5.5)Post-traumatic stress 59.2 (8.9) 53.9 (5.4)Sluggish cognitive tempo 59.5 (9.0) 53.9 (5.4)Withdrawn / depressed 59.4 (8.1) 54.4 (6.3) 17
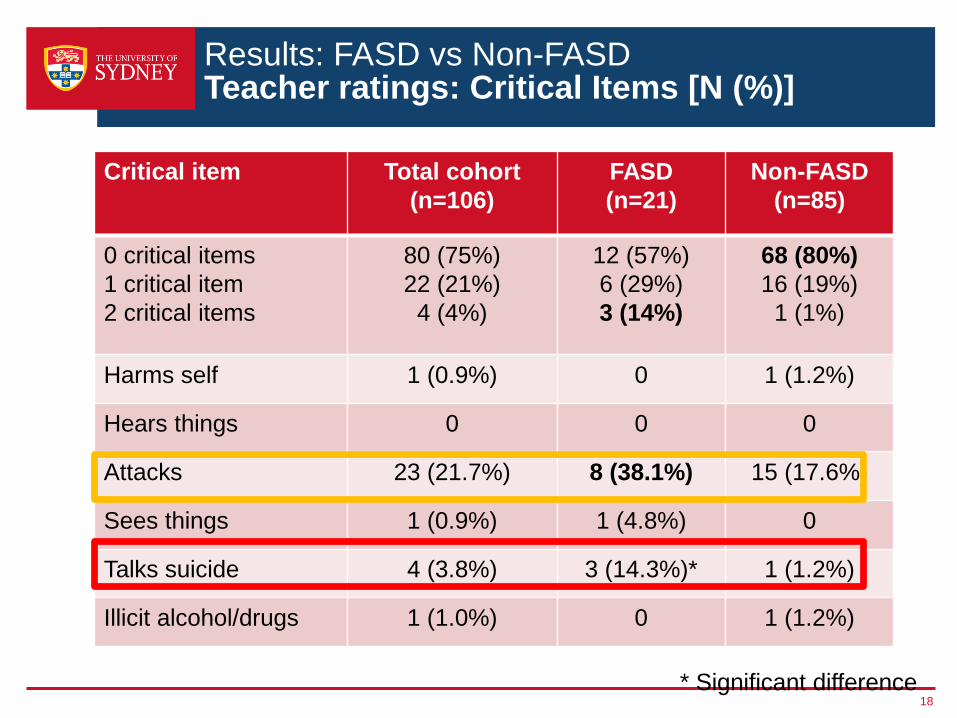
Results: FASD vs Non-FASDTeacher ratings: Critical Items [N (%)]
Critical item Total cohort (n=106)
FASD (n=21)
Non-FASD (n=85)
0 critical items1 critical item2 critical items
80 (75%)22 (21%)4 (4%)
12 (57%)6 (29%)3 (14%)
68 (80%)16 (19%)1 (1%)
Harms self 1 (0.9%) 0 1 (1.2%)
Hears things 0 0 0
Attacks 23 (21.7%) 8 (38.1%) 15 (17.6%)
Sees things 1 (0.9%) 1 (4.8%) 0
Talks suicide 4 (3.8%) 3 (14.3%)* 1 (1.2%)
Illicit alcohol/drugs 1 (1.0%) 0 1 (1.2%)
18* Significant difference
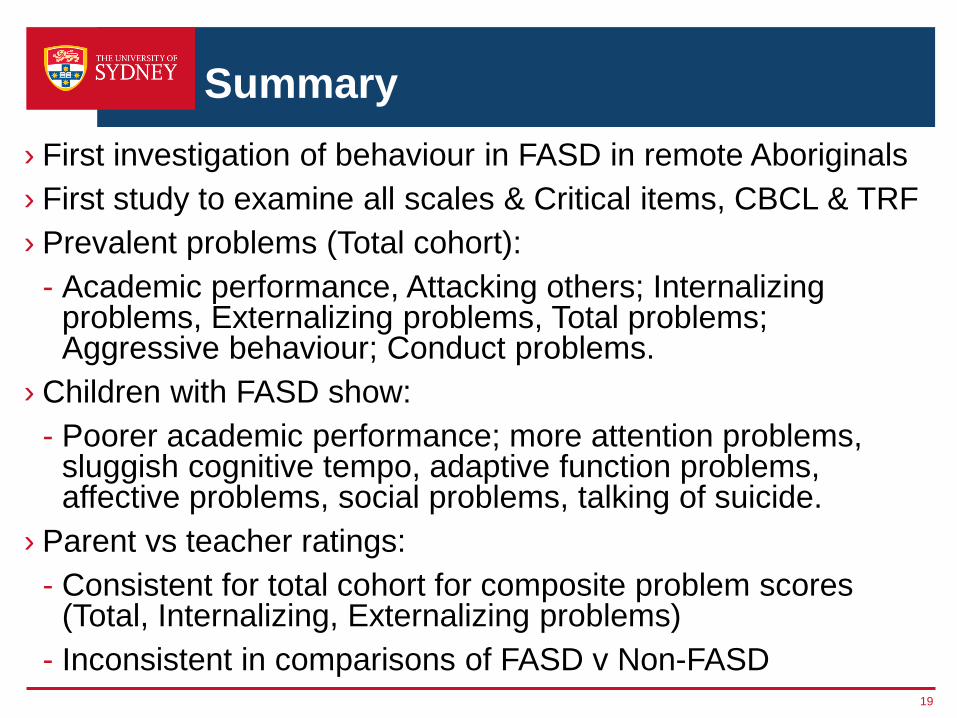
Summary› First investigation of behaviour in FASD in remote Aboriginals› First study to examine all scales & Critical items, CBCL & TRF› Prevalent problems (Total cohort):
- Academic performance, Attacking others; Internalizing problems, Externalizing problems, Total problems; Aggressive behaviour; Conduct problems.
› Children with FASD show:- Poorer academic performance; more attention problems,
sluggish cognitive tempo, adaptive function problems, affective problems, social problems, talking of suicide.
› Parent vs teacher ratings:- Consistent for total cohort for composite problem scores
(Total, Internalizing, Externalizing problems)- Inconsistent in comparisons of FASD v Non-FASD
19

For all the Family
Positive Parenting ProgramTriple P International
20 accredited Parent Coaches, 14 Aboriginal, 10 organisations