Embed Size (px)
Citation preview
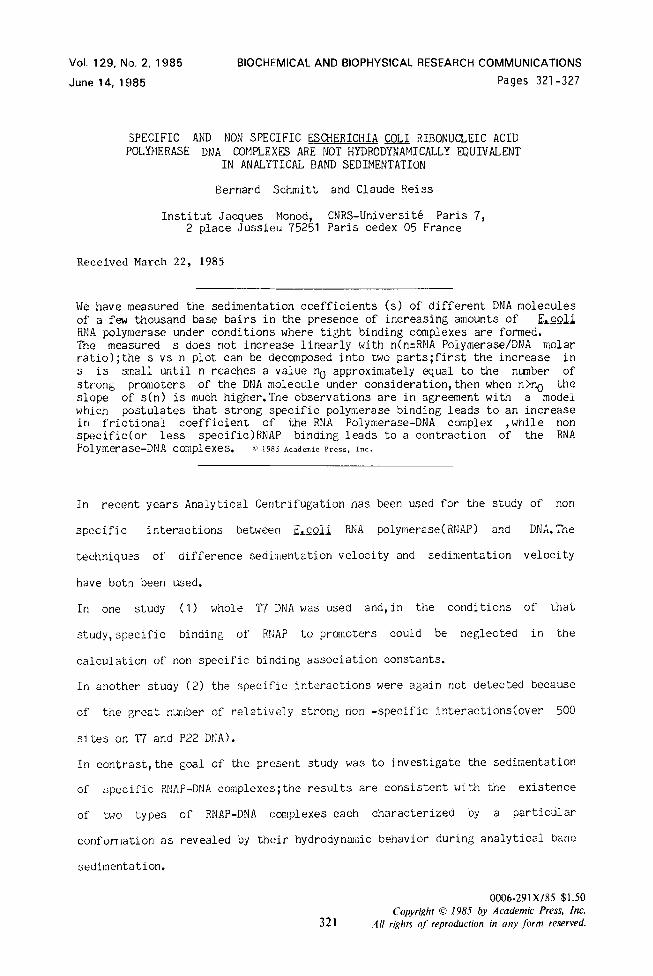
Vol. 129, NID. 2, 1985 BIOCHEMICAL AND BIOPHYSICAL RESEARCH COMMUNICATIONS
June 14, 1985 Pages 321-327
SPECIFIC AND NON SPECIFIC ESCHERICHIA m RIBONUCLEIC ACID POLYMERASE DNA COMPLEXES ARE NOT HYDRODYNAMICALLY EQUIVALENT
IN ANALYTICAL BAND SEDIMENTATION
Bernard Schmitt and Claude Reiss
Institut Jacques Monad, CNRS-Universite Paris 7, 2 place Jussieu 75251 Paris cedex 05 France
Received March 22, 1985
We have measured the sedimentation coefficients (s) of different DNA molecules of a few thousand base bairs in the presence of increasing amounts of E&Qli RNA polymerase under conditions where tight binding complexes are formed. The measured s does not increase linearly with n(n=RMA Polymerase/DNA molar ratio);the s vs n plot can be decomposed into two parts;first the increase in S is small until n reaches a value no approximately equal to the number of strong promoters of the DNA molecule under consideration, then when n>nC the slope of s(n) is much higher.The observations are in agreement with a model which postulates that strong specific polymerase binding leads to an increase in frictional coefficient of the RNA Polymerase-DNA complex ,while non specific(or less specific)RNAP binding leads to a contraction of the RNA Polymerase-DNA complexes. 3 1985 Academic Press, Inc.
In recent years Analytical Centrifugation has been used for the study of non
specific interactions between &Q& RNA polymerase(RNAP) and DNA. The
techniqu’es of difference sedimentation velocity and sedimentation velocity
have botln been used.
In one study (1) whole T7 DNA was used and, in the conditions of that
study, specific binding of REAP to promoters could be neglected in the
calculation of non specific binding association constants.
In another study (2) the specific interactions were again not detected because
of the great number of relatively strong non -specific interactions(over 500
sites on T7 and P22 DNA).
In contrast, the goal of the present study was to investigate the sedimentation
of specific RNAP-DNA complexes;tne results are consistent with the existence
of two types of RNAP-DNA complexes each characterized by a particular
conformation as revealed by their hydrodynamic behavior during analytical band
sedimentation.
0006-291X/85 $1.50 Copyright 0 1985 by Academic Press, Inc.
321 A// rights of reproduction in any form reserved.
Vol. 129, No. 2, 1985 BIOCHEMICAL AND BIOPHYSICAL RESEARCH COMMUNICATIONS
Materials and Methods
Plasmid pAT153 is described in reference (3);pAT153 was purified by the method described by flale et al. (4) with two cesiml chloride - ethidiun bromide bandings.Linear pAT153 was obtained by digestion with restriction enzyme BamHl .Supercoiled SV40 DNA was a gift from Dr E.tlayfIRSC,Villejuif,France). Native M13mp7 RF DNA was a gift from Dr G.‘Ihomas(Institut Curie, Paris,France). The purity of all the DNA was tested by agarose gel electrophoresis and band centrifugation. DNA solution concentrations were measured assuming an absorbance of 1 .O at 260 nm for a DNA co centration microgranme/ml. Molecular weights of 2.42,3.47, and 4. 8x10 g
of 50 daltons were taken
for pAT153,SV40,and Ml3 DNA respectively. RNA polymerase (RNAP)was prepared according to Burgess and Jendrisak(5) from the strain MRE600,The preparation contains at least 8O-9U 2 0 subunit as estimated from SDS gel electrophoresis;moreover , by high speed equilibriurl centrifugations we obtained a MX of 460000 daltonstmean of three measurements,data not shown) which is closed to the known holoenzyne W. The RNAP solution concentrations were calculated assuning E4z~6.5 (6).The enzyme is at least 30% active as measured by Chamber1 in’ s test(7).Abortive transcription initiation assays showed (8) that at least 4 out of 9 RNAP are active. In the centrifugation studies described here all the rwAp molecules appear able to form specific complexes.
-Formation of DNA-RNAP canplexes: DNA and RNAP were incubated 10 minutes at 37°C in the following medilpil:lO mMTRIS-HCl pH 7.9;0,05 M NaCl;lOmM MgC12 102 to 205
;O.l mM EDTA;O. ImM DTT;glycerol was depending upon the added volume of polymerase solution. After
incubation the reaction volume was diluted twice with the same incubation buffer without DTT,EDTA and glycerol The DNA concentration during the incubation i; about 56 Microgr/ml(2.4 10m8M for pAT153).
-Analytical Centrifugation: Band sedimentations (9) were performed in a SPINCO model E centrifuge.A two cell rotor and double sector band forming centerpieces was used. Filling the cells: Ten microliters of the incubation solution was deposited in one of the holes of the double sector centerpiece;the cells were secured and about 0.27 ml of the bulk solution was put into each sector;the composition of the solution was as follows: 10 mM TRIS-HCl pH 7.9;0,05 II NaC1;0.025 M M&12 ;O.l mM DTT; O.lmkl EDTA;Heavy water 5O%(V/V) ;glycerol 15%(V/V) .The M&12 concentration of the supporting solution is higher than in the incubating medium in order to avoid primary charge effects (10);hc~ever no systematic study was done to establish if lower MgC12 could be used, The density of this solution was always sufficient for convection free sedimentation.The two cells in each RIJN were used to study the behavior of two different RNAP/DNA molar ratios. The sedimentation of the DNA molecules was followed by absorbance measurements at 265 nm.At this wavelength and at the concentrations used the absorbance of the RNAP is negligible. The automatic scanner M. a. D. was used (ll).Scans were every 300 seconds for each cell and lasted for about 40 seconds.Rotation speeds were between 24 kRPM and 44 kRPM depending upon sedimentation coefficients expected.Runs were stabilized at 30°C unless stated otherwise.The first scan took place at least 45 minutes after the cells were placed in the rotor;in this way temperature equilibrium was reach,
-Measurements of sedimentation coefficients: The displacement(r) of the band absorption maximum was followed as a function of time(t).Data were entered in a linear regression program which yields the slope dlnr/dt.For the three different DNA molecules used it was observed that the measured s does not depend upon the initial concentration in the range 14- 28 microgranmes/ml. Each point on the curves s(n) represents the mean of several independent measurements.
322
Vol. 129, No. 2, 1985 BIOCHEMICAL AND BIOPHYSICAL RESEARCH COMMUNICATIONS
Increase in DNA sedimentation coefficient with binding of RNA polymerase:a simple model, We assLane that, in our conditions, during the experiment, all the RNAP molecules are bound to the DNA (see discussion). One starts from the standard equation:
where n,s s,=M,( l-pii
Mn,vn, f, are the number o t: ’
B )/Nf (1) RNAp’s in the complex, the sedimentation
coeff icien molecular weight, partial specific volLnne and frictional coefficient of the complex, respectively. V, is eva.Luated by assuming additivity of partial specific volumes:
3,=(nML~L+Mg~O)/nML+E10 (2) where VL,VO,M ,Mo are the partial specific volumes of RNAP and DNA,the molecular weight of RNAP and DNA respectively.aL=0.74 (12); vo=o.50 (13). Frcm (1) and (2) f, can therefore be easily evaluated. If one wants to simulate the increase in s assLPning that f, is constant and equal to FO, then, from equation (1):
s,=M,( 1-p&)/Nfo. (3)
Results
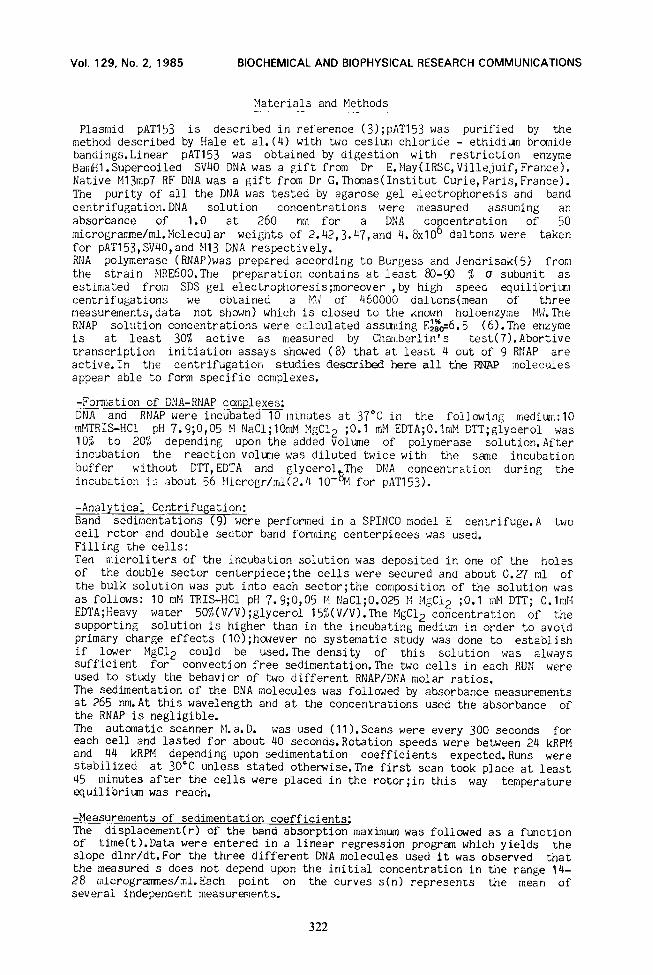
As shown in figure 1 the sedimentation coefficient of pAT153 form 1 after
incubation with increasing concentration of RNAP first increases less than
predicted by a simple model which assunes that the frictional
coefficient(F. C.) of the DNA-RNAP complex is constant and equal to that of
0 0 5 5 10 10
RNAPlDNA MOLAR RATIO RNAPlDNA MOLAR RATIO
F-re 1 :Dependence of the sedimentation coefficient(o,scale to the left),and of the frictional coefficient(m,scale to the ri&t,arbitrary units) of pAT form1 on the RNAP/DNA molar ratio.Each point represents an average of at least two independent measurements.The dashed line represents the increase in s assuming the DNA-RNAP complex frictional coefficient constant and equal to that of the naked DNA.
323
Vol. 129, No. 2, 1985 BIOCHEMICAL AND BIOPHYSICAL RESEARCH COMMUNICATIONS
unccmplexed DNA; (see materials and methods, eq 3).This small increase of s is
observed until n(n=RNAP/DNA molar ratio) equals about four, that is the number
of promoters of this plasmid (14-15 ;TetA and TetR promoters overlap and bind
only one RNAP, unpublished result from our lab. ).LJhen n goes beyona 4, s
increases more than predicted by the constant F.C. model, eq(3).
Therefore we conclude that the model assuming the F. C.constant is not suitable
for the low binding densities used in our experiments.
We thus computed f, for each n(see materials and methods) and obtained the f
vs n graph shown in figure 1 .As expected from above , f, first increases,
goes through a maximum around n=4 and then decreases.
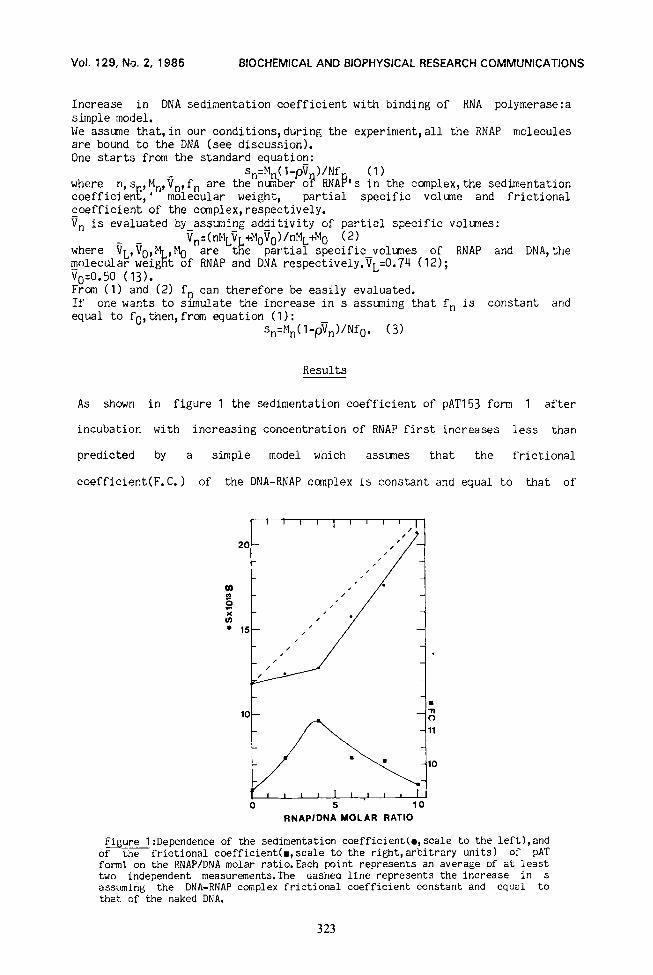
Qualitatively similar results are observed with pAT153 linearized with
restriction enzyme BamHl(see figure 2).This last result shows that the
biphasic s(n) behavior cannot be explained solely by the rather complicated
dependence of s upon the superhelix density (16).
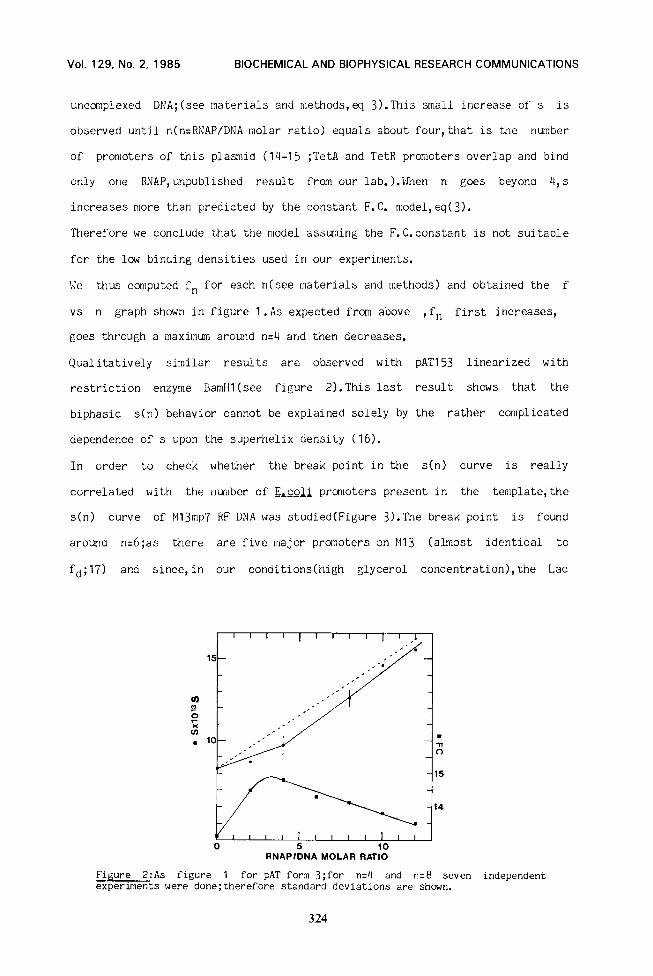
In order to check whether the break point in the s(n) curve is really
correlated with the number of E,ssli promoters present in the template, the
s(n) curve of M13mp7 RF DNA was studied(Figure 3).The break point is found
around n=6;as there are five major promoters on Ml3 (almost identical to
fd;17) and since, in our conditions(high glycerol concentration), the Lac
RNAPlDNA MOLAR RATIO
Figure 2:As figure 1 for PAT form 3;for n=4 and n=8 seven independent experiments were done;therefore standard deviations are shown.
324
Vol. 129, Nlo. 2, 1985 BIOCHEMICAL AND BIOPHYSICAL RESEARCH COMMUNICATIONS
u) $! g x 20
In . 1
/ / / / / . -I:(----- .
/
///
.
.
A’ / k / /
15 A------ .
kl , , , l/D, ;, ,1)5,, ,f:: 0 5
RNAPlDNA MOLAR RATIO
Figure 3:As figure 1 for Ml3 RF DNA.
promoter present in M13mp7 binds an RNAP,this observation strongly suggests
that here , too, the break point of the s(n) plot yields the number of rather
stable promoters born by the template.
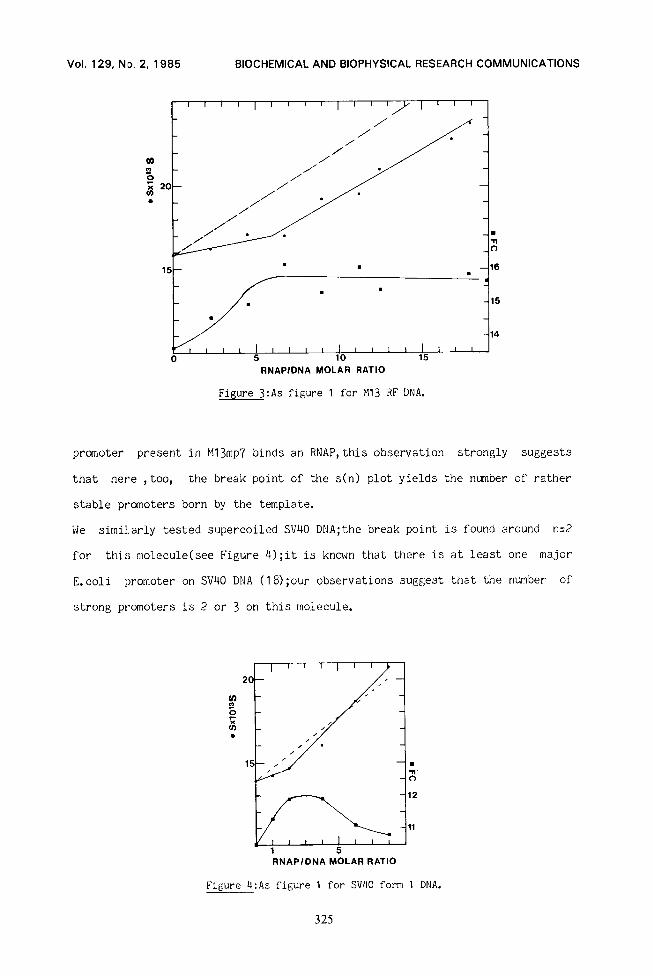
We similarly tested supercoiled SV40 DEIA;the break point is found around n=2
for this molecule(see Figure 4);it is known that there is at least one major
E. coli promoter on SV40 DNA (18) ;our observations suggest that the number of
strong promoters is 2 or 3 on this molecule.
lI”‘I”,l
y_, RNAPIDNA MOLAR RATIO
Figure 4:As figure 1 for SV40 form 1 DNA.
325
Vol. 129, No. 2. 1985 BIOCHEMICAL AND BIOPHYSICAL RESEARCH COMMUNICATIONS
Discussion
Before presenting a model to account for the biphasic s(n) curve,we want to
discuss a nunber of phenomena which may affect the interpretation of the
measurements:
-Is there free RNAP during the centrifugation?
It is known that in our binding conditions(50 mM NaCl,lO mF1 MgCl$,most if not
all RNAP molecules are bound to DNA;we have not detected free RNAP at high n
during sedimentation(no slow component detected by absorbance at 283 nm).
-1s there a pressure effect which might dissociate the complexes?
No angular velocity dependence of s(n constant) was detectedldata not shown)
in agreement with the work of Revzin and Woychik,l@l,who also did not detect
any pressure effect in the formation of non -specific complexes.
-Another possible perturbation might be the heterogeneity of our RNAP
preparation: the activity of the RNAP used in our experiments is routinely
checked in our lab and conforms to standard values; CJ content is high (see
materials and rnethods),RNAP-promoters complexes are heparin resistant, as
detected by gel electrophoresis and filtration assays;we therefore conclude
that our preparation is homogeneous ,jnd that all the RNAP molecules are bound
during sedimentation.(Even if RNAP were heterogeneous it would explain neither
the biphasic character of the s(n) curve nor the correlation observed between
the break point and the number of strong promoters borne by several
DNA’s).
B r,@&J fnr &he biPhasic behavior af GX ti GKYZ
A simple model which could account for the observation is the following:
During the incubation period the no strongest binding sites-i.e. promoters-are
first complexed. Once all the *lstrong’i promoters are occupied, less strong sites
become bound.
The first part of the titration s(n) (n<no) would then represent the highly
specific attachment of RNAP and the second part(n>no) less specific
binding(e.g.TB sites;l9).
326
Vol. 129. No. 2, 1985 BIOCHEMICAL AND EIIOPHYSICAL RESEARCH COMMUNICATIONS
From this model it can be concluded that for the four DNA’s examined some(but
not necessarily all) specific RNAP binding events lead to rather stable RNAP-
DNA compl.exes with high F.C. (frictional coefficient)conformations ;we observe
an increase of the F.C. of a few per cent per added RNAP(e.g. 5.3% for linear
pAT).With regard to the second part of the s(n) curves, the computed F. C. ‘s
decrease with n(except for Ml3 DNA);this behavior suggests a contraction of
the RNAP-DNA comp1exes;thi.s contraction may reflect in part the potentiality
of RNAP to bind,at least transiently, two distant DNA segments when not
engaged in a stable specific promoter complex;this would be an attractive
hypothesis to explain the rapid displacement of RNAP on DNA(von Hippel et
al., 1984). The decrease in F. C. is not observed for Ml3 DNA in the range of n
examined, This behavior may reflect the shorter life times of contracted
complexes due to the greater size of this DNA molecule.
Acknowledgments
L.Mallet and A. Meier of our institute grew the bacterial strains. Dr May(IRSC,Villejuif) and Dr Thcmas(Institut Curie, Paris) kindly provided SV40 and Ml3 DNA respectively. We thank all our colleagues, specially R. Ehrlich, for stimulating discussions.
References
1 .Lohnan, T. M. ,Wensley, C. G., Cina, J., Burgess, R. R. and Record, M. T., Jr( 1980)) Biochemistry 19,3516-3522.
2. Revzin, A., and Woychik, R. P. (1981) Biochemistry 20,250-256. 3.Twigg,A. I. and Sherratt,D. (1980)Nature 283,216-218. q.Hale,P.,Woodward,R.S.,and Lebowitz,J.(1983) J.Biol.Chem.258,782&7839. 5.Burgess, R. R., and Jendrisak, J. J. ( 1975) Biochemistry 14,4634-4642. 6.Burgess, R. R. (1976)in RNA Polyoerase(Losick, R., and Chamberlin, M. J. Eds)
pp69-100, Cold Spring Harbor Laboratory, Cold Spring Harbor, NY. 7. Chamberlin, M. J., Nierman, W. C. ,Wiggs, J.and Neff, N. (1979)
J. Biol. Chem.254,10061-10069. 8. Ehrlich, R., Larousse, A., Jacquet, M. J., Marin, M., and Reiss, C. (1985)
Eur. J. Biochem., in press. g.Vinograd, J., Bruner, R., Kent, R. and Weigle, J. (1963) Proc. Natl. Acad. Sci.
u. s. ii. 49,902-910. 10, Schachman, H. K. ( 159) Ultracentrifugation in Biochemistry Academic Press, New York. 11 .Cohen, R., Cluzel, J., Cohen, H., Male, P., Moignier, M., and Soulie, C. (1976)
Biophys.Chem.77,77-96. 12.Burgess, R. R. (1969) J. Biol. Chem. 244,6160-6167. 13. Cohen,G., and Eisenberg, J. (1968) Biopolymers 6,1077-l 100. 14.Stuber,D., and Bujard, H. (I 981) Proc. Natl.Acad. Sci. U. S. A.78,167-171. 15,Brosiuq J., Cate, R. L., and Perlmutter, A. P. (1982) J.Biol. Chem.257,9205-9210. 16.Upholt,W.B.,Cray,H.B.,Jr,and Vinograd,J.(1971)J.Mol.Biol.61,21-38. 17.Seeburg, P. H., Nusslein, C., and Schaller, H. (1977) Eur. J.Biochem. 74,107-113. 18. Zain. B.S., Dhar. R. ,Weissman, S. M., Lebowitz, P., and Lewis, A.M. Jr. (1973)
J.Virol.li,682-693. 1 g.Kadesch, T. R. ,Williams, R. C., and Chamberlin, M. J. (l9~)~J.Mol.Biol. 136,79-93. 20. Von Hippel, P. H., Bear, D. G., Morgan,W. D., and McSwiggen, J. A. ( 19841, in Ann.
Rev. Biochem. 53: 3 89-446.
327