Embed Size (px)
Citation preview

NBER WORKING PAPER SERIES
SPECIALTY DRUG PRICES AND UTILIZATION AFTER LOSS OF U.S. PATENTEXCLUSIVITY, 2001-2007
Rena M. ContiErnst R. Berndt
Working Paper 20016http://www.nber.org/papers/w20016
NATIONAL BUREAU OF ECONOMIC RESEARCH1050 Massachusetts Avenue
Cambridge, MA 02138March 2014
The efforts of Conti were funded by a K07 CA138906 award from the National Cancer Institute tothe University of Chicago. Berndt’s efforts were not sponsored. The funding source had no role inthe design and conduct of the study; collection, management, analysis, or interpretation of the data;and preparation, review, or approval of the manuscript for publication. The statements, findings, conclusions,views, and opinions contained and expressed in this article are those of the authors and are based inpart on National Sales Perspectives™ data obtained by the National Bureau of Economic Research(NBER) under license from IMS Health, and are not necessarily those of IMS Health, its affiliatesor subsidiaries, or the institutions with whom the authors are affiliated. We thank Ryan Conrad, DavidCutler, Judy Hellerstein, Christopher Stromberg, Marta Wosinska and participants at the October 18-19,2013 NBER/Conference on Research in Income and Wealth, “Measuring and Modeling Health CareCosts” in Washington, DC, and at the June 22-24, 2014 ASHEcon meetings in Los Angeles, for helpfulcomments. The views expressed herein are those of the authors and do not necessarily reflect the viewsof the National Bureau of Economic Research.
NBER working papers are circulated for discussion and comment purposes. They have not been peer-reviewed or been subject to the review by the NBER Board of Directors that accompanies officialNBER publications.
© 2014 by Rena M. Conti and Ernst R. Berndt. All rights reserved. Short sections of text, not to exceedtwo paragraphs, may be quoted without explicit permission provided that full credit, including © notice,is given to the source.

Specialty drug prices and utilization after loss of U.S. patent exclusivity, 2001-2007Rena M. Conti and Ernst R. BerndtNBER Working Paper No. 20016March 2014JEL No. D04,I11,I18,L11,L65
ABSTRACT
We examine the impact of loss of U.S. patent exclusivity (LOE) on the prices and utilization of specialtydrugs between 2001 and 2007. We limit our empirical cohort to drugs commonly used to treat cancerand base our analyses on nationally representative data from IMS Health. We begin by describingthe average number of manufacturers entering specialty drugs following LOE. We observe the numberof manufacturers entering the production of newly generic specialty drugs ranges between two andfive per molecule in the years following LOE, which is generally less than that observed historicallyfor non-specialty drugs. However, the existence of time-varying and unobservable contract manufacturingpractices complicates the definition of “manufacturers” entering this market. We use pooled time seriesmethods to examine whether the neoclassical relationship between price declines and volume increasesupon LOE holds among these drugs. First, we examine the extent to which estimated prices of thesedrug undergoing LOE fall with generic entry. Second, we estimate reduced form random effects modelsof utilization subsequent to LOE. We observe substantial price erosion after generic entry; averagemonthly price declines appear to be larger among physician-administered drugs (38-46.4%) comparedto oral drugs (25-26%). Additionally, we find average prices for drugs produced by branded manufacturersrise and prices for drugs produced by generic manufacturers fall upon LOE. The latter effect is particularlylarge among oral drugs. In pooled models, volume appears to increase following generic entry, butthis result appears to be largely driven by oral drugs. We discuss second-best welfare consequencesof these results.
Rena M. ContiUniversity of ChiccagoDepartment of PediatricsSection of Heamtology/Oncology5812 S. Ellis StreetChicago, IL [email protected]
Ernst R. BerndtMIT Sloan School of Management100 Main Street, E62-518Cambridge, MA 02142and [email protected]

© Conti/Berndt 2014 2
SECTION 1: INTRODUCTION
We examine the impact of generic entry on the prices and utilization of prescription drugs
between 2001 and 2007 in the United States (U.S.). Whereas previous research on the impact of loss of
exclusivity (LOE) on entry patterns and use trends following the enactment of the 1984 Drug Price
Competition and Patent Term Restoration Act (the “Hatch-Waxman Act”) has focused primarily on self-
administered oral and tablet/capsule formulations dispensed through the retail pharmacy sector, here we
focus on specialty drugs. Although there is no universally accepted definition of specialty drugs, typically
they fall into at least one of several categories: They are physician-administered parenterally or self-
administered by patients through injection, inhalation or another non-oral method; they require
specialized knowledge or manufacturing processes to reliably and reproducibly manufacture; they entail
specialty distribution channels rather than retail pharmacies; they are covered under the outpatient
medical benefit of public and private insurers rather than the pharmacy benefit; and when patent-protected
are said to have “high prices”. Among those categories, here we limit our empirical cohort to specialty
drugs commonly used to treat cancer, and base our analyses on nationally representative data from IMS
Health on monthly volume and inflation-adjusted sales revenues. This empirical focus is relevant both to
researchers and policy makers. While the market for producing cancer drugs is small compared to that of
all prescription drug manufacturing, specialty drug use is an important driver of current national
prescription drug spending levels and trends (Aitken, Berndt, Cutler 2011; GAO 2013). The potential
impact on national spending levels and trends among high-price and high-revenue cancer and other
specialty drugs expected to undergo LOE is the subject of significant policy interest (U.S. Department of
Health And Human Services OIG 2011; Conti et al. 2013).
Among pharmaceuticals, LOE opens a drug up to potential competition from multiple
manufacturers previously limited to the sole “branded” producer. Price and utilization of drugs post-LOE
have been studied extensively among non-specialty drugs (Caves et al. 1991; Grabowski, Vernon 1992,
1996; Frank, Salkever 1997; Wiggins, Maness 2004; Reiffen, Ward 2005; Berndt et al. 2003). Our paper
contributes to this literature by documenting the average number of manufacturers entering specialty
drugs undergoing LOE in the first year after patent expiration and thereafter, and by comparing raw
counts of generic manufacturer entrants to those observed among studies of specialty and non-specialty
drugs in a contemporaneous cohort (Scott-Morton 1999, 2000). However, we do not derive welfare
implications from these entry count results. Our review of the organization of specialty drug production
literature suggests the substantial presence of time-varying and unobservable contract manufacturing
practices seriously complicates and may even obviate the definition of unique “manufacturers” entering
this market.
Rather, using pooled cross-sectional and time series methods, we engage in a three-step

© Conti/Berndt 2014 3
examination of whether the neoclassical relationship between presumed price declines upon LOE and
volume increases holds among these drugs. First, we examine the extent to which estimated manufacturer
prices of the drugs undergoing LOE fall with generic entry among oral and physician-administered
(injected and/or infused) drug formulations. Second, we document raw trends in inflation-adjusted sales
revenues and utilization following initial LOE. Third, we estimate reduced form random effects models
of utilization subsequent to LOE, accounting for molecule formulation and therapeutic class and entry
patterns (Wiggins, Maness 2004). We discuss second-best welfare consequences of these estimated price
and use results, after acknowledging the presence of complications to first-best welfare calculations in
this market.
SECTION 2: UNIQUE INSTITUTIONS GOVERNING GENERIC ENTRY, MANUFACTURING
AND PRICING OF SPECIALTY DRUGS
In this section, we review unique aspects of the supply and demand for specialty drugs. This
discussion is not meant to be exhaustive, but rather is intended to provide sufficient context to motivate
our empirical approach and lay the foundation for the interpretation and discussion of our findings.
Branded and generic drug regulatory approval. Analyses of prescription drug markets distinguish two
types of drugs. Brand name (“pioneer”) drugs are approved for use in a given indication by the FDA
under New Drug Applications (NDAs) submitted by manufacturers typically based on the results of
several phase III randomized controlled clinical trials. These pioneering manufacturers are able to sell
their products exclusively while the drug is patent protected. In anticipation of patent expiration and any
other loss of exclusivity, other manufacturers apply to the FDA to obtain approval to market the “generic”
drug under an Abbreviated New Drug Application (ANDA).
FDA approval of an ANDA does not require its manufacturer to repeat clinical or animal research
on active ingredients or finished dosage forms already found to be safe and effective. Rather, to gain
approval the manufacturer submitting the ANDA must only establish that the generic contains the same
active ingredients; be identical in strength, dosage form, and route of administration; be bioequivalent;
and be manufactured under the same strict standards as the brand-name pioneer drug. When submitting an
ANDA, the manufacturer provides evidence either substantiating bioequivalence and compliance with
current good manufacturing practices (cGMP) at its own manufacturing sites, or else indicates that
portions of the manufacturing (such as production of active pharmaceutical ingredients (APIs) or final fill
and finish production) will be outsourced to another supplier or contract manufacturing organization
(CMO). The FDA is responsible for enforcing ANDA requirements and current cGMP standards among
generic manufacturers both upon entry and via subsequent periodic routine inspections.
Production
© Conti/Berndt 2014 4
facilities may be inspected and certified post-approval to verify they meet FDA requirements, including in
particular specific lines, vats and batches; typically inspections occur every 18-36 months per facility. For
oral tablets and capsules, the direct costs of ANDA applications are modest ($1-$5M) compared to
potential profitability (Berndt, Newhouse 2013). Not much is known regarding the direct costs of
obtaining ANDA approvals among infused or injected drugs.
Supply conditions. What is known is that the manufacturing technology involved in the production of
infused or injected drugs is highly specialized. Sterility is particularly important for these drugs,
providing the primary challenge related to their manufacturing, packaging and distribution. Sterile
production requires keeping human operator intervention to a minimum, accomplished by separating or
removing highly trained and skilled employees from the aseptic clean air and water environment.
Contamination can involve pathogens, fragments of vial rubber stoppers and broken glass. Because
manual steps create opportunities for contamination, automated processes for the filling and finishing of
these products are desirable. Unlike most capsules and tablets, liquid APIs are the base materials for
production of these drugs. Risk of contamination is also important in the sourcing of API. API is
typically sterilized using filtration, with the sterile product then held in an aseptic storage tank until it is
used for final “fill and finish” ANDA production.
An implication is that even though regulatory barriers to entry among manufacturers of these
drugs are likely rather modest, the small market size and high fixed and variable production costs of at
least some specialty drugs likely results in modest entry post-LOE, with production being concentrated
among specialized manufacturers. Evidence in support of this market characterization is derived from
multiple sources. From industry sources, it is clear manufacturers with noted current commitments to the
production of specialized injected or infused drugs for the domestic market include Hospira, Teva
Pharmaceuticals and Teva Parenteral ME, Baxter and Fresenius (APP) (EMD Serono 2013; PBMI 2014).
Furthermore, only a handful of injected or infused generic drug manufacturers produce their own liquid or
lyophilized API (Teva, Sandoz, Watson) with the remaining manufacturers acquiring it from non-
affiliated producers. Adding some measure of confidence to our characterization, we note these
observations are consistent with previous empirical work on generic entry into these markets, suggesting
the mean number of approved ANDA manufacturers of injected or infused specialty drugs ranges
between 2 and 5, compared to the 5-15 ANDA manufacturers of oral drugs undergoing LOE 1984-1994
in the U.S. (Scott-Morton 1999, 2000; Aitken et al. 2013) and among oral drugs undergoing LOE in Japan
2004-2006 (Iizuka 2009).
Another important characteristic of the market for injected or infused drugs is that a number of
prominent manufacturers hold ANDAs for their own drugs and simultaneously act as contract
manufacturers for others (e.g., Hospira, Boehringer Ingelheim, Luitpold, Fresenius/APP, West-Ward)

© Conti/Berndt 2014 5
(FDA 2011; Conti 2014). For example, one notable manufacturer of many generic injectable drugs, Ben
Venue, was (until very recently) the CMO subsidiary of Boehringer Ingelheim of Germany. There are
likely significant cost efficiencies gained from outsourcing the production of injected or infused drugs to
established CMOs. To the extent that they are able to exploit economies of scope and scale, CMOs can
offer their services at a cost lower than that incurred by self-manufacturing. Moreover, because of scope
economies, CMOs face incentives to expand the portfolio of products they produce, but they can also take
advantage of scale economies, producing the same injected or infused drug for different ANDA
manufacturers (Macher, Nickerson 2006). A recent report (FDA 2011) documents more than a doubling
of manufacturers relying on CMOs among branded and generic drugs worldwide 2001-2010. Yet, these
statistics require independent verification. The FDA does not make public a list of which CMOs
manufacture a given drug. As far as we are aware, this information is not made available publicly by any
other regulatory agency nor by any private data vendor. Thus, the importance of contract manufacturing
for drugs supplied to the U.S. market generally (both specialty and non-specialty) and our sample of drugs
specifically is unobservable by researchers, stakeholders and regulators. This point fundamentally casts
doubt on the validity of simple manufacturer counts, as well as on the interpretation of manufacturing
count entry models of any and all generic drugs, and has further implications for policy makers charged
with monitoring competition in this market.
Information and Regulatory Timing. The FDA does not publicly reveal when it receives an ANDA,
nor the identity of its applicant. In this sense, the limited information regarding the entry process is
symmetric and simultaneous among potential applicants. However, manufacturer officials might
announce their entry plans to inform their shareholders. Scott-Morton (1999) suggests such
announcements may be used to deter other competitors from entering the market. Although a
manufacturer may announce its intentions to enter the supply of a particular molecule for the domestic
market, there is no guarantee that FDA approval will be granted in the time frame anticipated by the
applicant. Consequently, a manufacturer who submits an ANDA cannot generally credibly commit to a
market with its application announcement alone.
Supporting this view, a review of recent trends suggests the timing of ANDA approval has
become more variable for applicants 2001-2011 and, consequently, less predictable (Parexel 2013). While
the number of original total ANDA approvals has increased substantially, from 132 in 2001, 392 in 2007,
to 422 in 2011, the number of original injectable ANDA approvals also increased from 32 in 2001 (24.2%
of total), 64 in 2007 (16.3% of total), to 88 in 2011 (21% of total). Mean (median) FDA ANDA review
times initially fell from 21.1 (18.1) months in 2001 to 19.9 (15.7) months in 2004, but then increased to
21.4 (18.9) months in 2007 and 32.9 (29.5) months in 2011. The number of backlogged pending ANDAs
under FDA review increased sharply during this period, from 374 in 2001 to 615 in 2004, 1,309 in 2007

© Conti/Berndt 2014 6
and 2,693 in 2011.
Entrant terminology. In light of this transparency concern, it is important to define an “entrant” into a
generic drug market segment after LOE using the terminology conventions of the FDA. A “sponsor” is a
firm who submits a new drug application (NDA) for a branded small molecule drug or a biologics license
application (BLA) for a novel, branded biological-based drug, or an ANDA. An application holder is a
firm who “holds” the NDA, BLA or ANDA; “sponsors” become “application holders” once the
application is approved by the FDA. “Manufacturers” are companies that produce the NDA, BLA, or
ANDA. It is possible for the manufacturer to not be the “application holder” in the event that
manufacturing of the drug is contracted out to another vendor.
When a NDA, BLA or ANDA is approved by the FDA it is assigned a unique, three-segment
number, the “National Drug Code (NDC)”, which serves as a universal product identifier for drugs, based
on The Drug Listing Act of 1972.1 The FDA publishes the listed NDC numbers and the information
submitted as part of the daily updated listing information in the NDC Directory. The manufacturer
identified in the NDC, is called the “NDC labeler”. The NDC labeler can be the NDA, BLA or ANDA
application holder, the contract manufacturer, the repackager, or the compounder of the drug.
Given available data and transparency concerns discussed above, our operative definition of
generic “manufacturer” after LOE is the drug’s “labeler” excluding repackagers. We describe how we
identify and exclude repackagers in the empirical methods section.
Drug Shortages. Since 2006, the U.S. has experienced a marked increase in prescription drug shortages.
Three-quarters of shorted drugs in 2011 were sterile injectable products, such as chemotherapy,
anesthesia and anti-infective agents (U.S. Department Of Health And Human Services, ASPE 2011;
Woodcock, Wosinska 2013) and over 80% had lost patent protection, experienced generic entry and
consequently were (in theory) multi-sourced by competing generic drug manufacturers. The majority of
generic specialty drug shortages initially appeared around 2009 and thereafter. These shortages have
raised considerable alarm since the welfare consequences for pediatric cancers and discontinuation of
clinical trials are presumed to be disproportionately high (Gatesman, Smith 2011; Wilson 2012). The
University of Utah Drug Information Service (UUDIS) tracks the number of shortages at the end of each
quarter. Recently they reported that over the past five quarters the number of shortages was at the highest
level since the beginning of 2010. This growth is primarily due to the unusual persistence of existing
shortages rather than growth in the number of new shortages (Goldberg 2013).
The proximal causes of most domestic drug shortages are also clear. Beginning around 2009-
2011, routine FDA certification inspections uncovered significant lapses in maintenance of facilities that
1 See Section 510 of the Federal Food, Drug, and Cosmetic Act (Act) (21 U.S.C. § 360.

© Conti/Berndt 2014 7
produce the fill and finished dosage of the drug among many manufacturers (Woodcock, Wosinska 2013).
Various inspections investigating suspected lapses in manufacturing practices resulted in the closure of
other “fill and finish” facilities (Ben Venue and American Regent in 2010 and Ranbaxy in 2014) and API
manufacturers (Ranbaxy in 2014). Current policy efforts to mitigate shortages have largely focused on
improving the FDA’s capabilities to respond to the crises (FDA 2013).
Supply and demand side prices. Among physician-administered injected and infused specialty drugs,
the acquisition price of the drug paid by the provider (the price received by the supplying manufacturer –
“supplier prices”) may differ substantially from the insurer reimbursement received by the provider
(“demand side” prices). This divergence is largely due to Medicare and commercial insurers’
reimbursement policies that imperfectly reflect these drugs’ actual acquisition costs.
On acquisition prices, NDA, BLA and ANDA manufacturers (and in some cases, drug catalog
publishers) set the wholesale acquisition cost (WAC) of a given drug. Wholesalers, retail pharmacies and
other purchasers generally acquire branded drugs from manufacturers at a modest discount off WAC
(commonly a 1-2% prompt payment discount); generic drugs are typically discounted much more heavily
off of WAC. Additional discounts from wholesalers or from manufacturers negotiated by retail
pharmacies, by pharmacy benefit managers (PBMs) or by group purchasing organizations (GPOs) on
behalf of their members may be directly related to a purchaser’s volume or share of a drug within a
therapeutic class and also over a bundle of drugs (Frank 2001). ANDA manufacturers of oral drugs can
compete intensively on price to win GPO or PBM contracts. Generally, orally formulated anti-cancer and
selected other specialty drugs are less prone than others to these acquisition price negotiations because of
the lack of perceived therapeutic substitutes (EMD Serono 2013; PBMI 2014). Physician-administered
infused and/or injected drugs may not be prone to acquisition cost discounts related to preferred
formulary and/or copayment status arrangements at all, but may be subject to volume based purchaser
discounts. In addition, purchasers of specialty oral and injected/infused drugs can be eligible for federally
mandated “best price” rebates off average manufacturers’ price (AMP) for Medicaid insured patients,
similar to non-specialty drugs. AMP is essentially the average price wholesalers and certain pharmacies
pay for drugs distributed to retail community pharmacies (U.S. Department of Health and Human
Services OIG 2010).
Qualified outpatient hospital-based clinics, affiliated community-based clinics and contract
pharmacies are also able to purchase oral and injected/infused drugs directly from manufacturers or
wholesalers (but not via GPOs) at the federally mandated 340B discounted price off AMP. 340B prices
for branded drugs must be at least 23.1% discounted off of the AMP, but actual negotiated 340B prices
are frequently lower than the 340B ceiling price (GAO 2011). Consequently, discounts through the 340B
program have become a prominent part of supplier prices in the specialty and non-specialty drug market.

© Conti/Berndt 2014 8
A recent analysis by Drugchannels.com (2014) suggests drug purchases under the 340B drug discount
program have grown by 800%, from $0.8 billion in 2004 to $7.2 billion in 2013. In 2013, hospitals
received 340B discounts on at least 25% of their drug purchases, compared with only 3% in 2004.
Insurers reimburse the use of the specialty drugs in two ways: via the pharmacy benefit (oral
specialty drugs, similar to that of non-specialty oral drugs) or the outpatient medical benefit (all
physician-administered injected and infused drugs and a small number of oral drugs). Commercial
insurers also provide coverage for Medicare insured individuals obtaining drugs covered under the
pharmacy benefit (“Part D”). Commercial insurers that provide Part D coverage for prescription drugs are
required to cover all drugs in six protected classes, one of which is anticancer drugs. This protection
requires commercial insurers to offer pharmacy benefits to Medicare beneficiaries that includes all
available anti-cancer drugs, with limited supply side access controls. Reimbursement for pharmacy
benefit covered drugs is generally considered to reflect acquisition costs (albeit imperfectly), other than
the discounts obtained through the 340B program (PBMI 2014).
Medicare, the public insurance program providing virtually universal coverage to adults age 65
and older, is the most prominent payer for drugs covered under the outpatient medical benefit (“Part B”)
(i.e. largely infused and/or injected specialty), followed by commercial insurers and then state Medicaid
agencies (MedPAC 2006). By law, neither Medicare nor Medicaid can consider drugs’ cost or cost-
effectiveness in coverage decisions (Neumann 2005). Consequently, Medicare and Medicaid cover all
newly approved specialty drugs. Indeed, drugs to treat cancer accounted for a majority of Part B drug
spending in 2004. While in theory private payers have more leeway to set coverage policies, de facto
coverage (and reimbursement) policy for most specialty drugs follows that of Medicare’s policies
(Clemens and Gottlieb 2013).
Prior to 2006, Medicare reimbursed providers for purchasing and administering physician-
administered specialty drugs as a percentage of the Average Wholesale Price (“AWP”, a list price): 95%
from 1998 to 2003 and 85% in 2004. Enacted as part of the 2003 Medicare Drug Improvement and
Modernization Act (MMA), Medicare instituted a new average sales price (ASP) payment system
intended to more closely reflect actual acquisition prices than AWP but with two notable exclusions:
Medicaid best prices and rebates, and 340B discounts. Effective January 2006, Medicare changed
reimbursements for Part B drugs to the manufacturers’ national ASP two quarters prior plus a 6% markup
(Jacobson, Alpert, Duarte 2012). The 2011 Budget Control Act reduced Medicare Part B reimbursement
effective April 1, 2013, from ASP+6% to ASP+4.3%, where it remains currently. Recent industry reports
suggest commercial insurance reimbursement may be more generous than ASP+4.3% (PBMI 2014).
These MMA policies were responses to the widely recognized fact that reimbursement for many
physician-administered specialty drugs covered under outpatient medical insurance benefits had been well

© Conti/Berndt 2014 9
in excess of their acquisition prices. Indeed, hospitals, many provider groups and specialty pharmacy
outlets profit from the gap between drugs’ acquisition price and reimbursement by insurers and patients,
often termed the “spread” (U.S. GAO 2004; Barr, Towle, Jordan 2008; Barr, Towle 2011, 2012; Towle,
Barr 2009, 2010; Towle, Barr, Senese 2012). According to the GAO, prior to 2006 many drugs were
available for purchase by provider groups at acquisition prices averaging 13-34% below their AWP, while
others – particularly generics -- were acquired at even significantly lower prices, largely due to PBM and
GPO pricing negotiations. Due to statutory provisions, the spread can be substantial among drugs
purchased under 340B discounts and Medicaid rebates for eligible patients.
By setting the ratio of drug reimbursement to ASP+6% through 2012 and ASP+4.3% thereafter,
the MMA reform generated the largest reimbursement decline for physician-administered drugs in
Medicare’s history. For oncology drugs, the policy change represented a marked decline from the
weighted average reimbursement-to-cost ratio of 1.22 in 2004, and an even larger decline relative to the
years prior to the passage of the MMA when the AWP rather than ASP was used as the benchmark to
measure costs (U.S. GAO 2004). Jacobson et al. 2010 plot payment rates for drugs commonly used to
treat lung and other solid tumor cancers; they observe the payment change due to the MMA to be very
dramatic for some drugs. However, the changes were heterogeneous, with some drugs facing no change
and others even a slight increase.
Nevertheless, a 2006 survey of oncologists suggests those practicing in selected outpatient
settings obtained 70 to 77% of their practice revenues from drug payments (Akscin, Barr, Towle 2007).
Later surveys using 2009-11 data report over 50% of outpatient oncology practice revenues continued to
be derived from the spread between drug acquisition costs, insurer reimbursements and patient payments
(Towle, Barr 2009, 2010; Towle, Barr, Senese 2012). Due to these payment incentives, many outpatient
specialty physicians, notably oncologists, report that they face financial incentives to administer
chemotherapeutics with high “spread” (Malin et al. 2013). In addition, various studies suggest
oncologists’ drug choices are responsive to profit margins. Conti et al. (2012) found that the use of
irinotecan decreased following patient expiration even though the price dropped by more than 80%,
possibly reflecting declines in the spread between the reimbursement level and oncologists’ acquisition
cost. Jacobson et al. (2006, 2010, 2012) report that oncologists switched away from drugs that lost the
most margin after MMA reform implementation and towards expensive drugs favored by the equalized
6% mark-up across all drugs.
SECTION 3: THE MODEL
In this section, we outline our empirical models of ANDA entrants as well as pricing and
utilization effects among specialty drugs following LOE, grounding them in theoretical considerations.

© Conti/Berndt 2014 10
3.1 Theoretical considerations and empirical findings for entry models. Classic economic
theory has much to say about entrants’ short-run decisions to invest in their capability to produce an
undifferentiated product, in the context of their cost, demand and marginal revenue curves (Pindyck,
Rubinfeld 2013). Notably, when the supply of production inputs is constrained and/or there are
substantial fixed costs of entry, entry may be more limited than assumed in classical models (Tirole 1988;
Mankiw, Whinston 1986; Bresnahan, Reiss 1988, 1991; Berry 1992). Berry and Reiss (2007) describe
reduced form and structural models where for any given product market, the number of entrantss is a
function of their fixed entry costs that may differ among entrants based on their scale and scope, and
potential revenues related to the demand elasticity for this product relative to available substitutes and
other production opportunities.
In the pharmaceutical market context, a number of empirical studies have relied on this
intuition to study entry after a drug’s LOE. Reiffen and Ward (2005) examined generic entry using data
on 31 drugs experiencing LOE in the late 1980s and early 1990s. They find that more generic entrants
enter and enter more quickly into markets when expected profits are greater. Scott-Morton (2000)
conducted a market level analysis of 81 drugs undergoing LOE between 1986 and 1992, and found that
drugs that have higher pre-patent expiration revenues and that are used to treat highly prevalent chronic
diseases experience greater generic entry. Scott-Morton (1999) examined entrant characteristics
associated with generic entry decisions. Among drugs undergoing patent expiration between 1984 and
1994, she finds a generic entrant’s previous experience with a given type of drug formulation and
therapeutic class increases the probability of similar subsequent generic entry. This work and others (Kyle
2006; Grabowski, Vernon 1992, 1996) suggest drug manufacturing economies of scope may be an
important determinant of entry decisions. Outside the U.S., Iizuka (2009) examines the relative
importance of drug reimbursement policies on the number of generic entrants in Japan between 2004 and
2006. She finds fewer generic entrants when the drug is subject to administrative pricing policies (drugs
commonly used in the hospital) compared to those that are not (drugs commonly dispensed in the
outpatient setting).
Based on this literature, we implement descriptive reduced form count models to examine
molecule-specific, industry- and entrant-level determinants in the specialty drug market. The base model
we estimate is of the following general form:
(1) Mancount(entrantsk)=F(Zkδ + Xiβ)
where Mancount is the number of entrants having an approved ANDA for a given molecule, Zk is a
matrix of characteristics of drug market k that affect market size, while Xi is a matrix of entrants or
molecule characteristics that predict the fixed cost of entry for entrant i into market k. Holding all else

© Conti/Berndt 2014 11
equal, we expect to observe more entrants wanting to enter a market as potential market size increases and
less entrants into drug markets where the manufacturing technology needed for production is highly
specialized and entails large fixed costs. We assume regulatory cost differences among molecules are
small and that we can control adequately for different manufacturing techniques for different product
groups (Wiggins, Maness 2004; Caves et al. 1991; Grabowski, Vernon 1992, 1996). Year and year
squared enter the model to help control for changes in regulatory and other fixed cost differences.
As discussed in the Background section, the 2003 MMA altered reimbursement and benefit
policy between 2004 and 2006 for many drugs in our sample, and therefore may have affected specialty
market entry patterns (Iizuka 2009). Specifically, provisions of the MMA: (1) lowered Medicare
reimbursement for Part B drugs from 95% of AWP to 85% of AWP effective January 2004 (“MMA1”),
(2) provided Medicare coverage to pharmacy dispensed, largely orally formulated drugs in January 2006
(Medicare Part D) (“MMA2”), and (3) instituted the new ASP+6% payment scheme in January 2006
(“MMA2”). To mark these events, we define two 0-1 indicator variables MMA1 and MMA2 that take on
the value of one after January 2004 and January 2006, respectively. We also create interaction variables
MMA1*Part B and MMA2*Part B defined as the product of the MMA indicator variables and whether
the molform was covered by Part B. We include these dummies in our entrant count models.
Furthermore, while the MMA1 and MMA2 policies targeted all drugs covered under Part B, the
impact of these changes varied across drugs depending on the magnitude of the payment changes.
Following Jacobson et al. (2010, 2012), for each drug j, we compute the absolute value of the percentage
change in reimbursement just before vs. after the MMA1 reform, and call the variable “MMA1bite”:
where is the Medicare payment in quarter 1 of 2005 (based on ASP) for drug and
is the Medicare payment in quarter 4 of 2004 (95% of AWP); this variable takes on
identical non-zero values in 2005Q1 and thereafter, and is zero before 2005Q1. We focus on this one-
quarter change for the first reform because it is plausibly exogenous to manufacturer supply decisions.
However, as noted earlier, we do not use these measures to derive welfare implications of entry
under existing and alternative policy regimes (similar to that pursued by Berry (1992) and Berry and
Reiss (2007)) given the host of agency, information and moral hazard issues plaguing health care markets.
Rather, as described in further detail below, we indirectly examine the welfare implications of LOE
among these drugs by examining whether the neoclassical relationships among presumed price declines
upon LOE and generic entry and volume increases hold.
3.2 Theoretical considerations -- price and use models. A number of empirical studies have
relied on the framework proposed by Bresnahan and Reiss (1991) among others (Caves et al. 1991;

© Conti/Berndt 2014 12
Grabowski, Vernon 1992, 1996; Frank, Salkever 1997; Wiggins, Maness 2004) to examine the
relationship between product prices and the number of manufacturers. This framework posits a Cournot
quantity setting model or an entry threshold model (Bresnahan, Reiss 1991), predicting prices should
initially fall quickly and then steadily, gradually approaching marginal cost as additional entry occurs.
Bresnahan and Reiss (1991) examined prices for dentists, auto repair shops and the like in geographically
isolated county seats. They found prices decline significantly when the supplier count moves from two to
three entrants, with an even larger price impact observed moving from three to four entrants, but smaller
price impacts from subsequent entry; thus they conclude that frequently it requires only three or four
entrants to approximate competitive conditions in these markets. They also find a significant difference
between price estimates in concentrated county seats and unconcentrated urban markets, suggesting local
product market conditions are important in determining price declines. Similarly, Wiggins and Maness
(2004) find continuing price declines among drugs undergoing LOE as the number of manufacturers
becomes large (more than five competitors). Reiffen and Ward (2005) find that generic drug prices fall
with increasing number of competitors, but remain above long-run marginal costs until there are eight or
more competitors. They also find the size and time paths of generic revenues and the number of entrants
is greatly affected by expected market size.
Several other authors have reported very small changes in price associated with entry into drug
markets after LOE and even price increases in some drug markets (Caves et al. 1991; Grabowski, Vernon
1992, 1996). Frank and Salkever (1992) developed a theoretical model to explain the anomaly of rising
branded prices in the face of generic competition. Their model posits a segmented market where two
consumer segments exist – a quality conscious brand loyal segment that continues to buy the established
branded drug after generic entry and a price-conscious segment that is less brand loyal. Frank and
Salkever (1997) report that branded prices rise and generic prices fall in response to LOE and generic
entry. Ellison et al. (1997) and Griliches and Cockburn (1994) also find that average branded anti-
infective prices rise with generic entry; Ellison et al. (1997) and Aitken et al. (2013) report similar
findings. Notably, in all these studies, oral (not infused or injected) formulations constitute the vast
majority of post-LOE entrants.
We draw on this literature to establish the plausibility of the presumed price drop following LOE
among generic specialty drugs. Specifically, we first examine the relationship between supplier prices
received by entrants (inflation-adjusted monthly total sales revenues/total standard unit use) and the
number and nature (branded vs. generic) of entrants supplying the market (Caves et al. 1991; Grabowski,
Vernon 1992, 1996; Frank, Salkever 1997; Wiggins, Maness 2004; Reiffen, Ward 2005). We then
examine the extent to which supplier prices of the generic drug across entrants fall with generic entry,
using the following Cournot model:

© Conti/Berndt 2014 13
(2) P*(n) = (a + cN) /(N+1)
in which we assume a roughly linear relationship between price and the inverse of the number of sellers.
Like others, here we assume that at any given point in time the number of approved manufacturers, N, is
exogenously determined reflecting FDA approval and decision timing uncertainty, as well as documented
variability over time in the number of ANDA backlogs (Ellison et al. 1997; Scott-Morton 1999; 2000;
Wiggens, Maness 2004).2
We then estimate reduced form models of utilization after generic entry as the “dual” of the
Cournot model of price competition in Equation 2 (Grabowski, Vernon 1992, 1996; Berndt et al. 2003;
Knittel, Huckfeldt 2012) using generalized least squares.3 We estimate random effects regression models
that quantify the importance of drug-specific demand and cost differences in influencing the use-supplier
relationship (Wiggins, Maness 2004) having the following form:
(3) ln Υkt= α + βt + κZk + θPostkt + εkt
where Υkt is the utilization volume of drug k at month t, α is a constant, βt are time fixed effects capturing
general changes in specialty drug demand, and κZk are effects from the characteristics of the molecule.
The variable Postkt is an indicator variable denoting generic entry month-year for each molecule
experiencing post-LOE generic entry in the sample. Positive estimates of θ suggest volume increases
post-LOE (presumably reflecting increased quantity demanded from lower average molecule price post-
LOE), whereas negative estimates suggest utilization declines post-LOE.
To interpret the hypothesized possible result (finding that θ<0 in Equation (3)) we include in one
specification whether LOE has an independent and negative effect on usage among physician-
administered drugs after LOE, all else equal. In addition, LOE should act to induce institutional
consumers to shift their demand away from low-cost generic specialty drugs towards high-priced branded
alternatives when the drug is covered under insurers’ outpatient medical benefit (where the absolute value
of insurer reimbursement would be greater, holding all else constant) (Jacobson et al. 2010, 2012; Conti
et al. 2012). We identify these independent effects on use by including in the model the variables that
capture Medicare coverage in Part B and the MMA reimbursement and coverage changes outlined above.
2 We must make this assumption for another reason. Only ANDA holders who were awarded “Paragraph IV” status
in 2004 and thereafter are publicly listed by the FDA. See:
http://www.fda.gov/Drugs/DevelopmentApprovalProcess/HowDrugsareDevelopedandApproved/ApprovalApplicati
ons/AbbreviatedNewDrugApplicationANDAGenerics/ucm047676.htm. ANDA holders who were unsuccessful in
their Paragraph IV certifications are not publicly available; nor is the timing of the Paragraph IV application process,
irrespective of award status. 3 Duggan and Scott-Morton (2010) and Berndt and Aitken (2011) have found significant volume increases related to
policy changes that act to decrease drug prices to consumers.

© Conti/Berndt 2014 14
SECTION 4. DATA AND DESCRIPTIVE TRENDS
We obtained national monthly data on the use volume and retail and non-retail dollar sales of all
specialty drugs by distributor from IMS Health Incorporated’s National Sales Perspectives™ (NSP)
database between January 2001 and December 2007. NSP data have been used in numerous published
studies of pharmaceutical revenues and volumes. NSP data derive from a projected audit describing 100%
of the national unit volume and dollar sales in every major class of trade and distribution channel for U.S.
prescription pharmaceuticals. The NSP sample is based on over 1.5 billion annual transactions from over
100 pharmaceutical manufacturers and more than 700 distribution centers. NSP provides information on
the molecule-specific chemical and branded names, route of administration, strength and the name of
labeller. Each labeller-molecule-formulation (“molform”) is uniquely identified in the dataset using the
drug’s NDC code; molform is the basic unit of analysis for all the main models. We also were able to
uniquely identify labeller-molecule-formulation-strength using the drug’s 11-digit NDC. This measure,
“molform strength”, is used in sensitivity analyses.
“Dollar sales” measures the amount of funds retail pharmacies, mail pharmacies, non-federal
hospitals, federal facilities, long-term care facilities, clinics, home healthcare facilities, and miscellaneous
facilities spent on a drug acquired from entrants and drug wholesalers. The prices reflected in this sales
measure are the actual invoice prices outlets (e.g., pharmacies, hospitals, clinics) pay for the products,
whether purchased directly from an entrant or indirectly via a wholesaler or chain warehouse. Invoice line
item discounts are included, but prompt-payment discounts and bottom-line invoice discounts are not
included. Rebates, typically paid by the manufacturer directly to a customer, insurer, or PBM, are not
reflected in these data. Dollar sales are converted into 2012 U.S. dollars using the Consumer Price Index
all urban inflation calculator. “Extended units” measures the number of single items (such as vials,
syringes, bottles, or packet of tablets/capsules) contained in a unit or shipping package purchased by
providers and pharmacies, but may include varying available doses and strengths.
Our NSP data covers the following ten World Health Organization’s four-digit cancer-related
anatomic therapeutic classes (ATCs): anti-emetics and anti-nauseants (A04A), alkylating agents (L01A),
antimetabolites (L01B), vinca alkaloids (L01C), antineoplastic antibiotics (L02D), all other
antineoplastics (L01X), cytostatic hormones (L02A), cytostatic hormone antagonists (L04B), other
immune-suppressants (L04X), and detox ag a-neoplastic treatments (V03D). This sample frame has the
advantage of including branded and generic versions of the same molecule having similar manufacturing
requirements and including drugs that are covered under both insurers’ pharmacy and medical benefits.
ATC four-digit and more disaggregated ATC class designations are retained and coded for use in the
sensitivity analyses.

© Conti/Berndt 2014 15
The distribution of NDCs by ATC class is listed below in Table 1. The majority of drugs in the
full sample fall into several categories: drugs used to treat “cancer” (antimetabolites, antineoplastics
agents, other anti-neoplastic treatments – 215 of 752 in 2001, 312/1044 in 2007), “supportive” therapy
(anti-emetics and anti-nauseants, cytostatic hormones, cytostatic hormone antagonists—332/752 in 2001,
Table 1. Count of unique sample NDCs by therapeutic class.
457/1044 in 2007) and “other” (other immune-suppressants, antineoplastic antibiotics – 82/752 in 2001,
127/1044 in 2007).
According to economic theory, pre-LOE differences in fixed costs affect the subsequent number
of generic entrants. Therefore, similar to Scott-Morton (1999; 2000), Iizuka (2009) and Wiggins and
Maness (2004), we code formulations into several categories according to the type of specialized
equipment needed to manufacture a drug and the cleanliness standards required in the manufacturing
facility (oral solid tablets or capsules; injectable or infusible products; topical preparations; and other
formulations, including ocular drugs, patches, and aerosols).
For each molecule, the earliest ANDA approval for each molform was identified using the FDA’s
comprehensive online listing Drugs@FDA. This method stratified the full sample (166 molforms) into
three groups: (1) 41 molforms (25% of full sample) experiencing initial generic entry between January
2001 and July 2007, (2) 50 molforms (30%) experiencing generic entry prior to January 2001; and (3) 75
molforms (45%) only available as exclusively marketed “brands” between January 2001 and December
2007 (Appendix Table 1). Because of our focus on the extent and impact of generic entry, we excluded
molforms in the (3) category from our analyses (all molforms are listed in Appendix Table 2), and instead
focus primarily on category (1).
Among the 41 molforms experiencing generic entry in our study period, the majority underwent
LOE in 2002 and 2004 (Appendix Table 2). 9 (22%) underwent generic entry on or following January
2006. 61% (25 out of 41 molforms) had FDA approved labels that indicated their use in combination
therapy to treat cancer. Among this sample, we observed the following drug formulation pattern: 37%
ATC 2001 2002 2003 2004 2005 2006 2007
A04A ANTIEMETCS+ANTINAUSEANTS 247 240 258 273 259 289 328
L01A ALKYLATING AGENTS 68 70 72 78 80 72 81
L01B ANTIMETABOLITES 117 114 114 120 125 128 130
L01C VINCA ALKALOIDS 55 59 66 67 75 73 67
L01D ANTINEOPLAS. ANTIBIOTICS 82 87 83 82 80 90 115
L01X ALL OTH. ANTINEOPLASTICS 40 42 53 91 107 121 133
L02A CYTOSTATIC HORMONES 63 64 67 73 74 75 74
L02B CYTO HORMONE ANTAGONISTS 22 29 49 52 54 55 55
L04X OTHER IMMUNOSUPPRESSANTS 0 0 0 0 0 12 12
V03D DETOX AG A-NEOPLAST TRMT 58 56 46 46 51 51 49
Grand Total 752 761 808 882 905 966 1044
Count of unique NDCs by Anatomic Therapeutic Class Designation

© Conti/Berndt 2014 16
oral and 63% infused/injected or otherwise physician-administered. Our check of Part B Medicare
reimbursement schedules revealed 76% (31 of our 41 molforms experiencing initial LOE between 2001
and 2007) were covered by the Medicare Part B benefit (the remainder presumably covered under Part D
benefits) (CMS 2014).
Using the FDA’s comprehensive online listing we identified whether for a given molecule
generic entry timing differed by formulation and/or strength. The subsequent entry of differing
formulations (and/or strengths) among existing ANDAs may reflect a different underlying demand
structure than with novel entrants, with the more commonly utilized formulations/strengths being
produced earliest and/or certain formulations protected from entry by secondary patents. We found that
the majority of molecules undergoing generic entry shared identical entry dates across multiple
formulations; yet, a limited number of molforms experienced sequential entry by different strengths.
Consequently, in our empirical models we estimate parameters first at the molform level and in sensitivity
analyses at the molform-strength level.
The number of “entrants” for each molform and molform-strength was identified using the NSP
and cross-checked using the FDA’s Orange Book. Because litigation, regulatory labeling approval, and
manufacturing startup issues can delay de facto entry beyond the de jure FDA approval date, we take the
first month in which the NSP data indicate positive volume and sales dollars as the initial ANDA entry
date. We count the number of such entrants at twelve months after the initial ANDA entry to allow for
delayed entry due to 180-day exclusivity provisions involving Paragraph IV challenges., To flag and
delete repackagers to avoid double counting supply we used the RedBook and checked all entrant names
for repackaging using a websearch.
We identified 63 entrants distributing at least one cancer drug undergoing initial generic entry in
our study period. In Appendix Table 3, we enumerate these entrants and the total number of molforms
produced by them among all drugs in the parent sample. As expected from our institutional review, we
find production of these drugs concentrates in several entrants. Branded manufacturers of drugs
undergoing LOE in our sample are primarily limited to the following: Abbott, AstraZeneca, Bayer
Healthcare, Bristol-Myers Oncology, Genzyme, GSK, Novartis, Pfizer, Roche and Watson. Among
generic entrants, APP, Bedford Laboratories, Teva Parenteral ME and Teva Pharmaceuticals dominate the
production of drugs undergoing initial LOE in our sample. We also observe growth in these ANDA
entrants’ commitment to the production of all generic cancer drugs over time, as the number produced is
generally larger in 2007 than in earlier years, although year-to-year changes are occasionally negative
(Table 2). We use these branded/generic entrant designations for examining pricing trends at the
molform-entrant level after LOE.

© Conti/Berndt 2014 17
Table 2. Number of all sample cancer drugs produced by top ANDA manufacturers.
We construct measures of pre-patent expiration brand revenues and ln revenues, adopting a
definition of “market” size consisting of sales only by the branded molecule in the four complete quarters
prior to LOE (average monthly revenue: 439 thousand (standard deviation 452 thousand, min 0, max
1722); average ln revenue: 5.6 (standard deviation 6.2, min 0, max 13.2)) (Frank and Salkever 1997;
Scott-Morton 1999; Iizuka 2009). Following Scott-Morton (1999), we also constructed a measure of the
difference in revenue defined as the value of the difference between the revenue potential from the entry
opportunity relative to that of the entrants’ existing mean generic NDC portfolio from all drugs
enumerated in the NSP (monthly average =381.6 thousand, standard deviation=538 thousand, min=-816,
max=1599). To the extent the entrants’ existing portfolios consist of old vintages of off-patent drugs
having declining sales and the entry being considered is that for a widely utilized newer molecule having
large sales volume, we expect this difference measure will positively affect probability of current entry.
We transform by using the difference log form of this measure (monthly mean=5.9, standard
deviation=1.5, min=-2.5, max=7.4) in the estimated model and its square.
While previous literature has focused on using pre-LOE revenues (and its square, both typically
log-transformed) as measures of potential market size post-LOE, we augment these by constructing a
measure reflecting the number of distinct conditions treated by the medicines. Specifically, we construct
a measure of indication count, inclusive of FDA on-label approved and off-label Medicare reimbursed,
measured in the year prior to LOE that is likely correlated with potential future revenues.4 The number of
indications for which an NDC was reimbursed for use in the U.S. population in each year (average 6,
standard deviation 9) is taken from the MICROMEDEX DRUGDEX Evaluations database, one of several
compendia approved by Congress to guide CMS reimbursement policy (Conti et al. 2012). This
identified FDA approved (on-label) and off-label indications that were contemporaneously reimbursed by
the Centers for Medicare and Medicaid Services.
4 Incentives for entrants to seek additional indications for reimbursements diminish considerably after LOE,
although the off-patent brand may pursue a “branded generic” strategy in which it markets a combination product
consisting of the off-patent brand and a generic drug.
APP BEDFORDLABS TEVAPARENTERALME TEVAPHARMACEUTICA
2001 16 9
2002 15 92003 12 16 12
2004 16 20 20 142005 17 21 19 15
2006 16 23 22 182007 20 26 22 19
NumberofcancerdrugsproducedbytopmanufacturersofdrugsundergoingLOE

© Conti/Berndt 2014 18
Finally, we matched all sample molforms and molform-strengths with the UUDIS to determine
dates of any shortages including resolved shortages, if present.5 No sample molforms and molform-
strengths were reported in short supply between January 2001 and December 2007. Interestingly, by
2008 or thereafter 18/41 (44%) of our drug sample were reported in short supply, with 67% of these
(12/18) having experienced initial LOE prior to 2005. The majority of these eventually shorted molforms
(14 out of 18) were parentally formulated.
SECTION 5. RESULTS
A. Count models for descriptive purposes
Bearing in mind the caveats on entrant counts created by the presence of considerable contract
manufacturing activities, we first describe the average number of generic entrants per molform
experiencing LOE by year of LOE (Table 3). We observe the average number to range between 1.66 and
4.9 manufacturers over all years, and what appears to be an upwards trend in entry count in 2006 and
2007 compared to previous years, from a low of 1.66 in 2003 to a high of 4.9 in 2007.
Table 3. Average number of ANDA manufacturers entering a new molform after LOE, by year of
LOE.
Furthermore, average entrant counts differ by drug formulation: over all years, oral drugs exhibit
an average of 6.26 (standard deviation: 2.7, max: 11) manufacturers entering after LOE, while physician-
administered drugs exhibit an average of 4.5 (standard deviation: 2.7, max: 9) manufacturers entering
after LOE.
To place these observations into wider industry level context, we also calculated the average
number of manufacturers of always generic cancer drugs available throughout the study period (Appendix
5 http://www.ashp.org/drugshortages/current/;
http://www.ashp.org/menu/DrugShortages/ResolvedShortages.
0
1
2
3
4
5
2002 2003 2004 2005 2006 2007
AveragenumberoffirmsenteringdrugmarketbyyearofLOE

© Conti/Berndt 2014 19
Table 2; Table 4). We observe the average number of manufacturers producing these drugs to be
declining gradually but steadily from 3.04 in 2001 to 2.3 in 2007.
Table 4. Average number of manufacturers producing always generic molforms.
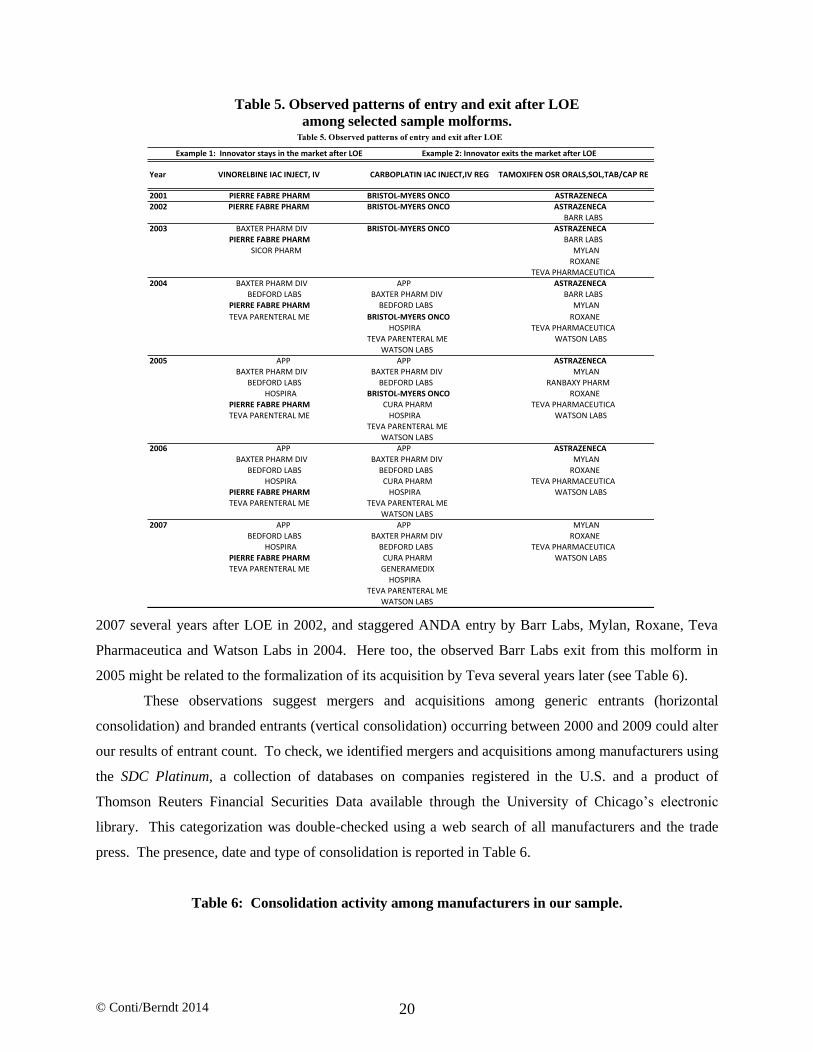
Interestingly, the patterns of entry and exit among specialty cancer drugs undergoing LOE during
our study periods appear quite diverse, as is illustrated in the various panels of Table 5. For example, the
first column (Example 1) in Table 5 documents a situation in which the pioneer branded manufacturer
(Pierre Fabre Pharma, bolded) continues to market vinorelbine IAC in injectable and intravenous
formulations following LOE in 2003 and throughout the remaining study period. We also observe
injectable and intravenous formulation ANDA entry in vinorelbine IAC by Baxter Pharma Division and
Sicor Pharma in 2003, Bedford Labs and Teva Parenteral ME in 2004 and APP and Hospira in 2005. We
observe Sicor Pharma exiting this drug market in 2004 and Baxter Pharm Division exiting in 2007.
Merger and acquisition activity likely explains the apparent exit by Sicor Pharma and entry by Teva
Parenteral ME in 2004 (Table 6) – Teva acquired Sicor in 2004, and likely subsequently consolidated the
two generic products into one market offering.
In other cases, the pioneer brand is observed to exit the molform market after initial LOE, as is
seen in Example 2 of Table 5. Here, the supplier of the branded version of carboplatin IAC injectable and
regular intravenous (Bristol-Myers Oncology, bolded) faced LOE in 2004 and remained in the market
only through 2005. In 2004, we observe APP, Baxter Pharma Division, Bedford Labs, Cura Pharm,
Hospira, Teva Parenteral ME and Watson Labs and in 2005 OTN Pharmaceutical entering this molform
market. The final column of Table 5 documents a somewhat similar pattern of exit by the pioneer brand
manufacturer (AstraZeneca, bolded) for the oral anticancer drug tamoxifen, albeit in
3.04 3 2.8 2.55 2.53 2.4 2.3
0
1
2
3
4
5
2001 2002 2003 2004 2005 2006 2007
Averagenumberofmanufacturersproducingalwaysgenericdrugs
© Conti/Berndt 2014 20
Table 5. Observed patterns of entry and exit after LOE
among selected sample molforms.
2007 several years after LOE in 2002, and staggered ANDA entry by Barr Labs, Mylan, Roxane, Teva
Pharmaceutica and Watson Labs in 2004. Here too, the observed Barr Labs exit from this molform in
2005 might be related to the formalization of its acquisition by Teva several years later (see Table 6).
These observations suggest mergers and acquisitions among generic entrants (horizontal
consolidation) and branded entrants (vertical consolidation) occurring between 2000 and 2009 could alter
our results of entrant count. To check, we identified mergers and acquisitions among manufacturers using
the SDC Platinum, a collection of databases on companies registered in the U.S. and a product of
Thomson Reuters Financial Securities Data available through the University of Chicago’s electronic
library. This categorization was double-checked using a web search of all manufacturers and the trade
press. The presence, date and type of consolidation is reported in Table 6.
Table 6: Consolidation activity among manufacturers in our sample.
Example1:InnovatorstaysinthemarketafterLOE
Year VINORELBINEIACINJECT,IV
2001 PIERREFABREPHARM BRISTOL-MYERSONCO
2002 PIERREFABREPHARM BRISTOL-MYERSONCO
2003 BAXTERPHARMDIV BRISTOL-MYERSONCO
PIERREFABREPHARM
SICORPHARM
2004 BAXTERPHARMDIV APP
BEDFORDLABS BAXTERPHARMDIVPIERREFABREPHARM BEDFORDLABS
TEVAPARENTERALME BRISTOL-MYERSONCO
HOSPIRA
TEVAPARENTERALME
WATSONLABS2005 APP APP
BAXTERPHARMDIV BAXTERPHARMDIV
BEDFORDLABS BEDFORDLABS
HOSPIRA BRISTOL-MYERSONCO
PIERREFABREPHARM CURAPHARM
TEVAPARENTERALME HOSPIRA
TEVAPARENTERALME
WATSONLABS2006 APP APP
BAXTERPHARMDIV BAXTERPHARMDIV
BEDFORDLABS BEDFORDLABS
HOSPIRA CURAPHARM
PIERREFABREPHARM HOSPIRATEVAPARENTERALME TEVAPARENTERALME
WATSONLABS
2007 APP APP
BEDFORDLABS BAXTERPHARMDIVHOSPIRA BEDFORDLABS
PIERREFABREPHARM CURAPHARMTEVAPARENTERALME GENERAMEDIX
HOSPIRATEVAPARENTERALMEWATSONLABS
TEVAPHARMACEUTICAWATSONLABS
Table 5. Observed patterns of entry and exit after LOE
MYLAN
ROXANE
TEVAPHARMACEUTICA
WATSONLABS
MYLAN
ROXANE
MYLAN
RANBAXYPHARM
ROXANE
TEVAPHARMACEUTICA
WATSONLABS
ASTRAZENECA
BARRLABSMYLAN
ROXANE
TEVAPHARMACEUTICA
WATSONLABS
ASTRAZENECA
ASTRAZENECA
ASTRAZENECA
ASTRAZENECA
BARRLABS
ASTRAZENECA
BARRLABS
MYLAN
ROXANE
TEVAPHARMACEUTICA
Example2:InnovatorexitsthemarketafterLOE
CARBOPLATINIACINJECT,IVREG TAMOXIFENOSRORALS,SOL,TAB/CAPRE

© Conti/Berndt 2014 21
To analyze factors contributing to the diverse entry patterns, we estimated random effects
generalized least squares count models with ln mancount (log number of manufacturers) as the dependent
variable for each molform based on the 2001-2007 pooled cross-section and time series data; in
sensitivity analyses, we re-estimate using molform-strength as the unit of observation. Since with a
Poisson model there was over-dispersion (estimated variance greater than mean), estimates presented in
Table 7 are based on the negative binomial model. Consistent with the raw averages, we observe less
entry into injectable formulations after LOE (all Models). There is also greater entry into the cancer
therapeutic class, and less entry into other classes after LOE (all Models). Another robust finding across
Models is that ln preentry revenue positively impacts number of manufacturers. Consistent with this
finding we also observe in each of the estimated models, the greater the number of ln indications for
which the molform is recommended, the greater the number of manufacturers of that molform (Models 1-
5). However, ln preentry revenue squared flips in sign across Models. Models 3-5 report another
modestly robust finding that when ln revenues of the candidate molform is much greater than the mean
revenue per product of the incumbent portfolio of molform products (a positive ln revenue difference), the
number of manufacturers for a molform increases, although the negative estimated coefficient on the
squared ln revenue difference variable indicates this positive impact declines as the ln revenue difference
increases. This suggests that all else equal, entrants may face a tradeoff as they contemplate additional
generic entry between incremental revenue gained and the greater fixed and/or sunk production costs
incurred. Finally, note that while in Models 4-5 the positive estimated coefficient on the month post-
MMA1 indicator variable and the negative estimate on the post-MMA1*part B covered interaction
variable have the expected signs suggesting MMA reimbursement policy changes affected entry, these
estimates are not statistically significant.
Table 7. Manufacturer Count Model Negative Binomial Regression Results.
Mergingfirm Acquiringfirm Completionyear
1 GREENSTONELTD PFIZER 2003
2 ABBOTTPHARMPRODS HOSPIRA 20043 SICORPHARM TEVAPHARMACEUTICA 2004
4 maynepharmaceuticals HOSPIRA 20075 abraxispharm APP 2007
6* king JHPPHARM 20077 BARRLABS TEVAPHARMACEUTICA 2008
8 APP fresenius 20089 wyethayerst PFIZER 2009
10 medimmuneoncology ASTRAZENECA 2013
* jhpwasformedoutofassetsfromKingandothercompaniesCAPITALIZEDmanufacturernamesindicatemanufacturersproducingdrugs
undergoingLOEinoursample

© Conti/Berndt 2014 22
B. Supplier Prices following LOE
As an initial analysis of the impact of LOE on supplier prices, we examine average monthly
inflation adjusted prices, separately for oral and injectable/infusible molforms, before LOE and generic
entry, and after LOE and generic entry, aggregated over brand and generic versions for each molform. As
is seen in Table 8, for both oral and infused/injected specialty drugs, average monthly prices are lower
post-LOE and generic entry than pre-LOE. Interestingly, aggregate price declines appear to be larger
among physician-administered infused/injected drugs (34%) than among orally formulated drugs (21%
decline).
Table 8. Raw inflation adjusted prices and ln prices before and after LOE.
Next, to examine the relationship between supplier prices following LOE and the number of
manufacturers, we first plotted average monthly ln prices ($2012US) observed in the last quarter of 2007
against the total number of unique entrants in all years following LOE (including the pioneer brand, if it is
still on the market), stratified by oral vs. infused/injected or otherwise physician-administered
formulation. Results are displayed in Table 9, with ln supplier prices on the vertical axis and total number
of unique manufacturers following LOE on the horizontal axis. Two sets of results are striking. First, the
level of ln prices for oral formulations is much lower than that for infused/injected or otherwise
physician-administered drugs, up until there are about nine unique manufacturers of the formulation.
Second, for infused/injected or otherwise physician-administered drugs, when the number of
manufacturers increases from one to two, average ln prices fall about 25-30%, there is another even larger
proportional drop in ln price as the number of manufacturers increases from three to four, but in the range
between four and seven manufacturers, ln prices of these drugs are relatively stable, and after that as
coeff stderror p>|t| coeff stderror p>|t| coeff stderror p>|t| coeff stderror p>|t| coeff stderror p>|t|
injectable -0.27 0.17 0.133 -0.59 0.24 0.04 -0.51 0.25 0.05 -0.92 0.21 0.001 -0.95 0.31 0.001
lnindications 0.9 0.42 0.001 0.9 0.1 0.001 0.9 0.1 0.001 0.9 0.11 0.001 1.03 0.12 0.001
cancertherapeuticclass 1.2 0.2 0.001 0.65 0.28 0.02 0.8 0.3 0.007 0.66 0.25 0.008 0.48 0.28 0.07othertherapeuticclass -0.62 0.33 0.064 -0.34 0.5 0.355 -0.35 0.53 0.355 -0.73 0.44 0.03 -0.84 0.44 0.03time(monthsstartingwithJanuary2001) 0.004 0.0009 0.001 0.006 0.0007 0.001 0.006 0.0007 0.001 0.002 0.0004 0.001 0.002 0.0004 0.001
timesquared(monthsstartingwithJanuary2001) 0.002 0.00001 0.001 0.001 0.00001 0.001 0.0001 0.00001 0.001 -0.00003 0.000007 0.001 -0.00003 0.000007 0.001lnrevenuepreLOE($USD2012) 0.007 0.003 0.001 0.009 0.0003 0.001 0.01 0.0004 0.001 0.002 0.0003 0.001 0.002 0.0003 0.001lnrevenuepreLOEsquared($USD2012) 0.000004 0.0000002 0.001 0.000003 0.0000002 0.001 0.000003 0.0000002 0.001 -0.000003 0.0000002 0.001 -0.000003 0.0000002 0.001lnrevenuepreLOEdiff($USD2012) -0.05 0.01 0.001 0.05 0.01 0.001 0.02 0.007 0.038 0.02 0.007 0.038
lnrevenuepreLOEdiffsquared($USD2012) -0.02 0.002 0.001 -0.02 0.002 0.001 -0.005 0.001 0.001 -0.005 0.001 0.001mma1(2004) 0.12 0.07 0.09 0.004 0.04 0.93 0.01 0.05 0.83mma1*partbcovered -0.06 0.07 0.43 -0.03 0.05 0.6 -0.02 0.05 0.7mma2(2006) 0.03 0.06 0.61 0.04 0.06 0.54mma2*partbcovered 0.95 0.06 0.001 0.96 0.06 0.001mma1bite -0.28 0.03 0.001_constant 1.9 0.19 0.001 1.73 0.24 0.001 1.94 0.26 0.001 0.44 0.22 0.04 1.31 0.24 0.001adjustedR-squared(overall) 0.28 0.49 0.5 0.84 0.84n= 3444 3444 3444 3444 3444
Model1,lnmancount Model2,lnmancount Model4,lnmancount Model5,lnmancountModel3,lnmancount
BeforeLOE AfterLOE After-Before
Monthlyave. Stand.Error Monthlyave.Stand.Error Difference Stand.Error %change
oral(n=15)prices($2012USD) 1.26 0.04 1 0.01 -0.26 0.04 -21%
physician-administeredinfused/injected(n=26)prices($2012USD) 135.6 2.7 90 3.5 -45.6 7 -34%
Bolded=statisticallysignificantatp-value<.01level.
Table 8. Raw inflation adjusted prices before and after LOE.

© Conti/Berndt 2014 23
additional manufacturers of infused/injected or otherwise physician-administered drugs enter, the average
ln price continues to fall. This suggests that for infused/injected or otherwise physician-administered
cancer drugs, unlike the case for oral solids, price declines accelerate as the number of manufacturers
increases.
Table 9. Relationship between Ln inflation adjusted estimated supplier prices ($USD 2012)
and manufacturer count after LOE.
A more rigorous method for analyzing the relationship between supplier prices following LOE
and the total number of manufacturers (but bearing in mind potential measurement error in supplier
counts from unobserved and time-varying outsourcing to contract manufacturing organizations) is via
regression analysis. Results of estimating a regression equation via ordinary least squares with ln
(inflation adjusted) supply price as the dependent variable are presented separately in Table 10 for generic
and branded formulations following LOE, and for oral and infused/injected or otherwise physician-
administered formulations.
Table 10. Relationship between inflation adjusted supplier price ($2012USD) and manufacturer
counts, by formulation and LOE status.
We begin with the oral molforms. As seen in the top left panel, following LOE generic prices fall
sharply as ln mancount (which now includes only ANDA holders, not the brand) increases, and this
coefficient se p-value coefficient se p-value
lnmancount -0.77 0.03 0.0001 -0.22 0.017 -12.54lnmancountsquared -0.01 0.005 0.051 0.02 0.004 0.0001
year 0.26 0.05 0.0001 -0.29 0.03 0.0001
n= 287 1678adjustedr-square= 0.16 0.12
lnmancount 0.07 0.02 0.002 0.49 0.04 0.0001lnmancountsquared 0.07 0.005 0.0001 -0.04 0.006 0.0001
year -0.52 0.04 0.0001 0.26 0.04 0.0001n= 161 1318
adjustedr-square= 0.12 0.05
OralmolformsInjectedandinfusedorotherwisephysician-
administeredformulatedmolforms
generic,underwentLOE
branded,underwentLOE

© Conti/Berndt 2014 24
decline accelerates ever so slightly as the square of ln mancount increases. Holding ln mancount and its
square constant, prices increase annually (year =1 in 2001, year=2 in 2002, etc.). For the off-patent but
branded oral molforms following LOE (bottom left panel), the relationship of supplier prices with ln
mancount is very different. Specifically, ln (inflation adjusted) supplier prices of branded oral molforms
increase with growth in ln mancount, and this price increase accelerates with the square of ln mancount,
suggesting that for oral brands, the ability to differentiate themselves from generics post-LOE enables
them to continue commanding premium prices. However, this ability to increase price declines with time,
other things equal, as the estimated coefficient on the year variable is negative, large and significant.
By contrast, as seen in the top right corner of Table 10, for injected and infused molforms
following LOE, ln (inflation adjusted) supplier prices fall much less steeply as ln mancount increases than
do oral molforms, and this price decline decelerates as the square of ln mancount increases; however, ln
(inflation adjusted) supplier prices fall as time increases. The situation is very different for branded
injected and infused molforms following LOE (bottom right panel): prices of these branded non-oral
formulations increase with ln mancount, but at a decreasing rate (the estimate on the squared ln mancount
variable is negative and significant). In summary, for both oral and injected/infused molforms, following
LOE prices of generic molforms fall as ln mancount increases (with the price decline being much steeper
for oral than injected/infused formulations), but for branded molforms following LOE, prices increase as
ln mancount grows, with the price increase being steeper for injected/infused than oral formulations.
These results suggest post-LOE price competition among manufacturers is less intense for
injected/infused than oral formulations.
C. Impact of LOE on Utilization Volume
While measures of utilization volume are relatively straightforward for oral formulations (number
tablets or capsules – what IMS Health calls standard units, or total milligrams of active pharmaceutical
ingredient), for infused, injected or otherwise physician-administered formulations, the measure of
utilization volume is more ambiguous. IMS Health defines extended units as the number of tablets,
capsules, milliliters, ounces, etc. of a product shipped in each unit. This number is calculated by
multiplying the number of units by the product size. Another volume measure is an “each”, which
represents “the number of single items (such as vials, syringes, bottles, or packet of pills) contained in a
unit or shipping package and purchased by providers and pharmacies in a specific time period. An each is
not a single pill or dosage of medicine (unless one package consists of a single dose), but may be the
same as a unit if the unit does not subdivide into packages. Eaches are usually used to examine usage of

© Conti/Berndt 2014 25
injectable products. Eaches are most meaningful at the package level, since packages and their subunits
may contain different quantities of strengths and volumes.”6
As an initial analysis of the impact of LOE on utilization volume, in Table 11 we examine three
measures of volume – average monthly extended units, average monthly eaches and average monthly
inflated adjusted sales ($US 2012) separately for oral and injectable/infusible molforms, before LOE and
generic entry, and after LOE and generic entry, again aggregated over brand and generic versions for each
molform. As seen in Table 11, regardless of which volume measure used, average aggregate brand plus
generic monthly utilization is greater post-LOE and generic entry than pre-LOE and generic entry for
both oral and physician-administered infused/injected drugs.
Table 11. Raw Use and Inflation Adjusted Sales Trends Before and After LOE by formulation.
However, a closer examination focused on the share of molforms within each aggregate category
experiencing an increase reveals that these aggregate trends mask heterogeneity across drugs within oral
and within infused/injectable formulations, and across these formulations. First, using the extended units
measure of volume, 40% of the molforms experienced a statistically significant utilization increase, while
47% experienced a statistically significant utilization decrease; for the infused/injected formulations,
these percentages were 27% and 42%, respectively. We therefore explored a more detailed analysis of
the impact of LOE on utilization volume involving estimation of various generalized least squares models
with random effects in which the dependent variable is the log of volume, where volume is measured in
extended units. Here again, the unit of observation is the molform-month. In the specification of Model 1
in Table 12, the omitted reference case for the various indicator variables is pre-LOE time periods, an oral
formulation, and a supportive therapeutic (e.g., an anti-nausea drug to mitigate side effects). We find that
the estimated coefficient on the generic entry year indicator variable (taking on the value of one post-LOE
and initial generic entry, else zero among oral formulated drugs) is positive and significant. Also
6 From email correspondence between Berndt and Terry McMonagle at the IMS Institute for Healthcare Informatics,
September 4, 2013.
BeforeLOE AfterLOE After-Before
Monthlyave. Stand.Error Monthlyave. Stand.Error Difference Stand.Error %change
oral(n=15)extendedunits 1508.4 18.4 2759 24.7 1250.3 30.8 82.9%
eaches 121.5 1.7 158.5 1.6 37.03 2.29 30.5%sales($2012USD) 1356.1 27.8 1985.5 30.3 629.42 41.1 46.4%
physician-administeredinfused/injected(n=26)
extendedunits 438.75 14.2 656.2 12.6 217.5 19.01 49.6%eaches 27.8 11.04 47.96 0.44 20.16 11.05 72.5%
sales($2012USD) 1596.4 20.9 2506.6 23.4 910.2 31.4 57.0%
Bolded=statisticallysignificantatp-value<.01level.
Table 11. Raw Use and Inflation Adjusted Sales Trends Before and After LOE by formulation.

© Conti/Berndt 2014 26
consistent with the findings in Table 11, although the estimated coefficient on the main effect injectable
variable is negative (for the pre-LOE time periods), here we find that aggregate average monthly volume
increases are large for injectable/infusible drugs following LOE, i.e. the parameter estimate on the
injectable-entry year interaction variable is positive and significant. While estimates on the therapeutic
class indicator variables are statistically insignificant, coefficients on the continuous time variable (1 in
January 2001, 2 in February 2001, etc.) and its square are small in magnitude, and negative and positive,
respectively.
In Model 2, the various MMA indicator variables and interactions with Part B variables are added
to Model 1. The omitted reference case for these variables is pre-MMA time periods for an oral drug
covered by Medicare Part D. While estimates on the oral post LOE (entry year dummy) and physician-
administered post LOE (entry year dummy*injectable interaction) variables in Model 2 are robust in sign
to their Model 1 counterparts, in Model 2 the magnitude of the use change is about twice that reported in
Model 1. In Model 2 the estimates on MMA1 and MMA2 are both positive and significant, implying
utilization of oral molforms experiencing LOE increased after these policy changes. However, we find
estimates on the MMA-Part B interaction variables (interpreted as differences from the omitted pre-
MMA-Part D variables) are both negative and significant, suggesting that the volume increases are
concentrated among drugs covered under Part D, not Part B, and that post-MMA1 it is the part B
injectables whose volume decreases. Note that the absolute value of the estimated parameter on the post-
MMA1*part B interaction value is larger than that of the post-MMA1 main effect variable, although this
is not the case for the MMA2 interaction and main effect variable parameter estimates. Hence it appears
the reimbursement reduction for physician-administered Part B variables that took effect in MMA1
(between 2004Q4 and 2005Q1) is associated with a substantial decline in volume utilization.
Finally, in Model 3, we added an additional variable “MMA1bite” to quantify the magnitude of
(the absolute value of the) negative reimbursement shocks for some Part B covered drugs but not others in
2004. Interestingly, except for the injectable and Part B main effects variables, estimated coefficients and
their statistical significance for variables included in Model 3 are remarkably robust to their values in
Models 2. Molecules which experienced very large drops in reimbursement between 2004 and 2005 are
found to have very large and statistically significant volume declines, holding all else constant.

© Conti/Berndt 2014 27
Table 12. Estimated volume changes using GLS random effects.
5.5 Sensitivity Analyses
To assess the robustness of our principal findings to alternative specifications and metrics, we
undertook a number of investigations. For example, we examined use of revenue variables measured as
the mean over varying molforms in the twenty-four and six months preceding ANDA entry (rather than
12 months); time-varying indication counts for each molform; orphan/priority review designation as a
distinct measure of clinical quality; and the presence or absence of available therapeutic substitutes as
determined by the FDA. We also pursued the construction and use of several market-specific measures of
supplier level costs, including parent and subsidiary relationships among manufacturers based on Table 6,
and FDA regulatory cost compliance measures. We estimated count models for entry in the first year,
and two years following patent expiration. Finally, we re-estimated all price and use models using
molform-strength as the unit of analysis. Our main findings are robust to each of these alternative
definitions and/or specifications. They are available upon request from the lead author.
Finally, we recognize our measure of generic entry may violate our assumption of “simultaneous
information” for a number of reasons. This includes the fact that the timing of generic entry may be
endogenous to the number of manufacturers entering into the market due to Paragraph IV filings and
notifications (Panattoni 2011), although our count assessed at 12 months after initial generic entry should
largely eliminate any effects from possible endogeneity, particularly given the widely documented
increase in the number of backlogged ANDA filings remaining unresolved at the FDA. We plan to
examine this issue in future research.
SECTION 6: DISCUSSION AND POLICY IMPLICATIONS
coeff stderror p>|t| coeff stderror p>|t| coeff stderror p>|t|
entryyeardummy 0.24 0.02 0.001 0.51 0.02 0.001 0.51 0.024 0.228
injectable -2.2 0.87 0.01 -2.12 0.94 0.02 -0.72 1.14 0.527
entryyeardummy*injectable 0.39 0.03 0.001 0.63 0.03 0.001 0.63 0.03 0.001
lnindications -0.1 0.42 0.813 -0.1 0.39 0.78 -0.08 0.37 0.83
cancertherapeuticclass -0.12 0.96 0.89 -0.1 0.87 0.9 -0.13 0.84 0.88
othertherapeuticclass 1.3 1.6 0.4 1.33 1.4 0.355 1.36 1.38 0.33
time(monthsstartingwithJanuary2001) -0.004 0.001 0.001 -0.0007 0.001 0.43 -0.0007 0.001 0.43
timesquared(monthsstartingwithJanuary2001) 0.00008 0.00001 0.001 0.00003 0.00001 0.01 0.00003 0.00001 0.01
partbcovered 0.59 1.02 0.56 1.26 1.03 0.22
mma1(2004) 0.49 0.03 0.001 0.49 0.03 0.001
mma2(2006) 0.26 0.03 0.001 0.26 0.03 0.001mma1*partbcovered -1.3 0.03 0.001 -1.3 0.03 0.001
mma2*partbcovered -0.14 0.03 0.001 -0.14 0.03 0.001
mma1bite -2.4 1.15 0.04
_constant 5.01 0.86 0.001 4.5 0.92 0.001 4.75 0.9 0.001
AdjustedRsquared(overall) 0.1 0.16 0.26
sigma_u 2.02 2.17 2.09
sigma_e 0.76 0.79 0.8
rho 0.87 0.88 0.88numberofgroups 41 41 41
n= 3444 3444 3444
Model1,lnextendedunits Model2,lnextendedunits Model3,lnextendedunits
Tablevolumemodelresults,randomeffects

© Conti/Berndt 2014 28
This research has reported a number of findings regarding entry and pricing following LOE for
specialty drugs that differ from patterns reported for non-specialty oral solid tablets and capsules. First,
as expected from our institutional review highlighting relatively large fixed costs and economies of scale
and scope for injectable/infusible drug manufacturing, we find pre-LOE production of cancer drugs to
concentrate in several manufacturers, including Abbott, AstraZeneca, Bayer Healthcare, Bristol-Myers
Oncology, Genzyme, GSK, Novartis, Pfizer, Roche and Watson. Among generic manufacturers, APP,
Bedford Laboratories, Teva Parenteral ME and Teva Pharmaceuticals dominate the production of drugs
undergoing initial LOE in our sample. We also observe the number of entrants into specialty drug LOEs
to range between 1.66 and 4.99 manufacturers over all years, and what appears to be an upwards trend in
entry count in 2006 and 2007 compared to previous years. The limited number of manufacturers we
observe entering the production of specialty drugs post-LOE is considerably smaller in magnitude that
that reported in previous studies of entry into non-specialty drugs. Nevertheless, these findings are
consistent with that of U.S. Department of Health And Human Services, ASPE (2011), documenting that
manufacturers of generic cancer drugs experienced a general increase in the quantity and mix of drugs
they were producing in 2006 and thereafter, compared to 2000. A close inspection of entry trends into
selected molforms also reveals several intriguing patterns. For example, among several specialty
molecules, we observe exit by the branded supplier after LOE, as well as delayed and sequential ANDA
entry into a given molecule undergoing LOE.
We also find evidence to suggest both entry and exit to be occurring among generic cancer drugs.
For example, the average number of manufacturers of always generic cancer drugs available throughout
the study period declines from 3.04 in 2001 to 2.3 in 2007. This winnowing of overall supplier counts per
generic drug is consistent with other reports suggesting that merger and acquisition activities, outsourcing
and/or discontinuations of previously offered generic drugs were common business practices during this
period (U.S. Department Of Health And Human Services, ASPE 2011; FDA 2011). These results suggest
generic manufacturers of cancer drugs may have been exiting from producing very old generic drugs and
instead entering into segments experiencing initial LOE that offered potentially more profitable
opportunities.
Economic theory suggests that the number of average entrants per new LOE is likely related to
molecule specific rationales and wider industry trends. We find evidence to support this theory; in each
model presented the importance of molecule formulation and pre-LOE revenues appear to affect supplier
counts. These former results are similar to those reported by Scott-Morton (1999; 2000) and Iizuka (2009)
and are likely related to the insurer coverage and reimbursement incentives operative in this specific drug
market. The latter results are similar to those reported by Scott-Morton (1999; 2000), Wiggins and
Maness (2004) and Reiffen and Ward (2005) who also show that among their drug samples, pre-LOE

© Conti/Berndt 2014 29
sales measures explain a significant proportion of variation in the number of sellers in the post-LOE study
period.
Finally, we do not find evidence to suggest the presence of tighter administered pricing policies
for drugs clearly targeted by 2003 Medicare Modernization Act reforms (MMA1 in 2004) negatively
affected the number of manufacturers of generic drugs as they became available. In fact, among new
opportunities we document robust and increasing entry after MMA1 implementation. This finding is
tempered when we expressly examine the impact of negative price reimbursement declines due to MMA
reforms implemented in 2004 on entry patterns.
We also find that physician-administered drugs have higher inflation-adjusted supplier prices
compared to orally formulated drugs both before and after LOE. Furthermore, as expected, across all drug
formulations we find inflation-adjusted supplier prices are negatively and statistically significantly related
to the number of generic entrants producing them following LOE. Although the magnitudes of these
price- supplier effects are considerably larger here for physician-administered drugs, the qualitative
effects reported also mimic those found for oral generic and branded drugs following LOE (e.g., Aitken et
al. 2013). Additional average price reductions continue to increase among drugs offered by five or more
manufacturers (and the sign of the estimated parameter on the number of manufacturers squared is
negative), particularly among physician-administered drug formulations and contrary to the literature
examining non-specialty drugs. This result is intriguing, since Gaynor and Vogt (2003), Mankiw and
Whinston (2002), Berry and Reiss (2007), among others, suggest that anticipated profits in a variety of
industries drops to zero after the entry of four or more manufacturers. Yet, we are well aware that another
potential endogeneity issue arises here reflecting unobserved or partially observed differences between
drugs that might affect both their prices and price changes and the number of manufacturers (Reiffen,
Ward 2005). Following Reiffen and Ward (2005), we believe this endogenity produces an upward effect
on the price changes we estimate among our sample following LOE. Thus, our price estimates should be
considered an upper bound on the effect of entrants following LOE on price competition. A close
examination of the endogeneity of entry and how it may impact prices in the specialty drug market is an
important future research topic.
We also find evidence to suggest branded prices rise and generic prices fall in response to LOE
and generic entry. This result is consistent with Frank and Salkever (1997), Ellison et al. (1997),
Griliches and Cockburn (1994) and Aitken et al. (2013). We believe we are the first to report this finding
in a specialty drug sample.
Our efforts provide contemporary estimates of volume utilization following the generic entry of
specialty drugs. In all models, volume appears to increase substantially following generic entry,
consistent with the usual assumptions regarding the negative relationship between prices and quantity
© Conti/Berndt 2014 30
demanded and empirical work among non-specialty drugs undergoing LOE. However, these usage trends
are much less robust among physician-administered formulations. Rather, the results of these models
suggest MMA reimbursement reforms may have shifted utilization away from injectable Part B
reimbursed generic drugs after LOE, all else equal. This finding is also consistent with that reported by
Jacobson et al. (2006, 2010, 2012) and Conti et al. (2012).
Regarding the welfare implications of these utilization results in this market, we acknowledge
that they are complicated given the general aging of the population and increasing detection of cancer in
combination with technological change supporting increased demand for combination products, all else
equal (Scherer FM 1993; Cutler, Huckman, Kolstad 2010). It is also unclear how to interpret these
findings given the extent of simultaneous misuse, underuse, and overuse among cancer drugs (Conti et al.
2012) and the complicated agency relationship which rewards physicians and hospitals for the use of
branded, highly reimbursed cancer drugs in treating cancer in the outpatient setting (Jacobson et al. 2006,
2010, 2012, 2013; Conti et al. 2012). As we discussed in the background section, even this relationship
among oral, pharmacy benefit covered specialty drugs is complicated by the lack of institutional
incentives in hospitals such as the tiered formularies adopted by payers to increase consumer price
sensitivity regarding the use of generic drugs (Grabowski, Vernon 1992, 1996; Aitken et al. 2009). Lastly,
finding mixed effects on utilization pattern, Caves et al. (1991), Berndt et al. (2003) and Knittel and
Huckfeldt (2012) suggest simultaneous declines in advertising and product reformulation introductions
may act to mitigate the relationship between presumptive price declines and utilization increases
associated with drugs following LOE. One advantage of our sample choice is that these changes have
limited applicability to interpreting potential volume shifts among specialty drugs, since neither
advertising nor new product formulations have been widely documented among physician-administered
specialty drugs (Kornfield et al. 2013). Whether this trend is consistent across oral and injected/infused
drugs among many other specialty therapeutic classes is an important direction for future research.
Nevertheless, we believe we can derive “second-best” welfare consequences from our price and
utilization results. Recall there is a substantial literature examining the welfare effects of a monopolist
implementing third degree price discrimination relative to requiring a uniform monopoly price. We argue
here that this literature may be important in understanding plausible welfare implications of our findings.
Notably, among others, Varian (1989, pp. 619-623) has shown that in the context of two groups of
consumers and under quite general conditions, a necessary condition for welfare to increase under price
discrimination relative to uniform pricing is that total volume increases under price discrimination. In the
current context, readers can consider uniform pricing as that occurring when the product has patent
protection, i.e., the brand price prior to LOE. Following LOE, however, there are two groups of
customers – the cost-conscious consumers who are attracted by low generic prices, and the consumers

© Conti/Berndt 2014 31
who are more brand loyal; these two groups of customers pay different prices for the same bioequivalent
product (Frank, Salkever 1997). Our pricing results suggest that supplier-prices of generic drugs decline
quite substantially after generic entry, while supplier-prices of branded drugs rise after LOE; this finding
is consistent with Frank and Salkever’s work. Taken together, we suggest that our finding that post-LOE
aggregate volumes of the molecule (brand plus generics) are greater than pre-LOE brand volumes
supports a necessary condition for economic welfare gains among consumers of at least orally formulated
specialty drugs to be satisfied, holding the above concerns in mind.
We conclude with several policy implications of our study. First, we note the number of
manufacturers marketing specialty injectable/infusible drugs post-LOE in 2001-2007 is considerably
smaller than has been observed for oral tablet and capsule formulations in previous studies. We have
argued that one likely reason for this more limited supply post-LOE is that manufacturing specialty
injectable/infusible formulations likely involves greater fixed and variable costs than for oral solid
capsules and tablets. In this context, it is worth noting that provisions of the 2012 Generic Drug User Fee
Amendments (GDUFA) not only assess one-time user fees for manufacturers of ANDAs, but also entail
annual payments by manufacturers to the FDA that vary by whether the manufacturing site is domestic or
foreign, and whether the manufactured product is the active pharmaceutical ingredient or the final dosage
form (“fill and finish”). This increase in manufacturing fixed costs can be expected to incentivize brand
and generic drug manufacturers to outsource their manufacturing to contract manufacturing organizations
(CMOs), and since the annual user fee is site rather than product-specific, it creates additional economies
of scope that generate incentives for CMOs to increase the number of products manufactured at their site.
To the extent that in addition CMOs are able to produce the same molform for different ANDA holders,
the increased fixed costs and scale economies brought about by GDUFA may result in the further
outsourcing of manufacturing to CMOs and thereby reduce the number of distinct organizations
manufacturing injectable/infusible drugs post-LOE. How these increased fixed costs in the presence of
both increased economies of scope and scale will affect supplier prices is unclear, but worthy of further
analysis.
Second, many of the injectable specialty drugs in our sample of 41 molecules experiencing initial
LOE in 2001-7 are similar to currently patent protected injectable biologics in the U.S. (Grabowski et al.
2011). Thus, the patterns of entry, price and use after LOE among specialty drugs we document may
provide some insight into what might occur as patents of U.S. biologics expire and they experience initial
biosimilar entry. Yet we caution our reader: each of the drugs in our sample -- branded and generic
versions of specialty drugs -- has been designated “fully interchangeable” by the FDA. Biosimilar
entrants will likely be therapeutic substitutes to the branded pioneer but not necessarily “fully
interchangeable” drugs. Second, the generic injectable/infused drugs in our 2001-2007 sample are mostly

© Conti/Berndt 2014 32
traditional APIs dissolved in water; the manufacturing complexity and costs of biologics soon going
experiencing initial LOE in the U.S. are likely much greater than in our 2001-2007 sample. For both
these reasons, our estimates likely provide only an upper bound to the entry and a lower bound on the
price effects likely to occur as biologics go off patent in the U.S.
Third, on drug shortages, 44% of our sample undergoing LOE between 2002 and July 2007 (18
molforms) were reported in short supply in 2008 or thereafter, 67% of these molforms (12 molforms)
underwent generic entry prior to 2005, and the majority of these eventually shorted molforms (14 out of
18) were parentally formulated. A thorough examination of the importance of the limited number of
manufacturers of generic drugs previous to shortage reports and the potential correlations among the
MMA, utilization trends and entry patterns is an important avenue for future empirical work. We note in
passing that Stromberg (2014) reports strikingly similar temporal patterns of shortages among oral drugs,
suggesting that time-varying factors common to injectable and oral drugs may be one of the root causes of
shortages. Stromberg reports a statistically significant relationship between FDA regulatory activity
(inspections and citations) and drug shortage rates over time.
Fourth, our review of the specialty drug market raises questions about researchers’, stakeholders’
and policy makers’ definition of drug “manufacturers” in that the increasingly important presence of time-
varying and unobservable contract manufacturing practices complicates and may even undermine the
definition of unique “manufacturers” entering this market, well beyond the usual concerns regarding
ongoing merger and acquisition activities. Under current statute (and partly in response to recent
observed drug shortages), NDA and ANDA labelers are obligated to notify FDA of plans to discontinue
drug manufacturing as well as any changes in manufacturing responsibilities, including the outsourcing of
drug production after initial approval. How well labelers comply with this requirement, and how
accessible the resulting data are to the FDA, is an important issue meriting further scrutiny.
Furthermore, FDA sources say that it is common for a drug labeler to qualify a new facility to
manufacture its drug due to either the loss of the old facility or to changing market demand prompting the
manufacturer to acquire additional capacity. In these cases, NDA and ANDA labellers often turn to
contract manufacturers. However, data on the use of CMOs and their identity upon initial filings and
subsequent changes is not publicly accessible through the web portal Drugs@FDA and is exempt from
being released under the Freedom of Information Act (the FDA generally treats non-public business
relationships as confidential commercial or financial information, exempting it from public disclosure). A
proprietary data source, Truven’s RedBook, maintains more updated information on which NDA and/or
ANDA NDC labellers are actively offering a drug in the U.S. market, but even this source does not
identify contract manufacturing arrangements. The identity and nature of base ingredient manufacturing
(APIs) for many drugs, also collected by FDA from ANDA manufacturers, are similarly shielded from

© Conti/Berndt 2014 33
public scrutiny.
We believe these increasingly important business practices have at least two implications for
measuring the extent of generic competition. First, these arrangements make it challenging for regulators
charged with monitoring competition in the generic and branded drug market to predict reliably what the
concentration of specialty drug supply of drugs will be following mergers, acquisitions and/or closures of
NDA or ANDA manufacturers and/or contract manufacturing facilities supplying drugs to the U.S.
market. These relationships can make economic models of such activity and their potential competitive
effects on supply and/or prices by agencies such as the Department of Justice or Federal Trade
Commissions inaccurate, particularly if overlapping supply is present before merger and acquisition
activity between the two parties. Second, under these arrangements the public and their guardians are
unable to quickly identify sources and root causes of supply disruptions when supply or quality lapses
occur. How best to formulate market level solutions to supply lapses given extreme informational
asymmetry regarding which manufacturers are actually producing these drugs or their base ingredients is
a very challenging and perplexing issue.

© Conti/Berndt 2014 34
REFERENCES
Aitken ML, Berndt ER, Cutler DM. 2009. Prescription drug spending trends in the United States; looking
beyond the turning point. Health Affairs 151.
Aitken ML, Berndt ER, Bosworth B, Cockburn IM, Frank RG, Kleinrock M, Shapiro BT. 2013. The
regulation of prescription drug competition and market responses: patterns in prices and sales following
loss of exclusivity. Cambridge, MA: National Bureau of Economic Research, Working Paper No.
19487, October.
Akscin J, Barr TR, Towle EL. 2007. Key practice indicators in office-based oncology practices: 2007
report on 2006 data. J Oncol Pract. Jul;3(4):200-3.
Barr TR, Towle EL, Jordan WM. 2008. The 2007 national practice benchmark: results of a national
survey of oncology practices. J Oncol Pract. Jul;4(4):178-83.
Barr TR, Towle EL. 2011. Oncology Practice Trends From the National Practice Benchmark, 2005
through 2010. J Oncol Pract. Sep;7(5):286-90.
Barr TR, Towle EL. 2012. Oncology practice trends from the national practice benchmark. J Oncol Pract.
Sep;8(5):292-7.
Berndt ER, Aitken M. 2011. Brand loyalty, generic etry, and price comeptition in the quarter century after
the 1984 Waxman-Hatch Legislation. International Journal of the Economics of Business. 18(2):177-201.
Berndt ER, Kyle M, Ling D. 2003. The Long Shadow of Patent Expiration: Generic Entry and Rx-to-
OTC Switches, in Scanner Data and Price Indexes, eds. Feenstra, Robert C. and Matthew D. Shapiro.
Chicago: University of Chicago Press.
Berndt ER, Newhouse JP. 2013. Pricing and Reimbursement in U.S. Pharmaceutical Markets, in PM
Danzon, Nicholson S. (eds.) The Oxford Handbook of the Economics of the Biopharmaceutical Industry.
New York, NY: Oxford University Press, pp. 201-265.
Berry S. 1992. Estimation of a model of entry in the airline industry. Econometrica. 60: 889-917.

© Conti/Berndt 2014 35
Berry S, Reiss P. 2007. Empirical models of entry and market structure, in Armstrong M and Porter RH
(eds.), Handbook of Industrial Organization, Vol. 3, Amsterdam: North Holland Elsevier, pp. 1845-86.
Bresnahan TF, Reiss P. 1988. Do entry conditions vary across markets? Brookings Papers on Economic
Activity: Microeconomics. 833-871.
Bresnahan TF, Reiss P. 1991. Entry and competition in concentrated markets. Journal of Political Economy.
99:977-1009.
Caves R, Whinston MD, Hurvitz M. 1991. Patent expiration, entry and competition in the U.S.
pharmaceutical industry. Brookings papers on economic activity: microeconomics: 1-48.
Clemens J, Gottlieb JD. 2013. Bargaining in the Shadow of a Giant: Medicare's Influence on Private
Payment Systems. Cambridge, MA: National Bureau of Economic Research Working Paper No. 19503,
October.
Conti RM. 2013. Why are cancer drugs commonly the target of numerous schemes to extend patent
exclusivity? Health Affairs webblog. December 4. Available at:
http://healthaffairs.org/blog/2013/12/04/why-are-cancer-drugs-commonly-the-target-of-schemes-to-
extend-patent-exclusivity/.
Conti RM. 2014. Who makes this drug? The Cancer Letter, January 3. Available at:
http://www.cancerletter.com/articles/20140103.
Conti RM, Bernstein A, Meltzer DO. 2012. How do Initial Signals of Quality Influence the Diffusion of
New Medical Products? The Case of New Cancer Treatments. Advances in Health Economics and
Policy.
Conti RM, Bernstein AC, Villaflor VM, Schilsky RL, Rosenthal MB, Bach PB. 2013. Prevalence of off-
label use and spending in 2010 among patent-protected chemotherapies in a population-based cohort of
medical oncologists. J Clin Oncol. Mar 20;31(9):1134-9.
Conti RM, Rosenthal MB, Polite B, Bach PB, Shih Y-C T. 2012. Infused chemotherapy use following

© Conti/Berndt 2014 36
patent expiration among individuals aged 65 and older. American Journal of Managed Care. May
1;18(5):e173-8.
Cutler DM, Huckman R, Kolstad JT. 2010. Input Constraints and the Efficiency of Entry: Lessons from
Cardiac Surgery. American Economic Journal: Economic Policy. 2(1):51-76.
Drugchannels.com. 2014. EXCLUSIVE: 340B Is Taking Over the Hospital Market—With a 25% Share.
February 25. Available at: http://www.drugchannels.net/2014/02/exclusive-340b-is-taking-over-
hospital.html.
Duggan M, Scott-Morton F. 2010. The Effect of the Medicare Drug Benefit on Pharmaceutical Prices
and Utilization. American Economic Review. 100(1):590-607.
Ellison SF, Cockburn IM, Griliches Z and Hausman JA. 1997. Characteristics of demand for
pharmaceutical products: an examination of four cephalosporins. Rand Journal of Economics. 28(3):1-
36.
EMD Serono. 2013. EMD Serono Specialty Digest™, 9th Edition. Managed Care Strategies for Specialty
Pharmaceuticals. Avaiable at: http://specialtydigest.emdserono.com/Digest.aspx.
Frank RG. 2001. Prescription drug prices: why some pay more than others do. Health Affairs.
20(2):325-30.
Frank RG, Salkever DS. 1992. Pricing, patent loss and the market for pharmaceuticals. Southern
Economic Journal 59:165-79.
Frank RG, Salkever DS. 1997. Generic entry and the pricing of pharmaceuticals. Journal of Economics
and Management Strategy. 6(1):75-90.
Gatesman M, Smith T. 2011. The Shortage of Essential Chemotherapy Drugs in the United States. New
England Journal of Medicine. 365(18):1653-1655.
Gaynor MS,Vogt W. 2003. Competition among hospitals. Rand Journal of Economics. 34(4):764-85.

© Conti/Berndt 2014 37
Goldberg P. 2013. Drug Shortages Reach All-Time High—Ben Venue Exit Will Make Problem Worse.
The Cancer Letter. October 11. Available: http://www.cancerletter.com/articles/20131011.
Grabowski H, Long G, Mortimer R. 2011. Implementation of the biosimilar pathway: economic and
policy issues. Seton Hall Law Review 41(2):511-557.
Grabowski H, Vernon J. 1992. Brand loyalty, entry and price competition in pharmaceuticals after the
1984 Drug Act. Journal of Law and Economics. 35:331-350.
Grabowski H, Vernon J. 1996. Longer patents for increased generic competition in the U.S.: the
Waxman-Hatch Act after one decade. Pharmacoeconomics 10 Suppl2:110-23.
Griliches Z, Cockburn IM. 1994. Generics and new goods in pharmaceutical price indexes. American
Economic Review 84(5):1213-32.
Huskamp HA, Donohue JM, Koss C, Berndt ER, Frank RF. 2008. Generic Entry, Reformulations and
Promotion of SSRIs in the U.S. Pharmacoeconomics. 26:603-616.
Iizuka T. 2009. Generic Entry in a Regulated Pharmaceutical Market. Japanese Economic Review.
60(1):63-81.
IMS Institute for Healthcare Informatics. 2011. Drug Shortages: A Closer Look at Products, Suppliers,
and Volume Volatility. Available at:
http://www.imshealth.com/deployedfiles/ims/Global/Content/Insights/IMS%20Institute%20for%20Healt
hcare%20Informatics/Static%20Files/IIHI_Drug_Shortage_Media_ExecSumm.pdf.
IMS Institute for Healthcare Informatics. 2012. Declining medicine use and costs: For better or worse? A
review of the use of medicines in the united states in 2012. Available at http://www.theimsinstitute.org.
Jacobson M, O’Malley AJ, Earle CC, Pakes J, Gaccione P, Newhouse JP. 2006. Does Reimbursement
Influence Chemotherapy Treatment for Cancer Patients? Health Affairs. 25(2): 437-443.

© Conti/Berndt 2014 38
Jacobson M, Alpert A, Duarte F. 2012. Prescription Drug Shortages: Reconsidering the Role of Medicare
Payment Policies. Health Affairs blog, 29 May. Available at:
http://healthaffairs.org/blog/2012/05/29/prescription-drug-shortages-reconsidering-the-role-of-medicare-
payment-policies/.
Jacobson M, Earle C, Price M, Newhouse J. 2010. How Medicare’s Payment Cuts For Cancer
Chemotherapy Drugs Changed Patterns Of Treatment. Health Affairs. 29(7):1391-1399.
Jacobson M, Earle C, Newhouse J. 2012. Geographic Variation in Physicians’ Responses to a
Reimbursement Change. New England Journal of Medicine. 365(22):2049-2052.
Jacobson M, Newhouse JP, Earle CC. 2013. Can Physician Induced Demand Benefit Patients? Evidence
from a Major Change to Medicare Chemotherapy Reimbursement Policy. NBER Working Paper.
Avaiable at: http://users.nber.org/~changt/Jacobsonetal_20130624.pdf.
Knittel PJ, Huckfeldt CR. 2012. Pharmaceutical use following generic entry: paying less and buying less.
MIT working paper. Available at: http://web.mit.edu/knittel/www/papers/hk_latest.pdf.
Kornfield R, Donohue J, Berndt ER, Alexander GC. 2013. Promotion of prescription drugs to consumers
and providers, 2001-2010. PLoS One. 8(3):e55504.
Kweder SL, Dill S. 2013. Drug Shortages: The Cycle of Quantity and Quality. Clinical Pharmacology &
Therapeutics. 93(3):245-251.
Kyle MK. 2006. The role of firm characteristics in pharmaceutical product launches. The RAND Journal
of Economics. 37(3): 602-618.
Macher J, Nickerson J. 2006. Pharmaceutical manufacturing research project, Final benchmarking report.
Available at: http://apps.olin.wustl.edu/faculty/nickerson/results/PMRPFinalReportSept2006.pdf.
Malin JL, Weeks JC, Potosky AL, Hornbrook MC, Keating NL. 2013. Medical oncologists'
perceptions of financial incentives in cancer care. J Clin Oncol. Feb 10;31(5):530-5.

© Conti/Berndt 2014 39
Mankiw NG, Whinston MD. 2002. Free entry and social inefficiency. Rand Journal of Economics. 17:48-
58.
MedPAC. 2006. Report to the Congress: Effects of Medicare Payment Changes on Oncology Services.
Washington, DC. Available at:
http://www.medpac.gov/publications/congressional_reports/Jan06_Oncology_mandated_report.pdf.
Neumann PJ. 2005. Using Cost-Effectiveness Analysis to Improve Health Care. Oxford, United
Kingdom; Oxford University Press.
Panattoni L. 2011. The effect of paragraph IV decisions and generic entry before patent expiration on
brand pharmaceutical firms. Journal of Health Economics. 30(1):126-45.
PAREXEL. 2013. PAREXEL Biopharmaceutical R&D Statistical Sourcebook 2012-2013Available at:
http://www.barnettinternational.com/EducationalServices_Publication.aspx?p=10145&id=115966.
Pharmacy benefit management institute (PBMI). 2014. 2014 Specialty Drug Benefit. Available at:
http://reports.pbmi.com/report.php?id=5.
Pindyck RS, Rubinfeld DL. 2013. Microeconomics, 8th Edition, New York: Prentice-Hall.
Reiffen D, Ward MR. 2005. Generic drug industry dynamics. Review of Economics and Statistics.
87(1):37-49.
Scherer FM. 1993. Pricing, Profits, and Technological Progress in the Pharmaceutical Industry. The
Journal of Economic Perspectives. 7(3):97-115.
Scott-Morton FM. 1999. Entry decisions in the generic pharmaceutical industry. RAND Journal of
Economics. 30(3): 421-440.
Scott-Morton FM. 2000. Barriers to entry, brand advertising, and generic entry in the U.S.
pharmaceutical industry. International Journal of Industrial Organization. 18:1085-1104.

© Conti/Berndt 2014 40
Stromberg C. 2014. Drug shortages, pricing, and regulatory authority. Washington DC: Bates-White
LLC, unpublished February.
Tirole J. 1988. The Theory of Industrial Organization. Cambridge, MA: MIT Press.
Towle EL, Barr TR. 2009. 2009 National Practice Benchmark: report on 2008 data. J
Oncol Pract. Sep;5(5):223-7.
Towle EL, Barr TR. 2010. National Practice Benchmark: 2010 report on 2009 data. J
Oncol Pract. Sep;6(5):228-31. Erratum in: J Oncol Pract. 2011 Mar;7(2):134.
Towle EL, Barr TR, Senese JL. 2012. National Oncology Practice Benchmark, 2012
report on 2011 data. J Oncol Pract. 2012 Nov;8(6):51s-70s.
U.S. Department of Health and Human Services, Centers for Medicare and Medicaid Services (CMS).
2014. Medicare Fee for Service Part B Drugs reimbursement fee schedules 2005-2013. Available at:
http://www.cms.gov/Medicare/Medicare-Fee-for-Service-Part-B-
Drugs/McrPartBDrugAvgSalesPrice/2013ASPFiles.html
U.S. Department of Health and Human Services, Office of Inspector General. 1997. Excessive Medicare
payments for prescription drugs. OEI-03-96-00290. Available at: http://oig.hhs.gov/oei/reports/oei-03-
97-00290.pdf.
U.S. Department of Health and Human Services, Office of Inspector General. 2010. Drug Manufacturers’
Noncompliance With Average Manufacturer Price Reporting Requirements. Available at:
http://oig.hhs.gov/oei/reports/oei-03-09-00060.pdf.
U.S. Food and Drug Administration. 2011. Pathway for global drug safety and quality. Available at:
http://www.fda.gov/AboutFDA/CentersOffices/OfficeofGlobalRegulatoryOperationsandPolicy/GlobalPro
ductPathway/default.htm
U.S. Food and Drug Administration. 2013. Strategic plan for preventing and mitigating drug shortages.
Available at: http://www.fda.gov/downloads/Drugs/DrugSafety/DrugShortages/UCM372566.pdf

© Conti/Berndt 2014 41
U.S. Department of Health and Human Services, Assistant Secretary of Planning and Evaluation (ASPE).
2011. Economic Analysis of the Causes of Drug Shortages. Issue Brief. October. Available at:
http://aspe.hhs.gov/sp/reports/2011/DrugShortages/ib.shtm
U.S. Department of Health and Human Services, Office of the Inspector General. 2011. Medicare
Payments for Newly Available Generic Drugs. OEI-03-09-00510. Available at
https://oig.hhs.gov/oei/reports/oei-03-09-00510.pdf.
U.S. Government Accountability Office. 2004. Medicare chemotherapy payments: new drug and
administration fees are closer to providers’ costs. GAO-05-142R. Available at:
http://www.gao.gov/new.items/d05142r.pdf.
U.S. Government Accounting Office. 2011. Manufacturer Discounts in the 340B Program Offer Benefits
but Federal Over-sight Needs Improvement. GAO-11-836. Available at:
http://www.gao.gov/new.items/d11836.pdf.
U.S. Government Accountability Office. 2013. Information on Highest-Expenditure Part B Drugs.
GAO-13-739T. Available at: http://www.gao.gov/products/GAO-13-739T.
Varian HR. 1989. Price discrimination. In Schmalensee RL and Willig R (eds.), Handbook of Industrial
Organization, Amsterdam: North Holland Elsevier, Vol. 1, pp. 597-654.
Wiggins SN, Maness R. 2004. Price competition in pharmaceuticals: the case of anti-infectives.
Economic Inquiry. 42(2):247-263.
Wilson D. 2012. Deepening drug shortages. Health Aff (Millwood). Feb;31(2):263-6.
Woodcock J, Wosinska M. 2013. Economic and technological drivers of sterile injectable drug shortages.
Clinical Pharmacology & Therapeutics. 93(2); 170–176. Available at:
http://www.nature.com/clpt/journal/v93/n2/full/clpt2012220a.html
Yabroff KR, Lamont EB, Mariotto A, Warren JL, Topor M, Meekins A, Brown ML. 2008. Cost of care
for elderly cancer patients in the United States. Journal of the National Cancer Institute. 100(9):630-41.
Epub Apr 29.

© Conti/Berndt 2014 42
Yurukoglu A. 2012. Medicare Reimbursements and Shortages of Sterile Injectable Pharmaceuticals.
NBER Working Paper No. 17987. http://www.nber.org/papers/w17987.

© Conti/Berndt 2014 43
APPENDIX TABLES

© Conti/Berndt 2014 44
Genericalways Genericentry Entryyear
n=50 n=41
BLEOMYCINIAGINJECT,MULTADMREG ARSENICIACINJECT,IVREG 2006
CARMUSTINEIACINJECT,IVREG BUSULFANOSRORALS,SOL,TAB/CAPRE 2003
CHLORAMBUCILOSRORALS,SOL,TAB/CAPRE CARBOPLATINIACINJECT,IVREG 2004
CISPLATINIACINJECT,IVREG CLADRIBINEIAGINJECT,MULTADMREG 2004
CLADRIBINEIACINJECT,IVREG CLADRIBINEIACINJECT,IVREG 2004CYTARABINEIAGINJECT,MULTADMREG CYCLOPHOSPHAMIDEIACINJECT,IVREG 2004
DACARBAZINEIACINJECT,IVREG CYCLOPHOSPHAMIDEOSRORALS,SOL,TAB/CAP 2004
DAUNORUBICINIACINJECT,IVREG DEXRAZOXANEIAKINJECT,INFUSIONREG 2005
DOLASETRONIACINJECT,IVREG DEXRAZOXANEIACINJECT,IVREG 2005
DOXORUBICINIACINJECT,IVREG DIMENHYDRINATEIAGINJECT,MULTADMREG 2004ESTRAMUSTINEOSRORALS,SOL,TAB/CAPRE DIMENHYDRINATEOSCORALS,SOL,CHEWABLE 2002
ETOPOSIDEIACINJECT,IVREG DIMENHYDRINATEOSRORALS,SOL,TAB/CAPRE 2002
ETOPOSIDEOSRORALS,SOL,TAB/CAPRE DIMENHYDRINATE!SCOPOLAMINEOSRORALS,SO 2002
FLOXURIDINEIACINJECT,IVREG EPIRUBICINIACINJECT,IVREG 2006
FLUOROURACILDDCDERM,CREAM FLUDARABINEIACINJECT,IVREG 2003FLUOROURACILDDLDERM,LIQUID/LOTION IDARUBICINIACINJECT,IVREG 2004
FLUOROURACILIACINJECT,IVREG IFOSFAMIDEIACINJECT,IVREG 2004
FLUOROURACILTOZOTHERTOPICALS IFOSFAMIDE!MESNASAZOTHERSYSTEMICS 2004
FLUTAMIDEOSRORALS,SOL,TAB/CAPRE LEUPROLIDEIAAINJECT,IMREG 2004
FRUCTOSE!GLUCOSE!PHOSPHORICACIDOLLOR LEUPROLIDEIAEINJECT,SUBCUTREG 2004FRUCTOSE!GLUCOSE!PHOSPHORICACIDOSCOR LEUPROLIDEIAFINJECT,SUBCUTL.A 2004
GOSERELINIAFINJECT,SUBCUTL.A LEUPROLIDESAZOTHERSYSTEMICS 2004
HYDROXYUREAOSRORALS,SOL,TAB/CAPRE LEUPROLIDE!LIDOCAINESAZOTHERSYSTEMIC 2004
LEUCOVORINIAGINJECT,MULTADMREG MERCAPTOPURINEOSRORALS,SOL,TAB/CAPRE 2004LEUCOVORINOSRORALS,SOL,TAB/CAPRE MITOXANTRONEIACINJECT,IVREG 2006LOMUSTINEOSRORALS,SOL,TAB/CAPRE ONDANSETRONIACINJECT,IVREG 2006
MECHLORETHAMINEIACINJECT,IVREG ONDANSETRONIVRINJECT,IVPIGBACK 2007
MECLIZINEOSCORALS,SOL,CHEWABLE ONDANSETRONOLLORALS,LIQ,NON-SPECL 2007
MECLIZINEOSRORALS,SOL,TAB/CAPRE ONDANSETRONOLRORALS,LIQ,READY-MDE 2007MEGESTROLOLRORALS,LIQ,READY-MDE ONDANSETRONOSOORALS,SOL,TAB/CAPOT 2007
MEGESTROLOSRORALS,SOL,TAB/CAPRE ONDANSETRONOSRORALS,SOL,TAB/CAPRE 2007
MESNAIACINJECT,IVREG PENTOSTATINIACINJECT,IVREG 2007
MESNAOSRORALS,SOL,TAB/CAPRE SCOPOLAMINEJWTINSRT/IMPLANT,TRANSD 2003METHOTREXATEIAGINJECT,MULTADMREG SCOPOLAMINEOSRORALS,SOL,TAB/CAPRE 2003METHOTREXATEOSRORALS,SOL,TAB/CAPRE TAMOXIFENOSRORALS,SOL,TAB/CAPRE 2002
METHOXSALENIAXINJECT,OTHERREG TAMOXIFENOLLORALS,LIQ,NON-SPECL 2002
METHOXSALENYAZALLOTHERS TRETINOINOSRORALS,SOL,TAB/CAPRE 2007MITOMYCINIACINJECT,IVREG TRIMETHOBENZAMIDEIAAINJECT,IMREG 2002
MITOTANEOSRORALS,SOL,TAB/CAPRE TRIMETHOBENZAMIDEOSRORALS,SOL,TAB/CAP 2002PACLITAXELIACINJECT,IVREG TRIMETHOBENZAMIDERRSRECTALSSYST,SUPP 2002
PEGASPARGASEIAGINJECT,MULTADMREG VINORELBINEIACINJECT,IVREG 2003
PROCARBAZINEOSRORALS,SOL,TAB/CAPREPROCHLORPERAZINEIAGINJECT,MULTADMRE
PROCHLORPERAZINEOSRORALS,SOL,TAB/CAPPROCHLORPERAZINERRSRECTALSSYST,SUPPO
STREPTOZOCINIACINJECT,IVREGTESTOLACTONEOSRORALS,SOL,TAB/CAPRE
THIOTEPAIACINJECT,IVREG
VINBLASTINEIACINJECT,IVREGVINCRISTINEIACINJECT,IVREG
Molecules/formsinsample
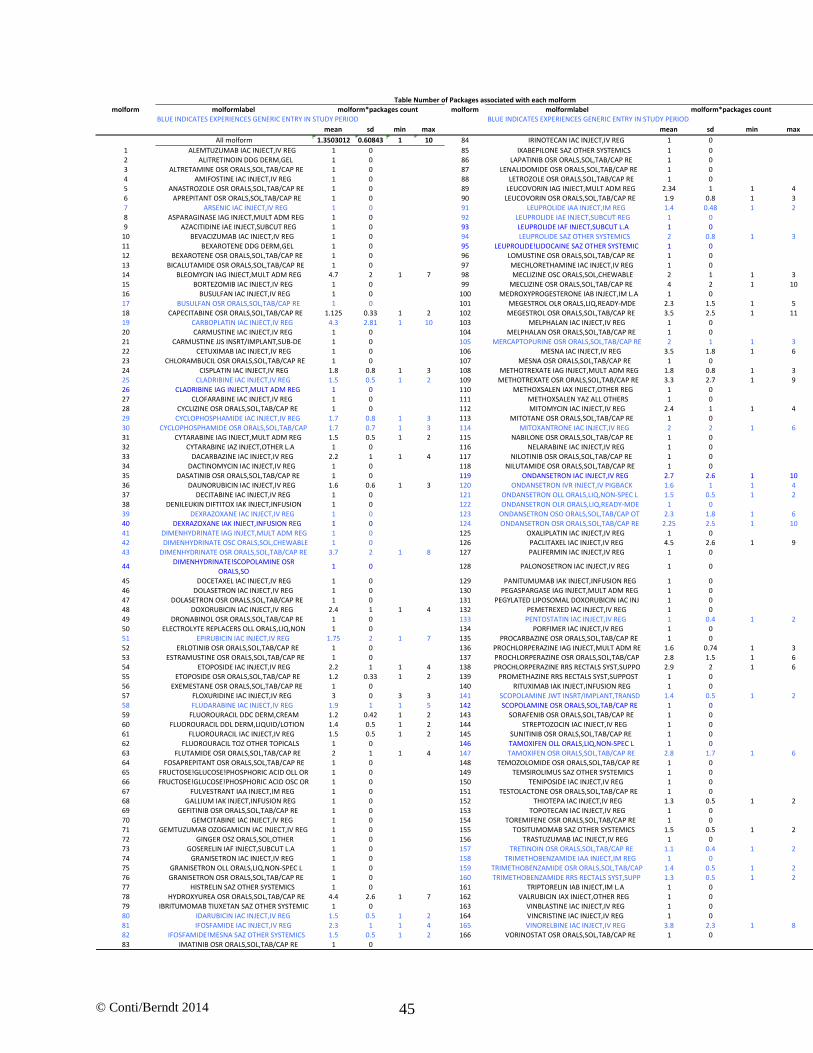
© Conti/Berndt 2014 45
molform molformlabel molform molformlabel
BLUEINDICATESEXPERIENCESGENERICENTRYINSTUDYPERIOD BLUEINDICATESEXPERIENCESGENERICENTRYINSTUDYPERIOD
mean sd min max mean sd min max
Allmolform 1.3503012 0.60843 1 10 84 IRINOTECANIACINJECT,IVREG 1 0
1 ALEMTUZUMABIACINJECT,IVREG 1 0 85 IXABEPILONESAZOTHERSYSTEMICS 1 02 ALITRETINOINDDGDERM,GEL 1 0 86 LAPATINIBOSRORALS,SOL,TAB/CAPRE 1 0
3 ALTRETAMINEOSRORALS,SOL,TAB/CAPRE 1 0 87 LENALIDOMIDEOSRORALS,SOL,TAB/CAPRE 1 04 AMIFOSTINEIACINJECT,IVREG 1 0 88 LETROZOLEOSRORALS,SOL,TAB/CAPRE 1 0
5 ANASTROZOLEOSRORALS,SOL,TAB/CAPRE 1 0 89 LEUCOVORINIAGINJECT,MULTADMREG 2.34 1 1 46 APREPITANTOSRORALS,SOL,TAB/CAPRE 1 0 90 LEUCOVORINOSRORALS,SOL,TAB/CAPRE 1.9 0.8 1 37 ARSENICIACINJECT,IVREG 1 0 91 LEUPROLIDEIAAINJECT,IMREG 1.4 0.48 1 2
8 ASPARAGINASEIAGINJECT,MULTADMREG 1 0 92 LEUPROLIDEIAEINJECT,SUBCUTREG 1 09 AZACITIDINEIAEINJECT,SUBCUTREG 1 0 93 LEUPROLIDEIAFINJECT,SUBCUTL.A 1 0
10 BEVACIZUMABIACINJECT,IVREG 1 0 94 LEUPROLIDESAZOTHERSYSTEMICS 2 0.8 1 3
11 BEXAROTENEDDGDERM,GEL 1 0 95 LEUPROLIDE!LIDOCAINESAZOTHERSYSTEMIC 1 012 BEXAROTENEOSRORALS,SOL,TAB/CAPRE 1 0 96 LOMUSTINEOSRORALS,SOL,TAB/CAPRE 1 0
13 BICALUTAMIDEOSRORALS,SOL,TAB/CAPRE 1 0 97 MECHLORETHAMINEIACINJECT,IVREG 1 014 BLEOMYCINIAGINJECT,MULTADMREG 4.7 2 1 7 98 MECLIZINEOSCORALS,SOL,CHEWABLE 2 1 1 315 BORTEZOMIBIACINJECT,IVREG 1 0 99 MECLIZINEOSRORALS,SOL,TAB/CAPRE 4 2 1 10
16 BUSULFANIACINJECT,IVREG 1 0 100 MEDROXYPROGESTERONEIABINJECT,IML.A 1 017 BUSULFANOSRORALS,SOL,TAB/CAPRE 1 0 101 MEGESTROLOLRORALS,LIQ,READY-MDE 2.3 1.5 1 5
18 CAPECITABINEOSRORALS,SOL,TAB/CAPRE 1.125 0.33 1 2 102 MEGESTROLOSRORALS,SOL,TAB/CAPRE 3.5 2.5 1 11
19 CARBOPLATINIACINJECT,IVREG 4.3 2.81 1 10 103 MELPHALANIACINJECT,IVREG 1 020 CARMUSTINEIACINJECT,IVREG 1 0 104 MELPHALANOSRORALS,SOL,TAB/CAPRE 1 0
21 CARMUSTINEJJSINSRT/IMPLANT,SUB-DE 1 0 105 MERCAPTOPURINEOSRORALS,SOL,TAB/CAPRE 2 1 1 322 CETUXIMABIACINJECT,IVREG 1 0 106 MESNAIACINJECT,IVREG 3.5 1.8 1 6
23 CHLORAMBUCILOSRORALS,SOL,TAB/CAPRE 1 0 107 MESNAOSRORALS,SOL,TAB/CAPRE 1 0
24 CISPLATINIACINJECT,IVREG 1.8 0.8 1 3 108 METHOTREXATEIAGINJECT,MULTADMREG 1.8 0.8 1 325 CLADRIBINEIACINJECT,IVREG 1.5 0.5 1 2 109 METHOTREXATEOSRORALS,SOL,TAB/CAPRE 3.3 2.7 1 9
26 CLADRIBINEIAGINJECT,MULTADMREG 1 0 110 METHOXSALENIAXINJECT,OTHERREG 1 027 CLOFARABINEIACINJECT,IVREG 1 0 111 METHOXSALENYAZALLOTHERS 1 0
28 CYCLIZINEOSRORALS,SOL,TAB/CAPRE 1 0 112 MITOMYCINIACINJECT,IVREG 2.4 1 1 429 CYCLOPHOSPHAMIDEIACINJECT,IVREG 1.7 0.8 1 3 113 MITOTANEOSRORALS,SOL,TAB/CAPRE 1 030 CYCLOPHOSPHAMIDEOSRORALS,SOL,TAB/CAP 1.7 0.7 1 3 114 MITOXANTRONEIACINJECT,IVREG 2 2 1 6
31 CYTARABINEIAGINJECT,MULTADMREG 1.5 0.5 1 2 115 NABILONEOSRORALS,SOL,TAB/CAPRE 1 032 CYTARABINEIAZINJECT,OTHERL.A 1 0 116 NELARABINEIACINJECT,IVREG 1 0
33 DACARBAZINEIACINJECT,IVREG 2.2 1 1 4 117 NILOTINIBOSRORALS,SOL,TAB/CAPRE 1 0
34 DACTINOMYCINIACINJECT,IVREG 1 0 118 NILUTAMIDEOSRORALS,SOL,TAB/CAPRE 1 035 DASATINIBOSRORALS,SOL,TAB/CAPRE 1 0 119 ONDANSETRONIACINJECT,IVREG 2.7 2.6 1 10
36 DAUNORUBICINIACINJECT,IVREG 1.6 0.6 1 3 120 ONDANSETRONIVRINJECT,IVPIGBACK 1.6 1 1 437 DECITABINEIACINJECT,IVREG 1 0 121 ONDANSETRONOLLORALS,LIQ,NON-SPECL 1.5 0.5 1 238 DENILEUKINDIFTITOXIAKINJECT,INFUSION 1 0 122 ONDANSETRONOLRORALS,LIQ,READY-MDE 1 0
39 DEXRAZOXANEIACINJECT,IVREG 1 0 123 ONDANSETRONOSOORALS,SOL,TAB/CAPOT 2.3 1.8 1 640 DEXRAZOXANEIAKINJECT,INFUSIONREG 1 0 124 ONDANSETRONOSRORALS,SOL,TAB/CAPRE 2.25 2.5 1 10
41 DIMENHYDRINATEIAGINJECT,MULTADMREG 1 0 125 OXALIPLATINIACINJECT,IVREG 1 042 DIMENHYDRINATEOSCORALS,SOL,CHEWABLE 1 0 126 PACLITAXELIACINJECT,IVREG 4.5 2.6 1 9
43 DIMENHYDRINATEOSRORALS,SOL,TAB/CAPRE 3.7 2 1 8 127 PALIFERMINIACINJECT,IVREG 1 0
44DIMENHYDRINATE!SCOPOLAMINEOSR
ORALS,SO1 0 128 PALONOSETRONIACINJECT,IVREG 1 0
45 DOCETAXELIACINJECT,IVREG 1 0 129 PANITUMUMABIAKINJECT,INFUSIONREG 1 046 DOLASETRONIACINJECT,IVREG 1 0 130 PEGASPARGASEIAGINJECT,MULTADMREG 1 0
47 DOLASETRONOSRORALS,SOL,TAB/CAPRE 1 0 131 PEGYLATEDLIPOSOMALDOXORUBICINIACINJ 1 0
48 DOXORUBICINIACINJECT,IVREG 2.4 1 1 4 132 PEMETREXEDIACINJECT,IVREG 1 049 DRONABINOLOSRORALS,SOL,TAB/CAPRE 1 0 133 PENTOSTATINIACINJECT,IVREG 1 0.4 1 250 ELECTROLYTEREPLACERSOLLORALS,LIQ,NON 1 0 134 PORFIMERIACINJECT,IVREG 1 0
51 EPIRUBICINIACINJECT,IVREG 1.75 2 1 7 135 PROCARBAZINEOSRORALS,SOL,TAB/CAPRE 1 052 ERLOTINIBOSRORALS,SOL,TAB/CAPRE 1 0 136 PROCHLORPERAZINEIAGINJECT,MULTADMRE 1.6 0.74 1 3
53 ESTRAMUSTINEOSRORALS,SOL,TAB/CAPRE 1 0 137 PROCHLORPERAZINEOSRORALS,SOL,TAB/CAP 2.8 1.5 1 654 ETOPOSIDEIACINJECT,IVREG 2.2 1 1 4 138 PROCHLORPERAZINERRSRECTALSSYST,SUPPO 2.9 2 1 6
55 ETOPOSIDEOSRORALS,SOL,TAB/CAPRE 1.2 0.33 1 2 139 PROMETHAZINERRSRECTALSSYST,SUPPOST 1 0
56 EXEMESTANEOSRORALS,SOL,TAB/CAPRE 1 0 140 RITUXIMABIAKINJECT,INFUSIONREG 1 057 FLOXURIDINEIACINJECT,IVREG 3 0 3 3 141 SCOPOLAMINEJWTINSRT/IMPLANT,TRANSD 1.4 0.5 1 2
58 FLUDARABINEIACINJECT,IVREG 1.9 1 1 5 142 SCOPOLAMINEOSRORALS,SOL,TAB/CAPRE 1 059 FLUOROURACILDDCDERM,CREAM 1.2 0.42 1 2 143 SORAFENIBOSRORALS,SOL,TAB/CAPRE 1 0
60 FLUOROURACILDDLDERM,LIQUID/LOTION 1.4 0.5 1 2 144 STREPTOZOCINIACINJECT,IVREG 1 0
61 FLUOROURACILIACINJECT,IVREG 1.5 0.5 1 2 145 SUNITINIBOSRORALS,SOL,TAB/CAPRE 1 062 FLUOROURACILTOZOTHERTOPICALS 1 0 146 TAMOXIFENOLLORALS,LIQ,NON-SPECL 1 063 FLUTAMIDEOSRORALS,SOL,TAB/CAPRE 2 1 1 4 147 TAMOXIFENOSRORALS,SOL,TAB/CAPRE 2.8 1.7 1 664 FOSAPREPITANTOSRORALS,SOL,TAB/CAPRE 1 0 148 TEMOZOLOMIDEOSRORALS,SOL,TAB/CAPRE 1 0
65 FRUCTOSE!GLUCOSE!PHOSPHORICACIDOLLOR 1 0 149 TEMSIROLIMUSSAZOTHERSYSTEMICS 1 0
66 FRUCTOSE!GLUCOSE!PHOSPHORICACIDOSCOR 1 0 150 TENIPOSIDEIACINJECT,IVREG 1 067 FULVESTRANTIAAINJECT,IMREG 1 0 151 TESTOLACTONEOSRORALS,SOL,TAB/CAPRE 1 0
68 GALLIUMIAKINJECT,INFUSIONREG 1 0 152 THIOTEPAIACINJECT,IVREG 1.3 0.5 1 269 GEFITINIBOSRORALS,SOL,TAB/CAPRE 1 0 153 TOPOTECANIACINJECT,IVREG 1 0
70 GEMCITABINEIACINJECT,IVREG 1 0 154 TOREMIFENEOSRORALS,SOL,TAB/CAPRE 1 0
71 GEMTUZUMABOZOGAMICINIACINJECT,IVREG 1 0 155 TOSITUMOMABSAZOTHERSYSTEMICS 1.5 0.5 1 272 GINGEROSZORALS,SOL,OTHER 1 0 156 TRASTUZUMABIACINJECT,IVREG 1 073 GOSERELINIAFINJECT,SUBCUTL.A 1 0 157 TRETINOINOSRORALS,SOL,TAB/CAPRE 1.1 0.4 1 274 GRANISETRONIACINJECT,IVREG 1 0 158 TRIMETHOBENZAMIDEIAAINJECT,IMREG 1 0
75 GRANISETRONOLLORALS,LIQ,NON-SPECL 1 0 159 TRIMETHOBENZAMIDEOSRORALS,SOL,TAB/CAP 1.4 0.5 1 2
76 GRANISETRONOSRORALS,SOL,TAB/CAPRE 1 0 160 TRIMETHOBENZAMIDERRSRECTALSSYST,SUPP 1.3 0.5 1 277 HISTRELINSAZOTHERSYSTEMICS 1 0 161 TRIPTORELINIABINJECT,IML.A 1 078 HYDROXYUREAOSRORALS,SOL,TAB/CAPRE 4.4 2.6 1 7 162 VALRUBICINIAXINJECT,OTHERREG 1 079 IBRITUMOMABTIUXETANSAZOTHERSYSTEMIC 1 0 163 VINBLASTINEIACINJECT,IVREG 1 080 IDARUBICINIACINJECT,IVREG 1.5 0.5 1 2 164 VINCRISTINEIACINJECT,IVREG 1 081 IFOSFAMIDEIACINJECT,IVREG 2.3 1 1 4 165 VINORELBINEIACINJECT,IVREG 3.8 2.3 1 882 IFOSFAMIDE!MESNASAZOTHERSYSTEMICS 1.5 0.5 1 2 166 VORINOSTATOSRORALS,SOL,TAB/CAPRE 1 083 IMATINIBOSRORALS,SOL,TAB/CAPRE 1 0
molform*packagescount molform*packagescount
TableNumberofPackagesassociatedwitheachmolform

© Conti/Berndt 2014 46

© Conti/Berndt 2014 47
molformnumber
106 MESNAIACINJECT,IVREG
16 BUSULFANIACINJECT,IVREG111 METHOXSALENYAZALLOTHERS
152 THIOTEPAIACINJECT,IVREG
24 CISPLATINIACINJECT,IVREG
54 ETOPOSIDEIACINJECT,IVREG
103 MELPHALANIACINJECT,IVREG
112 MITOMYCINIACINJECT,IVREG4 AMIFOSTINEIACINJECT,IVREG
20 CARMUSTINEIACINJECT,IVREG
80 IDARUBICINIACINJECT,IVREG
84 IRINOTECANIACINJECT,IVREG
91 LEUPROLIDEIAAINJECT,IMREG126 PACLITAXELIACINJECT,IVREG
19 CARBOPLATINIACINJECT,IVREG
33 DACARBAZINEIACINJECT,IVREG
39 DEXRAZOXANEIACINJECT,IVREG48 DOXORUBICINIACINJECT,IVREG
57 FLOXURIDINEIACINJECT,IVREG58 FLUDARABINEIACINJECT,IVREG
74 GRANISETRONIACINJECT,IVREG119 ONDANSETRONIACINJECT,IVREG
133 PENTOSTATINIACINJECT,IVREG
163 VINBLASTINEIACINJECT,IVREG164 VINCRISTINEIACINJECT,IVREG
36 DAUNORUBICINIACINJECT,IVREG61 FLUOROURACILIACINJECT,IVREG
94 LEUPROLIDESAZOTHERSYSTEMICS
144 STREPTOZOCINIACINJECT,IVREG32 CYTARABINEIAZINJECT,OTHERL.A92 LEUPROLIDEIAEINJECT,SUBCUTREG
93 LEUPROLIDEIAFINJECT,SUBCUTL.A
110 METHOXSALENIAXINJECT,OTHERREG
14 BLEOMYCINIAGINJECT,MULTADMREG
97 MECHLORETHAMINEIACINJECT,IVREG120 ONDANSETRONIVRINJECT,IVPIGBACK
29 CYCLOPHOSPHAMIDEIACINJECT,IVREG
31 CYTARABINEIAGINJECT,MULTADMREG
55 ETOPOSIDEOSRORALS,SOL,TAB/CAPRE
89 LEUCOVORINIAGINJECT,MULTADMREG96 LOMUSTINEOSRORALS,SOL,TAB/CAPRE
104 MELPHALANOSRORALS,SOL,TAB/CAPRE
157 TRETINOINOSRORALS,SOL,TAB/CAPRE
40 DEXRAZOXANEIAKINJECT,INFUSIONREG
108 METHOTREXATEIAGINJECT,MULTADMREG
141 SCOPOLAMINEJWTINSRT/IMPLANT,TRANSD142 SCOPOLAMINEOSRORALS,SOL,TAB/CAPRE
18 CAPECITABINEOSRORALS,SOL,TAB/CAPRE
109 METHOTREXATEOSRORALS,SOL,TAB/CAPRE
30 CYCLOPHOSPHAMIDEOSRORALS,SOL,TAB/CAP38 DENILEUKINDIFTITOXIAKINJECT,INFUSION105 MERCAPTOPURINEOSRORALS,SOL,TAB/CAPRE
131 PEGYLATEDLIPOSOMALDOXORUBICINIACINJ
136 PROCHLORPERAZINEIAGINJECT,MULTADMRE
TableMolformswithShortagesReportedinYearsAfterStudyPeriodmolform