Embed Size (px)
Citation preview
Special Report
1501 MACY DRIVE ROSWELL, GA 30076 PH +1 770 642-7745 FX +1 770 643-2954
Impact of DOE Inventory Sales on the Nuclear Fuel Markets
January | 2015 A PUBLICATION OF UXC.COM
PREPARED FOR
Cameco Corporation

– NOTICE – The Ux Consulting Company, LLC (“UxC”) shall have title to, ownership of, and all proprietary rights in this Report. Under United States federal copyright law (17 USC 101 et seq.) it is illegal to reproduce this Report by any means without written permission from UxC.
The information contained in this Report is obtained from sources that UxC believes to be reliable. UxC makes no war-ranty or representation, express or implied, with respect to the accuracy, completeness or usefulness of the information contained in this Report and UxC, to the maximum extent permitted by law, assumes no liability for the use or effects of any of the information or data contained in this Report.
It is UxC’s strict policy not to endorse, promote, or recommend any particular securities, currencies, or other financial products or instruments. Nothing contained in this Report is intended to constitute investment, legal, tax, accounting or other professional advice and the reader should not rely on the information provided in this Report for making financial decisions.
The Ux U3O8 Price® and other Ux Price indicators are developed by The Ux Consulting Company, LLC (UxC) and are proprietary and exclusive intellectual property of UxC. These price indicators are provided to UxC’s customers through the Ux Weekly® publication and are made available on UxC’s public website solely at UxC’s discretion. They may not be reproduced or otherwise used without UxC’s express permission.
UxC®, Ux Weekly®, Ux U3O8 Price®, Ux®, and Ux Consulting®, U-PRICE™, and SWU-PRICE® are trademarks of The Ux Consulting Company, LLC.

Impact of DOE Inventory Sales - Jan 2015 Table of Contents
© 2015 UxC 1
Table of Contents Executive Summary _________________________________________________________________________ 2
1 – Introduction ____________________________________________________________________________ 3
2 – Sales/Transfers of Excess DOE Uranium Inventory: 2012-2014 __________________________________ 5 Impact on Uranium Prices ............................................................................................................................................ 6 Impact on SWU Prices ................................................................................................................................................. 8
3 – Sales/Transfers of Excess DOE Uranium Inventory: 2015-2030 _________________________________ 10 Impact on Uranium Prices .......................................................................................................................................... 10 Impact on SWU Prices ............................................................................................................................................... 12
4 – Impact of DOE Inventory Sales on the Conversion Market _____________________________________ 14
5 – Summary & Conclusions ________________________________________________________________ 17
Appendix A – UxC U-PRICE™ Forecasting Model Structure _______________________________________ 19 Demand Submodel .................................................................................................................................................... 20 Supply Submodel ....................................................................................................................................................... 21 Price Submodel .......................................................................................................................................................... 21
Appendix B – UxC SWU-PRICE® Forecasting Model Structure ____________________________________ 22
Appendix C – DOE Uranium Inventory Sales/Barter Quantities ____________________________________ 24
List of Figures Figure 1. DOE Excess Inventory Sales/Transfers – Impact on Spot U3O8 Price ....................................................... 7 Figure 2. DOE Excess Inventory Sales/Transfers – Impact on Term U3O8 Price ...................................................... 7 Figure 3. DOE Excess Inventory Sales/Transfers – Impact on Term SWU Price ...................................................... 9 Figure 4. DOE Excess Inventory Sales/Transfers – Impact on Spot SWU Price ....................................................... 9 Figure 5. Uranium Spot Price Projections ................................................................................................................ 11 Figure 6. Uranium Term Price Projections ............................................................................................................... 11 Figure 7. SWU Term Price Projections ..................................................................................................................... 12 Figure 8. SWU Spot Price Projections ...................................................................................................................... 13 Figure 9. Ux Conversion Prices, 1995-2014 ............................................................................................................. 14 Figure 10. Ux North American (NA) UF6 Price vs. Value, 2008-2014 ...................................................................... 15 Figure 11. U-PRICE Model Structure ....................................................................................................................... 19 Figure 12. SWU-PRICE Model Structure ................................................................................................................. 22
List of Tables Table 1. DOE Uranium Inventory Sales/Barter Quantities Used in UxC’s Analysis ................................................. 24
Executive Summary Impact of DOE Inventory Sales - Jan 2015
2 © 2015 UxC
Executive Summary DOE’s Request for Information (RFI) raised two questions related to the impacts of the Department’s excess uranium inventory sales on the front-end markets for nuclear fuel. The first question deals with the historical impact of DOE’s sales and transfers on the markets during 2012 to 2014. The second question concerns the future market impacts assuming there will be continued transfers and sales by DOE. Using UxC’s proprietary U-PRICE™ and SWU-PRICE® models, this report presents an analysis addressing these two questions.
• Both U-PRICE and SWU-PRICE models are econometrically-based recursive simulation models. Using the interrelationship between uranium and enrichment as one of the key model inputs, these two models are linked to form an integrated analytical framework. More importantly, the price interdependency between uranium and SWU is explicitly modeled and solved simultaneously.
• Two approaches were developed to estimate the market impact of DOE’s sales and transfers during 2012 to 2014. The incremental impact approach focuses on the market impact of new or incremental DOE sales. The total impact approach captures the cumulative effect of all DOE sales previously made and the incremental impact of new sales over time. The key reason to include previous sales is because such sales have a longer-term effect on market perceptions among both buyers and sellers. In particular, the increased supplies from DOE’s sales and transfers removed market opportunities available to other uranium suppliers. For the uranium spot price, the negative impacts of DOE’s sales and transfers averaged 11% (or $4.50/lb U3O8) and 16% (or $7.11/lb U3O8) per year using the incremental and total impact approach, respectively.
• The price forecasts developed using the U-PRICE and SWU-PRICE models demonstrate that DOE’s sales and transfers will always negatively affect the front-end markets in terms of prices. In particular, when market conditions are characterized as poor or weak, the negative effect from this additional supply source is likely to further aggravate the market at a noticeably larger scale. For example, in the near and medium terms (2015-2017) with weak market conditions, the negative impact on the uranium spot price is projected to average about 14.1% per year. This compares with a smaller impact of 7.1% per year when the market is expected to show a recovery after the medium term. In this regard, if DOE’s sales and transfers are reduced, or at least capped at the level that was previously agreed upon in a weak market such as the current uranium market, it would help to stabilize the price by eliminating market uncertainties associated with DOE supply.

Impact of DOE Inventory Sales - Jan 2015 1 – Introduction
© 2015 UxC 3
1 – Introduction The Ux Consulting Company, LLC (UxC) has been asked by Cameco Corporation to address two of the questions raised in DOE’s Request for Information (RFI) relating to DOE uranium sales and their impact on front-end markets. Specifically, these two questions are:
• Question 2: With respect to transfers from DOE’s excess uranium inventory in calendar year 2012, 2013, and 2014, what have been the effects of transfers in uranium markets and the consequences for the domestic uranium mining, conversion, and enrichment industries relative to other market conditions?
• Question 3: What market effects and industry consequences could DOE expect from continued transfers at annual rates comparable to the transfers described in the 2014 Secretarial Determination?
To do this, we are using the U-PRICE™1 and SWU-PRICE®2 models developed and run for UxC by Dr. Lydia Hsieh, a consultant to UxC. Both models are econometri-cally-based recursive simulation models that take into account and quantify the im-pact of key factors influencing the markets at the same time. Using the interrelation-ship between uranium (i.e., the natural resource) and enrichment (i.e., the technology) as one of the key model inputs, these two models can be linked to form an integrated analytical framework of the two key components of the nuclear fuel cycle market: uranium and enrichment. This unique feature also offers the potential of performing sensitivity analyses that involve both the uranium and enrichment industries.
In performing these analyses, Dr. Hsieh worked with an UxC team that supplied data used as inputs for the models and reviewed and verified their results. Dr. Hsieh’s ex-pertise includes performing extensive analysis of statistical data, developing econo-metric models and forecasts, and conducting in-depth customer satisfaction research for performance measurement and improvement. She has considerable experience in nuclear fuel market analysis and modeling, having worked as senior fuel economist for the New York Power Authority and manager of Customer Research & Infor-mation for the DTE Energy Company.
At the outset, it should be pointed out that this analysis incorporates the impacts of the interrelationship between the uranium and enrichment markets. That is, what happens in the uranium market is impacted by developments in the enrichment mar-ket, and vice versa. Our analysis seeks to capture this interrelationship by looking at the market in an integrated fashion. In this respect, enrichment prices are used as an input into uranium price forecasts, and the reverse is true when it comes to enrich-ment price forecasts.
1 “Development of the UxC U-PRICE™ Model,” Uranium Market Outlook report, UxC, Q4 2014. See Appendix A for detailed model structure. 2 “Development of the UxC SWU-PRICE® Model,” Enrichment Market Outlook report, UxC, Q2 2013. See Appendix B for detailed model
structure.
1 – Introduction Impact of DOE Inventory Sales - Jan 2015
4 © 2015 UxC
This analysis also employs an approach that captures the cumulative impact of all DOE sales as well as the incremental impact of new sales. In other words, the market is impacted by both previous sales as well as new sales, as such sales affect market perceptions and market opportunities available to other suppliers. By broadening and more correctly constructing the scope of the analysis, the results here more fully cap-ture the overall impact of DOE sales.

Impact of DOE Inventory Sales - Jan 2015 2 – Sales/Transfers of Excess DOE Uranium Inventory: 2012-2014
© 2015 UxC 5
2 – Sales/Transfers of Excess DOE Uranium Inventory: 2012-2014 This section presents two methodologies developed by UxC to quantify the effects of transfers and sales from DOE’s excess uranium inventory3 in calendar year 2012, 2013, and 2014 on the uranium and enrichment industries. While the additional sup-plies resulting from DOE’s transfers and sales could affect the domestic industries in many ways (such as declining market price and job eliminations due to lower demand for labor), this analysis focuses on the overall price impact on these two industries.
UxC’s proprietary U-PRICE™ and SWU-PRICE® models were used as the analytical tools to estimate the price impacts on the uranium and enrichment markets due to DOE’s inventory sales and transfers during 2012 to 2014. Both of these models were developed using historical data of the nuclear fuel markets collected and compiled by UxC. The estimation and evaluation of all regression equations in the models were conducted using standard econometric techniques.
The U-PRICE model consists of three major submodels that focus on the details of demand, supply, and price of the uranium market. These three submodels interact with each other and can be simulated as a complete recursive system that quantifies the causal relationships and interdependencies among various key variables of the uranium industry. Similarly, the SWU-PRICE model includes a set of multivariate equations that quantify the interrelationships among different market variables of the enrichment industry. Both the U-PRICE and SWU-PRICE models were designed us-ing the substitutability between uranium (i.e., the natural resource) and enrichment (i.e., the technology) as one of the key model inputs. For example, the spot price of uranium is used as an input to the SWU-PRICE model to reflect the potential impact of changes in the uranium market on the enrichment service. In a similar manner, the U-PRICE model has the SWU price as an input that links the interactions of the two markets. Simulating both models at the same time provides an integrated framework for the two key components of the nuclear fuel cycle, uranium and enrichment. More importantly, the price interdependency between uranium and SWU is explicitly mod-eled and solved simultaneously.
UxC has developed two methodologies to quantify the impact of DOE’s excess ura-nium inventory transfers and sales during 2012 to 2014. The first approach, the in-cremental or partial impact approach, which examines the effect of the incremental or new transfers and sales from DOE’s inventory during the study period of 2012-2014. Specifically, this approach does not take into account the cumulative impact of previ-ous years’ sales and transfers of excess uranium inventory. The second approach, the total impact approach, captures the cumulative impact of all DOE sales as well as the incremental impact of new or additional sales over time. The key reason to include previous sales is because such sales have a longer-term effect on market perceptions among both buyers and sellers. In particular, the increased supplies from DOE’s sales and transfers took away market opportunities available to other uranium suppli-
3 UxC’s compiled data of transfers and sales of DOE’s excess uranium inventory was used to develop the analysis.
2 – Sales/Transfers of Excess DOE Uranium Inventory: 2012-2014 Impact of DOE Inventory Sales - Jan 2015
6 © 2015 UxC
ers. By broadening and more correctly constructing the scope of the analysis, the re-sults here more fully capture the overall impact of DOE sales.
Using these two approaches, the section below presents and compares the estimated impacts from transfers and sales of DOE’s excess uranium inventory on the uranium and enrichment markets during the three-year period from 2012 to 2014.
Impact on Uranium Prices As previously discussed, the incremental impact approach focuses on estimating the impact of the incremental or new transfers and sales from DOE’s inventory on the uranium and enrichment markets. Using this approach, the analysis began with the assumption that there were no transfers and sales from DOE’s excess uranium inven-tory during the study period from 2012 to 2014. This assumption allows us to use the prices (both spot and long-term contracts) and other market data of 2011 as the start-ing point for simulating both U-PRICE and SWU-PRICE models simultaneously. Once the initial values of the endogenous (projected) variables of each model are known, the future values of each of these variables can be determined sequentially by simulating the model in conjunction with the set of exogenous (input) variables as a complete system.
As compared to the actual spot price of uranium, the negative impact of DOE’s trans-fers and sales during 2012 to 2014 averaged about $4.50/lb U3O8. In other words, all other things being equal, the average spot price of uranium could be $4.50/lb higher if DOE did not sell or transfer its excess inventory during the three year period from 2012 to 2014. This estimated price decrease of $4.50/lb is equivalent to an average decline in the spot price of 11%. It should be noted that, since both U-PRICE and SWU-PRICE were simulated simultaneously, the estimated impact on the uranium spot price captures the feedback from the lower SWU price, which was also affected by DOE’s sales and transfers.
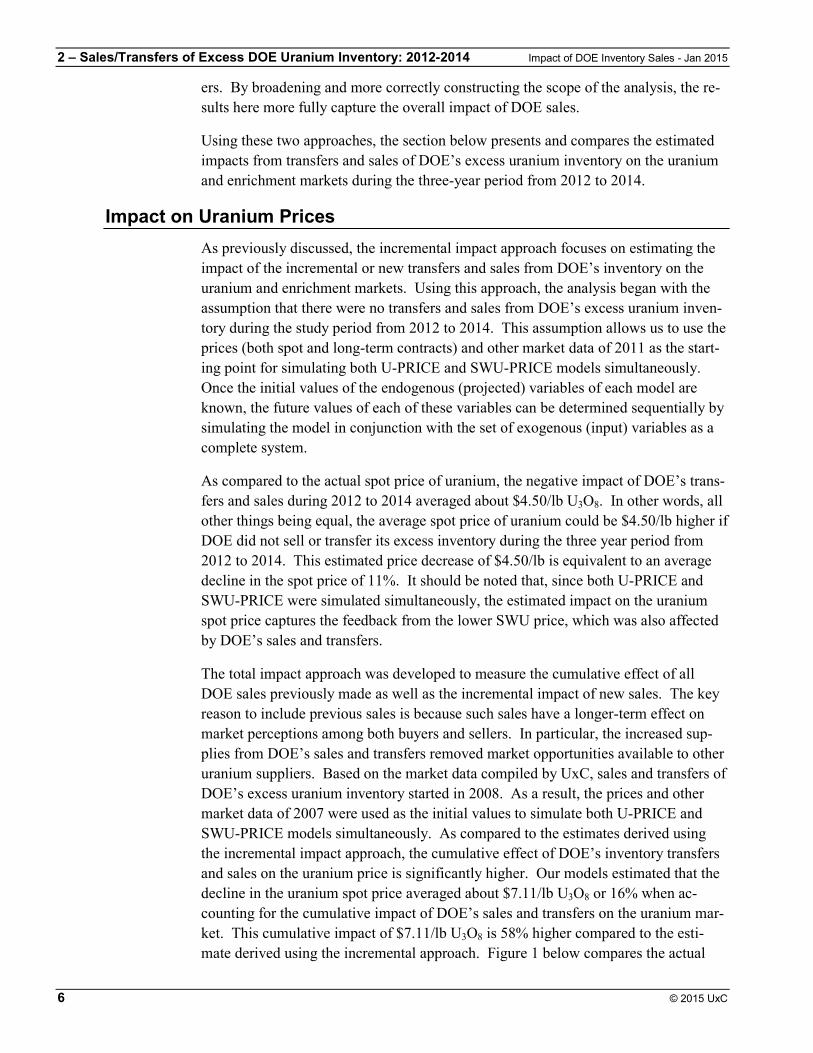
The total impact approach was developed to measure the cumulative effect of all DOE sales previously made as well as the incremental impact of new sales. The key reason to include previous sales is because such sales have a longer-term effect on market perceptions among both buyers and sellers. In particular, the increased sup-plies from DOE’s sales and transfers removed market opportunities available to other uranium suppliers. Based on the market data compiled by UxC, sales and transfers of DOE’s excess uranium inventory started in 2008. As a result, the prices and other market data of 2007 were used as the initial values to simulate both U-PRICE and SWU-PRICE models simultaneously. As compared to the estimates derived using the incremental impact approach, the cumulative effect of DOE’s inventory transfers and sales on the uranium price is significantly higher. Our models estimated that the decline in the uranium spot price averaged about $7.11/lb U3O8 or 16% when ac-counting for the cumulative impact of DOE’s sales and transfers on the uranium mar-ket. This cumulative impact of $7.11/lb U3O8 is 58% higher compared to the esti-mate derived using the incremental approach. Figure 1 below compares the actual
Impact of DOE Inventory Sales - Jan 2015 2 – Sales/Transfers of Excess DOE Uranium Inventory: 2012-2014
© 2015 UxC 7
uranium spot price to the simulated paths estimated using both the incremental and total impact approaches.
Figure 1. DOE Excess Inventory Sales/Transfers – Impact on Spot U3O8 Price
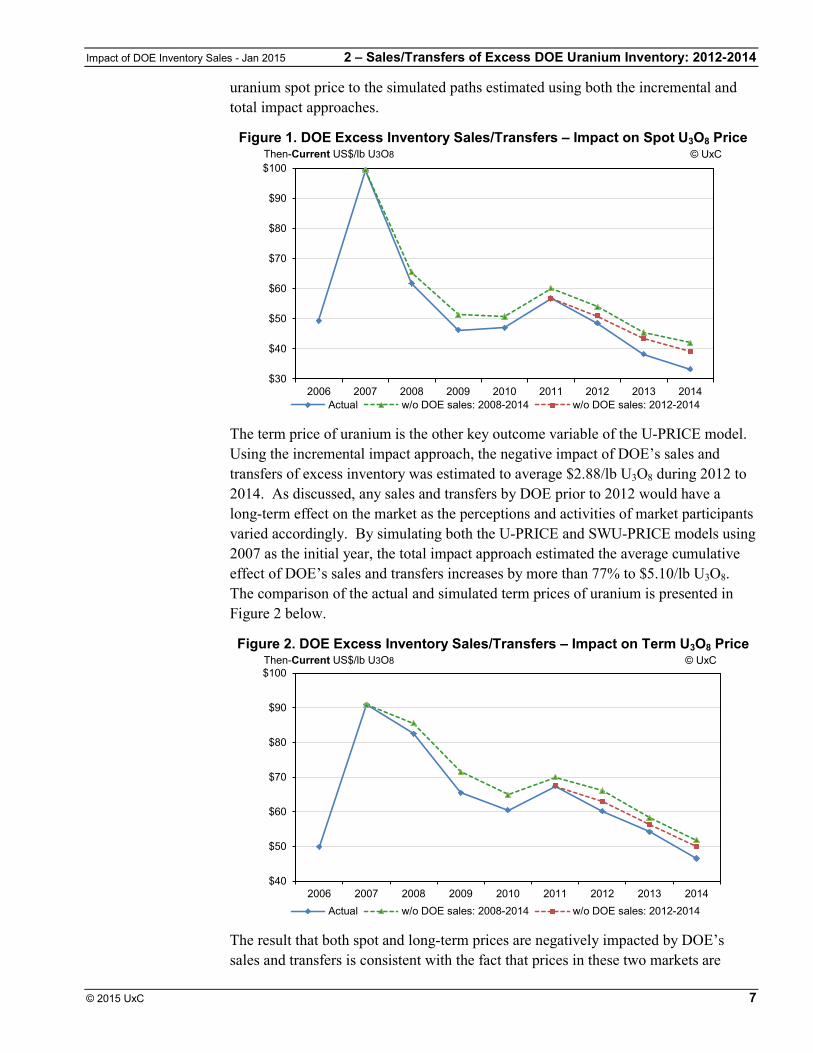
The term price of uranium is the other key outcome variable of the U-PRICE model. Using the incremental impact approach, the negative impact of DOE’s sales and transfers of excess inventory was estimated to average $2.88/lb U3O8 during 2012 to 2014. As discussed, any sales and transfers by DOE prior to 2012 would have a long-term effect on the market as the perceptions and activities of market participants varied accordingly. By simulating both the U-PRICE and SWU-PRICE models using 2007 as the initial year, the total impact approach estimated the average cumulative effect of DOE’s sales and transfers increases by more than 77% to $5.10/lb U3O8. The comparison of the actual and simulated term prices of uranium is presented in Figure 2 below.
Figure 2. DOE Excess Inventory Sales/Transfers – Impact on Term U3O8 Price
The result that both spot and long-term prices are negatively impacted by DOE’s sales and transfers is consistent with the fact that prices in these two markets are
$30
$40
$50
$60
$70
$80
$90
$100
2006 2007 2008 2009 2010 2011 2012 2013 2014Actual w/o DOE sales: 2008-2014 w/o DOE sales: 2012-2014
Then-Current US$/lb U3O8 © UxC
$40
$50
$60
$70
$80
$90
$100
2006 2007 2008 2009 2010 2011 2012 2013 2014Actual w/o DOE sales: 2008-2014 w/o DOE sales: 2012-2014
© UxCThen-Current US$/lb U3O8

2 – Sales/Transfers of Excess DOE Uranium Inventory: 2012-2014 Impact of DOE Inventory Sales - Jan 2015
8 © 2015 UxC
linked as they both represent alternative ways of securing uranium supplies. When spot prices fall, buyers can secure uranium on the spot market and carry it forward to use in future years. Suppliers that offer uranium under long-term contracts, usually uranium producers, must compete with this purchase option by lowering the prices they offer. Alternatively, if long-term contract prices fall, spot suppliers must reduce their offer prices to attract demand, especially demand several years in the future when unfilled needs on the part of utilities are much larger.
Impact on SWU Prices One key factor that influences the SWU price is the interrelationship between the en-richment and uranium markets, which is primarily characterized by the substitution between the natural resource (i.e., uranium) and the technology (i.e., enrichment ser-vice). In our analysis, this unique feature is captured using uranium prices as an input in the SWU-PRICE model to forecast enrichment prices, and using enrichment prices when using the U-PRICE model to develop uranium price forecasts. When simulat-ing both models simultaneously, the projected prices effectively incorporate the im-pacts of this interrelationship between the uranium and enrichment markets.
Using the incremental impact approach, DOE’s sales and transfers during 2012 to 2014 had a negative impact on the SWU term price that averaged about $5.37 per SWU. Compared to UxC’s estimated SWU prices, this is equivalent to a decrease of 4.5% in the term price had DOE not sold or transferred its excess inventory. As dis-cussed, since both U-PRICE and SWU-PRICE were simulated simultaneously, the estimated impact on the SWU term price captured the negative feedback from the lower uranium price that resulted from enrichers’ selling back the underfed uranium to the market.
Similar to the uranium price, the total impact approach was used to measure the cu-mulative effect of all DOE sales previously made as well as the incremental impact of new sales on the SWU price. Using the prices and other market data of 2007 as the initial values, both U-PRICE and SWU-PRICE models were simulated simultaneous-ly. As compared to the estimates derived using the incremental impact approach, the cumulative effect of DOE’s inventory transfers and sales on the SWU term price is higher. Our models estimated that the decline in the SWU term price averaged about $6.96/SWU, or 6%, when taking into account the cumulative impact of DOE’s sales and transfers on the enrichment market. This cumulative impact of $6.96/SWU is about 30% higher than estimated impact derived using the incremental approach. Figure 3 below compares the actual term price of SWU to the simulated paths esti-mated using both incremental and total impact approaches.

Impact of DOE Inventory Sales - Jan 2015 2 – Sales/Transfers of Excess DOE Uranium Inventory: 2012-2014
© 2015 UxC 9
Figure 3. DOE Excess Inventory Sales/Transfers – Impact on Term SWU Price
The spot price of SWU is the other key outcome variable of the SWU-PRICE model. Using the incremental impact approach, the negative impact of DOE sales and trans-fers of excess inventory was estimated to average $7.49/SWU during 2012 to 2014. As discussed, any sales and transfers by DOE prior to 2012 would have a long-term effect on the market as the perceptions and activities of market participants varied ac-cordingly. By simulating both U-PRICE and SWU-PRICE models using 2007 as the initial year, the total impact approach estimated the average cumulative effect of DOE’s sales and transfers on the SWU spot price increases by more than 23% to $9.19/lb U3O8. The comparison of the actual and simulated spot prices of SWU is presented in Figure 4 below.
Figure 4. DOE Excess Inventory Sales/Transfers – Impact on Spot SWU Price
$90
$100
$110
$120
$130
$140
$150
$160
$170
2006 2007 2008 2009 2010 2011 2012 2013 2014
Actual w/o DOE sales: 2008-2014 w/o DOE sales: 2012-2014
© UxCThen-Current US$/SWU
$90
$100
$110
$120
$130
$140
$150
$160
$170
2006 2007 2008 2009 2010 2011 2012 2013 2014
Actual w/o DOE sales: 2008-2014 w/o DOE sales: 2012-2014
© UxCThen-Current US$/SWU
3 – Sales/Transfers of Excess DOE Uranium Inventory: 2015-2030 Impact of DOE Inventory Sales - Jan 2015
10 © 2015 UxC
3 – Sales/Transfers of Excess DOE Uranium Inventory: 2015-2030 This section examines the impact of transfers and sales from DOE’s excess uranium inventory on the uranium and enrichment markets from 2015 to 2030. Similar to the analysis presented in the above Section II, both U-PRICE and SWU-PRICE models were used to project uranium and SWU prices. Two scenarios were developed in this analysis. The first scenario assumes that DOE will continue to sell and transfer its excess uranium inventory throughout the forecasting period from 2015 to 2030. UxC’s projection of DOE’s transfers and sales for this period was used as one key in-put to develop the price forecasts. The second scenario assumes DOE will not sell or transfer any additional inventory during the forecasting period.
Impact on Uranium Prices To forecast the uranium prices, the spot and term prices of both uranium and SWU in 2014 were used as the starting points for simulating the U-PRICE and SWU-PRICE models simultaneously. In the first scenario, we assume that DOE will continue to sell and transfer its excess uranium inventory throughout the entire forecasting period from 2015 to 2030. As compared to UxC’s most recent uranium requirement projec-tions,4 the annual amount of sales and transfers averages about 16% of the domestic uranium requirement during 2015 to 2030, which is significantly higher than the 10% limit as stated in the 2008 Excess Uranium Management Plan. The second scenario removes the potential sales and transfers from DOE from secondary supplies, which allows market fundamentals play a more meaningful role in determining prices.
Figure 5 presents the projected uranium spot prices of both scenarios using the U-PRICE and SWU-PRICE models. In the near and medium terms when the market conditions are still considered “weak,” the uncapped sales and transfers of DOE’s in-ventory would negatively impact the spot price of uranium by an annual average rate of 14.1% (or $5.78/lb U3O8). As market conditions improve after the medium term,5 the spot price of uranium will begin to show a more noticeable increase. However, the size of the increase will be affected by DOE’s sales and transfers. Using our models, DOE’s sales and transfers are expected to push down the spot price of urani-um annually by about 7.1% (or $4.47/lb U3O8) during 2018-2030. For the entire forecasting period, the projected negative impact averages about 8.4% per year.
One observation from Figure 5 is DOE’s sales and transfers will always negatively affect the spot price of uranium. However, when the market conditions are being characterized as poor or weak, the negative effect from this additional source is likely to further aggravate the market at a noticeably larger scale.
4 See Chapter 3 of UxC Uranium Market Outlook report, Q4 2014 5 See discussion in Chapter 6 of UxC Uranium Market Outlook report, Q4 2014

Impact of DOE Inventory Sales - Jan 2015 3 – Sales/Transfers of Excess DOE Uranium Inventory: 2015-2030
© 2015 UxC 11
Figure 5. Uranium Spot Price Projections
Chart Redacted
As explained in Section II above, since spot and long-term contract markets represent alternative ways of securing uranium supplies, their prices are highly correlated6 and should move in the same direction (i.e., increases in the spot price will result in high-er term prices and vice versa). This observation is validated by comparing the pro-jected term prices shown in Figure 6 below to the projected spot prices presented in Figure 5.
Figure 6. Uranium Term Price Projections
Chart Redacted
In the near and medium term, our models forecast that the negative impact of DOE’s sales and transfers on the uranium term price averages about 9.0% (or $4.86/lb U3O8) per year. As the uranium term price improves after the medium term, a smaller nega-tive impact of 7.1% (or $5.30/lb U3O8) per year is projected for the remaining fore-casting period from 2018-2030. Overall, the models project that DOE’s sales and transfers during the forecasting period from 2015 to 2030 will push down the urani-um term price at an annual average rate of 7.5% (or $5.21/lb U3O8).
6 Based on UxC’s uranium term and spot price data of 2004-2014, the correlation between the two prices was very high at 0.91.

3 – Sales/Transfers of Excess DOE Uranium Inventory: 2015-2030 Impact of DOE Inventory Sales - Jan 2015
12 © 2015 UxC
Impact on SWU Prices As with the projection of the uranium prices, the SWU prices were forecasted using two scenarios. The first scenario assumes that DOE will continue to sell and transfer its excess inventory throughout the forecasting period from 2015 to 2030. The sec-ond scenario assumes DOE will not sell or transfer any additional inventory during the forecasting period.
Figure 7 below presents the projected SWU term prices of both scenarios by simulat-ing the U-PRICE and SWU-PRICE models simultaneously. In the near and medium terms with relatively weak market conditions, DOE’s sales and transfers were pro-jected to negatively impact the SWU term price by an annual average rate of 5.6% (or $5.50/SWU). As the market conditions improve after the medium term7, the SWU term price will begin to show more noticeable recovery, although such a price recov-ery will be affected by DOE’s sales and transfers. Using the U-PRICE and SWU-PRICE models, DOE’s sales and transfers are expected to push down the SWU term price annually by about 3.6% (or $5.00/SWU) during 2018-2030. For the entire fore-casting period, the projected negative impact averages about 4.0% per year.
Figure 7. SWU Term Price Projections
Chart Redacted
As discussed, the spot price of SWU is the other key outcome variable of the SWU-PRICE model. By simulating both SWU-PRICE and U-PRICE models simultane-ously, the projected spot prices of SWU incorporate the impact of changes in uranium prices. Figure 8 below shows the comparison of the forecasted SWU spot prices of the two scenarios relating to DOE’s sales and transfers.
7 See discussion in Chapter 6 of UxC Enrichment Market Outlook report, Q4 2014
Impact of DOE Inventory Sales - Jan 2015 3 – Sales/Transfers of Excess DOE Uranium Inventory: 2015-2030
© 2015 UxC 13
Figure 8. SWU Spot Price Projections
Chart Redacted
As measured by the difference of the two forecasted price paths, the negative impact of DOE’s sales and transfers on the SWU spot price is consistent with the impact on the term price. For example, in the near and medium term, our models project an av-erage negative impact of 5.9% (or $5.31/SWU) per year. After the medium term, a smaller negative impact of 3.8% ($4.86/SWU) per year is projected due to improved market conditions for 2018 to 2030. For the entire forecasting period, the projected negative impact averages about 4.2% per year.

4 – Impact of DOE Inventory Sales on the Conversion Market Impact of DOE Inventory Sales - Jan 2015
14 © 2015 UxC
4 – Impact of DOE Inventory Sales on the Conversion Market The U.S. Department of Energy’s (DOE) uranium inventories are in various forms (e.g., natural UF6, HEU, LEU, and UF6 tails). As a result, the sale/barter of these ma-terials, either in their current form or once processed into a commercially usable form, result in the disbursement of material containing a uranium conversion compo-nent. As such, all of DOE’s uranium inventory sales and barter impact the conver-sion market through the introduction of additional conversion services that are not produced by existing conversion suppliers (e.g., AREVA, Cameco, Honeywell, or Rosatom). Since the UF6 and LEU material sold by the commercial entities that con-tract with DOE comes to the market primarily via spot sales, the impact on the con-version market is more readily seen in the spot market. However, additional spot market activity also has a resulting impact on the long-term demand for conversion services, and thus some impact on long-term conversion prices is also reflected.
Conversion prices have fluctuated over the past decade, as seen in the following Fig-ure 9. However, as seen in the chart, spot conversion prices have been more volatile when compared with long-term prices. Long-term conversion prices are primarily driven by production costs for conversion as well as the overall supply and demand fundamentals in the market. Spot conversion prices, on the other hand, are driven much more directly by the near-term supply of material, especially inventories. As such, DOE inventories represent a significant portion of the available inventories of conversion at any given time.
Figure 9. Ux Conversion Prices, 1995-2014
Considering that the global conversion market on an annual basis has historically been around 60,000 MTU, the quantities that DOE has sold/bartered equate to around
$2$3$4$5$6$7$8$9
$10$11$12$13$14$15$16$17$18
1995 1996 1997 1998 1999 2000 2001 2002 2003 2004 2005 2006 2007 2008 2009 2010 2011 2012 2013 2014
North American(NA) Spot Price
European (EU)Spot Price
Term Prices
US$/kgU as UF6 © UxC

Impact of DOE Inventory Sales - Jan 2015 4 – Impact of DOE Inventory Sales on the Conversion Market
© 2015 UxC 15
3-5% of the world total. While the world market is likely to increase due to addition-al nuclear reactor construction, DOE’s future sales/barters are still expected to be in the range of 3-4% of the world total through 2030.
Given that these quantities primarily enter the conversion market through spot and mid-term sales, the impact has and continues to be realized especially in spot conver-sion prices. Without these quantities entering the market, there clearly would be low-er inventory supplies, which would result in the need for producers to increase their outputs. Conversion supplies produced by primary producers are higher cost, as the cost to convert U3O8 to UF6 is known to be in the range of $10-$15/kgU depending on the plant in question. Under any scenario where inventories are lower, the logical conclusion is that prices in the spot conversion market would be higher.
Although UxC has not fully modeled this effect on a quantitative basis, it is a fact that much of the world’s spot conversion is sold in tandem with uranium through UF6 contracts. There is also clear evidence that UF6 prices have fallen as much as U3O8 prices on a percentage basis over the past few years, as discussed in the uranium price impact discussion above. In fact, the Ux North American (NA) UF6 Price has gone at a discount to the Ux NA UF6 Value (i.e., the computed price of spot uranium and spot conversion based on the component values) for most of the period over which DOE sales/barters have occurred, in some time periods more notably than others (Figure 10). Hence, there is good reason to conclude that the downward price impact of DOE sales/barters on the spot conversion price have been at least equal to, if not greater than, the impact on spot uranium prices.
Figure 10. Ux North American (NA) UF6 Price vs. Value, 2008-2014
Going forward, the additional quantities expected to come from DOE inventory sales/barters will also likely continue to have such a similar if not greater impact on
$80
$100
$120
$140
$160
$180
$200
2008 2009 2010 2011 2012 2013 2014
Ux NA UF6 Price
Ux NA UF6 Value
US$/kgU as UF6 © UxC

4 – Impact of DOE Inventory Sales on the Conversion Market Impact of DOE Inventory Sales - Jan 2015
16 © 2015 UxC
spot conversion prices. As for the long-term conversion price, the downward impact is likely somewhat less, but there is still a noticeable effect. Additionally, the lower resulting market prices will lead to fewer incentives for investments in future new supply capacities, which could prove quite detrimental to the overall conversion mar-ket in the long-term.

Impact of DOE Inventory Sales - Jan 2015 5 – Summary & Conclusions
© 2015 UxC 17
5 – Summary & Conclusions DOE’s Request for Information (RFI) raised two questions related to the impacts of the Departments uranium sales on the front-end markets. The first question deals with the historical impact of DOE’s sales and transfers on the markets during 2012 to 2014. The second question concerns the future market impacts assuming there will be continued transfers and sales by DOE.
One key feature of our analysis is to capture the impacts of the interrelationship be-tween the uranium and enrichment markets in an integrated fashion. As a result, the analysis was conducted by using UxC’s proprietary U-PRICE and SWU-PRICE models simultaneously. In this respect, enrichment prices are used as an input into uranium price forecasts, and uranium prices are on input for enrichment price fore-casts. When both of our models are used simultaneously, it provides a more adequate analysis in addressing the dual market impacts from DOE selling both uranium and enrichment. For example, while the uranium market is negatively impacted directly by DOE selling uranium, it is also indirectly affected by DOE’s selling enrichment that places a downward pressure on the SWU price. This is because uranium and SWU are substitutes. As a result, a lower SWU price would negatively impact the uranium price. By the same token, since DOE is also selling enrichment, the negative dual market impact will apply to the enrichment market as well. To the extent that previous studies did not incorporate this dual market impact, they may have underes-timated that overall impact of DOE sales.
Our analysis employs two approaches to measure the market impacts of DOE’s sales and transfers during 2012 to 2014. The incremental impact approach focuses on the market impact of new or incremental sales. The total impact approach captures the cumulative effect of all DOE sales previously made and the incremental impact of new sales over time. The key reason to include previous sales is because such sales have a longer-term effect on market perceptions among both buyers and sellers. The failure to analyze the market this way may have accounted for earlier studies to esti-mate lower market impacts. In particular, the increased supplies from DOE’s sales and transfers took away market opportunities available to other uranium suppliers. The analysis presented in Section II of this report clearly demonstrates that, while DOE’s incremental sales and transfers had a negative impact on both the uranium and enrichment markets during 2012 to 2014, the adverse effect was much higher in terms of the total cumulative impacts. For example, the negative impact of DOE’s sales and transfers on the uranium spot price averaged 11% (or $4.50/lb U3O8) and 16% (or $7.11/lb U3O8) per year as estimated using the incremental and total impact approach, respectively.
One conclusion from the analysis presented in Section III of this report is that DOE’s sales and transfers will always negatively affect the front-end markets in terms of prices. In particular, when the market conditions are being characterized as poor or weak, the negative effect from this additional supply source is likely to further aggra-
5 – Summary & Conclusions Impact of DOE Inventory Sales - Jan 2015
18 © 2015 UxC
vate the market on a noticeably larger scale. For example, in the near and medium terms (2015-2017) with the expected weak market conditions, the negative impact on the uranium spot price is projected to average about 14% per year. This compares with a smaller impact of 7.1% per year when the market is expected to show a recov-ery after the medium term. In this regard, if DOE’s sales and transfers are reduced or, at least, capped at the level that was previously agreed upon, it would help to sta-bilize the price by eliminating market uncertainties associated with DOE’s supply. By the same token, greater sales would have a more deleterious impact on the market, especially during weaker market periods.
The 10% limit of sales and transfers as stated in the 2008 Excess Uranium Manage-ment Plan was identified when the market conditions were much more favorable as compared to today’s market. By increasing instead of reducing its sales following the Fukushima accident, DOE not only further negatively impacted the market, but also it further harmed the domestic industry. Furthermore, the DOE also deprived itself the opportunity to receive the maximum value from its inventory sales for the U.S. tax-payer.

Impact of DOE Inventory Sales - Jan 2015 Appendix A – UxC U-PRICE™ Forecasting Model Structure
© 2015 UxC 19
Appendix A – UxC U-PRICE™ Forecasting Model Structure As illustrated in Figure 11, the U-PRICE model consists of three major submodels: Demand (blocks A, B-1, B-2, B, C1, C2 and C), Supply (blocks S, S-1, S-2, S-3, R, U, and V), and Price (blocks D and E). These three submodels interact with each other and can be simulated as a complete system.
Figure 11. U-PRICE Model Structure
The U-PRICE model is a recursive system of eleven regression equations and three identities that quantify the causal relationships and interdependencies among key var-iables of the uranium industry. The endogenous variables identified and projected in the econometric model include:
DV: Demand indicator (DV_ULEADt)
Lag
Price expectation indicator(LTCPt-1, USPOTPt)
FSWU-PRICE Model, SWU LTC price (LTCPt-1)
U3O8 LTC lead time(ULEADt)
U3O8 spot price(USPOTPt)
DV: Market outlook indicators(DV_ULYTQt &DV_maxUYLTQt)
U3O8 annual LTCvolume(UYLTQt)
U3O8 LTC volume- EULTQt- ULTCQt
A
D
B
U3O8 long-term contract price (ULTCPt) E
DV: Unfilled demand indicator(DV_QACTt)
Lag
U3O8 average LTClength(ULNTHt)
DV: Utility perception(DV_ULNTHt &DV_maxULNTHt)
Lag
Lag
U3O8 demand for production(UDDPRODt)
U3O8 spot volume
- Actual demand(UQACTt)
- Discretionary buying(UQDISCt)
DV: Spot market outlook(DV_QDISCt)
U3O8 spot volume(USPOTQt) C
U3O8 elastic supply(ESQt)- Kazakhstan(KAZSQt)
- Other elastic supply(OESQt)
U3O8 secondarysupply(SCNDt)
U3O8 inelasticsupply(IESQt)
DV: Government policy(DV_POLICYt) DV: Policy & Market
outlook- DV_POLICYt- DV_OUTLOOKt
SWU-PRICE Model
Production cost of U3O8(UPRODCt)
Remaining reserves of U3O8(URSVt)
U3O8 potential production (UPTNLQt)
U3O8 total supply(USSt)
Lag
Lag
Lag
B-1 B-2
G
H
Producer inventory of U3O8 (UPRODINVt)S
S-1 S-2, S-3
R
U
V
C-1
C-2
W
B-3
I

Appendix A – UxC U-PRICE™ Forecasting Model Structure Impact of DOE Inventory Sales - Jan 2015
20 © 2015 UxC
A) ULEADt: Average lead time of long-term uranium contracts, in years B) ULTCQt: Uranium total long-term contract volume of year t, in million lbs
U3O8 B-1) UYLTQt: Annual long-term contract volume of year t, in million lbs U3O8 B-2) ULNTHt: Average length of long-term contract signed in year t, in years B-3) EULTQt: Estimated total long-term uranium contract volume of year t, in million lbs U3O8
C) USPOTQt: Uranium spot market volume of year t, in million lbs U3O8 C-1) UQACTt: Actual demand of year t, in million lbs U3O8 C-2) UQDISCt: Discretionary buying of year t, in million lbs U3O8
D) USPOTPt: Average price of spot uranium of year t, in $/lb U3O8 E) ULTCPt: Average base price of long-term uranium contracts of year t, in
$/lb U3O8 S) USSt: Total primary & secondary uranium supply of year t, in million lbs
U3O8 S-1) IESQt: Inelastic production of uranium of year t, in million lbs U3O8 S-2) ESQt: Elastic production of uranium of year t, in million lbs U3O8 S-3) KAZSQt: Kazakhstan production of uranium of year t, in million lbs U3O8
When the model is simulated as a complete system, the values of each of the endoge-nous variables listed above will be determined sequentially.
The model also includes a set of exogenous variables that help to explain uncertain-ties in the uranium market due to unpredictable policy changes or events such as the Fukushima incident. Unlike the endogenous variables, most of these exogenous vari-ables represent data of a qualitative nature such as the impact of speculative demand from financial players on uranium prices or market participants’ general perception of the industry outlook. While the impact of changes in market fundamentals on price is determined based on the interdependencies among the endogenous variables of the model, the impact on price caused by changes in market psychology is largely han-dled by the exogenous variables. In general, the values of these exogenous variables are defined or assigned according to the scenario prior to model simulation. Key ex-ogenous variables included in each of the three submodels are listed below.
Demand Submodel • DV_ULEADt measures the potential impact of changes in long-term contract lead
times observed in previous years on the actual or desired level of the average lead time of the current year.
• DV_UYLTQt is a market sentiment indicator that reflects uranium end users’ general perception of the market conditions.
• DV_ULNTHt is an indicator that models the impact of price expectation on the business decision of obtaining a longer or shorter contract period.

Impact of DOE Inventory Sales - Jan 2015 Appendix A – UxC U-PRICE™ Forecasting Model Structure
© 2015 UxC 21
• DV_QACTt and DV_QDISCt are the spot market perception indicators. These two indicators measure the impact of market perceptions on spot purchases for actual needs and discretionary demand, respectively.
Supply Submodel • DV_POLICYt is a policy variable that links to the inelastic uranium producing
countries. This qualitative variable is intended to illustrate the potential impact on uranium supply due to changes in government policies in those countries.
• DV_OUTLOOKt is used to measure the impact of uranium producers’ market perceptions on elastic production.
• DV_KAZPOLICYt reflects the impact of changes in Kazakh government policies on its uranium production decisions.
Price Submodel • DV_EXRATEt is a financial indicator that measures the potential impact of
changes in the exchange rate between the U.S. dollar ($) and the currency of uranium producing countries on the uranium price. While there are a number of major uranium producing countries (such as Canada, Australia, Kazakhstan, Niger, etc.), this study used the exchange rate between the U.S. dollar and the Canadian dollar to define the value of this qualitative variable.
• DV_UPEXPt, the price expectation variable, is a market indicator that reflects market participants’ general perceptions of the uranium market outlook.
• DV_maxUPt is included to denote the historical maximum level of spot price of uranium in 2007. As a result, 2007 is the only year that this variable was assigned a value +1. That is, this variable is defined using the neutral value zero for all other years in the forecast period.
Because of the interplay between the uranium and enrichment markets, significant developments in one market are likely to cause changes in the other. In the U-PRICE model, the uranium spot price and the SWU term price are used as the key measure for this interdependency, which is described in Block F of the model structure dia-gram. This is similar to the method used in the SWU-PRICE model. Including the SWU price in the U-PRICE model and the uranium price in the SWU-PRICE model ensures the price interdependency between uranium and SWU is explicitly modeled and solved simultaneously.

Appendix B – UxC SWU-PRICE® Forecasting Model Structure Impact of DOE Inventory Sales - Jan 2015
22 © 2015 UxC
Appendix B – UxC SWU-PRICE® Forecasting Model Structure The SWU-PRICE is a recursive system of five regression equations that quantify the causal relationships and interdependencies among various key variables of the en-richment industry. Figure 12 below illustrates the basic structure of this model.
Figure 12. SWU-PRICE Model Structure
The five endogenous variables identified in the econometric model include:
A) LEADt: Annual average lead time specified in SWU long-term contracts B) LTCQt: Annual long-term contract SWU volume C) LTCPt: Annual average long-term contract SWU base price D) SPOTPt: Annual average spot SWU price E) SPOTQt: Annual spot SWU volume
When the model is simulated as a complete system, values of each of the endogenous variables listed above will be determined sequentially. Four out of these five regres-sions were specified as autoregressive equations (block A, B, C, and E in the above diagram), which include the lagged values of the dependent variable among their ex-planatory variables. One outcome variable of the model is the projection of the de-livery price of SWU (block G), which provides a sense of what to expect at the time of SWU delivery.
The model also includes a set of exogenous variables that help to explain uncertain-ties in the enrichment market due to unpredictable policy changes or events such as
DV: Demand indicator (DV_LEADt)
Lag
Lag
Price expectation indicator(USPOTPt /SPOTPt)
F U3O8 spot price (USPOTPt)
SWU Long-term contract lead time(LEADt)
SWU spot price(SPOTPt)
SWU Spot volume(SPOTQt)
DV: Policy & market indicators(DV_LTCQt)
SWU Long-term contract volume (LTCQt)
SWU Long-term contract base price (LTCPt)
DV: Market indicators(DV_SPOTQt)
SWU production capacity utilization(CAPUt)
DV: Financial indicators(DV_eurot)
DV: Supply Indicators(DV_techt)
A
D
B
C
E
Lag
Lag
SWU Long-term contract delivery price (DELPt) G
DV: Spot market imbalance indicator (DV_SPOTMKTt)

Impact of DOE Inventory Sales - Jan 2015 Appendix B – UxC SWU-PRICE® Forecasting Model Structure
© 2015 UxC 23
the Fukushima incident. Most of these exogenous variables intend to represent data of qualitative nature such as the impact of technology improvement on SWU prices. As explained below, the values of some variables are determined endogenously when the forecasts are developed using the simulation system; others are qualitative indica-tors that provide inputs for scenario analyses.
• DV_LEADt is an expectation indicator of SWU long-term contracts that illustrates the potential impact of changes in lead time observed in previous years on actual or desired level of average lead time of the current year. When developing forecasts, values of this variable will be determined endogenously.
• DV_LTCQt is a market sentiment indicator that reflects market participants’ general perception of the enrichment industry outlook. Since the variable deals with situations or events that are of a qualitative nature, its values are assumed and used for developing different forecasting scenarios.
• DV_eurot is a financial indicator that measures the potential impact of changes in exchange rate between the US$ and the euro on market price of SWU.
• DV_techt is a trend (or time) variable that illustrates the potential impact of technology improvement over time on SWU price. Future values for this variable will be assumed based on the market share of SWU produced using centrifuge technology. Laser isotope enrichment should also be considered as a technology variable but it will require additional analysis to understand the outlook for commercialization.
• DV_SPOTQt is a qualitative measure for the impact of price difference between long-term contracts and spot transactions on spot SWU volume.
• CAPUt is the estimated utilization rate of SWU production capacity. The model uses SWU market demand, nameplate capacity and other sources of supplies projected by the UxC’s URM to derive annual capacity factor.
• DV-SPOTMKTt is the spot market imbalance indicator that provides a qualitative measure of the impact of spot supply and demand imbalances on the SWU spot price.
Because of the interactions between the uranium and enrichment markets, significant development in the uranium market is likely to be a leading indicator for the enrich-ment industry. As described in the model structure diagram, the price ratio of U3O8 to SWU (Block F in Figure 12) was used as the key measure for this interdependen-cy. This is similar to the method used in the U-PRICE model. Including the SWU price in the U-PRICE model and the uranium price in the SWU-PRICE model en-sures the price interdependency between uranium and SWU is explicitly modeled and solved simultaneously.

Appendix C – DOE Uranium Inventory Sales/Barter Quantities Impact of DOE Inventory Sales - Jan 2015
24 © 2015 UxC
Appendix C – DOE Uranium Inventory Sales/Barter Quantities For this study, UxC has quantified the total sales/barter of DOE inventories in terms of uranium (U3O8 equivalent), conversion (UF6 equivalent) and SWU for the period 2008-2030 (see Table 1 below).
Table 1. DOE Uranium Inventory Sales/Barter Quantities Used in UxC’s Analysis
U3O8e (thousand lbs)
UF6e (MTU)
SWUe (million)
2008 1,704 655 0.45 2009 1,391 535 0.52 2010 4,420 1,700 0.68 2011 6,146 2,364 0.76 2012 5,521 2,124 0.55 2013 9,253 3,559 1.01 2014 7,935 3,052 0.85 2015 8,537 3,284 1.42 2016 7,766 2,987 1.00 2017 7,983 3,070 1.06 2018 9,614 3,698 1.06 2019 12,675 4,875 1.44 2020 7,175 2,760 0.84 2021 8,170 3,142 1.34 2022 7,752 2,982 0.74 2023 8,040 3,092 0.34 2024 6,793 2,613 - 2025 7,789 2,996 - 2026 6,793 2,613 - 2027 7,788 2,996 - 2028 6,793 2,613 - 2029 7,206 2,771 - 2030 6,793 2,613 -
Totals 184,418 70,930 10.09