Embed Size (px)
Citation preview
SPECIAL PROJECT REPORT SPR 1/95
FINAL REPORT ON A LABORATORY
tNVESTtGA:HQ:N.-0-F THE -STBEN.G-TH DEVElOPMENT OF-
-HfGH PFA CON-T:EPiff CONCRETE
W.C. Leung W.L. Tse
CIVlL ENGTNEF.RJNG DF.PARTMFJ'ol
CIVIL ENGINEERING LffiRAFY
Ace. No. OG 7 l_ - 63101 Cl:lSS No.
Author J:r:u March 1995
I M aterials Division
. . ...

- 2-
FOREWORD
At the request of the Standing Committee on Concrete Technology (SCCT), the Public Works Central Laboratory (PWCL) of the Materials Division carried out an investigation on the strength development of high PFA content concrete. The main objective of the investigation is to compare the strength development of OPC concrete and PF A concrete, subject to various curing environments and durations, and derive correlations between the 28-day strength and the long term strengths.
This final report presents the test results obtained from the concrete mixes investigated, up to a test age of 360 days.
The early stage planning of this investigation was carried out by Mr. P.C. Wong. Mr. W.C. Leung took over the management of the project in January 1993 and prepared this report in conjunction with Mr. W.L. Tse, the project engineer, who organised and supervised the testing with the assistance of Mr. M.Y. Chu, Ms K.Y. Law and Mr. C.C. Kwok. The casting, curing and testing of cubes were carried out by staff of the Concrete Unit in PWCL.
The report was reviewed by members of SCCT.
P L R Pang Chief Geotechnical Engineer/Materials

............... ·-· .... .................................................................. ~·· .... ....
- 3 -
ABSTRACf
Pulverized fuel ash (PFA) is a by-product of the combustion of coal used in coal-fired power Stations. It is well known that PFA has the advantage of improving the strength and durability properties of concrete when used as a partial replacement of Portland cement in concrete. However, there is a lack of information on the performance of concrete manufactured using locally produced PF A. ·
In May 1992, the Standing Committee on Concrete Technology (SCCT) awarded a research consultancy to the Hong Kong City Polytechnic to carry out a study on PFA concrete. The study covers the strength development of PFA concretes with 15% to 25% PFA replacement, as well as their shrinkage and creep characteristics. Results have been obtained for the Strength development of the PF A concretes up to a period of 90 days.
In late 1992, SCCT requested the Public Works Central Laboratory (PWCL) to conduct a parallel study to compare the strength development of OPC and PFA concretes up to the age of one year. The objective of the study is to derive correlations between the 28-day and the long term Strengths of a range of mixes produced with up to 55% PFA replacement. The cubes were cured over a range of temperatures from I ooc to 75°C and with selected curing durations, such that the influence of curing environment can also be assessed.
An interim report on lest results obtained from the concrete mixes investigated up to a teSt age of 90 days was issued in December 1993. This final report presents the test results up to a teSt age of 360 days.
Based on the results obtained. the replacement of OPC by PFA was found to have a slight retarding effect on the 7-day Strengths of the concrete. However, all of the PFA concrete mixes gave Strengths of about I 4% to 31% higher than the target 28-day Strength at the age of 360 days while the OPC concrete gained little Strength after 28 days and had roughly the same strength as the target strength at the age of 360 days. The results also indicate that a high initial curing temperature can reduce the strength of OPC concrete significantly but has little effect on PF A concrete Strength.
- 4-
CONTENTS
Page No.
Title Page
FOREWORD 2
ABSTRACT 3
CONTENTS 4
I. INTRODUCTION s
2. DESCRIPTION OF TEST MATERIALS 5
3. LABORATORY INVESTIGATION
3. 1 Concrete Mix Design 5 3.2 Test Procedures 5 3.3 Test Results 6
4. DISCUSSION OF TEST RESULTS
4.1 Normalisation 6 4.2 Calculation of Relative Strength Percentages 7 4.3 Strength Development Under Normal Curing 7 4.4 Influence of Initial Curing Temperarure on Strength Developmem 7
4.4.1 Influence of low initial curing temperature 7 4.4.2 Influence of high initial curing temperarure 8
4.5 Influence of Duration of Curing 8
5. CONCLUSIONS AND RECOMMENDATIONS 9
6. REFERENCES 10
LIST OF TABLES 11
LIST OF FIGURES 30
- 5 -
1. INTRODUCTION
In late 1992, the Public Works Central Laboratory (PWCL) commenced a project to investigate the strength development of high PFA content concrete at the request of the Standing Committee on Concrete Technology (SCCT). The investigation covers the strength development of a range of mixes with up to 55% PFA content. A total of 1260 cubes were made and cured over a range of temperatures from to•c to 75°C, and with selected durations of curing, so that the influence of the curing environment can also be assessed. An interim report on the investigation was issued in December 1993 (Leung & Tse, 1993). The interim report covers the· PWCL's findings on the strength development of the concrete mixes up to an age of_90 days.
This report covers the additional cube test results obtained since October 1993 and summarises the strength development of high PFA as well as OPC mixes up co an age of 360 days.
2. DESCRIPTION OF TEST MATERIALS
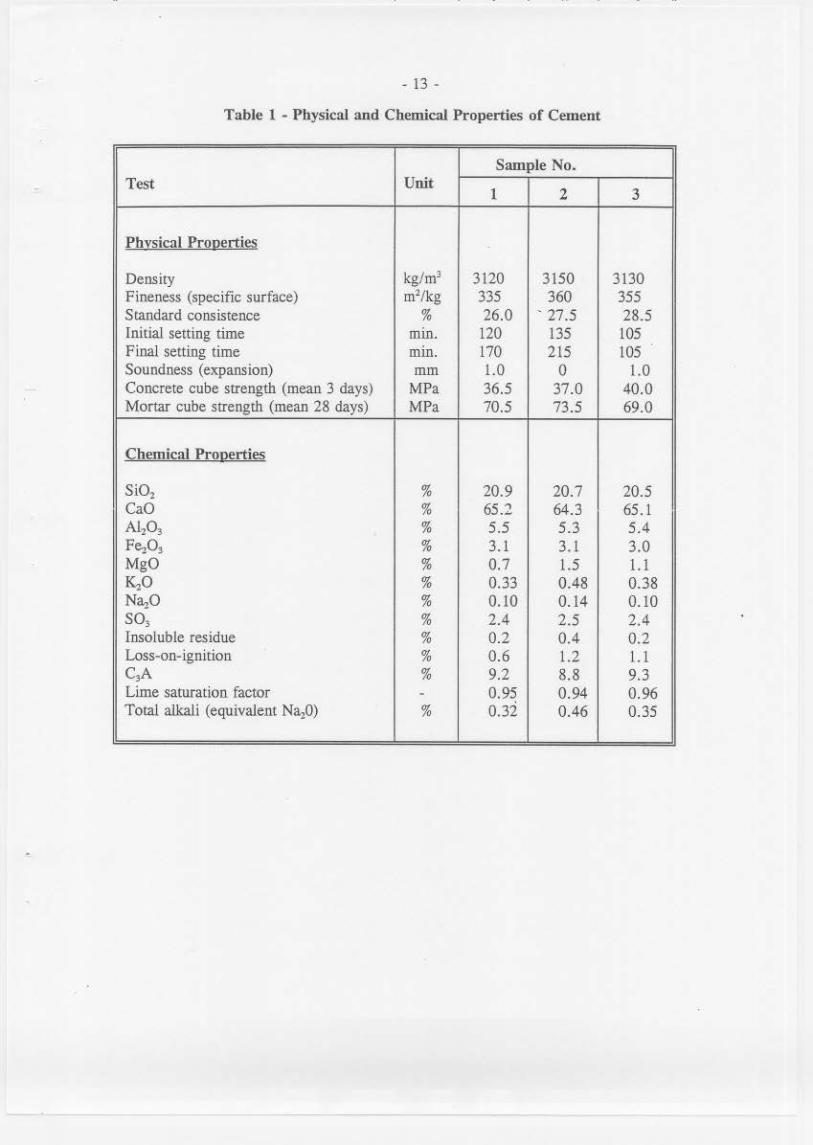
The physical and chemical properties of the cement and the physical properties of the aggregates used in the investigation are given in the interim report (Leung & Tse, 1993). These are reproduced in Tables 1 and 2 for easy reference. The physical and chemical properties of the PFA used in this investigation are given in Table 3.
3. LABORATORY INVESTIGATION
3.1 Concrete Mix Design
. The mix design for the study comprised the design of an OPC concrete and four PF A concrete mixes with replacement percentages of 25%, 35%, 45% and 55% respectively. Grades 30 and 45 concretes were aimed for in the design as these are the most commonly encountered concrete grades in Hong Kong. The target 28-day strength of the mixes was taken as the grade strength plus 8 MPa, and a target slump value of 75 mm was adopted. The mix proportions adopted are given in Table 4.
3.2 Test Procedures
The testing equipment and apparatus are calibrated to the requirements laid down in CS 1 (Hong Kong Government, 1990) and the calibrations are traceable co national standards. The cubes were made in accordance with CS 1 .
After the cubes were cast, they were stored for 24 hours in the laboratory at 25 • ± 5•c before demoulding. After demoulding, the cubes were stored under various curing environments as described in Table 5.
After curing, the cubes were soaked in water at 27•c ± 3 •c for a period of 24 hours immediately before testing. The density and compressive strength of the cubes were determined in accordance with CS l.

- 6 -
For each mix, three cubes were cast and cured under each of the curing environments and these were tested at each of the following test ages: 28, 56, 90, 180 and 360 days. Six additional cubes were cast and cured under standard curing environment E 1. Three of these cubes were tested at seven days and the other three at 28 days to provide additional data for the control test age. .
For the cubes which were air cured, they were stored in an air curing room where the room temperature was maintained at 25 ±5° C. Records of the temperature and relative humidity of the air curing room over the test period are shown in Figure l. It can be seen that over the test period, the mean storage temperature of the cubes is about 25 o C and the mean RH was about 75%.
3.3 Test Results
The full density and compressive strength results for cubes in mixes M 1 to M 10 at the test age of 180 days and 360 days together with the mean compressive strength results for the same mixes at the age of 7, 28, 56 and 90 days are given in Tables 6 to 15 respectively. The full density and compressive strength results for the test age of 7, 28, 56 and 90 days can be found in the interim report (Leung & Tse, 1993).
4. DISCUSSION OF TEST RESULTS
4.1 Normalisation
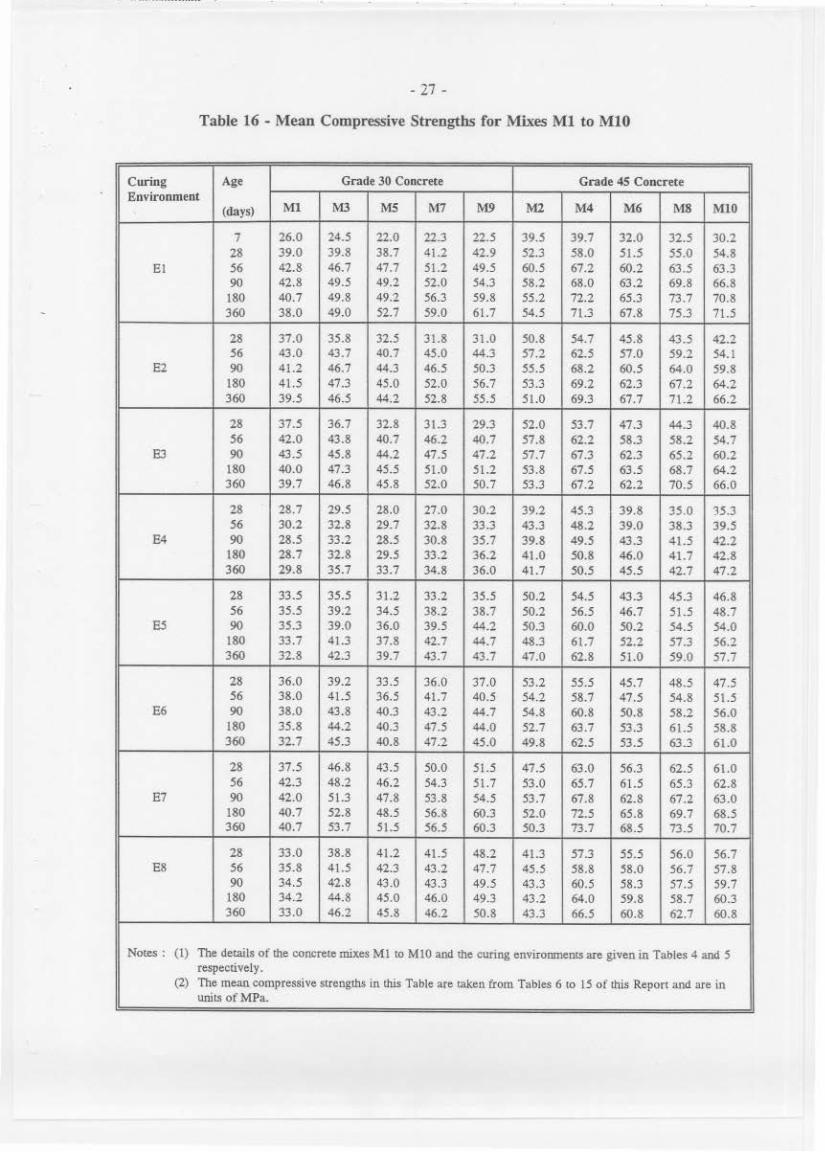
While the mean 28-day compressive strengths of mixes M l to M 10 under curing environment B1 are very close to the target strengths (as can be seen from the summary in Table 16), it is obviously not possible in practice to achieve the target strengths exactly. In order to permit comparison of the test results amongst the different mixes for each of the two grades of concrete, it is necessary to normalise the mean compressive strengths obtained. The normalisation was carried out by applying a factor N as defmed below to each of the mean 28-day strengths under curing environment E1 in Table !6:
28-day Target Strength for Environment E1 N = ---- (1)
28-day Measured Strength for Environment E1
For example, a factor N = ~8/39 = 0.974 was applied to the results obtained at the different ages for mix Ml. The calculated N factors for all the mixes are given in Table 17.
There is also a need to compare the results obtained under curing environment E I with results obtained under other curing environments, for each mix. In order to do this, the following principle has been invoked: the strength realisation potential of a particular mix of concrete is the same irrespective of the environment under which curing is carried out. Take, for example, mix Ml. There is a potential for the concrete cured under environment E2 to achieve a 28-day strength of 39.0 MPa if curing is carried out to environment El. Hence, if all results obtained under curing environment E1 are normalised by a factor N = 38/39, then the same factor should be applied to all the results obtained under curing environment E2, if a meaningful comparison is to be carried our. This approach has been adopted and the mean

- 7 -
strengths obtained for the different curing environments have been normalised using the factors given in Table 17. The normalised mean compressive strengths for mixes Ml to MIO are given in Table 18. '
4.2 Calculation of Relative Strength Percentages
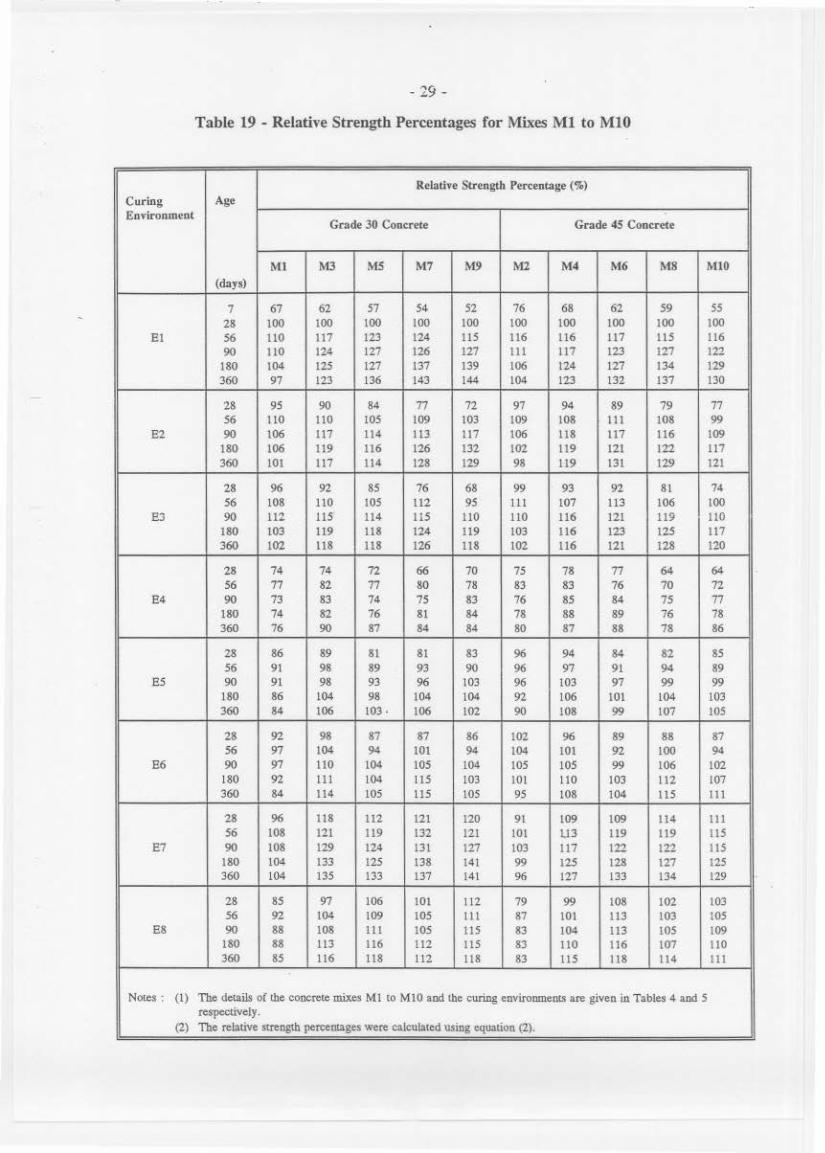
In order to facilitate comparison further so t)lat the relative speed of strength development of the various mixes in the two concrete grades can be readily appreciated, the normalised mean compressive strengths for each mix in Table 18 have been converted to relative strength percentages by dividing the values by the (28-day) target strength of the same mix:
Relative strength percentage Normalised Mean Compressive Strength for a particular mix of a ------- (2) specified concrete grade Target Strength ( = Grade Strength + 8MPa)
The relative strength percentages calculated for mixes Ml to MIO are given in Table 19.
4.3 Strength Development Under Normal Curing
The results from this investigation are consistent with the common observation that PFA has an enhancing effect on the long term strength development of concrete.
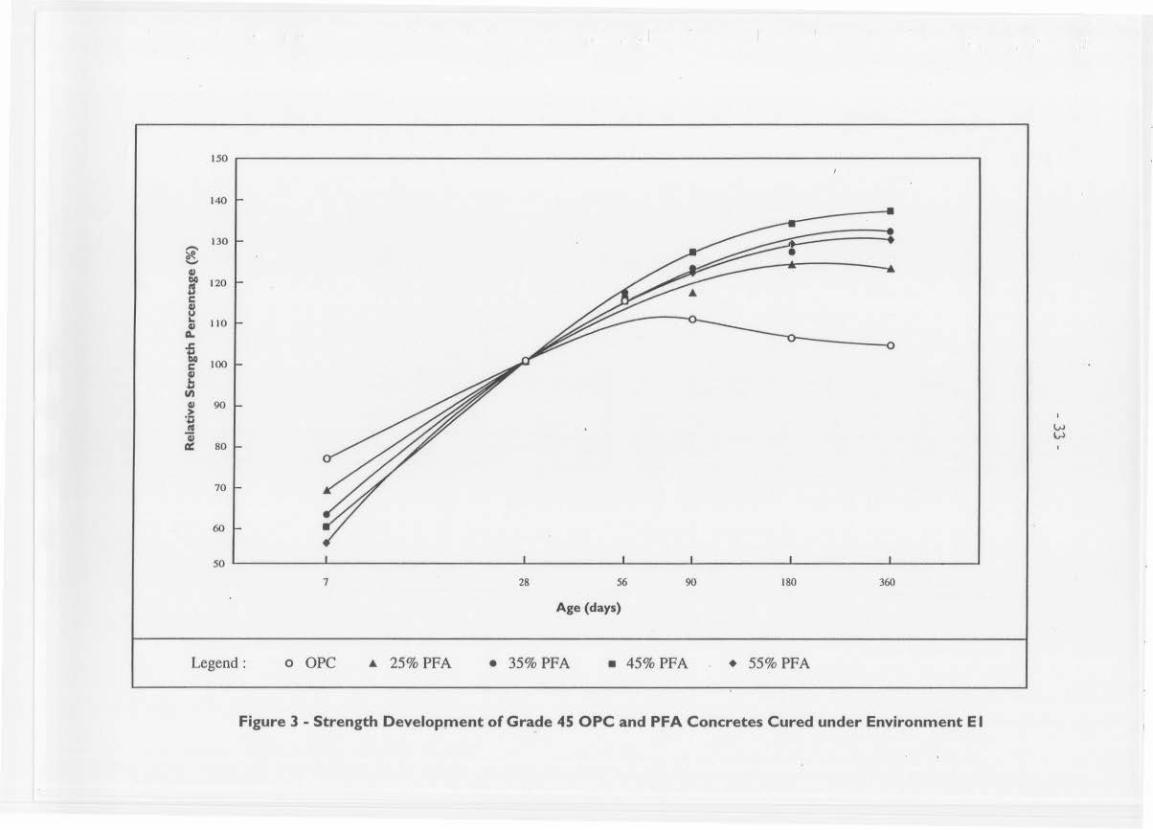
Under standard curing environment El (27"C water curing for 28 days, then followed by air curing until testing is required), both the Grade 30 and Grade 45 OPC mixes failed to gain further strength after 56 days and the strength of both OPC mixes at 360 days fell to about the same level as the 28-day strength as shown in Figures 2 and 3. As for the PFA mixes, there was a significant gain in strength from 28 days to 360 days, representing a post 28-day strength gain of about 23% to 44%.
4.4 Influence of Initial Curing Temperature on Strength Development
4.4.1 Influence of low initial curing temperature
The concreting in cold weather was simulated as far as possible in curing environments E2 and E3. The cubes in environment E2 were initially water cured for 3 days at ta•c, followed by further water curing at 2o•c for another 24 days. Thereafter, the cubes were stored in the air curing room until testing. The cubes in environment E3 were initially water cured at 20•c for 27 days, followed by storage in the air curing room until testing.
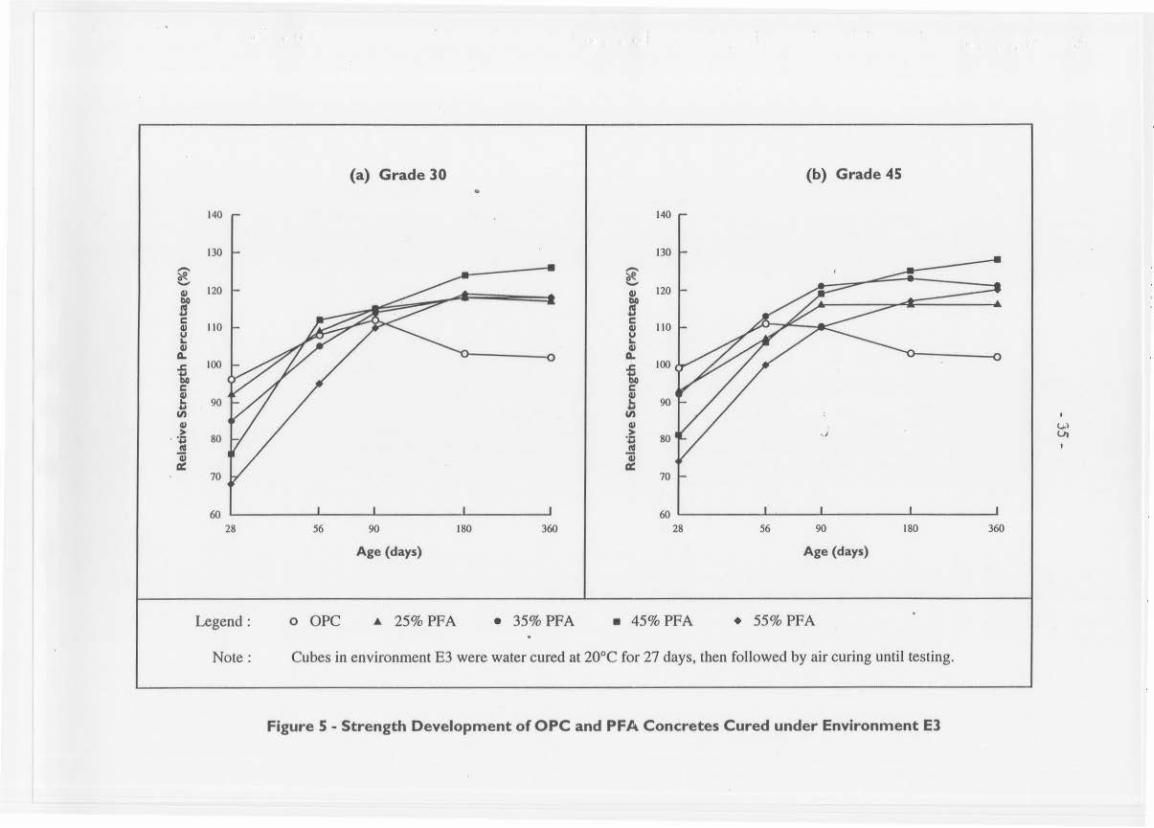
The strength development of cubes cured in environments E2 and E3 is shown in Figures 4 and 5. lt can be seen that the low temperarure curing had a retarding effect on the initial strength development of both the OPC and PFA mixes. The effect was however greater for the PFA mixes.
For both grades of concrete, all of the PFA mixes had strengths slightly lower than the OPC mixes at the age of 28 days. As the PF A concrete marured, the influence of the low

- l! -
temperature curing reduced with time. At the age of 360 days, all of the PFA mixes had strengths between 14% and 31% higher than the target strength. On comparison, the OPC mixes gained little strength after 28 days, and at the age of 360 days, the OPC mixes had strengths roughly the same as the target strength.
The behaviour of the mixes suggests that in the cold seasons in Hong Kong, the use of high PFA concrete in thin structural sections may lead to an impeding effect on the early age strength development of the concrete. The impediment could be more prominent if there was a prolonged period of low temperature and a longer waiting time may be necessary prior to formwork stripping. The long term strength development of the PFA mixes, however, does not seem to be affected by the initial low curing temperature as evidenced by the above-target concrete strengths at the age of 360 days.
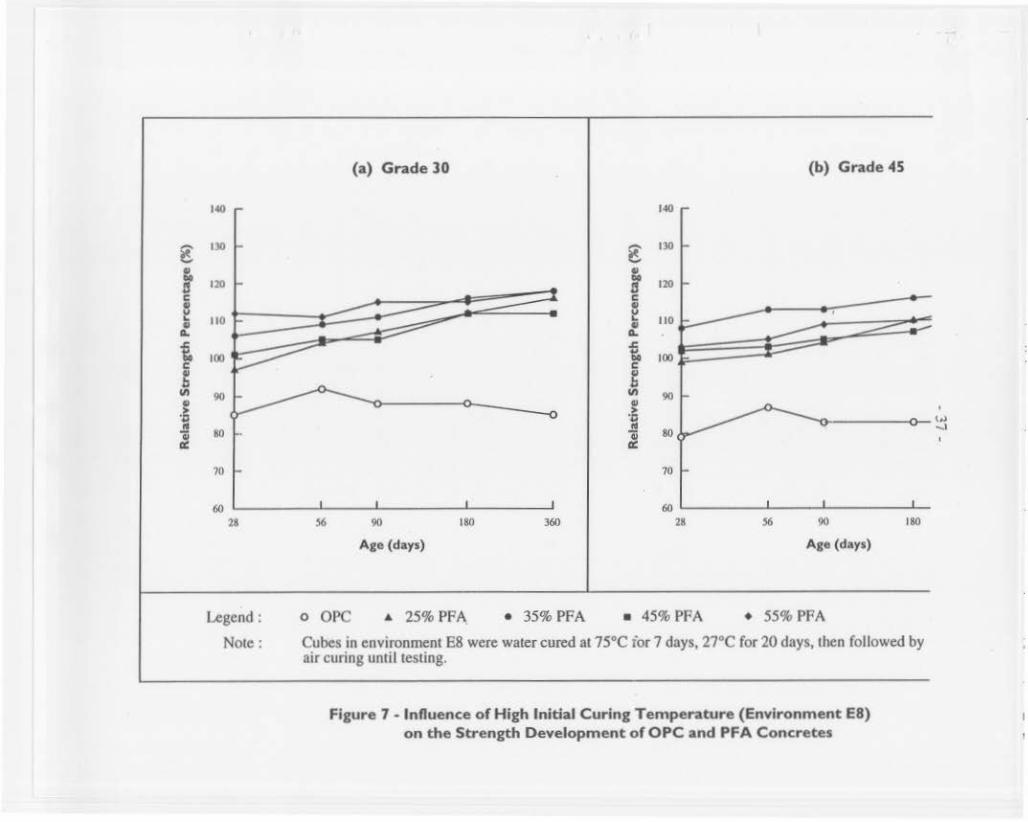
4.4.2 Influence of high initial curing temperature
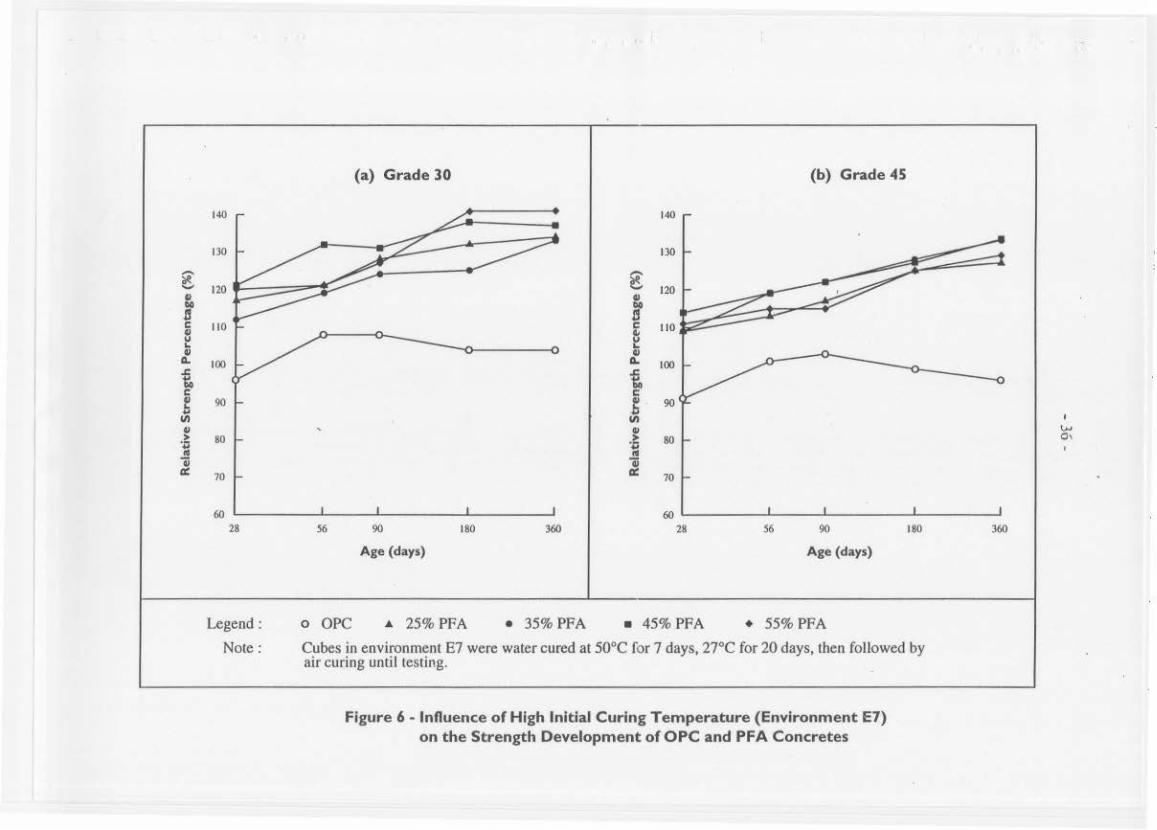
The curing environments E7 and E8 simulates the conditions in mass concrete pours where the adiabatic temperature may rise to as high as 75•c or above. The cubes in environment E7 were initially water cured for 7 day's at 5o•c, followed by further water curing at 27°C for another 20 days. Thereafter, the cubes were stored in the air curing room until testing. Similarly, the cubes in environment E8 were initially water cured at 75•c for 7 days, followed by water curing at 2o•c for 20 days and then storage in the air curing room . until testing.
The results of cubes subjected to high initial temperature curing (i.e. environments E7 and E8) are shown in Figures 6 and 7. ft can be seen that the strength development of the OPC mixes was hampered by the high temperature curing. The OPC mixes generally had strengths lower than the target strength, with the exception of Grade 30 cubes cured under environment E7 which reached the target strength. The retarding effect was more prominent in environment E8 (i.e. 75°C curing), where the OPC mixes only reached a strength of about 85% of the target strength at the age of 360 days. This suggests that the OPC concrete in a mass pour may not reach the target strength at all locations even at an age of 360 days.
On comparison, all of the PFA mixes had strengths wbich were equal to or greater than (by up to 41 %) the target strength for all the test ages. At the age of 360 days, the PFA mixes in environment E8 achieved strengths between ll % and 18% above the target strength.
The results lend support to the conclusion given in the interim report that a PFA concrete is less sensitive to a high curing temperarure than an OPC concrete of the same design (28-day) strength, with datil extending to 360 days.
4.5 Influence of Duration of Curing
It was generally believed that PFA concrete is more sensitive to curing than OPC concrete and if not cured sufficiently, the strength development of PFA concrete will be severely affected. The results of this investigation indicate that this may not be entirely correct. The influence of duration of water curing on the strength development of Grade 30 and Grade 45 mixes is shown in Figures 8 and 9 respectively.
As can be seen from the figures, none of the cubes subjected to air curing only (i.e.
- 9 -
curing environment E4) achieved their target strengths even at the age of 360 days. This clearly supports the conclusion drawn in the imerim report that if OPC and PFA concretes are insufficiently cured, their strength potential will not be realised.
For cubes that were subjected to limited curing (viz. 3 or 7 days as in curing environments E5 and E6), the OPC mixes generally had higher strengths than the PFA mixes at 28 days. At the age of 180 and 360 days, this trend is reversed and all of the PFA mixes had higher strengths than the corresponding OPC mixes. Furthermore, PFA mixes that had been subjected to 7 days water curing had strengths exceeding the target strength at the age of 360 days. None of the corresponding OPC mixes achieved the target strength even at the age of 360 days.
The results indicate that the long term strength of PFA concrete is not seriously impaired by insufficient curing. On the other hand, OPC concrete, if not cured properly, appears to suffer more in the long term.
The results also confirm the general belief that the longer is the curing, the higher will be the cube strength.
5. CONCLUSIONS AND RECOJ\IIMENDA TIONS
In response to SCCT's request, the PWCL carried out a laboratory investigation of the srrength development of high PFA content concrete. A total of teo concrete mixes and eight curing environments were included in the study. Altogether 2520 density and compressive strength tests were carried out on concrete cubes. Based on the results up to a test age of 360 days, the following conclusions can be drawn:
(a) For the two concrete grades investigated, the replacement of OPC by PFA has a slight retarding effect on the early age strength of the concrete. The 7-day srrengths of the PFA concrete mixes with PFA replacement percentages between 25% and 55% were berween 52% and 68% of the 28-day strength, compared to a range of 67% to 76% for the OPC concrete mixes. These results are for the standard (27°C) water curing environment.
(b) Despite the reduction in early age strength, the PFA mixes gained strength rapidly and achieved target strengths equivalent to the OPC mixes at 28 days. Berween the ages of 28 days and 360 days, the OPC mixes exhibited little srrength gain (in fact a strength reduction after about 90 days), whereas the PFA mixes showed a strength gain between 23% and 44%.
(c) For the OPC concrete mixes, a curing temperature as low as 10°C (applied over a 3-day period) did not have a significant effect on srrength compared to standard water curing at 27°C. However, for the PFA mixes, as the PFA replacement percentage was increased, the 28-day strength reduced quickly when the curing temperature dropped below 27°C. The influence of the low curing temperature reduced with time : all of the PFA mixes gave strengths of about 14% to 31% higher than the target strength at the age of 360 days. The OPC mixes gained little strength after 28 days and had roughly the same strength as the target strength at the age of 360 days.

.- !0 -
(d) The strength of the OPC mixes reduced significantly (to below the target strength) as the curing temperature was increased from 27°C to 75°C. Even at the age of 360 days, OPC mixes that had been cured at 75°C (over a 7-day period) gave strengths about 15% below the target strength. This suggests that the OPC concrete in a mass pour may not reach the target strength at all locations.
On comparison, all of the PFA mixes had post 28-day strengths which were generally much greater than the target strength. This suggestS that a PFA concrete is less sensitive to a high curing temperature than an OPC concrete of the same design strength.
(e) The OPC and PFA mixes which were cured insufficiently showed a reduction in strength by a similar amount at the age of 28 days. However , at the age of 360 days, all the PF A mixes that had been cured for a minimum of 7 days had achieved their target strengths. On comparison, only the OPC mixes with 28 days water curing achieved the target strengths at 360 days.
6. REFERENCES
Hong Kong Government ( 1990). ~c~o~n;l.!str"'-!u8c:1!ti!.!on!!.._-'S.?Jtan>illlld~a!l.rl!.d ___;:.._..JTu.e~stwinwg;._..,~C...~o.un8c"-lre=te CCSl: 1990). Two volumes, Government Printer. Hong Kong.
Leung, W.C. & Tse, W.L. (1993). Interim Report on a Laboratory Investigation of the Strength Development of High PFA Content Concrete. Geotechnical Engineering Office, Hong Kong, 4lp.
- 11 -
LIST OF TABLES
Table Page No. No.
Physical and Chemical Properties of Cement 13
2 Physical Properties of Aggregates 14
3 Physical and Chemical Properties of PF A 14
4 Mix Proportions 15
5 Curing Environments of Cubes after Demoulding 16
6 Density and Compressive Strength of Concrete Mix Ml under 17 Various Curing Environments
7 Density and Compressive Strength of Concrete Mix M2 under 18 Various Curing Environments
8 Density and Compressive Strength of Concrete Mix M3 under 19 Various Curing Environments
9 Density and Compressive Strength of Concrete Mix M4 under 20 Various Curing Environments
10 Density and Compressive Strength of Concrete Mix M5 under 21 Various Curing Environments
11 Density and Compressive Strength of Concrete Mix M6 under 22 Various Curing Environments
12 Density and Compressive Strength of Concrete Mix M7 under 23 Various Curing Environments
13 Density and Compressive Strength of Concrete Mix M8 under 24 Various Curing Environmems
14 Density and Compressive Strength of Concrete Mix M9 under 25 Various Curing Environments
15 Density and Compressive Strength of Concrete Mix MIO under 26 . Various Curing Environmems
16 Mean Compressive Strengths for Mixes Ml to MIO 27
17 Normalisation Factors for Mixes Ml to MIO 28
- 12 -
18. Normalised Mean Compressive Strengths for Mixes Ml to MIO 28
19 Relative Strength Percentages for Mixes Ml to MIO 29
•
- 13 -
Table 1 - Physical and Chemical Properties of Cement
Test Unit Sample No.
1 2 3
Physical Properties
Density kg/m3 3120 3150 3130 Fineness (specific surface) m2/kg 335 360 355 Standard consistence % 26.0 - 27.5 28.5 Initial setting time mrn. 120 135 LOS Final setting time mm. 170 215 105 Soundness (expansion) mm 1.0 0 l.O Concrete cube strength (mean 3 days) MPa 36.5 37.0 40.0 Mortar cube strength (mean 28 days) MPa 70.5 73.5 69.0
Chemical Properties
Si02 % 20.9 20.7 20.5 CaO % 65.2 64.3 65.1 Al203 % 5.5 5.3 5.4 F~03 % 3.1 3.1 3.0 MgO % 0.7 1.5 1.1 ~0 % 0.33 0.48 0.38 N~O % 0.10 0.14 0.10 S03 % 2.4 2.5 2.4 Insoluble residue % 0.2 0.4 0.2 Loss-on-ignition % 0.6 1.2 1.1 C3A % 9.2 8.8 9.3 Lime saturation factor - 0.95 0.94 0.96 Total alkali (equivalent N~O) % 0.32 0.46 0.35

- 14 -
Table 2 - Physical Propi!rties of Aggregates
Test Unit
Coarse Aggregates Fine Aggregates
20mm 10 mm Rock Fines Rifer Sand
Samule No. 1 2 3
Sarnule No. 1 2 3
Sam11le No. 1 2 3
Sarnflle No. 1 2 3
L. Panicle size distribution (Percentage Passing) Size of BS Sieve (mm)
37.5 % 100 100 100 -- -- - - -- -- -- -- --20 % 92 95 97 -- -- - .. - -- -- -- --14 % 41 42 64 -- -- -- - -- ·- -- - --10 % 12 9 20 100 99 100 .. .. -- -- - --5 % I I 3 16 27 12 100 100 93 100 98 100 2.36 % 1 0 3 4 2 I 76 81 60 94 85 93 1.18 % - - .. - .. .. 53 60 45 77 66 74 0.6 % . -- - -- - - -- 39 44 35 49 40 44 0.3 % .. .. -- - - - 28 32 27 21 13 13 0.15 % .. -- - -- - - 18 22 18 3 2 1
2. Flakiness index 17 17 17 20 -- 19 - -- - -- -- -
3. Elongation index 38 37 38 9 -- 3 - -- - -- .. •.
4. Ten per cent fines value kN !50 210 210 •so - -- - .. - -- - --
5. Crushing value % 23 20 -- *21 - - -- - -- .. - --6. Water absorption % 0.6 0.5 0.5 0.7 0.7 0.6 0.8 0.9 0.8 1.1 0.4 0.7
Legend: * The aggreggates used in these restS were of non-s~andard size with a size range of 6.3- 10 nun.
• Table 3- Physical and Chemical Properties of PFA
Sample No. Test Unit
1 2 3
Fineness of PF A residue on 45 J.'ID sieve % 3.8 3.4 2.9 Moisture Coment % 0.1 0.1 0.1 Water requirement % 98 99 99 Loss-on-ignition % 3.7 3.5 3.7 MgO % 1.1 0.7 0.4 so3 % 0.8 0.7 0.9
I

Table 4 - Mix Proportions
Nominal Total · Slump Mix Percentage or Cementitious Cement PFA Water Ratios Admixtures
Rd. No. Grade PFA Content A/C W/C D-17 Super 20 Replacement
(%) (kg) (kg) (kg) (kg) (mm)
(c.c.) (c.c.)
Ml 30 0 310 310 0 189 6.13 0.61 0 0 75
M3 30 25 330 248 82 178 5.73 0.54 0 735 80 M5 30 35 340 221 119 177 5.54 0.52 0 2100 70
M7 30 45 390 215 175 176 4.71 0.45 0 2155 75
M9 30 55 460 207 253 184 3.82 0.40 0 2449 65
M2 45 0 375 375 0 195 4.88 0.52 190 0 75 M4 45 25 390 293 97 168 4.72 0.43 0 1684 65 M6 45 35 400 260 140 168 4.58 0.42 0 3325 65 M8 45 45 460 253 207 175 3.84 0.38 0 2938 70 MIO 45 55 550 248 302 187 3.03 0.34 0 4114 65

• 16 •
Table 5 - Curing Environments of Cubes after Demoulding
Curing Environment Description
El 27°C water curing for 27 days, then air curing E2 10•c water curing for 3 days, followed by 2o•c water curing for
24 days, then air curing E3 · 2o•c water curing for 27 days, then air curing E4 Air curing E5 2rC water curing for 3 days, then air curing E6 2rC water curing for 7 days, then air curing E7 so•c water curing for 7 days, followed by 27°C for 20 days, then
air curing E8 75°C water curing for 7 days , followed by 2rC for 20 days, then
air curing
Notes: ( 1) The air cured cubes were stored in a room where tbe temperature was maintained at 25 ± 5°C.
(2) The mean relative humidity of the room over the test period was about 75%.

Table 6 - Density and Compressive Strength of Concrete Mix Ml under Various Curing Environments
-- --·- ~
Curio& £n.-i.roomtal
Aa:e at Test
-~
- -
7 Dars l8 Da)'S S6 Days 90 Da)'S 180 Dar• ~oars
Mtu Str<Pc!h (MPa)
MtaD St=c!h (:\!Pal
Meaa sor ... ,~ (li!Pa)
Meaa SlrtGIIII (MPa)
D<a!IIJ'
lkllln'l
Comprcssin SlrtGI!h (MPa)
Meu Strtnctb C\th)
0~
(kcJm'l
Compra.s.in Sor ... tb 011P•l
Meu Str<ooc!h (l\tPa)
El 16.0 39.0 42.8 42.8 2380 2370 2390
41.0 41.S 39.S
40.7 2380 2360 2360
38.0 37.5 38.5
33.0
E2 - 37.0 43.0 41.2 237S 2365 2370
40.0 42.0 42.S
41 s 2390 2360 2360
39.S 39.0 400
39.S
EJ 37.5 420 4l.!i 2370 2)70 2370
42.S 38.5 39.0
400 2360 2380 2360
41.0 39 5 3H
39.7
E4 - 28.7 30.2 28.5 2380 2400 2380
29.0 30.0 27.0
28.7 2390 2400 2390
30.0 31.0 28.5
29.8
ES .. 33.S 3S.S 35.3 1380 238S 2385
34.0 33.S 33.5
33.7 2390 2360 2370
32.0 33 0 33 s
32.8
E6 - 36.0 380 38.0 2370 2)60
1360
38.0 35.0 34.S
3S I 2380 2380 2370
30 3U 31.0
32.7
E7 - 37.5 42.3 42.0 2370 2360 2330
38.S 40.5 43.0
40.7 2370 2360 2360
38.0 43.0 41.0
40.7
E8 - 33.0 35.8 34.) 2375 236S 2360
33.0 35.0 34.5
34.2 2390 2370 2380
33.0 33.0 33.0
33.0
NOits : 1be derada of lhc dc.ndt»es &nd iodjvidual a.! be lltcf\CUU of concrete mi1 Ml bct"'ccn the IJCJ of 7 da)'S and 90 days undtr the Vltiow curin& cnvironmenlt ltC eavco in I be inle:rim repcxt (lwn& & r ... 1993).
--------

Table 7 - Density and Compressive Strength of Concrete Mix M2 under Various Curing Envirorunents
Age ar Test
Curing 7 Days 28 Days 56 Days 90 0lQ'S 180 03)'5 360 Days
Euvirownwl 1\h:au ' Mean Mean Mean Otosity Compressive Merut Oeuslly Cow pressl ve Meaa Streugth Streuglb SI<COlgth Streugtb Streuglb Streugtb Strruglb Slrtllgcb (M Pa) (MPa) (MPa) (MPa) (kg! no') (I\1Pa) (lltPa) (kgim') (MPaJ ~IPa)
2380 54.0 2380 54.0 El 39.5 52.3 60.5 58.2 2380 55.5 55.2 2370 56.5 54.5
2360 56.0 2360 53.0
2375 53.0 2370 52.0 E2 - 50.8 51.2 55.5 2375 53.5 53.3 2360 48.5 51.0
2390 53.5 2370 51.5
2370 54.5 2370 53.0 E3 .. 52.0 51.8 57.7 2365 53.0 . 53.8 2380 55 0 53.3
2365 54.0 2360 52.0 . ,..... 0>
2380 42.0 2370 41.5 E4 .. 39.2 43.8· 39.8 2380 42.5 41.0 2380 42.0 41.7
2395 38.5 2380 41.5 I
2360 48.0 2380 49.0 €5 - 50.2 50.2 50.3 2370 49.5 48.3 2360 45.5 47.0
2360 47.5 2380 46.5
2370 52.0 2350 48.5 E6 - 53.2 54.2 54.8 2360 52.5 52.7 2370 so.o 49.8
2360 53.5 2370 51.0
2360 51.5 2370 49.5 E7 - 41.5 53.0 53.7 2370 53.0 52.0 2370 51.5 50.3
2375 51.5 2360 50.0
2360 43.5 2360 42.5 E8 .. 41.3 45.5 43.3 2360 43.0 43.2 2370 43.5 43.3
2360 43.0 2350 44.0
Notes : The details or th.e densities and individual cube slrengths of concrete mix M2 bdween the ages or 7 days and 90 days under abe various curing environmen~&are given in lhe imedm repon (Leung&. Tse, 1993).

Table 8 - Density and Compressive Strength of Concrete Mix M3 under Val"ious Curing Environments
Curiug Euvirunwcuc
Ageal T<SI
1 Uays 28 Days 56 Days 90 llays 180 l)ays 360 Oays
1\fcau S~reug1h (MPa)
1\fcu S1rmg1b ()IIPa)
Mean S1reuglh (MPa)
Mcaa Slreuglh (MPa)
Deusily
(kg/w')
Comr1re$Sive Slreuglh (lltPa)
Meau Slreuglb (MPa)
Otu.~il>'
(kglm')
Cowprcs$i,,e S1reuglh (MPa)
Meau Slr""l!lh (MPa)
2380 50.5 2370 49.0 El 24.5 39.8 46.7 49.5 2370 50.5 49.8 2370 48.5 49.0
2360 48.5 2380 49.5
2370 47.0 2370 45.0 E2 .. 35.8 43.7 46.7 2370 48.5 47.3 2360 48.0 46.5
2370 46.5 2370 46.5
2370 48.0 2370 45.0 E3 .. 36.7 43.8 45.8 2380 46.0 47.3 2370 46.0 46.8
2380 48.0 2360 49.5
2380 32.5 2390 35.0 E< .. 29.5 32.8 33.2 2390 33.0 32.8 2380 37.0 35.7
2380 33.0 2400 35.0
2390 40.0 2370 42.0 E5 .. 35.5 39.2 39.0 2380 42.0 41.3 2360 42.5 42.3
2370 42.0 2360 42.5
2370 44.5 2370 44.0 E6 - 39.2 41.5 43.8 2380 45.5 44.2 2380 49.0 45.3
I 2370 42.5 2380 43.0
2380 54.0 2370 54.0 E7 - 46.8 48.2 51.3 2370 55.0 52.8 2360 56.5 53.7
I
I
2380 49.5 2370 50.5
2380 46.0 2360 48.0 E8 .. 38.8 41.5 42.8 2390 45.0 44.8 2350 46.0 46.2
2380 43.5 2360 44.5
I I
I NI.Mc.s: The details of the densities and individual cube sttengllll of concrete tuix M3 betww~ the ages or 7 d1ys ~nd 90 dtyt under the various curing environments are given io tt\e interim report (Leung & Tse, 1993).
-C> ...
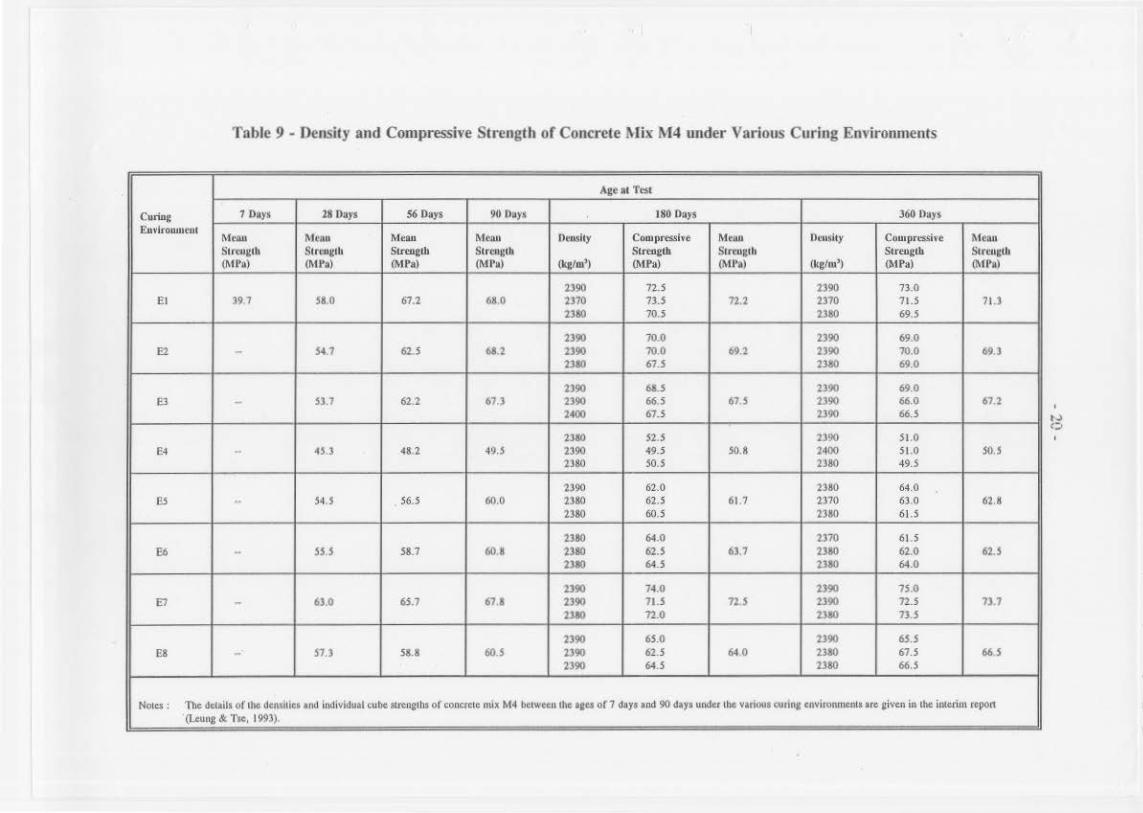
Table 9 - Density and Compressive Strength of Concrete Mix M4 under Various Curing Environments
Curiug Enl'itOWllt'lll
AgeatT<$1
7 Days 18 Days 56 Days 90 Da)• 180 D>ys 360 tlays
Mtru.t Sl(t.'U&Ih (1\IPa)
Mean Slr""l'oh (MPa)
Mean Sott~~glb
(MPQ)
Mean S1rcngtb (II!Pa)
Ocusicy
(kg/m')
Compressive Stret~glll
(MPa)
MtQU
Scrtugtll (Ml'a)
Otusity
(kgtw')
Comprcs..~ive
Soret~glb
(MPa)
I I
Mean '
Streua:th (1\IPa)
El 39.7 58.0 67.2 68.0 2390 2370 2380
12.5 73.5 10.5
72.2 2390 2370 2380
73.0 71.5 69.5
71.3 I
E2 - 54.1 62.5 6&.2 2390 2390 2380
70.0 70.0 61.5
692 2)90 2390 2380
69.0 70.0 69.0
I 69 3 ' !
1!3 -· 53.1 62.2 67.3 2390 2390 2400
6&.5 6(i;
61.5 61.5
2390 2390 2390
69.0 66.0 66.5
67.2
E4 -- 45.3 48.2 49.5 23110 2390 2380
52 5 49.5 50.5
50.8 2390 2400 2380
51.0 51.0 495
50.5
ES 54.5 56.5 60.0 2390 2380 2380
62.0 62.5 60.5
61.7 2380 2370 2380
64.0 63 0 61.5
62.8
E6 -- 555 58.7 60.8 2380 2380 2380
64.0 62.5 64.5
63.7 2370 2380 2380
61.5 62.0 64.0
62.5
E1 - 63.0 65.1 671 2390 2390 2310
74.0 11.5 12.0
12.5 2390 2390 2380
15.0 12.5 13.5
73.7
E8 - 57.3 58.8 60S 2390 2390 2390
65.0 62.5 64.5
64.0 2390 2310 2380
65.5 61.5 66.5
665
Notes: The details of the densltic11 and individual <:ube stte.Jlgtlls of concrete mix M4 bclwtcn the •ecs of 7 days and 90 days under tM varioua curin, environments are &ivc.n in che interim rcpon ·(Leung & Tsc, 1993)
~
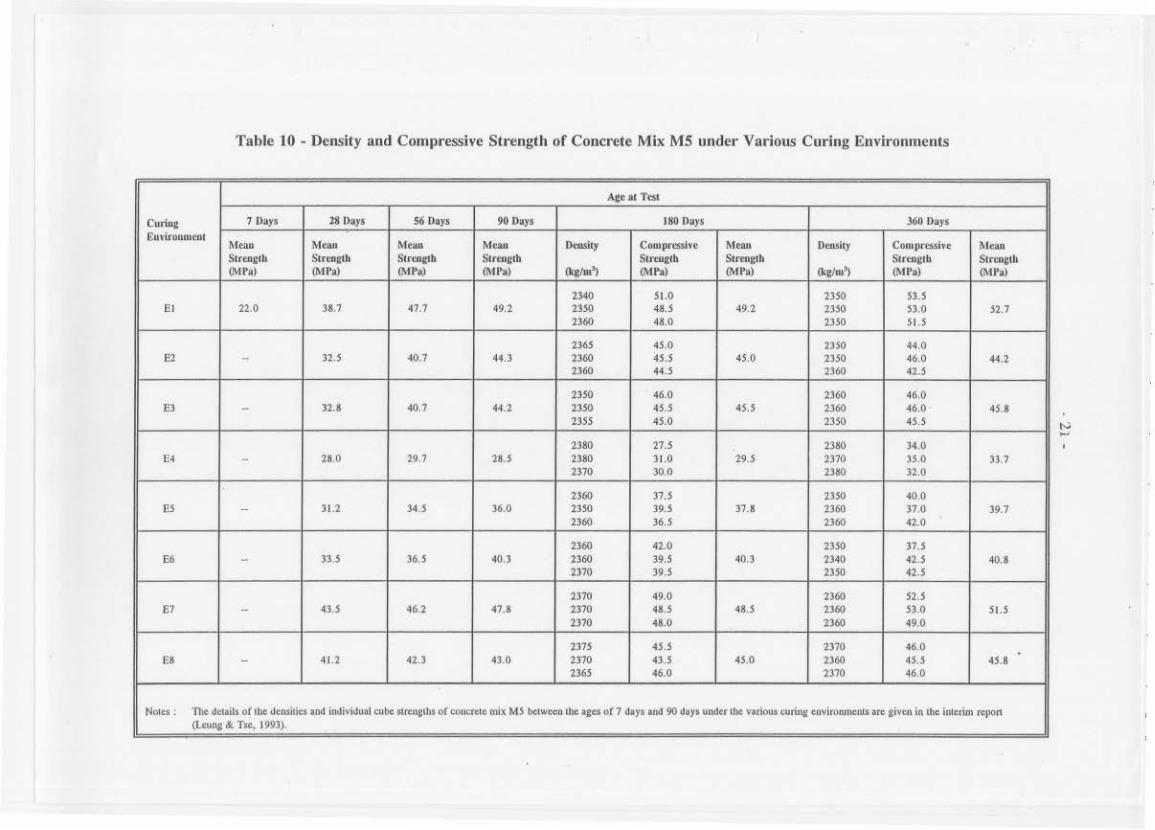
Table 10 -Density and Compressive Strength of Concrete Mix MS under Various Cm·ing Environments
Ageao T'"'
Curiu.g 7 Days 28llays 56 Days 90 Days 180 Days 360 Days
Euviroumeau Meau Meau Mcau MtaJJ Deusloy Coruprcssivc Mean Deu.sit)· Ctl1UJ)ft$Sive Mean Strength Streogtll Strcoglb Streuglb Soreoglb Soreogtb Strength Sorwglb (MPa) (MPa) (MPa) (MPa) (l<glm') ~lfa) (MPa) (kglru') (MPa) (MPa)
2340 51.0 1350 53.5 El 21.0 38.7 47.7 49.2 2350 48.5 49.2 2350 53.0 52.1
2360 48.0 2350 51.S
2365 45.0 2350 44.0 E2 32.5 40.7 - 44.3 2360 45.5 45.0 2350 46.0 44.2
2360 44.5 2360 42.5
2350 46.0 2360 46.0 E3 - 32.8 40.7 44.2 2350 45.5 45.5 2360 46.0 45.8
2355 45.0 1350 45.5
2380 11.5 1380 34.0 E4 .. 28.0 29.7 28.5 2380 31.0 29.5 2370 35.0 33.7
2370 30.0 2380 32.0
2360 37.5 2350 40.0 ES ·- 31.2 34.5 36.0 2350 39.5 37.8 2360 37.0 39.7
2360 36.5 2360 42.0
2360 42.0 2350 37.5 E6 .. 33.5 36.5 40.3 2360 39.5 40.3 2340 41.5 40.8
2370 39.5 2350 42.5
2370 49.0 2360 52.5 S7 .. 43.5 46.2 47.8 2370 48.5 48.5 2360 53.0 51.5
2370 48.0 2360 49.0
2375 45.5 2370 46.0 EB - 41.2 42.3 43.0 2370 43.5 45.0 2360 45.5 45.8
2365 46.0 2370 46.0
Notes : The details of the Jensilies and individual cube: atrt.ngths or concrete mix M.5 betweeo the ages of7 days and 90 days under the various ®ring t.nvironments are given in the interim report (Leung & Tse, 1993).

Table 11 - Density and Compressive Strength of Concrete Mix M6 under Various Curing Environments
C uriug £u\'irOUlUCUI
Age al Test
7 Oays 28 Days 56 Days 90 Days 180 Days 360 [)ays
Mcau Stre.o~:tb (MPa)
Mean Strtugtb (MPa)
Mtau Streo.gth (MPa)
Mean Strt:ugtb (MPa)
IXusity
O<glw')
C«.noprtssi,·e Streugtb (MPa)
Mean Screuglh 6\tPa)
neosity
(kgl•u')
Compressive Streugtb (MPa)
Mtau Slr<oJ&Ill (MPa)
I) I 32.0 51.5 60.2 63.2 2360 2360 2360
67.5 67.0 61.5
65. 3 1360 2360 2360
69.0 67. 5 67.0
67.8
E2 -- 45.8 57.0 60.5 2370 2380 1360
62.0 62.5 62.5
62.3 2360 2360 1390
66.0 68.0 69.0
67.7
E3 - 47. 3 58.3 62.3 2360 2380 2360
61.5 64.0 65.0
63.5 2380 2360 2370
61.5 65.5 59.5
62.2
E4 -- 39.8 39.0 43.3 2390 2380 2380
49.5 45.5 43.0
46.0 2370 1380 2380
47.0 45.0 44.5
45.5
£5 -- 43.3 46.7 50.2 2360 2350 2370
54.0 52.5 50.0
52.2 2370 2360 2370
54.0 48.5 50.5
51.0
E6 -- 45.7 47.5 50.8 2370 2360 2350
52.5 53.5 54.0
53.3 2370 2370 2370
53.0 54.5 53.0
53.5
E7 .. 56.3 61.5 62.8 2380 2390 2370
65.0 65.0 67.5
65.8 2370 2370 2380
69.0 63.0 68.5
68.5
ES .. 55.5 ss.o 58.3 2370 2380 2370
58.5 61.5 59. 5
59.8 2380 2380 2380
59.5 61.5 61.5
60.8
Nocc:s: 1l.e dc:cails of the densities and individual c:ubc .strengttu or concrete mix M6 between the aaes or 7 days and 90 days under the various curine environments ao: given in the interim report (l,.eunK & Tse, 1993).
1'-.1
""

Table 12 - Density and Compressive Strength of Conc1·ete Mix M7 unde1· Various Curing Environments
Curiog Earironmml
Age atTest
7 lllltS 28 Days 56 IJays 90 Days 180 !lays J60 Days
Mc-.a s,,....,,b (MPa)
Meaa Slral:tb ~tP'I)
MtaD
Scrt~~ctll ~I I'll)
Mean Sttaogtlo (l\IP'I)
o...sitY
lkl/01')
Compressin Strmgtlo (MJ>a)
M<M St.....,tll (l\t Pll)
Deosity
(l;glm')
Coaapn:sshe Scr<uetll (111Pa)
Mean SU...gtb (,\!Pa)
El 22.3 41.2 51.2 52.0 2380 2370 2370
56.0 58.0 55.0
56.3 2360 2370 2360
58.0 60.0 59.0
59.0
E2 - 31 .8 45.0 46.5 2370 2)70 2370
51.0 53.0 52.0
Sl.O 2360 2370 2370
54 0 54 0 so s
52.8
E3 - 31.3 46.2 47.5 2360 2360 2370
50.0 51.0 52.0
51.0 2370 2)110 2370
su 52 0 525
52.0
E4 - 27.0 32.8 30.8 2360 2370 2360
34.0 33.5 :12.0
33 2 23110 2380 2370
36.5 33.5 34.5
34.8
E5 - 33.2 38.2 39.5 2380 2360 2360
41.0 43.5 43.5
42.7 2380 2370 2360
42.5 44.5 44.0
43.7
E6 - 36.0 41 .7 43.2 2360 2370 2370
46.0 47.0 49.5
47.5 2360 2370 2360
48.0 SJ.S 42.0
47.2
E7 50.0 54 3 53.8 2370 2390 2360
55.5 61.0 54.0
56.8 2360 2360 2370
550 600 S4.S
56.5
E8 .. 41.5 43.2 43.3 2370 2360 2350
45.0 46.5 46.5
46.0 2370 2370 2360
46.5 46.0 46.0
46.2
Nilles: The ~a Us or 11\c deru.ities and i.odivldual cuhc: •rtn_ttha uf coocrae mix M7 bc.lwc:en lhe IJ:t& or 7 days and 90 d.t)'l under the variul.i.a wriJlg environmen&s arc &ivcn in the inrerim report (l.<unc.!l1'se, 1993).
----
ti
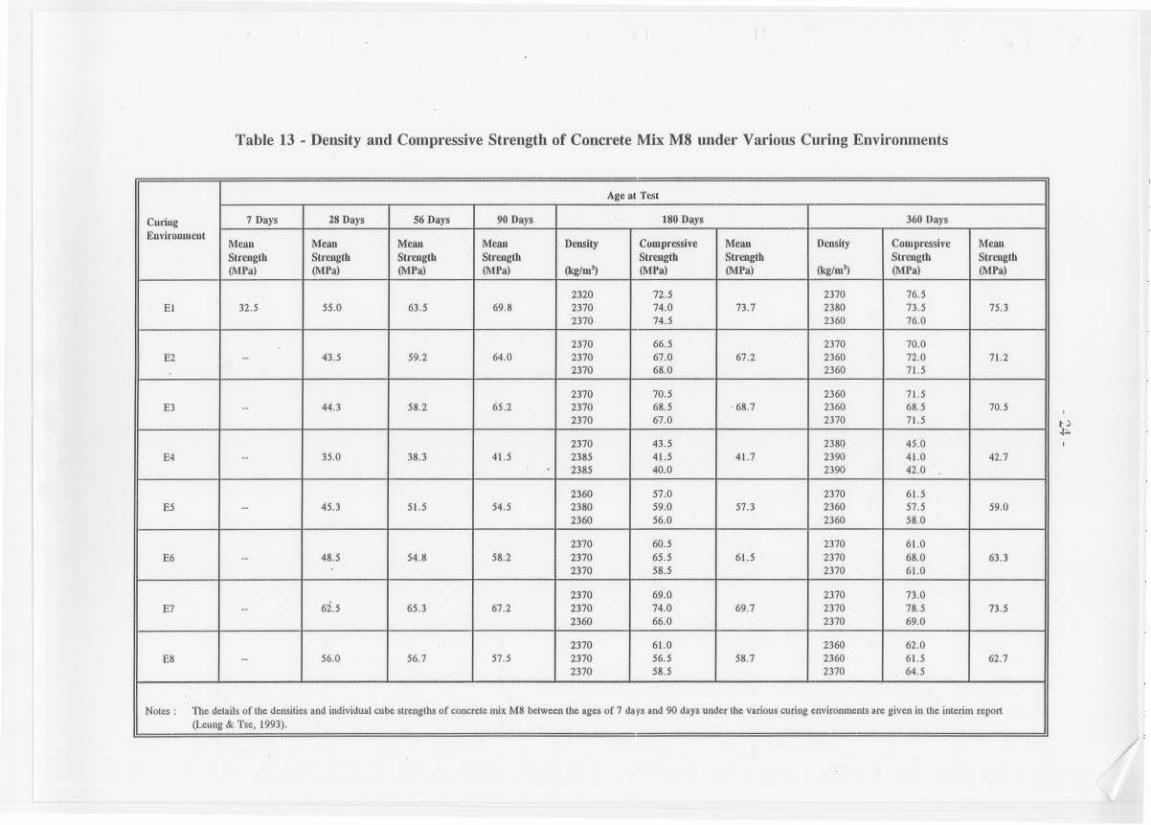
Table 13 - Density and Comp1·essive Strength of Concrete Mix M8 under Various Curing Environments
Curing El.l\'iroumcut
--~
Age at 'l'e5t
7 Days 28 Days 56 Days 90 Days 180 Days 360 l>Oj'S
Mcau Strength (MPa)
Mean Strength (MPa)
Mean Slr<ll&tb (MPa)
Mean Strenglb (MPa)
Deosil)l
(kglru')
Compressive Strenglb (MPa)
Mean Strenglb ()ltPa)
Owsil)l
(kglw')
COilJJirCSsivc Slreogth ()lfPa)
Mean Strt'llgtb (MPa)
El 32.5 55.0 63.5 69.8 2320 2370 2370
72.5 74.0 74.5
73.7 2370 2380 2360
76.5 13.5 76.0
75.3
E2 -- 43.5 59.2 64.0 2370 2370 2370
66.5 67.0 68.0
67.2 2370 2360 2360
70.0 n.o 71 .5
71.2
E3 .. 44.3 58.2 65.2 2370 2370 2370
70.5 68.5 67.0
' 68.7 2360 2360 2370
71.S 68.5 71.S
70.5
E4 - 35.0 38.3 4l.S 2370 2385 2385
43.5 4l.S 40.0
41.7 2380 2390 2390
45.0 41.0 42.0
42.7
E5 .. 45.3 51.5 54.5 2360 2380 2360
57.0 59.0 56.0
57.3 2370 2360 2360
61.S 57.5 58.0
59.0
E6 .. 48.5 54.8 58.2 2370 2370 2370
60.5 65.5 58.5
6U 2370 2370 2370
61.0 68.0 61.0
63.3
E7 - 6i.5 65.3 67.2 2370 2370 2360
69.0 74 .0 66.0
69.7 2370 2370 2370
73.0 78.5 69.0
73.5
ea -- 56.0 56.7 51.5 2370 2370 2370
61.0 56.5 58.5
58.7 2360 2360 2370
62.0 61.5 64.5
62.7
Notes: 1'he details or the densities and individual eube strtn~th.s of oonerece mix M8 between the a~es of 1 days and 90 days under the various eurina: t.nviron.nents are s:ive.n in the inlerim report (Leung&. 1"se, 1993).
t .)
~-

Table 14 - Density and Compressive Strength of Concrete Mix M9 under Various Curing Environments
Curing Euviromne111
Age al Tesl
7 Days 28 Days SO Days 90 Days 180 Days 360 Days
Mean Strtogtb (MPa)
MeaD Slrenglb (MPa)
Mean Slre~~glb (MPa)
Mean Slnoglb (MPal
Deuslly
(kglm')
Compressive Sl«<lglb (MPa)
M•an Slreaglh (lit Pal
Densl!y
(kglw')
Compressive Sll·•oglb (MPa)
l\'ftan Slrtnglll (II! Pa)
Ill 22.5 42.9 49.5 54.3 2350 2350 2340
51.5 60.5 61.5
59.8 2340 2350 2350
58.5 64.0 62.5
61 .7
1)2 - 31.0 44.3 50.3 2360 2350 2350
57.0 56.5 56.5
56.1 2350 2350 2340
56.5 56.5 53.5
55.5
ll3 .. 29.3 40.7 47.2 2350 2340 2350
51.5 52.0 50.0
5!.2 2340 2350 2330
49.5 52.0 50.5
50.7
E4 - 30.2 33.3 35.7 2360 2350 2360
35.5 35.5 37.5
36.2 2370 2360 2360
35.5 36.5 36.0
36.0
E5 - 35.5 38.7 44.2 2350 2360 2350
46.0 44.5 43.5
44.7 2350 2350 2350
45.0 43.5 42.5
43.7
E6 .. 37.0 40.5 44.7 2360 2350 2340
43.0 45.0 44.0
44.0 2350 2340 2340
46.5 44.0 44.5
45.0
E7 -- 51.5 51.1 54.5 2360 2350 2340
60.0 60.5 60.5
60.3 2360 2340 2340
62.0 60.5 58.5
60.3
ea .. 48.2 47.7 49.5 2360 2340 2350
48.0 48.5 51.5
49.3 2360 2360 2340
50.0 51.0 51.5
so.&
Notes : The details of the den.s.iciu ~M individual cube strenglbs of coocn:te mix M9 bdwc:en the ages of 7 day• ~nd 90 days uo<Jer tb.e various curing eoviroJ\ments are given in the interim report (l..eung & 1',., 1993).
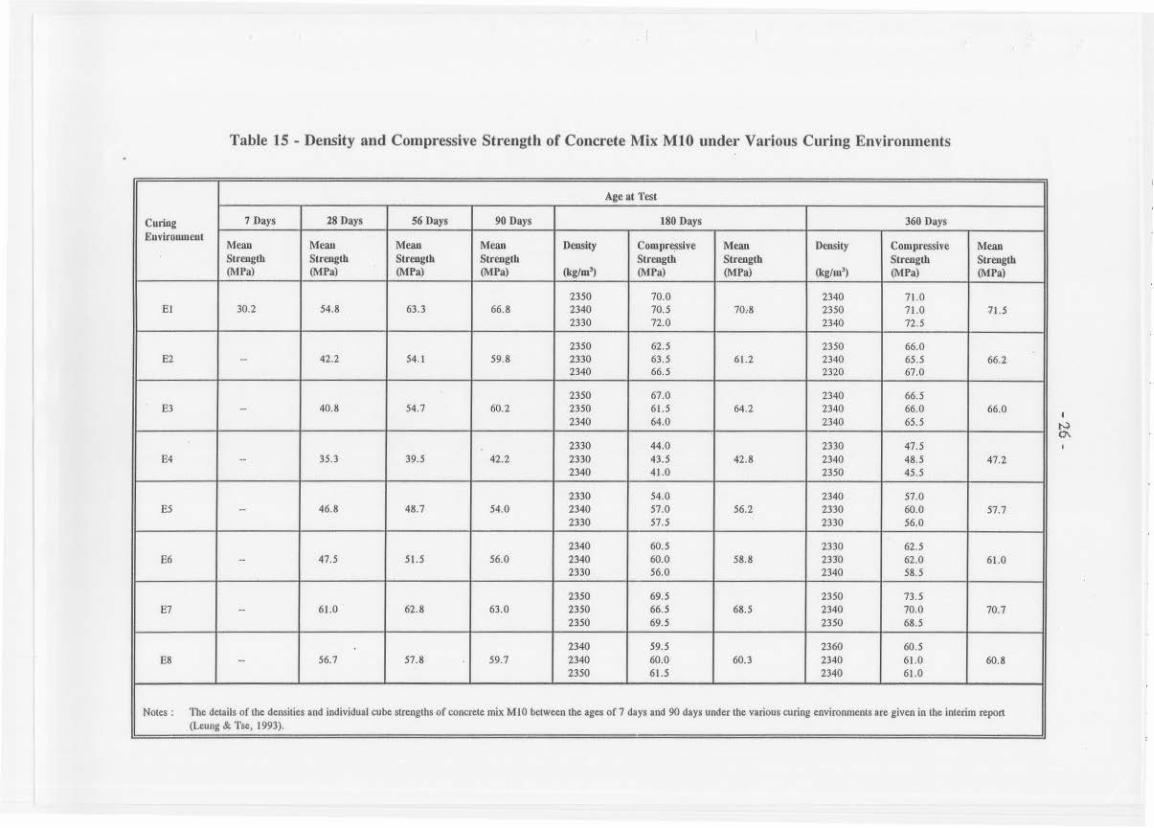
Table 15 - Density and Compressive Strength of Concrete Mix MlO undet· Various Curing Enviromnents
CuriJJg Euvir()wnl'..uf
7 Days
Mean Strougtb (MPa)
28 Days
Meau Strouglh (!It Pal
56llays
Meau Slrouglh (!It Pal
90 Days
Mean Streugfla (llfPa)
D<J!Sjty
(kgJm'J
Age at 1'~t
180 Days
COOJ))t C:SSifC Strouglh (lltPa)
Mean Streoglh (MPa)
Density
(kglw'J
360 Days
Compressive SttfJlglh (MPa)
Mt'JUI Strougth (llfPa)
El 30.2 54.8 63.3 66.8 23~ 2340 2330
70.0 10.S 71.0
70-8 1340 2350 2340
71.0 71.0 72.5
?l.S
66.2 E2 - 42.2 54. 1 59.8 2350 2330 2340
62.5 63.S 66.5
61.2 2350 2340 2320
66.0 65.5 67.0
E3 - 40.8 54.1 60.2 2350 2350 2340
67.0 61.5 64.0
64.2 2340 2340 2340
66.5 66.0 65.5
66.0
£4
ES
--
-
35.3
46.8
39.5
48.1
42.2
54.0
2330 2330 2340
2330 2340 2330
44.0 43.5 41.0
S4.0 51.0 51.5
42.8
56.2
2330 2340 23~
2340 2330 2330
41.5 48.5 45.5
57.0 60.0 56.0
47.2
57.7
I!I
E6 - 47.5 51.5 56.0 2340 2340 2330
60.5 60.0 56.0
58.8 2330 2310 2340
62.5 62.0 58.5
61.0
E7 - 61.0 62.8 63.0 2350 2350 2350
69.5 66.5 69.5
68.5 2350 2340 2350
73.5 70.0 68.5
70.7
£8 -- 56.1 51.8 59.1 2340 2340 23~
59.5 60.0 61.5
60.3 2360 2340 2340
60.5 61.0 61.0
60.8
I Notes : n.e dclails of the densities and individual cube lilrengchs of concede mix MIO betw«n the age~ of 7 days and 90 days under the various curing enviroMltnls ace given in the interim report (Leung & T,., 1993).
I
~
- 27 -
Table 16 -Mean Compressive Strengths for Mixes Ml to MIO
Curing Environment
Age
(days)
Grade 30 Concrete Grade 45 Concrete
Ml M3 MS M7 M9 M2 M4 M6 M8 MlO
7 26.0 24.5 22.0 22.3 22.5 39.5 39.7 32.0 32.5 30.2 28 39.0 39.8 38.7 41.2 42.9 52.3 58.0 51.5 55.0 54.8
El 56 42.8 46.7 47.7 51.2 49.5 60.5 67.2 60.2 63.5 63.3 90 42.8 49.5 49.2 52.0 54.3 58.2 68.0 63.2 69.8 66.8
180 40.7 49.8 49.2 56.3 59.8 55.2 72.2 65.3 73.7 70.8 360 38.0 49.0 52.7 59.0 61.7 54.5 71.3 67.8 75.3 71.5
28 37.0 35.8 32.5 31.8 31.0 50.8 54.7 45.8 43 .5 42.2 56 43.0 43.7 40.7 45.0 44.3 57.2 62.5 57.0 59.2 54.1
E2 90 41.2 46.7 44.3 46.5 50.3 55.5 68.2 60.5 64.0 59.8 180 41.5 47.3 45.0 52.0 56.7 53.3 69.2 62.3 67.2 64.2 360 39.5 46.5 44.2 52.8 55.5 51.0 69.3 67.7 71.2 66.2
28 37.5 36.7 32.8 31.3 29.3 52.0 53.7 47.3 44.3 40.8 56 42.0 43.8 40.7 46.2 40.7 57.8 62.2 58.3 58.2 54.7
E3 90 43.5 45.8 44.2 47.5 47.2 57.7 67.3 62.3 65.2 60.2 180 40.0 47.3 45.5 51.0 51.2 53.8 67.5 63.5 68.7 64.2 360 39.7 46.8 45.8 52.0 50.7 53.3 67.2 62.2 70.5 66.0
28 28.7 29.5 28.0 27.0 30.2 39.2 45.3 39.8 35.0 35.3 56 30.2 32.8 29.7 32.8 33.3 43.3 48.2 39.0 38.3 39.5
E4 90 28.5 33.2 28.5 30.8 35.7 39.8 49.5 43.3 41.5 42.2 180 28.7 32.8 29.5 33.2 36.2 41.0 50.8 46.0 41.7 42.8 360 29.8 35.7 33.7 34.8 36.0 41.7 50.5 45.5 42.7 47.2
28 33.5 35.5 31.2 33.2 35.5 50.2 54.5 43.3 45.3 46.8 56 35.5 39.2 34.5 38.2 38.7 50.2 56.5 46.7 51.5 48.7
E5 90 35.3 39.0 36.0 39.5 44.2 50.3 60.0 50.2 54.5 54.0 180 33.7 41.3 37.8 42.7 44.7 48.3 61.7 52.2 57.3 56.2 360 32.8 42.3 39.7 43.7 43.7 47.0 62.8 51.0 59.0 57.7
28 36.0 39.2 33.5 36.0 37.0 53.2 55.5 45.7 48.5 47.5 56 38.0 41.5 36.5 41.7 40.5 54.2 58.7 47.5 54.8 51.5
E6 90 38.0 43.8 40.3 43.2 44.7 54.8 60.8 50.8 58.2 56.0 180 35.8 44.2 40.3 47.5 44.0 52.7 63.7 53.3 61.5 58.8 360 32.7 45.3 40.8 47.2 45.0 49.8 62.5 53.5 63.3 61.0
28 31.5 46.8 43.5 50.0 51.5 47.5 63.0 56.3 62.5 61.0 56 42.3 48.2 46.2 54.3 51.7 53.0 65.7 61.5 65.3 62.8
E7 90 42.0 51.3 47.8 53.8 54.5 53.7 67.8 62.8 67.2 63.0 180 40.7 52.8 48.5 56.8 60.3 52.0 72.5 65.8 69.7 68.5 360 40.7 53.7 51.5 56.5 60.3 50.3 73.7 68.5 73.5 70.7
28 33.0 38.8 41.2 41.5 48.2 41.3 57.3 55.5 56.0 56.7 E8 56 35.8 41.5 42.3 43.2 47.7 45.5 58.8 58.0 56.7 57.8
90 34.5 42.8 43 .0 43.3 49.5 43.3 60.5 58.3 57.5 59.7 180 34.2 44.8 45.0 46.0 49.3 43.2 64.0 59.8 58.7 60.3 360 33.0 46.2 45.8 46.2 50.8 43.3 66.5 60.8 62.7 60.8
Notes: (I) The details of the concrete mixes Ml to MIO and !he curing envirorunents are given in Tables 4 and 5 respectively.
(2) The mean compressive streng!hs in this Table are taken from Tables 6 to 15 of this Report and are in units of MPa.

- 28-
Table 17 - Nonnalisation Factors for MUes Ml to MlO
Concrete Mix Grade 30 Concrete Grade 45 Concrete
Ml M3 MS M7 M9 M2 M4 M6 MS MlO
Nonnalisation Factor 0.974 0.9ll 0.982 0.922 0.886 1.013 0.914 1.029 0.964 0.967
Note: (I) Tbe normalisation factors were calcula!Cd using equation (1).
Table 18 - Nonnalised Mean Compressive Strengths for Mixes Ml to MlO
Curing Environment
Age
(days)
Grade 30 Concrde Grade 45 Concrete
M1 M3 MS M7 M9 M2 :-.14 M6 M8 MlO
7 25.3 23.4 21.6 20.6 19.9 40.0 36.3 32.9 31.3 29.2 28 38.0 38.0 38.0 38.0 38.0 53.0 53.0 53.0 53.0 53.0
El 56 41.7 44.6 46.8 47.2 43.8 61.3 61.4 62.0 61.2 61.2 90 41.7 47.3 48.3 48.0 48.1 58.9 62.1 65.0 67.3 64.6 180 39.7 47.5 48.3 51.9 53.0 55.9 66.0 67.2 71.0 68.5 360 37.0 46.8 51.7 54.4 54.7 55.2 65.2 69.8 72.6 69.2
28 36.1 34.2 3 1:9 29.3 27.5 51.5 50.0 47.1 41.9 40.8 82 56 41.9 41.7 40.0 41.5 39.2 58.0 57.1 58.7 57.0 52.3
90 40.1 44.6 43.5 42.9 44.6 56.2 62.3 62.3 61.7 57.8 180 40.4 45.2 44.2 48.0 50.2 54.0 63.2 64.1 64.8 62.1 360 38.5 44.4 43.4 48.7 49.2 51.7 63.3 69.7 68.6 64.0
28 36.5 35.0 32.2 28.9 26.0 52.7 49.1 48.7 42.7 39.5 E3 56 40.9 41.8 40.0 42.6 36.1 58.6 56.8 60.0 56.1 52.9
90 42.4 43.7 43.4 43.8 41.8 58.5 61.5 64.1 62.8 58.2 180 39.0 45.2 44.7 47.0 45.4 54.5 61.7 65.3 66.2 62.1 360 38.7 44.7 45.0 48.0 44.9 54.0 61.4 64.0 67.9 63,8
28 28.0 28.2 21.5 24.9 26.8 39.7 41.4 41.0 33.7 34.1 84 56 29.4 31.3 29.2 30.3 29.5 43.9 44.0 40.1 36.9 38.2
90 27.8 31.7 28.0 28.4 31.6 40.3 45.2 44.6 40.0 40.8 180 28.0 31.3 29.0 30.6 32.1 41.5 46.4 47.3 40.2 41.4 360 29.0 34.1 33.1 32.1 3 1.9 42.3 46.1 46.8 41.1 45.6
28 32.6 33.9 30.6 30.6 31.4 50.9 49.8 44.6 43.7 45.3 85 56 34.6 37.4 33.9 35.2 34.3 50.9 51.6 48.1 49.6 47.1
90 34.4 37.2 35.3 36.4 39.1 51.0 54.8 51.7 52.5 52.2 180 32.8 39.4 37.1 39.4 39.6 48.9 56.4 53.7 55.2 54.4 360 32.0 40.4 39.0 40.3 38.7 47.6 57.4 52.5 56.9 55.8
28 35.1 37.4 32.9 33.2 32.8 53.9 50.7 47.0 46.7 45.9 E6 56 37.0 39.6 35.8 38.5 35.9 54.9 53.6 48.9 52.8 49.8
90 37.0 41.8 39.6 39.8 39.6 55.5 55.6 52.3 56.1 54.2 180 34.9 42.2 39.6 43.8 39.0 53.4 58.2 54.9 59.3 56.9 360 31.9 43.3 40.1 43.5 39.9 50.5 57. I 55.1 61.0 59.0
28 36.5 44.7 42.7 46.1 45.6 48.1 57.6 57.9 60.2 59.0 87 56 41.2 46.0 45.4 50.1 45.8 53.7 60.0 63.3 62.9 60.7
90 40.9 49.0 46.9 49.6 48.3 54.4 62.0 64.6 64.8 60.9 180 39.7 50.4 47.6 52.4 53.4 52.7 66.3 67.7 67.2 66.3 360 39.7 51.3 50.6 52.1 53.4 51.0 67.3 70.5 70.8 68.4
28 32.2 37.0 40.5 38.3 42.7 41.9 52.4 57. 1 54.0 54.8 E8 56 34.9 39.6 41.5 39.8 42.3 46.1 53.7 59.7 54.6 55.9
90 33.6 40.9 42.2 39.9 43.8 43.9 55.3 60.0 55.4 57.7 180 33.3 42.8 421.2 42.4 43.7 43.8 58.5 61.5 56.6 58.3 360 32.2 44.1 45.0 42.6 45.0 43.9 60.8 62.6 60.4 58.8
Notes: (1) Tbe notes of Table 16 also apply to this Table. (2) The nonnalised mean compressive strengths were calculated in accordance with Section 4.1.
- 29-
Table 19 - Relative Strength Percentages for Mixes Ml to MIO
Relative Strength Percentage (%)
Curing Age Environment
Grade 30 Concrete Grade 45 Concrete
Ml M3 M5 M7 M9 M2 M4 M6 M8 M10 (days)
1 67 62 51 54 52 76 68 62 59 55 28 100 100 100 100 100 100 100 100 100 100
El 56 110 117 123 124 115 116 116 117 115 116 90 110 124 127 126 127 Ill 117 123 127 122
180 104 125 127 137 139 106 124 127 134 129 360 97 123 136 143 144 104 123 132 137 130
28 95 90 84 77 72 97 94 89 79 77 56 110 110 105 109 103 109 108 Ill 108 99
E2 90 106 117 114 113 117 106 118 117 116 109 180 106 119 116 126 132 102 119 121 122 117 360 101 117 114 128 129 98 119 131 129 121
28 96 92 85 16 68 99 93 92 81 74 56 108 110 105 112 95 Ill 107 113 106 100
E3 90 112 115 114 liS 110 110 116 121 119 110 180 103 119 118 124 ll9 103 116 123 125 117 360 102 118 118 126 liS 102 116 121 128 120
28 74 74 72 66 70 15 78 77 64 64 56 77 82 77 80 78 83 83 76 70 72
E4 90 73 83 74 75 83 76 85 84 75 77 180 74 82 76 81 84 78 88 89 76 78 360 76 90 87 84 84 80 87 88 78 86
28 86 89 81 81 83 96 94 84 82 85 56 91 98 89 93 90 96 91 91 94 89
ES 90 91 98 93 96 103 96 103 97 99 99 180 86 104 98 104 104 92 106 101 104 103 360 84 106 103. 106 102 90 108 99 107 105
28 92 98 87 87 86 102 96 89 88 87 56 97 104 94 101 94 104 101 92 100 94
E6 90 97 110 104 105 104 105 105 99 106 102 180 92 Ill 104 115 103 101 liO 103 112 107 360 84 114 105 l iS !OS 95 108 104 115 Ill
28 96 118 112 121 120 91 109 109 114 Ill 56 108 121 119 132 121 101 U3 119 119 115
E7 90 108 129 124 131 127 103 117 122 122 l iS 180 104 133 125 138 141 99 125 128 127 125 360 104 !35 133 137 141 96 127 133 134 129
28 85 97 106 101 112 19 99 108 102 103 56 92 104 109 105 Ill 87 101 113 !03 !05
E8 90 88 108 Ill 105 115 83 104 113 105 109 180 88 113 116 112 115 83 110 116 107 110 360 85 116 118 112 118 83 liS 118 114 Ill
NOleS: (I) The details of the concrete mixes Ml to MlO and tbc curing environments are given in Tables 4 and 5 respectively.
(2) The rel>tive otrengtll perremages were CAlculated using equation (2).
- 30-
LIST OF FIGURES
Figure Page No. No.
Weekly Environmental Records of the Air Curing Room 31
2 Strength Development of Grade 30 OPC and PF A Concretes 32 Cured under Environment E I
~
J Strength Development of Grade 45 OPC and PF A Concretes 33 Cured under Environment El
4 Strength Development of OPC and PFA Concretes Cured 34 under Environment E2
5 Strength Development of OPC and PFA Concretes Cured 35 under Environment EJ
6 Influence of High Initial Curing Temperature 36 (Environment E7) on the Strength Development of OPC and PF A Concretes
7 Influence of High Initial Curing Temperature 37 (Environment E8) on the Strength Development of OPC and PF A Concretes
8 Influence of Duration of Curing on the Strength Development 38 of Grade 30 OPC and PFA Concretes
9 Influence of Duration of Curing on the Strength Development 39 of Grade 45 OPC and PFA Concretes

~6 >~s
----~~ .... 7 J1o6 un(
•
,., J .....
)
fll . ( • • I I
,lt,,J
£6 ')QQ " E i=
I 0
I I I , I o '( :'1'1 • • -~ !J·
' ' • . l I , \~ ...
-...:.. ',
t6 •~s
/' ' I -"'
(6 un(
> \
\ / \ • \
0
'',
0
(r.) ki!P!UOH "Afl"l"l:l
u""W .<r>l"" M
E 0
a: 0
c t)l)
·;:
u :l
... <(
• ... Ql
....
., .. 0
... 0 1.1
a: ... .. Ql
c Ql
E c 0 ...
·:;:: c w >-::i Ql Ql
~
... Ql
:l t)l)
u:::
- 31 -

ISO
140
130
~ 120 ~
" H c 110
" ~ " Q.
.<:: t'o
100
c ~ Ill
90
" > ·:; 80 ..
;; a::
70
60
so 7 l8 S6 90 180 360
Age (days)
Legend: o OPC • 25% PFA • 35% PFA • 45% PFA • 55% PFA
,.., N
Figure 2 - Strength Development of Grade 30 OPC and PFA Concretes Cured under Environment E I
ISO
140
130
~ ~ .. H 120
c: .. ~ 110 .. a. .l! r. c:
b Ill
100
.. 90 ·~
I /"'~ I .. Gi a: 80
70
60
50
7 28 S6 90 ISO 360
Age (days)
Legend: o OPC • 25% PFA • 35% PFA • 45% PFA • 55% PFA
I w \r)
Figure 3 - Strength Development of Grade 45 OPC and PFA Concretes Cured under Environment E I

140
130
~ ~ ., 120
H c:
110 " u .. " A. J:!
t:. c:
100
" b 90 Ill
" > ·.o 80 .. 'ii a:
70
60 28
Legend:
Note:
(a) Grade 30 (b) Grade 45
140
130
~ ...... &'.
120
tl c:
~ 110
.. A.
t 100
c:
t 90 Ill ., > ·o .. 80
'ii a: 70
60 90 180 360 28 56 90 180
Age (days) Age (days)
o OPC • 25% PFA • 35% PFA • 45% PFA • 55% PFA
Cubes in environment E2 were water cured at i0°C for 3 days, 20°C for 24 days, then followed by air curing until testing.
360
Figure 4 • Strength Development of OPC and PFA Concretes Cured under Environment El
"'' ~
(a) Grade 30 (b) Grade 45 •
140 140
130 130
~ g ~ .. 120 .. 120 .. H l1 r::
110 r::
110 " .,
u u .. .. .. .. .... .... t 100 t 100
r:: r::
" ~ 90 .. 90 .. Ill Ill .. >
· '.a .. 80 " ·~ 80.1( / ... I Qj Qj a:: a::
70 70
60 60 28 $6 90 180 3«) 28 S6 90 180 360
Age (days) Age (days)
Legend: o OPC • 25% PFA • 35% PFA • 45% PFA + 55% PFA
Note: Cubes in environment 83 were water cured at 20°C for 27 days, then followed by air curing until testing.
<.;.>
'-"
Figure 5 - Strength Development of OPC and PFA Concretes Cured under Environment El
140
130
~
~ ~ 120 Cl
E c 8
110
~
" a. .s:. t:.
100
c Cl ~ ..
Ill
90
" > 'D .. 80
"ii a: 70
60 28
Legend:
Note:
(a) Grade 30 (b) Grade 45
140
130
g " .. J!
120
c .. ~
110
" a.
t c
100
~ 90
Ill .. ·~ 80 .. 'ii a: 70
60 S6 90 180 360 28 56 90 180
Age (days) Age (days)
o OPC A 25% PFA • 35% PFA • 45%PFA + 55% PFA
Cubes in environment E7 were water cured at 50°C for 7 days, 27°C for 20 days, then followed by air curing until testing.
360
Figure 6 - Influence of High Initial Curing Temperature (Environment E7) on the Strength Development of OPC and PFA Concretes
' '-" o,
140
g IJO
.. ~ 120
" " ~ 110 " ... t "
100 .. b Ill 90 .. ·A .. "ii 80
"' 70
60 28
Legend:
Note:
(a) Grade 30 (b) Grade 45
140
~
~ ~
IJO
.. ~ 120
" .. ~ .. ... 110
.c to " ~
100
Ill 90
" > "D o-.. "ii 80 a:
70
60 56 90 180 360 28 56 90 180
Age (days) Age (days)
o OPC • 25% PFA • 35% PFA • 45% PFA + 55% PFA
Cubes in environment E8 were water cured at 75•c for 7 days, 21•c for 20 days, then followed by air curing until testing.
,.., _,
Figure 7- Influence of High Initial Curing Temperature (Environment ES) on the Strength Development of OPC and PFA Concretes


~j
I I
ISO (a) 28 days
I 140
g 130
., H 120 " .. ~ .,
A. 110 .., t:. " ., L 100 ... Ill ., ,. ·.a .. Ci
90
a:
80
70
60 0 l 7
Legend: o OPC • 25% PFA
I (b) 180 day• I
17 0 l 7 17 0
Duration of Wate r Curing (days)
• 35% PFA • '15% PFA
(c) 360 days
3 7
• 55%PFA
17
~· -.
Figure 9 • Influence of Duration of Curing on the Strength Development of Grade 45 OPC and PFA Conct