Embed Size (px)
Citation preview

U N I T E D N AT I O N S C O N F E R E N C E O N T R A D E A N D D E V E L O P M E N T
N°6
COMMODITIES AT A GLANCESpecial issue on gold
Phot
o cr
edit:
Fot
olia
© R
oman
Bod
narc
huk
Layout and Printing at United Nations, Geneva – 1606266 (E) – April 2016 – 1,033 – UNCTAD/SUC/2015/3

U N I T E D N AT I O N S C O N F E R E N C E O N T R A D E A N D D E V E L O P M E N T
N°6
COMMODITIES AT A GLANCESpecial issue on gold
New York and Geneva 2016

iii
The series Commodities at a Glance aims to collect, present and disseminate accurate and relevant statistical information linked to international primary commodity markets in a clear, concise and reader-friendly format.
This edition of Commodities at a Glance has been prepared by Alexandra Laurent, statistical assistant for the Special Unit on Commodities (SUC) of UNCTAD, under the overall guidance of Samuel Gayi, Head of SUC, and the direct supervision of Janvier Nkurunziza, Chief of the Commodity Research and Analysis Section of SUC.
The cover of this publication was created by Nadège Hadjemian, UNCTAD; desktop publishing and graphics were performed by the prepress subunit with the invaluable collaboration of Nathalie Loriot of the UNOG Printing Section.
For further information about this publication, please contact the Special Unit on Commodities, UNCTAD, Palais des Nations, CH-1211 Geneva 10, Switzerland, tel. +41 22 917 5676, e-mail: [email protected].
EXPLANATORY NOTE
All data sources are indicated under each table and figure.
Reference to dollars or use of the symbol, $, signifies United States dollars, unless otherwise specified.
The term “tons” refers to metric tons.
Unless otherwise stated, all prices in this report are in nominal terms.
DISCLAIMER
The opinions expressed in this publication are those of the author and are not to be taken as the official views of the UNCTAD secretariat or its member States.
The designations employed and the presentation of the material do not imply the expression of any opinion on the part of the United Nations concerning the legal status of any country, territory, city or area, or of authorities, or concerning the delimitation of its frontiers or boundaries.
Material in this publication may be freely quoted or reprinted, but acknowledgment is requested, together with a copy of the publication containing the quotation or reprint, to be sent to the UNCTAD secretariat.
UNCTAD/SUC/2015/3

iv COMMODITIES AT A GLANCE - Special issue on gold
NOTES
Gold can be measured in troy ounces or in kilograms. According to the World Gold Council:
1 gram (0.032151 troy ounces) ➞ 1 troy ounce (31.103 grams)1 kilogram (32.1507 troy ounces) ➞ 1 troy ounce (0.0311 kilograms)1 ton (32’150.75 troy ounces) ➞ 1 troy ounce (0.000031 tons)
GLOSSARY OF TERMS
Above-ground reserves: This source of gold reserves represents an additional category to the traditionally agreed concept of reserves, defined as all quantities of minerals economically extractable from the ground. The term “above-ground reserves”, used mainly in the gold industry, defines all quantities of gold that have already been mined in human history. They include all stocks of jewellery, gold held by central banks and private investors, as well as all gold fabricated products.
All-in sustaining costs (AISC): is a voluntary non-GAAP [Generally Accepted Accounting Principles] measure proposed by the World Gold Council to gold mining companies in 2013. This indicator covers cash costs, plus the costs incurred by the sustainable production of mines during their complete life cycle − from exploration to closure. Most of the largest gold companies now publish this indicator in their annual reports. (See World Gold Council, Guidance note on Non-GAAP metrics – all-in sustaining costs and all-in costs. 27 June 2013, at: http://www.gold.org/research/guidance-note-non-gaap-metrics-%E2%80%93-all-sustaining-costs-and-all-costs).
Fineness: Defines the gold content of an alloy or impure gold. It is expressed in parts per thousand (ppm). For example, when a material contains 90 per cent gold and 10 per cent of another metal, it is referred to as “900 fine”.
Karatage: In jewellery, when gold is alloyed with other metals, the weight of gold in the product is measured in karats (k). Pure gold equals 24 karats.
Primary production: Output from large mines, regulated gold mines (excluding informal and artisanal production).
Secondary production: Mainly refers to production from recycling.

v
ABBREVIATIONS
AISC all-in sustaining costs
ASGM artisanal small-scale gold mining
CBGA Central Bank Gold Agreement
ETF exchange-traded fund
GFMS Thomson Reuters GFMS Surveys
ICME International Council on Metals and Environment
IMF International Monetary Fund
INR Indian rupee
K karat
K kelvin
kPa kilopascal
m3 cubic meter
mg microgram
mm micrometre
n.a not available
oz ounce(s)
pgm platinum group metals
ppm parts per million
RMB Chinese renminbi
UAH Ukrainian hryvnia
UNEP United Nations Environment Programme
USGS United States Geological Survey
WHO World Health Organization
ABBREVIATIONS

vi COMMODITIES AT A GLANCE - Special issue on gold
CONTENTS
EXPLANATORY NOTE ............................................................................................. iii
DISCLAIMER ......................................................................................................... iii
NOTES ................................................................................................................. iv
GLOSSARY OF TERMS ........................................................................................... iv
ABBREVIATIONS .................................................................................................... v
CHAPTER 1: INTRODUCTION: From the gold standard to floating currencies ............... 1
1. The characteristics of gold .................................................................................................... 3
2. The role of gold in economies ............................................................................................... 3
3. Recent history of gold as a currency ..................................................................................... 4a. The Gold Standard system (1870−1914) .............................................................................. 5
b. The Bretton Woods system (1944−1971) ............................................................................. 5
c. The end of the Bretton Woods system and the start of a free-floating exchange rate system (1971 to the present) ......................................................................................... 6
CHAPTER 2: USES ................................................................................................. 7
1. Jewellery ................................................................................................................................. 9
2. Industrial uses ........................................................................................................................ 10a. Electronics .......................................................................................................................... 10
b. Dentistry .............................................................................................................................. 11
3. Gold as an investment vehicle ................................................................................................ 11a. Physical bars and coins ....................................................................................................... 11
b. ETFs and similar products .................................................................................................... 12
4. National gold reserves and purchases of gold by central banks ......................................... 13a. Purchases made by central banks of emerging market economies ...................................... 14
b. Reduction of gold sales by signatories to the Central Bank Gold Agreements ..................... 15
CHAPTER 3: PRODUCTION ..................................................................................... 17
1. Technical aspects of gold production ................................................................................... 19a. Primary gold mining ............................................................................................................ 19
b. The metallurgy of gold .......................................................................................................... 20
2. Statistics relating to gold production .................................................................................... 21a. Global gold production ........................................................................................................ 21
b. Overview of production in the leading gold-producing countries ........................................... 23
CHAPTER 4: PRICES .............................................................................................. 31
1. Evolution of gold prices .......................................................................................................... 33a. Evolution of gold prices during the 1970s ............................................................................. 33
b. Evolution of gold prices between 1980 and 2000 ................................................................. 33
c. Evolution of gold prices since the beginning of the 2000s .................................................... 34
2. Gold prices and impacts on producing countries ................................................................. 35
viiCONTENTS
CHAPTER 5: CONCLUSIONS ................................................................................... 39
REFERENCES ........................................................................................................ 43
APPENDIX 1: THE METALLURGY OF GOLD ............................................................... 49
APPENDIX 2: THE STATE OF GOLD MINES AROUND THE WORLD, 2015 .................... 55
FIGURES
CHAPTER 1: INTRODUCTION: From the gold standard to floating currencies
Figure 1. Share of country gold reserves in total gold reserves, February 2015 (per cent) ..............................4
Figure 2. Overview of the recent history of gold .............................................................................................5
CHAPTER 2: USES
Figure 3. Historical evolution of world demand for gold, and distribution of the demand by sector, 2000−2014 (tons) ...........................................................................................................................9
Figure 4. Demand for gold by jewellery sector: geographical distribution, 2014 (per cent) ...........................10
Figure 5. Demand for gold by electronics sector: geographical distribution, 2014 (per cent) ........................11
Figure 6. Investments in gold bars, by weight, in China, Europe and India, 2005−2014 (tons) .....................12
Figure 7. Net ETF purchases (tons) and gold prices (dollars per troy ounce), 2005-2014 .............................13
Figure 8. Central banks of countries with the largest gold reserves, as a percentage of total world gold reserves held by central banks, 1980 and 2014 (per cent) ....................................................14
Figure 9. Net purchases of gold by central banks, 1980−2014 (tons) ..........................................................14
Figure 10. Gold sales under successive Central Bank Gold Agreements, 1999−2000 to 2013−2014 (tons) ..16
CHAPTER 3: PRODUCTION
Figure 11. The metallurgy of gold ..................................................................................................................21
Figure 12. World primary gold production, 1900−2014 (tons) ........................................................................22
Figure 13. Shares of leading gold mine producing countries in total world mine production, 1980 and 2014 (per cent) ...................................................................................................................................... 22
Figure 14a. Ten leading gold companies in terms of gold production, 2014 ...................................................23
Figure 14b. Ten leading gold companies in terms of market capitalization, 5 October 2015 (billions of dollars) ....23
Figure 15. Large-scale gold mining versus artisanal small-scale gold mining ................................................26
Figure 16. Distribution of world gold supply between mine production and recycling, as a percentage of world gold supply (per cent) compared to international gold prices (dollars per troy ounce), 2004−2014 .................................................................................................................................28
CHAPTER 4: PRICES
Figure 17. Historical evolution of nominal and real gold prices, 1970−2014 (dollars per troy ounce, base year: 2010) ..........................................................................................................................33
Figure 18. How quantitative easing affects gold prices ..................................................................................34
Figure 19a. Average monthly change in the price of gold, 1970-2014 (per cent) .............................................35
Figure 19b. Seasonality of gold prices, 2000-2014 (monthly percentage change) ...........................................35
viii COMMODITIES AT A GLANCE - Special issue on gold
TABLES
Table 1. Concentration of gold and other selected industrial and precious metals in the earth’s crust (ppm) ......3
Table 2. Trends in real GDP growth and gold reserves in emerging market economies, 2000−2014 (per cent and tons) .......................................................................................................................15
Table 3. Gold ore types ..............................................................................................................................19
Table 4. Five leading gold-producing mines in Australia, 2014 (troy ounces) ...............................................24
Table 5. Five leading gold-producing mines in the Russian Federation, 2014 (troy ounces) ........................24
Table 6. Five leading gold-producing mines in the United States, 2014 (troy ounces) .................................25
Table 7. Five leading gold-producing mines in Canada, 2014 (troy ounces) ................................................25
Table 8. Five leading gold-producing mines in South Africa, 2014 (troy ounces) .........................................25
Table 9. Five leading gold-producing mines in Peru, 2014 (troy ounces) .....................................................26
Table 10. Economic importance of gold in selected countries ......................................................................27
Table 11. Mineral tax on gold mine production in producing countries, as of January 2012 ..........................36

CHAPTER 4 - PRICES 1
CHAPTER 1:INTRODUCTION
From the gold standard tofloating currencies


CHAPTER 1 - INTRODUCTION From the gold standard to floating currencies 3
1. THE CHARACTERISTICS OF GOLD
Gold is a precious yellow, bright and highly valued metal. It has been known, appreciated and used for thousands of years. The first documented goldmine in the world, estimated to be 4,000 years old, was discovered in Tbilisi (Georgia) in 2005.
The origins of gold are considered to be “cosmic”. In 2013, the Harvard-Smithsonian Center for Astrophysics noted that observations have found evidence that gold was created in a short gamma-ray burst resulting from “the collision of two neutron stars − the dead cores of stars that previously exploded as supernovae”.1
Gold is among the rarest elements in the earth’s crust (table 1), where it is mainly present in its native form (about 80 per cent of the total metal worldwide); it can also be associated with other elements, such as silver − resulting mainly in the elements, electrum and tellurium − but also with copper or iron, among others.
Gold is the most malleable and ductile transition metal, meaning that it can be shaped and bent easily. It is considered a heavy metal and one of the densest elements in the periodic table. Like silver, iridium, osmium, palladium, platinum, rhodium and ruthenium, it is a noble metal, which means that it presents an exceptional resistance to oxidation. However, gold can be dissolved in aqua regia.2 Gold is also a good conductor of heat and electricity, and a strong reflector of infrared radiation. Based on these characteristics, it is used as input in many industries, such as jewellery, dentistry or electronics, and for electrical applications. However, its softness and high prices ($1,428 per troy ounce, on average, between 2010 and 2014) tend to limit its use to sectors where no efficient substitutes have been developed, or encourage its mixture with
1 Harvard-Smithsonian Center for Astrophysics, Earth’s gold came from colliding dead stars, 17 July 2013 (see: https://www.cfa.harvard.edu/news/2013-19).
2 Described by Oxford Dictionaries online as “A mixture of concentrated nitric and hydrochloric acids. It is a highly corrosive liquid able to attack gold and other resistant substances”.
Table 1. Concentration of gold and other selected industrial and precious metals in the earth’s crust (ppm)
Atomic number Name Symbol
Crust abundance
(ppm)Group
13 Aluminium Al 79 000 Industrial metal
26 Iron Fe 55 350 Industrial metal
12 Magnesium Mg 26 000 Industrial metal
22 Titanum Ti 6 302 Industrial metal
25 Manganese Mn 1 156 Industrial metal
24 Chromium Cr 131 Industrial metal
28 Nickel Ni 90 Industrial metal
30 Zinc Zn 76 Industrial metal
29 Copper Cu 59 Industrial metal
82 Lead Pb 13 Industrial metal
50 Tin Sn 2.27 Industrial metal
74 Tungsten W 1.29 Industrial metal
42 Molybdenum Mo 1.27 Industrial metal
47 Silver 47 0.0750 Precious metal
46 Palladium Pd 0.0082 Precious metal
78 Platinum Pt 0.0036 Precious metal
79 Gold Au 0.0032 Precious metal
76 Osmium Os 0.0018 Precious metal
44 Ruthenium Ru 0.0010 Precious metal
45 Rhodium Rh 0.0010 Precious metal
77 Iridium Ir 0.0008 Precious metal
Source: UNCTAD secretariat.
Symbol: Au (from Aurum)Atomic number: 79Density: 19.32 g/cm3Melting point: 1,064°CAtomic mass: 196.97 atomic mass units (amu)
other metals (e.g. silver, copper, platinum group metals). Gold is also used for monetary purposes (e.g. coinage), and as a safe-haven asset and investment vehicle during periods of economic uncertainty.
2. THE ROLE OF GOLD IN ECONOMIES
Gold plays a vital, multidimensional role in both local and international economies. In gold-producing developing countries, it may account for a large share of their merchandise export revenues.3 For instance, it accounted for more than 40 per cent of the export revenues of Mali, Burkina Faso and Guyana between 2009 and 2013, and for 56 per cent in Suriname in 2013. Gold is also a source of substantial government revenues through taxes
3 Gold. Standard International Trade Classification, Revision 3. 971, gold, non-monetary (excluding gold ores and concentrates).

4 COMMODITIES AT A GLANCE - Special issue on gold
South Africa and the Russian Federation (figure 1). Together, these three countries accounted for 38 per cent of world reserves in 2014. Other gold reserves are widely spread around the world, with no country having reserves exceeding 18 per cent of the world total in 2014 (compared with 30 per cent in the case of copper, for instance).
Oceans could be a good potential reserve for gold. Indeed, oceans are estimated to contain up to 15,000 tons of gold, according to the World Gold Council, which would represent more than a quarter of total world reserves, as estimated by the USGS in 2014. However, extraction of gold from the oceans is currently not considered economically viable.
In addition to gold found in precious metal deposits, it is also commonly recovered during the smelting or refining processes of base metals. It is generally accepted that between 5 per cent and 15 per cent of total gold worldwide is extracted as a by-product.
3. RECENT HISTORY OF GOLD AS A CURRENCY
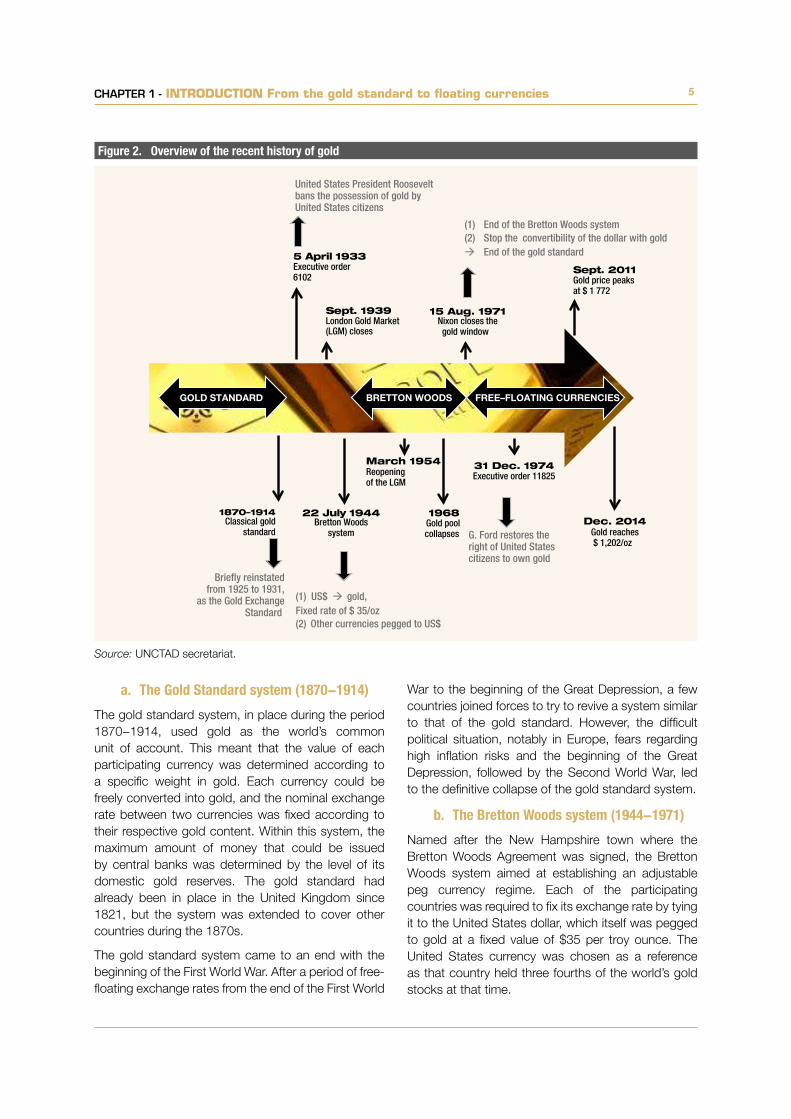
Up to the end of the nineteenth century, the history of gold may be divided into three main periods (figure 2): (i) The gold standard system from 1870 to 1914, (ii) the Bretton Woods system, between the end of the Second World War and 1971; and (iii) the current global free-floating exchange rate system which started in 1971.
Figure 1. Share of country gold reserves in total gold reserves, February 2015 (per cent)
United States: 5
Australia: 18
Brazil: 4
Chile: 7
Indonesia: 5
Russian Federation: 9South Africa: 11
Rest ofthe world:40
and royalties on mining and processing activities. Moreover, while activities associated with gold are generally capital-intensive, they nevertheless represent an important source of local employment, with about 50,000 people directly or indirectly employed by the gold sector in Australia4 and around 300,000 people in South Africa, for instance. In all, according to World Gold Council estimates, about 100 million people rely on gold mining activities for their livelihoods. 5
The United States Geological Survey (USGS) estimates that world gold reserves stood at 54,000 tons in 2014, representing about two decades of production, in terms of current world production.6 From a historical perspective, gold reserves have been located largely in South Africa (24 per cent of world reserves, on average, between 1996 and 2014). However, the country’s share in world gold reserves has been declining sharply over the period, falling from 41 per cent in 1996 to 11 per cent in 2014. Since 2011, Australia has been the world’s leading gold reserves. As on February 2015, the three main gold reserves were located in Australia,
4 Minerals Council of Australia, Australia’s gold industry: employment (see: http://www.minerals.org.au/resources/gold/employment/).
5 See: Gold facts, at: http://www.goldfacts.org/en/. 6 Based on 2012 production data; however, this computation
does not take into account “reserve base” data or other identified and not already identified sources which are (or could) be discovered and mined economically.
Source: UNCTAD secretariat, based on United States Geological Survey, Mineral Commodity Summaries, February 2015.
CHAPTER 1 - INTRODUCTION From the gold standard to floating currencies 5
a. TheGoldStandardsystem(1870−1914)
The gold standard system, in place during the period 1870−1914, used gold as the world’s common unit of account. This meant that the value of each participating currency was determined according to a specific weight in gold. Each currency could be freely converted into gold, and the nominal exchange rate between two currencies was fixed according to their respective gold content. Within this system, the maximum amount of money that could be issued by central banks was determined by the level of its domestic gold reserves. The gold standard had already been in place in the United Kingdom since 1821, but the system was extended to cover other countries during the 1870s.
The gold standard system came to an end with the beginning of the First World War. After a period of free-floating exchange rates from the end of the First World
War to the beginning of the Great Depression, a few countries joined forces to try to revive a system similar to that of the gold standard. However, the difficult political situation, notably in Europe, fears regarding high inflation risks and the beginning of the Great Depression, followed by the Second World War, led to the definitive collapse of the gold standard system.
b. TheBrettonWoodssystem(1944−1971)
Named after the New Hampshire town where the Bretton Woods Agreement was signed, the Bretton Woods system aimed at establishing an adjustable peg currency regime. Each of the participating countries was required to fix its exchange rate by tying it to the United States dollar, which itself was pegged to gold at a fixed value of $35 per troy ounce. The United States currency was chosen as a reference as that country held three fourths of the world’s gold stocks at that time.
Figure 2. Overview of the recent history of gold
GOLD STANDARD BRETTON WOODS FREE–FLOATING CURRENCIES
5 April 1933Executive order6102
Sept. 1939London Gold Market (LGM) closes
15 Aug. 1971Nixon closes thegold window
Sept. 2011Gold price peaksat $ 1 772
Dec. 2014Gold reaches$ 1,202/oz
March 1954Reopeningof the LGM
31 Dec. 1974Executive order 11825
1968Gold poolcollapses
1870–1914Classical gold
standard
22 July 1944Bretton Woods
system
United States President Rooseveltbans the possession of gold byUnited States citizens
(1) End of the Bretton Woods system (2) Stop the convertibility of the dollar with gold End of the gold standard
G. Ford restores theright of United Statescitizens to own gold
(1) US$ gold,Fixed rate of $ 35/oz(2) Other currencies pegged to US$
Briefly reinstatedfrom 1925 to 1931,
as the Gold ExchangeStandard
Source: UNCTAD secretariat.

The system was more flexible than the former gold standard system as the Bretton Woods Agreement allowed a fluctuation of the parity of currencies within a range of more or less 1 per cent around the peg. This flexibility was expected to allow the correction of fundamental disequilibria. Outside this range, stakeholders were required to intervene by buying or selling their currency.
c. The end of the Bretton Woods system and thestartofafree-floatingexchangeratesystem(1971tothepresent)
From the beginning of the 1960s, the US dollar started to be seen as overvalued compared with the value defined in the Bretton Woods Agreement. As a result of the rapid expansion of international trade
and military spending, the volume of US dollars in circulation increased dramatically and finally exceeded the value of gold effectively held by the United States (at the rate of $35 per troy ounce). The Bretton Woods system collapsed in 1971, following the decision of the United States President, Richard Nixon, to suspend the convertibility of the US dollar into gold. Since 1973, most countries have turned to a free-floating exchange rate system, or to the adoption of another country’s currency (e.g. the adoption of the US dollar in Ecuador in 2001),7 or to the creation of a single currency in a monetary union, as in Europe.
7 Central Intelligence Agency, The World Factbook (see: https://www.cia.gov/library/publications/the-world-factbook/geos/ec.html).

CHAPTER 4 - PRICES 7
CHAPTER 2:USES


9CHAPTER 2 - USES 9
The history of gold dates back to at least 5,000 years ago, and demand for it has been expanding continuously in both quantity and types of uses.
In recent times, after a sharp slowdown of world demand from 2000 to 2003 (by 25 per cent), the demand for gold started to rise again between 2004 and 2007. On average, 2,900 tons were traded annually during this latter period. In 2008, as a result of the global financial and economic crisis, demand for gold accelerated, reaching 4,515 tons in 2011 and later peaking at 5,042 tons in 2013. In 2014, demand declined by 17.5 per cent, to 4,159 tons (figure 3).
Demand for gold mainly results from a combination of purchases made for (1) jewellery fabrication, (2) industrial purposes, (3) investments in the form of bars and coins, exchange traded funds (ETFs) or similar products, and, (4) net sales by central banks. The historical background of these various sectors and subsectors that have been the source of global demand for gold since the beginning of the 2000s is discussed below, as well as potential developments in the years to come.
1. JEWELLERY
Since the discovery of gold, it has mainly been used for making jewellery. Traditionally, gold has been highly appreciated for its lustre, resistance to tarnishing and corrosion, and its malleability and ductility, which allow it to be crafted into various shapes. Moreover,
thanks to its scarcity and globally recognized beauty, it is highly valued in the production of objects used in special events, such as wedding rings. But gold is also used for the production of religious items and for the fabrication and restoration of artistic objects (e.g. gold leaves).
For jewellery, gold can be used in its pure form. However, because of its softness, it is often alloyed with other metals, such as silver and copper. Although these alloys are less resistant to tarnishing, they are also less expensive than pure gold. A standard of trade known as “karatage” has been developed to define and harmonize the gold content of alloys. Pure gold of 24 karats (a ratio of 24 out of 24) is the benchmark, whereas an alloy containing 75 per cent of gold is said to be 18 karat gold (18 out of 24). The preferred karatage varies by country. For instance, in France, 18 karats is the reference for jewellery made of gold, while 22 karats and 14 karats are used more in India and the United States respectively.
In some developing countries where a large proportion of the population does not have easy access to the financial and banking system, gold is often used as a means of storing value, preserving wealth and passing down savings to heirs. For this reason, falling gold prices can have a direct negative impact on vulnerable local populations.
Between 2005 and 2014, jewellery remained by far the largest gold-consuming sector, accounting for
Figure3. Historicalevolutionofworlddemandforgold,anddistributionofthedemandbysector,2000−2014(tons)
-1 000
0
1 000
2 000
3 000
4 000
5 000
6 000
2000
2001
2002
2003
2004
2005
2006
2007
2008
2009
2010
2011
2012
2013
2014
Jewellery Technology Investment Central bank net purchases World demand
Source: UNCTAD secretariat based on Thomson Reuters Eikon (accessed 8 April 2015).
10 COMMODITIES AT A GLANCE - Special issue on gold10 COMMODITIES AT A GLANCE - Special issue on gold
56 per cent of total world demand, though this was a significant decline from the year 2000, when it accounted for 84 per cent.
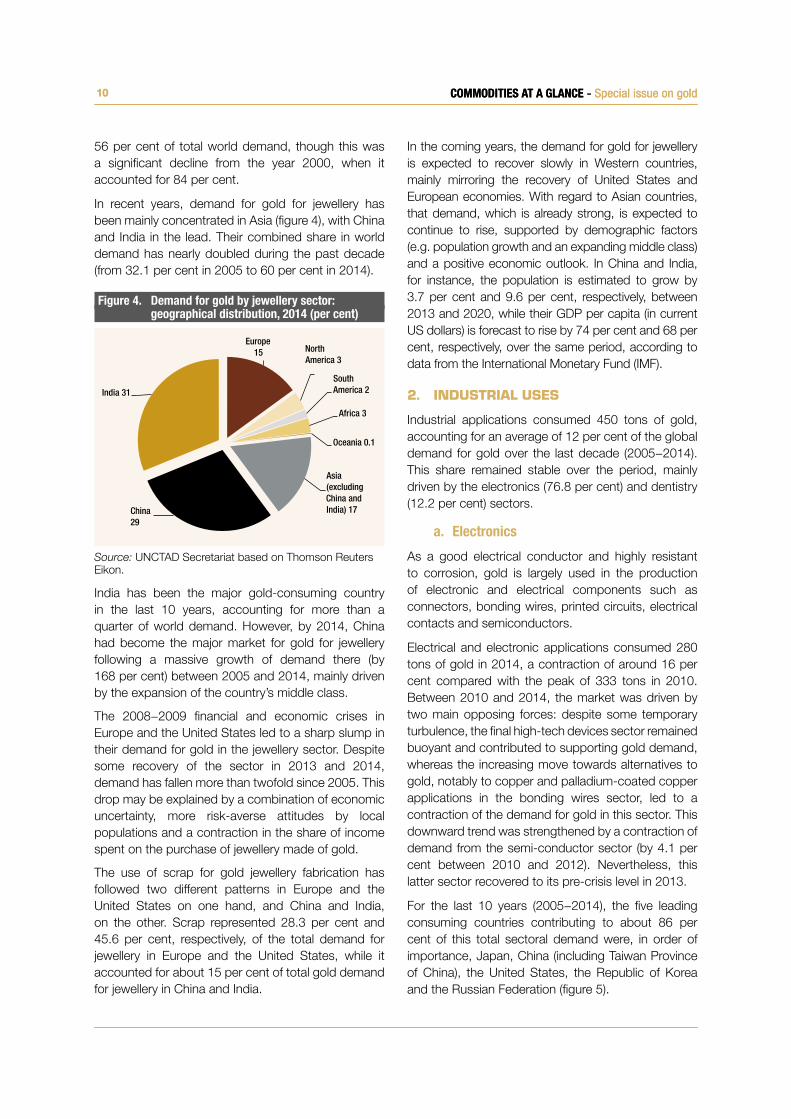
In recent years, demand for gold for jewellery has been mainly concentrated in Asia (figure 4), with China and India in the lead. Their combined share in world demand has nearly doubled during the past decade (from 32.1 per cent in 2005 to 60 per cent in 2014).
India has been the major gold-consuming country in the last 10 years, accounting for more than a quarter of world demand. However, by 2014, China had become the major market for gold for jewellery following a massive growth of demand there (by 168 per cent) between 2005 and 2014, mainly driven by the expansion of the country’s middle class.
The 2008−2009 financial and economic crises in Europe and the United States led to a sharp slump in their demand for gold in the jewellery sector. Despite some recovery of the sector in 2013 and 2014, demand has fallen more than twofold since 2005. This drop may be explained by a combination of economic uncertainty, more risk-averse attitudes by local populations and a contraction in the share of income spent on the purchase of jewellery made of gold.
The use of scrap for gold jewellery fabrication has followed two different patterns in Europe and the United States on one hand, and China and India, on the other. Scrap represented 28.3 per cent and 45.6 per cent, respectively, of the total demand for jewellery in Europe and the United States, while it accounted for about 15 per cent of total gold demand for jewellery in China and India.
In the coming years, the demand for gold for jewellery is expected to recover slowly in Western countries, mainly mirroring the recovery of United States and European economies. With regard to Asian countries, that demand, which is already strong, is expected to continue to rise, supported by demographic factors (e.g. population growth and an expanding middle class) and a positive economic outlook. In China and India, for instance, the population is estimated to grow by 3.7 per cent and 9.6 per cent, respectively, between 2013 and 2020, while their GDP per capita (in current US dollars) is forecast to rise by 74 per cent and 68 per cent, respectively, over the same period, according to data from the International Monetary Fund (IMF).
2. INDUSTRIAL USES
Industrial applications consumed 450 tons of gold, accounting for an average of 12 per cent of the global demand for gold over the last decade (2005−2014). This share remained stable over the period, mainly driven by the electronics (76.8 per cent) and dentistry (12.2 per cent) sectors.
a. Electronics
As a good electrical conductor and highly resistant to corrosion, gold is largely used in the production of electronic and electrical components such as connectors, bonding wires, printed circuits, electrical contacts and semiconductors.
Electrical and electronic applications consumed 280 tons of gold in 2014, a contraction of around 16 per cent compared with the peak of 333 tons in 2010. Between 2010 and 2014, the market was driven by two main opposing forces: despite some temporary turbulence, the final high-tech devices sector remained buoyant and contributed to supporting gold demand, whereas the increasing move towards alternatives to gold, notably to copper and palladium-coated copper applications in the bonding wires sector, led to a contraction of the demand for gold in this sector. This downward trend was strengthened by a contraction of demand from the semi-conductor sector (by 4.1 per cent between 2010 and 2012). Nevertheless, this latter sector recovered to its pre-crisis level in 2013.
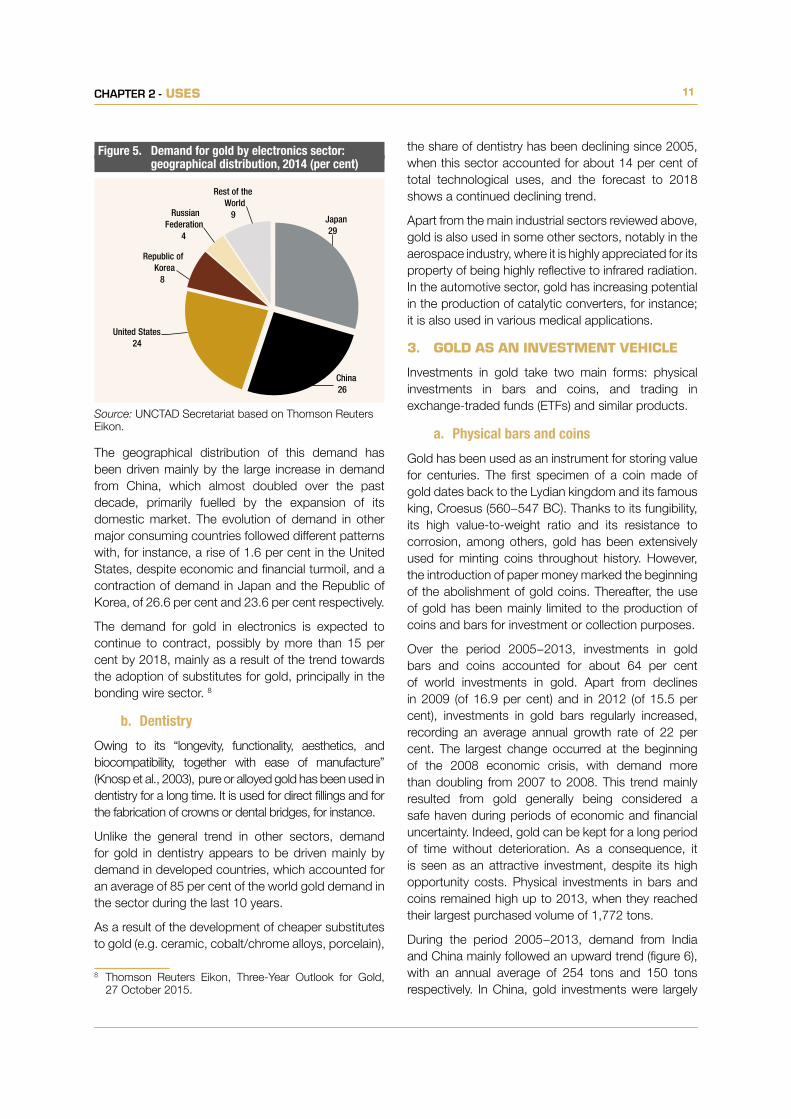
For the last 10 years (2005−2014), the five leading consuming countries contributing to about 86 per cent of this total sectoral demand were, in order of importance, Japan, China (including Taiwan Province of China), the United States, the Republic of Korea and the Russian Federation (figure 5).
Figure4. Demandforgoldbyjewellerysector: geographicaldistribution,2014(percent)
Europe15 North
America 3
South America 2
Africa 3
Oceania 0.1
Asia (excluding China and India) 17China
29
India 31
Source: UNCTAD Secretariat based on Thomson Reuters Eikon.
11CHAPTER 2 - USES 11
The geographical distribution of this demand has been driven mainly by the large increase in demand from China, which almost doubled over the past decade, primarily fuelled by the expansion of its domestic market. The evolution of demand in other major consuming countries followed different patterns with, for instance, a rise of 1.6 per cent in the United States, despite economic and financial turmoil, and a contraction of demand in Japan and the Republic of Korea, of 26.6 per cent and 23.6 per cent respectively.
The demand for gold in electronics is expected to continue to contract, possibly by more than 15 per cent by 2018, mainly as a result of the trend towards the adoption of substitutes for gold, principally in the bonding wire sector. 8
b. Dentistry
Owing to its “longevity, functionality, aesthetics, and biocompatibility, together with ease of manufacture” (Knosp et al., 2003), pure or alloyed gold has been used in dentistry for a long time. It is used for direct fillings and for the fabrication of crowns or dental bridges, for instance.
Unlike the general trend in other sectors, demand for gold in dentistry appears to be driven mainly by demand in developed countries, which accounted for an average of 85 per cent of the world gold demand in the sector during the last 10 years.
As a result of the development of cheaper substitutes to gold (e.g. ceramic, cobalt/chrome alloys, porcelain),
8 Thomson Reuters Eikon, Three-Year Outlook for Gold, 27 October 2015.
Figure5. Demandforgoldbyelectronicssector: geographicaldistribution,2014(percent)
Japan29
China26
United States24
Republic of Korea
8
Russian Federation
4
Rest of the World
9
Source: UNCTAD Secretariat based on Thomson Reuters Eikon.
the share of dentistry has been declining since 2005, when this sector accounted for about 14 per cent of total technological uses, and the forecast to 2018 shows a continued declining trend.
Apart from the main industrial sectors reviewed above, gold is also used in some other sectors, notably in the aerospace industry, where it is highly appreciated for its property of being highly reflective to infrared radiation. In the automotive sector, gold has increasing potential in the production of catalytic converters, for instance; it is also used in various medical applications.
3. GOLD AS AN INVESTMENT VEHICLE
Investments in gold take two main forms: physical investments in bars and coins, and trading in exchange-traded funds (ETFs) and similar products.
a. Physical bars and coins
Gold has been used as an instrument for storing value for centuries. The first specimen of a coin made of gold dates back to the Lydian kingdom and its famous king, Croesus (560−547 BC). Thanks to its fungibility, its high value-to-weight ratio and its resistance to corrosion, among others, gold has been extensively used for minting coins throughout history. However, the introduction of paper money marked the beginning of the abolishment of gold coins. Thereafter, the use of gold has been mainly limited to the production of coins and bars for investment or collection purposes.
Over the period 2005−2013, investments in gold bars and coins accounted for about 64 per cent of world investments in gold. Apart from declines in 2009 (of 16.9 per cent) and in 2012 (of 15.5 per cent), investments in gold bars regularly increased, recording an average annual growth rate of 22 per cent. The largest change occurred at the beginning of the 2008 economic crisis, with demand more than doubling from 2007 to 2008. This trend mainly resulted from gold generally being considered a safe haven during periods of economic and financial uncertainty. Indeed, gold can be kept for a long period of time without deterioration. As a consequence, it is seen as an attractive investment, despite its high opportunity costs. Physical investments in bars and coins remained high up to 2013, when they reached their largest purchased volume of 1,772 tons.
During the period 2005−2013, demand from India and China mainly followed an upward trend (figure 6), with an annual average of 254 tons and 150 tons respectively. In China, gold investments were largely

12 COMMODITIES AT A GLANCE - Special issue on gold12 COMMODITIES AT A GLANCE - Special issue on gold
a response to expectations of domestic inflation, combined with the lack of attractiveness of other types of investments.
The trend of world demand for investments in gold bars reversed in 2014, with a large drop of 40 per cent from the previous year.
Investments in gold bars were also significant in Europe over the period 2005−2014. Prior to 2007, the general trend in Europe was mainly towards large disinvestments in physical gold. However, this trend reversed in 2008 with the beginning of the economic and financial crises. Thereafter, European demand for bars rose to a peak of 303 tons in 2011, but started to decline the following year. Nevertheless, the demand for bars and coins in this region remains high compared to its historical levels.
b. ETFs and similar products9
ETFs are funds that track indexes where shares represent a portfolio which tracks the yield and return of its native index. ETFs have been in use since the
9 Exchange traded funds and similar products, include, but are not limited to, SPDR Gold Shares, iShares Gold Trust, ZKB Gold ETF, ETFS Physical Gold/Jersey, Gold Bullion Securities Ltd, Central Fund of Canada Ltd, Xetra-Gold, Julius Baer Precious Metals Fund – JB Physical Gold Fund, Source Physical Gold P-ETC, Sprott Physical Gold Trust (World Gold Council, Gold demand trends, first quarter 2015, May 2015; available at: http://www.gold.org/supply-and-demand/gold-demand-trends).
beginning of the 1980s, and are mostly traded in Europe and the United States.
With the 2008−2009 economic and financial crisis and the European sovereign debt crisis, investments in ETFs and other related products almost doubled, pushing world demand for gold to 623 tons in 2009, compared with 321 tons in 2008 (figure 7). In 2010, fund managers began to adopt a new strategy due to historically high gold prices. As a result, volumes invested in ETFs fell to their pre-crisis level, accentuated by a fall in gold prices in 2013.
Investments in ETFs are expected to continue their 2014 trend as long as the future of the world economy remains uncertain. Depending on whether investors follow short-term or longer term strategies, two scenarios for demand for gold could be envisaged. Short-term market players may divert part of their gold investments to other financial instruments which may appear more attractive based on the premise of economic recovery in the United States and the strategy adopted by the United States Federal Reserve to progressively increase its interest rates, which started with a rise of 0.25 per cent on 16 December 2015. However, for long-term investors, the current level of gold prices may discourage them from liquidating their positions, as they would suffer losses. On the other hand, the current low level of gold prices compared to their recent peaks may also encourage new investors to enter the market in the hope of making profits.
Figure6. Investmentsingoldbars,byweight,inChina,EuropeandIndia,2005−2014(tons)
-100
0
100
200
300
400
500
2004
2005
2006
2007
2008
2009
2010
2011
2012
2013
2014
India China Europe
Source: UNCTAD secretariat, based on World Gold Council (various).

13CHAPTER 2 - USES 13
4. NATIONAL GOLD RESERVES AND PURCHASES OF GOLD BY CENTRAL BANKS
With 31,927 tons of gold stocks worldwide in 2014,10 central banks held about a fifth of the total gold extracted worldwide since its discovery.
Between 1948 and 2014, the quantity of gold held by central banks globally increased by 6 per cent, with a peak recorded at 38,219 tons in 1965. From 1965 to 2007, central banks’ gold reserves gradually fell, reaching their lowest level at 29,864 tons in 2007. Thereafter, their global stocks rose again following the economic and financial turmoil which pushed the central banks to diversify their portfolios away from dollars and euros. This generated an increase of about 7 per cent between 2007 and 2014 in central banks’ gold reserves.
Since 1980, the tonnage of gold stocks held by the 10 leading countries has been increasing (figure 8). While they accounted for 59 per cent of total gold holdings in 1980, their aggregate share amounted to 68 per cent in 2014. The largest national gold reserves were held by the United States, followed by Germany, Italy, France and the Russian Federation, which together accounted for more than half of total
10 IMF (accessed 7 April 2015).
world gold reserves in 2014. However, the share of their national central banks’ gold reserves in total central bank reserves differs: those of the Russian Federation accounted for 13.3 per cent of the total in 2014, compared with more than two thirds held by the central banks of the United States, Germany, Italy and France. In these countries, the large stocks of gold held by central banks mainly represent a legacy from the former gold standard system.
Apart from the effect of the physical stocks of gold held by central banks on gold prices, central banks can also have short-term impacts on gold prices through their purchases or sales of gold.
After 21 years of net sales, central banks became net buyers of gold in 2010 (figure 9). During the period 1989−2009, and apart from a few years when sales by central banks were more limited (20−30 tons),11 volumes sold by them averaged 420 tons a year. The move towards net purchases of gold by central banks was mainly due to a combination of two factors: the large increase of purchases from emerging market economies’ central banks and the global contraction of sales in other countries, particularly signatories to central bank gold agreements. From 2010 to 2014, central banks purchased an average of 391 tons, which was about 15 per cent of world annual mine
11 Namely 1990, 1991, 1996, 2009.
Figure7. NetETFpurchases(tons)andgoldprices(dollarspertroyounce),2005-2014
0
200
400
600
800
1 000
1 200
1 400
1 600
1 800
-1 000
-800
-600
-400
-200
0
200
400
600
80020
05
2006
2007
2008
2009
2010
2011
2012
2013
2014
Gold
pric
es
Net E
TF p
urch
ases
/sal
es
Net ETF purchases/sales Gold prices, right axis
Source: UNCTAD secretariat based on Thomson Reuters Eikon for net ETF purchases, (accessed 20 May 2015) and UNCTADstat for gold prices.

14 COMMODITIES AT A GLANCE - Special issue on gold14 COMMODITIES AT A GLANCE - Special issue on gold
production over the period. This trend started to decelerate in 2013 with the increasing volatility of gold prices, and is expected to continue up to 2018, when net purchases are forecast to fall to 100 tons.12
Central banks’ interventions in the gold market through buying and selling of gold and their release of information on their gold holdings may have a direct impact on gold prices through supply and demand, and an indirect impact through the resulting strategies by other actors in the gold market. In this regard, central banks’ interventions may also have an impact on the valuation of gold companies as well as ETFs.
12 Thomson Reuters Eikon, Three-year outlook for gold, 27 October 2015.
Even though the role of central banks in the gold market is acknowledged to be potentially important, the trend in gold prices since 2008 is mostly attributed to the evolution of the dollar as well as macroeconomic factors, such as concerns regarding potential inflationary risks. Since 2012, with a slight improvement in the global economic situation and the strengthening of the dollar investors may have been induced to acquire more liquid and remunerative assets, leading to a drop in gold prices.
a. Purchases made by central banks of emerging market economies
Since the beginning of the 2000s, the central banks of Bangladesh, China, India, Iraq, Kazakhstan, the
Figure 8. Central banks of countries with the largest gold reserves, as a percentage of total world gold reserves heldbycentralbanks,1980and2014(percent)
UnitedStates: 23
Germany: 8
Switzerland: 7
France: 7
Italy: 6Netherlands: 4 Japan: 2 China: 1 India: 1
Rest of theworld: 41
1980
UnitedStates: 25
Germany: 11
Italy: 8
France: 8 RussianFederation: 4
China: 3 Switzerland: 3
Japan: 2 Netherlands: 2
India: 2
Rest of theworld: 32
2014
Source: UNCTAD secretariat based on the IMF.Note: IMF gold stocks are not included either in these graphs or in the analysis that follows.
Figure9. Netpurchasesofgoldbycentralbanks,1980−2014(tons)
-800
-600
-400
-200
0
200
400
600
800
1980
1982
1984
1986
1988
1990
1992
1994
1996
1998
2000
2002
2004
2006
2008
2010
2012
2014
Source: UNCTAD secretariat, based on World Gold Council (various).

15CHAPTER 2 - USES 15
Republic of Korea, Mexico, the Russian Federation, Thailand and Turkey, among others, increased the quantity of gold they held in their national reserves (table 2). However, in spite of the absolute increase in their gold stocks, the share of gold in their total reserves declined as a result of a larger increase in their foreign-currency-denominated assets. For example, while the share of gold in total Russian reserves dropped from 25 per cent to 5 per cent between 2000 and 2010, Russia’s merchandise export value increased nearly fourfold over the same period.
At the same time as the demand from central banks in emerging market economies tended to increase, gold sales from central banks in developed countries, mainly Europe, tended to contract in response to expectations of a sovereign debt crisis in Europe and the adoption of low-risk strategies by European central banks. This new approach added to the position already taken by central banks in European countries to limit their gold sales within the framework of the Central Bank Gold Agreement (CBGAs).
b. Reduction of gold sales by signatories to the Central Bank Gold Agreements
Between 1980 and 1999, gold lost 54 per cent of its value. Fearful of a potential depreciation of the real value of their gold reserves, many of Europe’s national central banks, as well as the European Central Bank and the Swiss National Bank joined
CountryRealGDPgrowth2000−2014(per cent)
Gold reserves in 2000(tons)
Gold reserves in November 2015
(tons)
Change in gold reserves
2000−November2015 (per cent)
Gold as a percentage of total central bank reserves November
2015 (per cent)
Russian Federation 75 379 1 352 ➚ 257 13.1
China 243 395 1 709 ➚ 333 1.6
Thailand 72 73 152 ➚ 108 3.5
Bangladesh 113 3 14 ➚ 367 1.9
India 141 358 558 ➚ 56 5.6
Kazakhstan 165 57 214 ➚ 275 27.2
Iraq 74 6 90 ➚ 1 400 4.8
Mexico 31 8 122 ➚ 1 425 2.4
Republic of Korea 63 14 104 ➚ 643 1.0
Turkey 68 116 505 ➚ 335 15.2
Source: UNCTAD secretariat, based on UNCTADstat (for real GDP) and World Gold Council (for gold reserves and official gold holdings, accessed 21 May 2015).
Table2. TrendsinrealGDPgrowthandgoldreservesinemergingmarketeconomies,2000−2014(percentandtons)
forces to stabilize the gold market through a coordinated control of their sales. To this end, they signed the first CBGA in 1999, also known as the Washington Agreement on Gold, whereby they agreed to limit their gold sales to 400 tons annually and up to a maximum of 2,000 tons for the five-year period of the Agreement.13 The central banks also highlighted the need to keep gold as an important asset in their national reserves in the future.
In 2004, at the time of the signature of the second CBGA, gold prices had already increased by 47 per cent compared with their average in 1999. This second agreement raised the upper limit of annual and five-year gold sales to 500 tons and 2,500 tons, respectively.14 The Bank of Greece joined the agreement in 2004, while the Bank of England left it the same year. The central banks of Cyprus and Malta joined in the course of the agreement in 2008.
The third CBGA, signed in 2009, sought to restore maximum gold sales to their 1999 levels.15 The Agreement also acknowledged the intent of the IMF to sell some of its gold reserves (403.3 tons).
13 ECB (1999). Joint statement on gold. Frankfurt am Main, 26 September. Available at: https://www.ecb.europa.eu/press/pr/date/1999/html/pr990926.en.html.
14 ECB (2004). Joint statement on gold. Frankfurt am Main, 8 March. Available at: https://www.ecb.europa.eu/press/pr/date/2004/html/pr040308.en.html.
15 ECB (2009). Joint statement on gold. Frankfurt am Main, 7 August. Available at: https://www.ecb.europa.eu/press/pr/date/2004/html/pr040308.en.html.

16 COMMODITIES AT A GLANCE - Special issue on gold16 COMMODITIES AT A GLANCE - Special issue on gold
The fourth CBGA signed in 2014 confirmed the importance of gold for signatories’ central banks.16 However, it set no specific limits on gold sales, most probably due to the difficult economic situation in Europe. Stakeholders reaffirmed the importance of avoiding large gold price swings, and expressed their intention not to sell large quantities of gold during this five-year Agreement. The next CBGA is planned to be concluded in 2019.
Over the past decade (2004−2014), central banks sold, on average, 210 tons of gold per annum (5 per cent of the world gold supply). This average fell to just over 40 tons between 2009 and 2014, possibly because the European Union (EU) did not wish to send a wrong signal to financial markets by selling large quantities of gold from its reserves so as to avoid further weakening countries that were experiencing a difficult economic situation. Moreover, proceeds from selling gold from the national reserves of the most indebted European countries would not have been sufficient to overcome their high level of indebtedness (figure 10).
16 ECB (2014). ECB and other central banks announce the fourth Central Bank Gold Agreement. 1 Frankfurt am Main, 9 May. Available at: https://www.ecb.europa.eu/press/ pr/date/2014/html/pr140519.en.html.
Figure10.GoldsalesundersuccessiveCentralBankGoldAgreements,1999−2000to2013−2014(tons)
0
100
200
300
400
500
600
1999
/200
0
2000
/200
1
2001
/200
2
2002
/200
3
2003
/200
4
2004
/200
5
2005
/200
6
2006
/200
7
2007
/200
8
2008
/200
9
2009
/201
0
2010
/201
1
2011
/201
2
2012
/201
3
2013
/201
4
Sales under the Agreement
CBGA 1999CBGA 2004
CBGA 2009
5-year ceiling on gold sales
Source: UNCTAD secretariat based on the IMF.
Jewellery, which, as noted, accounts for the largest share of world demand for gold since the discovery of gold, plays a historical and pivotal role in the gold market. In this context, demands from China and India are particularly important indicators of the global state of the gold sector. This situation is not expected to change in the coming years, as the jewellery sector may gain about 10 per cent by 2018.17 Moreover, gold has been playing a growing role in the financial sector, both through the physical demand for coins and bars, and through financial transactions on international markets. This is because of its capacity to store value for a long period of time thanks to its inalterability, its role as a safe haven in periods of crisis and the development of innovative financial tools. Moreover, in periods of increasing economic uncertainties, such as during the 2008-2009 financial and economic crisis, the share of gold as a financial instrument gains in importance and tends to have a greater impact on gold prices. This aspect of the demand for gold, which is expected to gain in importance by 2018, will exert upward pressure on gold prices.
17 Thomson Reuters Eikon, Three-year outlook for gold, 27 October 2015.

CHAPTER 4 - PRICES 17
CHAPTER 3:PRODUCTION


CHAPTER 3 - PRODUCTION 19
According to the World Gold Council, annual world gold supply reached a historical peak of 4,477 tons in 2012. It is essentially supplied from two main sources: gold mine production − also called primary production − which accounts for about two thirds of world supply; and the recycling of gold − also known as secondary production − which accounts for the remaining one third.
1. TECHNICAL ASPECTS OF GOLD PRODUCTION
a. Primary gold mining
Primary gold can be extracted from (i) veins and lodes, which are primary bedrock deposits, and (ii) placers, which result from the action of weathering on original lode deposits.
i. Primary deposits: Veins and lodes mining
With about 90 per cent of all gold extracted worldwide, lodes and veins mining is the main source of annual primary production of gold in the world. In lodes, gold is mainly present in quartz-pebble conglomerate deposits (56 per cent of annual world gold production). But gold may also be extracted from other types of veins (table 3) and as a by-product in the extraction of base metals (e.g. copper, lead and zinc, nickel) or other precious metals such as silver.
The average grade recovered largely varies from one mine to the other, ranging from less than 1 gram per ton to 19.62 grams per ton in Turquoise Ridge (United States) in 2014, for instance.18 The gold content of a deposit is one of the main aspects determining the choice of mining and recovery methods.
18 See appendix 2: The state of gold mines around the world, 2015.
Gold can be extracted from underground or open-pit mines. Usually, the open-pit method is used to recover low-grade gold (less than 4 grams per ton), while underground mining is preferred for extracting high grade materials, as this technique is generally more costly.
ii. Secondary deposits: Placer mining
Placer deposits result from the long-term action of a set of natural factors (e.g. wind, gravity, water, waves and glaciers). These elements progressively erode the original gold lode deposits and mother rocks, leaching gold ores away from their gangue, and transporting and depositing them away to a different place. In this case, deposits are known as alluvial, fluvial or marine deposits. However, gold particles may also remain more or less in-situ. In this case, deposits are called elluvial. In placer deposits, such as flood plains, stream beds or oceans, gold mainly appears in its native form (e.g. dust, flakes or nuggets). According to the United States Geological Survey (USGS), placer deposits were the main source of gold production in the past, contributing to around 90 per cent of the world production from 1850 to 1875 (Butterman, WC and Earle, 2005). However, placer deposits have become less important today, mainly due to the development of veins and lodes mining worldwide.
Placer gold is mainly separated from the sand and gravel by gravity, sluicing or panning separation techniques. These methods, which rely on the high density of gold (19.32 grams per cubic centimeter (g/cm3)) compared with other surrounding rocks (around 2.6 g/cm3), are used when particles are bigger than 75 micrometres (μm). Once recovered, the ore containing gold particles is reduced to dust. The sand is then put into a jig which uses a stream of water to extract gold and produce the concentrate (a mixture of gold, and some remaining small quantities of sand). If sulfide minerals are present, the concentrate is cleared by froth flotation.19 Thereafter, the processing of gold is the same as for lode and veins mining (see appendix 1).
19 Froth flotation is a process whereby the ore containing gold particles is finely crushed and mixed with water to produce slurry to which chemical conditioning agents are added to increase its hydrophobicity; the resulting blend is then loaded in agitated flotation cells with water, into which air bubbles are injected. Under the combined effect of chemical agents and the agitation, the air bubbles capture the gold contained in the slurry and bring it to the top of the cell where the froth is skimmed off. This technique is also used in the treatment of refractory ores.
1. Placers
2. Quartz vein-lode ores
3. Oxidized ores
4. Silver-rich ores
5. Copper sulfide ores
6. Iron sulfide ores
7. Arsenic sulfide ores
8. Antimony sulfide ores
9. Bismuth sulfide ores
10. Telluride ores
11. Carbonaceous - sulfidic ores
Source: SGS minerals
Table 3. Gold ore types
20 COMMODITIES AT A GLANCE - Special issue on gold
In the past, mercury was widely used for the recovery of gold due to its low cost and ease of use. However, because of its severely harmful effects on humans and the environment (box 1), its use has been largely abolished and remains mostly confined to artisanal small-scale gold mining (ASGM). According to the United Nations Environment Programme (UNEP), ASGM, which accounted for 37 per cent of world mercury emissions in 2013, is considered a major source of air and water mercury pollution (UNEP, 2013a). To deal with this issue, the Minamata Convention on Mercury20 was adopted in October 2013 under the aegis of UNEP. The general objective of this convention is “to protect the human health and the environment from anthropogenic emissions and releases of mercury and mercury compounds” (article 1 of the Convention). In order to achieve this goal, the convention provides a global framework for the control of the supply and international trade of mercury (article 3) and its uses (articles 4, 5, 6 and 7). Article 7 is specifically dedicated to ASGM activities. Moreover, articles 8 to 12 provide for the monitoring and control and, where feasible, reduction of mercury emissions and releases into the environment. Finally, the Minamata Convention also addresses the issues of mercury storage as well as the management of waste and contaminated sites.
20 UNEP, Minamata Convention on Mercury, October 2013 (see: http://www.mercuryconvention.org/).
b. The metallurgy of gold
The processing steps presented in figure 11 are a general example applicable to about two thirds of gold processing worldwide. However, it should not be considered applicable to all types of auriferous ores. For example, the combination of cyanidation with complementary treatments would be necessary for the processing of refractory gold ores, as traditional direct cyanidation methods will allow the recovery of only 10−20 per cent of the gold contained21 in these ores.
The use of cyanide historically has been, and remains, of the greatest importance for gold recovery. However, cyanide is also a highly toxic and rapidly acting poisonous substance. Under certain circumstances, it can have harmful effects on birds, fish and mammals, including human beings. Intoxication by cyanide can occur by inhalation, ingestion or by cutaneous contact, and mostly affects the cardiovascular, respiratory,
21 Ores are considered as refractories when the gold particles they contain cannot be satisfactorily recovered by standard methods (e.g. direct cyanidation or carbon adsorption processes). As a result, they must be pre-treated by pressure, chemical or bio-oxidation (the latter is also known as bacterial leaching), or roasted in order to allow traditional recovery methods to operate efficiently. Given the extra costs generated by these pre-treatments, this solution is only used to process large quantities of high-grade gold ores. Refractory ores often contain sulfide minerals (e.g. pyrite, arsenopyrite).
BOX 1. The use of mercury in gold mining: amalgamation
The use of elemental mercury (Hg) in gold recovery is based on the solubility of gold in mercury. Gold dis-solves and forms an amalgam with mercury; hence the term “amalgamation” is used for this operation. The amalgam is then filtered and heated to separate the gold from the mercury. This operation results in the evaporation of mercury in the form of noxious vapours. At this stage, only gold remains, and the mercury can be recovered for reuse.
The World Health Organization (WHO) considers mercury to be one of the top 10 chemicals or groups of chemicals of major public health concern. Mercury can severely affect miners who are directly exposed to it through their inhalation of vapours (80 per cent are believed to pass into the blood-stream). But mercury can also chronically contaminate surrounding communities through dust and va-pours transported by the wind or through residues on clothes or walls, for instance. According to WHO, “Recent studies suggest that mercury may have no threshold below which some adverse effects do not occur.”a However, the official limit has been set at 1,000 nanograms.
If mercury is released into the environment, it can contaminate the entire food chain. Notably, it may metabolize into Methylmercury under the action of anaerobic organisms. In this case, bioaccumulation and sometimes bio-magnification may occur in fish and shellfish, which can dramatically expose local populations and severely threaten the development of young children and fetuses in utero. a WHO (2005)

CHAPTER 3 - PRODUCTION 21
central nervous and endocrine systems. Cyanide, even at low concentration rates, can also be fatal.
Taking into consideration the possible impacts of cyanide on living beings, both public authorities and the industry have taken steps to improve cyanide-related practices. First of all, as a result of the dramatic Baia Mare (Romania) cyanide spill in 2000, the gold industry elaborated the International Cyanide Management Code for the Manufacture, Transport, and Use of Cyanide in the Production of Gold under the auspices of UNEP and the former International Council on Metals and Environment. The code covers numerous aspects of the life cycle of cyanide (e.g. use, transportation, handling, storage, treatment). It also aims to encourage the responsible production of cyanide. 22
In Europe, the main regulation dealing with this problem is the European Commission’s Directive 2006/21/EC on the management of waste from the extractive industries, which stipulates that the concentration of cyanide and cyanide compounds in tailings ponds should be reduced to the lowest possible levels, using best available techniques. Apart from this
22 International Cyanide Management Code (undated). The Cyanide Code. Available at: http://www.cyanidecode.org/about-cyanide-code/cyanide-code International Cyanide Management Code (undated). Implementation Guidance. Available at: http://www.cyanidecode.org/become-signa-tory/implementation-guidance.
directive, there are general worldwide efforts towards tighter controls of cyanide-leaching activities. Some countries (e.g. Argentina, the Czech Republic, Greece and some states in the United States) have already banned the use of cyanide leaching techniques in the gold industry
2. STATISTICS RELATING TO GOLD PRODUCTION
a. Global gold production
Gold can be extracted from large mines or by means of artisanal mining activities, also known as small-scale mining. While accounting for a substantial share of annual gold production, artisanal mining is hard to evaluate and monitor due to the lack of comprehensive data, as related operations are often not registered or are illegal in several countries. As a consequence, this report concentrates mainly on statistical information available for large mine production. (See box 2 for a brief discussion of artisanal mining.)
According to data from USGS, around 180,000 tons of gold have been extracted since its discovery, with 9 tons out of 10 mined since the beginning of the California gold rush in 1848. Thanks to its inalterability, and unlike other commodities, gold extracted since the beginning of historical records is generally still in stock today. This stock was equivalent to about 43 years of annual world demand in 2014. According to USGS
Figure 11. The metallurgy of goldM
ININ
G
CRUSHING SCREENING
LEACHING CYANIDATION RECOVERY
REFI
NING
STRIPPING ELECTROWINNINGSMELTING
CYAN
IDE
LEAC
HATE
GOLD
PUL
PGO
LD-L
OADE
DCA
RBON
PREG
NANT
ELU
ATE
CONC
ENTR
ATED
LIQU
OR
DORÉ
BULL
ION
Tank leaching
Heap leachingMerrill Crowe process
Adsorption on activated carbon
Zadra stripping
Anglo American Research Laboratories (AARL) stripping
Source: UNCTAD secretariat.Note: For further information about the metallurgy of gold, see appendix 1.

22 COMMODITIES AT A GLANCE - Special issue on gold
statistics, of the 150,000 tons of gold ores produced since 1900, three quarters were extracted after 1950 (figure 12). Gold production gradually accelerated from 1950 to 1970 and from 1980 to 2000 as a result of growth in demand and the development of new mining and processing techniques which facilitated the exploitation of poorer grade gold deposits. In 2014, the average grade of gold mined was 3.50g/ton.23
The recent history of gold production shows a fall of more than 10 per cent between 2000 and 2008. However, gold production started to rise again in 2009, and reached a peak of 2,860 tons in 2014.
23 UNCTAD computation based on appendix 2 to this report.
Currently, about 90 countries mine gold. Among the leading gold-producing countries, historically, six have been large market players (figure 13). Individually, each of these countries accounted for at least 5 per cent of world production over the period 1980−2014. They are, in order of importance, South Africa (24 per cent), the Russian Federation (10 per cent), the United States (10 per cent), Australia (9 per cent), China (8 per cent) and Canada (6 per cent). Together, they accounted for almost 90 per cent of world production in 1980. However, their aggregated share has been declining over time, from 81 per cent in 1990 to 66 per cent in 2000 and to 56 per cent in 2014. This contraction can be explained by the progressive exhaustion of natural
Figure12.Worldprimarygoldproduction,1900−2014(tons)
Figure13.Sharesofleadinggoldmineproducingcountriesintotalworldmineproduction,1980and2014(percent)
0
500
1 000
1 500
2 000
2 500
3 000
3 50019
00
1905
1910
1915
1920
1925
1930
1935
1940
1945
1950
1955
1960
1965
1970
1975
1980
1985
1990
1995
2000
2005
2010
1929–1940Financial crisis
1939–1945Second World War
1945–1970 The Glorious Thirty
1970–1979Petroleum crisis
2001–2008Lack ofinvestments
2008–2014Financial andeconomic crisis
SouthAfrica55
United States3
RussianFederation20
Australia1
China4
Canada4
Rest of theworld 13
1980
South Africa5 United States
7
RussianFederation
8
Australia9
China16
Canada6
Peru5
Rest of theworld
43 2014
Source: UNCTAD secretariat based on USGS supply and demand statistics; available at: http://minerals.usgs.gov/minerals/pubs/historical-statistics/#gold and USGS, Minerals Yearbook, various issues; available at: http://minerals.usgs.gov/minerals/pubs/commodity/gold/.
Source: UNCTAD secretariat based on data from the British Geological Survey, 2015.

CHAPTER 3 - PRODUCTION 23
reserves in these countries, mainly South Africa, as well as the emergence of new market players such as Peru. For example, while Peru was producing 3.8 tons of gold in 1980, its gold production expanded during the 1980s and the 1990s, reaching about 150 tons in 2014.
The landscape of world gold production has changed since the beginning of the 1980s, with a trend towards the atomization of gold-producing countries. A major development has been the sharp decline of the share of South Africa in world gold production, from 55 per cent in 1980 to about 5 per cent in 2014. No overwhelming market player can be observed in terms of gold mine production in
2014, in contrast to the past. Today, the main gold-producing country is China with 16 per cent of world gold production, followed by Australia, the Russian Federation, the United States, South Africa, Canada and Peru. In 2014, the combined share of these 7 countries was equivalent to South Africa’s share in 1980.
The concentration of the gold industry is relatively low compared with other mining sectors. The 10 leading gold companies account for around a third of world gold production (figure 14a). They are mainly transnational corporations (TNCs) based in developed countries and in South Africa, but their activities are spread all over the world (appendix 2). Some of these companies are among the biggest in the world, as ranked by Forbes Global 2000 for the year 2014. This is, for instance, the case of Barrick gold (771), Newmont mining (1,033), Goldcorp (1,160), PGL (1,709) and Newcrest (1,922).24 Together, the 10 leading gold companies recorded about $65 billion in market capitalization, with the three largest accounting for about 45 per cent of this amount (figure 14b).
b. Overview of production in the leading gold-producing countries
i. China
China was the leading gold-producing country for the eighth consecutive year in 2014, with a record 450 tons, representing 15.7 per cent of world gold mine production. China’s share in world production has been increasing gradually since 1980, when the country accounted for only 4 per cent of the world’s production. It took the lead as the world’s top gold producer in 2007, exceeding South Africa’s production by almost 10 per cent.
In China, gold is mainly produced in the five Provinces of Fujian, Henan, Jiangxi, Shandong and Yunnan. Gold production remains highly atomized, with the five most productive mines contributing around 10 per cent of annual Chinese gold production. According to various sources, gold in the country is mostly produced by a large number of small-scale companies. Despite a move towards consolidation, the number of producing entities was over 700 in 2010, a decline from 2,000 at the beginning of the 2000s.
24 The figures in parenthesis indicate the rankings of the companies in Forbes Global 2000 for the year 2014 (http://www.forbes.com/lists/2010/18/global-2000-10_The-Global-2000_Rank.html, accessed 24 February 2015).
Figure14b. Tenleadinggoldcompaniesintermsof market capitalization, 5 October 2015 (billions of dollars)
Figure14a. Tenleadinggoldcompaniesintermsof goldproduction,2014
0 1 000
2 000
3 000
4 000
5 000
6 000
7 000
PolymetalSibanye Gold
Polyus GoldGoldfields
Newcrest MiningKinross Gold
GoldcorpAnglogold AshantiNewmont Mining
Barrick Gold
0 2 4 6 8 10 12
Yamana GoldKinross Gold
Anglogold AshantiRandgold ResourcesAgnico-Eagle Mines
Newcrest MiningBarrick GoldPolyus Gold
Newmont MiningGoldcorp
Source: UNCTAD Secretariat from Annual reports of mining companies.
Source: UNCTAD Secretariat from Bloomberg.

24 COMMODITIES AT A GLANCE - Special issue on gold
Supported by the development of its middle and upper classes, Chinese gold production is mainly consumed locally; in 2013, its revenues from gold exports accounted for a negligible share of total Chinese merchandise export revenues (0.000035 per cent). Underground reserves of gold are low in China − less than 4 per cent of the world total. However, above-ground reserves are comparatively important, especially thanks to stocks held in the form of jewellery. Indeed, China is a large gold-for-jewellery consumer, ranking second after India, with 29 per cent of the world’s total in 2014 (see chapter 2 on jewellery above).
ii. Australia
The second largest gold-producing country in the world in 2014 was Australia with 270 tons, representing 9.4 per cent of world production. This country has a long history of gold production, with the first mining operations dating back to the end of the nineteenth century. “In the decade after 1851, Australia produced more than 40 per cent of the world’s output of gold” (Minerals Council of Australia, undated). According to USGS statistics, the recent history of gold mining in Australia can be divided into three main periods. Between 1980 and 1997, national production rose from 17 tons at the beginning of the period to a record level of 314 tons in 1997. Thereafter, gold mining operations declined by 32 per cent, falling to 215 tons in 2008. Finally, as a result of a rise in gold prices, the production of gold in the country started to increase again. Between 1980 and 2014, Australia moved up from the sixth to the second rank in terms of world gold production.
Gold production is mainly concentrated in western Australia with 75 per cent of domestic gold production. Most of the gold production is achieved through open pit mines, and is processed and refined domestically. The gold sector directly or indirectly employed more than 50,000 people in 2011 (Minerals Council of Australia, undated).
With a value of about $13.4 billion and more than 5 per cent of its merchandise export revenues in 2013, gold is important for the Australian economy. Moreover, gold was the fourth largest export earner in terms of commodities exported by Australia in 2013 after iron ore, coal and natural gas. Gold is also important for Australia’s state and territory government revenues through their collection of taxes and royalties ($300 million in 2011−2012). In addition, the country has one of the largest shares of world underground gold reserves, at about 18 per cent in 2014, according to the USGS.
iii. Russian Federation
The third largest gold-producing country in 2014 was the Russian Federation. Production is largely concentrated in the eastern part of the country, mainly in the Amur, Irkutsk, Khabarovsk, Krasnoyarsk, Magadan and Sakha (Yatukia) regions. Gold production was high in 2014 compared to its historical average (i.e. 21 per cent higher than the 1980−2014 average). However, its share in world production declined sharply from one fifth of world production recorded in 1980. In the Russian Federation, although gold recorded the sixth largest commodity export earnings in 2013, its share in the country’s total merchandise exports was marginal, at less than 1 per cent.
Mine Operator Production, 2014
Boddington Newmont Mining Corp 696 000Super Pit Newmont Mining Corp(50%) /
Barrick Gold Corp (50%)655 000
Cadia Valley Newcrest Mining Ltd 592 800Telfer Newcrest Mining Ltd 536 300St Ives Gold Fields Ltd 362 000
Source: UNCTAD secretariat based on the annual reports of the gold mining companies.Note: All-in sustaining costs (2014): $853 per troy ounce (average computed by UNCTAD from appendix 2 of this report).
Mine Operator Production, 2014
Kupol and Dvoinoye Kinross Gold Corp 751 101
Olimpiada Polyus Gold International 726 000
Blagodatnoye Polyus Gold International 394 000
Pioneer Petroplavlosk Plc 319 900
Albazino Polymetal International Plc 227 000
Source: UNCTAD secretariat based on the annual reports of the gold mining companies.Note: All-in sustaining costs (2014): $865 per troy ounce (average computed by UNCTAD from appendix 2 of this report)
Table4. Fiveleadinggold-producingminesin Australia,2014(troyounces)
Table 5. Five leading gold-producing mines in the RussianFederation,2014(troyounces)
iv. United States of America
The United States was the fourth major gold-producing country in 2014 with 211 tons produced, representing a share of 7 per cent of the world total.
The United States holds an important place in the collective psyche as the country of the original gold rush at the end of the nineteenth century. USGS statistics show that the United States accounted for about

CHAPTER 3 - PRODUCTION 25
30 per cent of world gold production in 1900. Since then, production decreased until 1980, despite some temporary bursts, such as during the 1929 Depression. From the beginning of the 1980s up to 2000, gold production increased significantly, from 30 tons in 1980 to 353 tons in 2000, but has been declining since then.
Production is mainly concentrated in Nevada, which accounted for about 70 per cent of the country’s gold mine production in 2014. In 2013, gold was the second exported commodity by the United States, accounting for 2 per cent of the total merchandise export revenues.
v. Canada
Gold production in Canada started in the 1820s. Currently, gold mining in the country occurs mainly in the Provinces of Ontario and Québec. While gold production recorded a significant deceleration from 2001 to 2008 (by 40 per cent), it largely recovered over the subsequent period (2008−2014), reaching 160 tons, or 5.6 per cent of world production in 2014. This recent rise was mainly supported by the return to investments of mining companies after a period of disinvestment prior to 2002.
Table 6. Five leading gold-producing mines in the UnitedStates,2014(troyounces)
Table 7. Five leading gold-producing mines in Canada, 2014(troyounces)
Mine Operator Production, 2014
Carlin Complex Newmont Mining Corp 907 000
Cortez Barrick Gold Corp 902 000
Goldstrike Barrick Gold Corp 902 000
Twincreeks Newmont Mining Corp 389 000
Fort Knox Kinross Gold Corp 379 450Source: UNCTAD secretariat based on the annual reports of the gold mining companies. Note: All-in sustaining costs (2014): $898 per troy ounce (average computed by UNCTAD from appendix 2 of this report.)
Gold export revenues accounted for about 4 per cent of total merchandise export revenues in Canada in 2013 and gold ranked as the third leading commodity exported by the country that year. In 2014, Canadian gold production reached a record level of 160 tons, which propelled the country to the fifth rank in terms of world gold mine production.
vi. South Africa
South Africa was the leading gold-producing country in 1980, with more than half of world gold production. However, this share dropped by more than 75 per cent between 1980 and 2014, as a result of ageing production facilities and high production costs. All-in sustaining costs in South Africa are the highest in the world, at an average of more than $1,100 per troy ounce in 2014,25 compared with an average annual international price of $1,266 per troy ounce the same year. This large operating cost is mainly explained by the depth of gold mines in South Africa. In 2014, South Africa ranked sixth in terms of world gold production with 150 tons of gold (compared with 675 tons in 1980).
Despite the current crisis in the national gold sector, this commodity remains of highest importance for the South African economy, and accounts for a large share – 5 per cent − of its merchandise export revenues. Indeed, with export revenues of $5 billion, gold was the third largest export earning commodity in 2013. South Africa’s domestic gold reserves remain the second largest in the world, representing more than 10 per cent of world reserves in 2014. Moreover, one of the biggest gold companies in the world, AngloGold Ashanti, is South African.
25 Compared with less than $900 per ounce in Australia, Canada, the Russian Federation and the United States, for instance (see appendix 2).
Mine Operator Production,2014
Red Lake Gold Corp Inc 414 400
Porcupine Gold Corp Inc 300 000
Musselwhite Gold Corp Inc 278 300
Hemlo Barrick Gold Corp 206 000
Canadian Malartic
Yamana Gold (50 %), Agnico Eagle Limitée (50%) 143 008
Source: UNCTAD secretariat based on the annual reports of gold mining companies.Note: All-in sustaining costs (2014): $815 per troy ounce (average computed by UNCTAD from appendix 2 of this report.)
Table 8. Five leading gold-producing mines in SouthAfrica,2014(troyounces)
Mine Operator Production,2014
Driefontein Sibanye Gold Ltd 551 559
West Wits Anglogold Ashanti 545 000
Kloof Sibanye Gold Ltd 529 882
Vaal River Anglogold Ashanti 452 000
Beatrix Sibanye Gold Ltd 322 000Source: UNCTAD secretariat based on the annual reports of the gold mining companies. Note: All-in sustaining costs (2014): $1,104 per troy ounce (average computed by UNCTAD from appendix 2 of this report).

26 COMMODITIES AT A GLANCE - Special issue on gold
vi. Peru
Peru ranks sixth among the leading gold-producing countries, tying with South Africa in 2014. However, the two countries’ historical backgrounds in terms of gold production are different.
The development of the gold sector in the country has been strong since the beginning of the 1980s, when less than 4 tons of gold extracted. Following a decline between 2005 and 2014, gold production reached 150 tons in 2014, which was 5 per cent of world production.
Peru is the leading gold-producing country in Latin America, and despite the recent contraction of its gold production from its peak of 208 tons in 2005 (i.e. 8.3 per cent of world gold production), export revenues received from gold continue to be a major contributor to the country’s economy. Gold was the most important commodity exported by Peru in 2012 and 2013, accounting for 21 per cent and 14 per cent of total Peruvian merchandise export revenues, respectively.
Apart from large mining facilities, mostly located in the Cajamarca, La Libertad and Piura regions in the north-west of the country, small-scale and artisanal mining, often illegal (box 2), largely contributed to Peruvian gold exports up to 2014 (about one fifth, according to sources). According to UNEP (2012) about 81,000 illegal miners extract gold in Peru, mostly in the Madre de Dios region, representing an annual production of 28 tons (about 30 per cent of Peruvian production since 1980). UNEP also alleges that small-scale gold mining in Peru may have led to the destruction of large areas of the Amazon forest (more than 32,000 hectares) and the poisoning of surrounding water sources, largely due to the
release of mercury into the environment − 30−40 tons per year, according to government estimates (see box 1 concerning the use of mercury and its harmful effects). Given these damaging impacts on the environment and local populations, in April 2014 the Peruvian authorities decided to ban illegal mining in the country.
viii. Other gold-producing countries
Gold is of vital importance to many countries in Africa, Latin America and Oceania, even though their share in global gold exports is far smaller than that of any of the countries discussed above. In 2012−2013, for instance, gold accounted for an overwhelming share of the merchandise export revenues of Burkina Faso, Guyana, Mali, Papua New Guinea, Suriname and the United Republic of Tanzania (table 10). For these countries, therefore, large fluctuations in the price of gold can have dramatic effects on their economies and their development, particularly because of the lack of diversification of their economies and their lower capacity to rapidly switch to other types of commodities when gold prices fall sharply (and vice versa).26
As mentioned in the introduction, world gold supply can come from mining operations or from the recycling of above-ground gold stocks. Recycling represents a faster and easier way for gold supply to adjust to world gold demand or prices in comparison to mine production, especially when it relates to short-term movements. Indeed, for individuals, the sale of gold is a rapid and easy way to access cash. Moreover, mining capacity is more difficult to adapt quickly, given the period of time necessary for the development of a mine. In the long run, quantities of gold supplied through gold recycling tend to increase. Gold recycling accounted for about a third of total gold supply between 1995 and 2014, with about 90 per cent extracted from high-value gold (e.g. jewellery) and 10 per cent from industrial gold (Boston Consulting Group and World Gold Council, 2015).
International gold prices and economic conditions are the main drivers of gold recycling and its share in world gold supply. Statistics related to gold recycling show that the rise in international gold prices and adverse economic conditions tend to lead to an upward trend in gold recycling (figure 16).
26 Leyland J (2005). A touch of gold: Gold mining’s importance to lower-income countries. London, World Gold Council. Available at: http://www.gold.org/research/touch-gold.
Table9. Fiveleadinggold-producingminesinPeru, 2014(troyounces)
Mine Operator Production, 2014
Yanacocha
Newmont Mining Corp (51.35%), Compañia de Minas Buenaventura, (43.65%), International Finance Corporation (5%)
970 000
Lagunas Norte Barrick Gold Corp 582 000
Cerro Corona Gold Fields Ltd 327 000
Orcopampa Compañia de Minas Buenaventura 203 226
La Zanja Compañia de Minas Buenaventura 76 180
Source: UNCTAD secretariat, based on the annual reports of the gold mining companies. Note: All-in sustaining costs (2014): Not available.

CHAPTER 3 - PRODUCTION 27
Table 10. Economic importance of gold in selected countries
Production (tons) Share of gold in total merchandise exportrevenues(percent)
Rankingofgoldincommodityexports(in value terms)
2013 1995−1996 2012−2013 1995−1996 2012−2013
Argentina 52.5 - 2.3 - 6
Brazil 79.6 1.0 1.1 12 13
Burkina Faso 32.6 10.0 45.0 2 1
Chile 51.3 2.6 1.9 7 7
Colombia 55.7 1.8 4.8 9 4
Ghana 90.5 8.6 11.2 5 3
Guyana 15.0 24.0 45.0 1 1
Indonesia 59.1 0.1 1.0 33 11
Kazakhstan 43.5 - 0.8 81 12
Mali 41.8 12.0 44.0 1 1
Mexico 117.8 0.2 2.1 14 2
Papua New Guinea 56.0 9.0 25.0 5 1
Philippines 17.2 1.1 0.7 6 10
Sudan 24.8 n.a 31.0 n.a 2
Suriname 11.0 5 54.0 5 1
United Rep. of Tanzania 43.4 0.3 18.0 27 1
Uzbekistan 73.0 7.2 2.2 2 5Source: UNCTAD secretariat, based on British Geological Survey, 2015 (for production statistics) and UNCTADstat (for trade statistics).
BOX 2. Artisanal and small-scale gold mining (ASGM)
ASGM activities occur in 70 countries worldwide, and contributed to more than 10 per cent of gold production in 2014. They are mainly concentrated in remote areas in sub-Saharan Africa, Latin America as well as East and South-East Asia. ASGM is more labour-intensive than capital-intensive, and provides direct employment to about 15 million people around the world (90 per cent of gold miners are consid-ered to be artisanal and/or small-scale miners, according to the Artisanal Gold Council), while indirectly supporting the livelihoods of 100 million people. Among ASGM workers, about 20 per cent are estimated to be women and children (sometimes younger than 10 years of age).
A large number of ASGM activities worldwide are conducted outside the law, which has huge impacts on the workers, the local environment and local communities. Due to their weak organizational structure, artisanal and small-scale miners have less (or no) access to financing and other support services, and their access to markets is more limited than that large-scale mining operations, with many more intermediaries (figure 15). As they are not governed by national or international regulations, ASGM activities generally have poor social and environmental standards, such as the use of child labour, gender imbalances, air, water and soil pollution through the release of hazardous chemical substances into the environment (e.g. mercury, cyanide), and the creation of smuggling networks leading to unlawful financing of illicit activities, including armed conflicts. This led to the development of a numbers of regulations and guidelines by the United Nations, regional country groupings, individual States and professional associations to ensure that the production of gold, in every sense, complies with humanitarian laws, respects human rights and does not contribute to the financing of armed conflicts. Some examples of these regulations or general guidelines are: Due Diligence Guidance for Responsible Supply Chains of Minerals from Conflict-Affected and High-Risk Areas implemented by the OECD, Section 1502 of the Dodd-Franck Act in the United States of America, Responsible Gold Guidance of the London Bullion Market Association and the Conflict-Free Gold Standard developed within the framework of the World Gold Council. According to UNEP (2015a), at least 40 per cent of all internal conflicts over the past 60 years have been linked to the exploitation of natural resources.

28 COMMODITIES AT A GLANCE - Special issue on gold
Figure16.Distributionofworldgoldsupplybetweenmineproductionandrecycling,asapercentageofworldgold supply(percent)comparedtointernationalgoldprices(dollarspertroyounce),2004−2014
–
250
500
750
1 000
1 250
1 500
1 750
2 000
0102030405060708090
100
2004
2005
2006
2007
2008
2009
2010
2011
2012
2013
2014
US$
per t
roy
ounc
e
Per c
ent
Share of recycling in total gold supply Share of mine production in total gold supplyGold prices, right axis
Source: UNCTAD secretariat, based on UNCTADstat (for gold prices) and Thomson Reuters Eikon (for world mine production and world scrap supply).Note: Data for 2014 are estimates.
Figure 15. Large-scale gold mining versus artisanal small-scale gold mining
10 Miners
30 Miners
5 Miners
LBMA
LBMA
DOMESTIC INTERNATIONAL
ARTISANAL SMALL-SCALE GOLD MINING
LARGE GOLD MINING
Regionbuyer
On-sitebuyer Exporter Trader Refiner
Smelter RefinerLarge mine
Source: Richard et al, 2014.Note: LBMA stands for London Bullion Market Association.

CHAPTER 3 - PRODUCTION 29
According to the World Gold Council, price fluctuations accounted for around 75 per cent of the changes in recycling quantities between 1982 and 2012.27 While the share of recycling in world gold supply was 17 per cent in 1999 with an average annual price of $279 per troy ounce, this percentage jumped to an average 39 per cent between 2008 and 2012 in line with the historical rise of international gold prices, which reached an average of $1,609 per troy ounce over the same period. With the slight improvement of economic conditions since 2012 and the consecutive decrease of international gold prices, the share of recycling in world supply tended to contract, finally reaching 26 per cent in 2014 − its lowest level since 2005. In 2012, the main sources of gold recycling was the United States, followed by Italy, China, India, the United Arab Emirates, Turkey, the United Kingdom, Mexico, Egypt and Indonesia, which together produced more than half of the world total.28
27 World Gold Council, Gold recycling: New report examines the evolving industry that contributes a third of global gold supply, 5 March 2015; at: http://www.gold.org/news-and-events/press-releases/gold-recycling-new-report-examines-evolving-industry-contributes.
28 PricewaterhouseCoopers LLP for the World Gold Council, The direct economic impact of gold, October 2013; at:
While the evolution of gold prices and global economic conditions generate a similar trend in the share of recycling in global gold supply, economic conditions appear to have longer term and stronger impacts on recycling. The impacts of the economic crises are felt by all economic actors across countries, and usually last for a longer period than price changes, which can be momentary.
The prospects for gold recycling appear to be optimistic in the long run, due to the large quantities available for recycling (above-ground stocks) worldwide compared to the ones in underground reserves (about a third), and the fact that gold recycling is more or less unlimited. Moreover, the consumption of technological devices using gold and with shorter life cycles (under 2 years) has been expanding worldwide, offering a growing reservoir for gold recycling. However, recycling gold from this source is highly challenging due to their current low rates of collection, the high-tech requirements of their recycling processes and their low gold content. For instance, it is estimated that a ton of mobile phones contains only 230 grams of recoverable gold (UNEP 2015b).
http://www.pwc.com/en_GX/gx/mining/publications/assets/pwc-the-direct-economic-impact-of-gold.pdf.

CHAPTER 4 - PRICES 31
CHAPTER 4:PRICES


CHAPTER 4 - PRICES 33
1. EVOLUTION OF GOLD PRICES
Since the beginning of gold price quotations on international markets in 1970, those prices have been driven mainly by market fundamentals (see chapters 2 and 3), particularly by changes in demand (e.g. for jewellery and industry applications). This has been the result of the large quantities of above-ground stocks of gold available compared to the average annual mine production, and its limited flexibility in meeting the demand. Exogenous factors, such as the world’s geopolitical and economic environment, and dynamics in the financial sector, such as equity markets, also affect gold prices.
The benchmark price for gold, which is the “99.5% fine, afternoon fixing” quoted in dollars per troy ounce in London (figure 17), is the reference price used in this part of the report.
a. Evolutionofgoldpricesduringthe1970s
After decades of relative stability, gold prices entered a period of large price increases during the 1970s following the termination of the fixed peg of the dollar to gold. From $35 per troy ounce in 1970, as stipulated under the Bretton Woods Agreement, gold prices successively increased, to $162 in 1975 and $613 in 1980. Prices almost doubled between 1979 and 1980. Thereafter, they were mainly supported by the international economic context, and more specifically, by the recession resulting from the oil
crises of 1973 and 1979 and by high inflation and unemployment rates. Between 1970 and 1980, the United States inflation rate averaged almost 8 per cent per annum. This period was also characterized by major geopolitical uncertainties, particularly the Iranian revolution, the end of the war in Viet Nam and the beginning of instability in Afghanistan, among others. In 1974, four decades after the decision banning American citizens from owning gold, United States President Gerald Ford overturned the ban. And in January 1976, the Jamaica Agreement was ratified, creating the free-floating exchange rate system.
b. Evolutionofgoldpricesbetween1980and 2000
During the next two decades (1981−2000), gold prices followed a downward trend. This was mainly due to the end of the economic crisis of the 1970s and the progressive control of inflation. For instance, the United States annual consumer price index dropped to an average annual rate of 4.7 per cent over the 1980s and to 2.8 per cent in the 1990s. At the same time, gold mine production rapidly increased with an average growth of 3.9 per cent per annum between 1980 and 2000 (about 2.5 times its pace since the beginning of the twentieth century). This growth was mostly supported by large mining developments in Australia, Canada and the United States. Over the period, gold mine production more than doubled worldwide. These two decades were
Figure17.Historicalevolutionofnominalandrealgoldprices,1970−2014(dollarspertroyounce,baseyear:2010)
0
250
500
750
1 000
1 250
1 500
1 750
2 000
1970
1972
1974
1976
1978
1980
1982
1984
1986
1988
1990
1992
1994
1996
1998
2000
2002
2004
2006
2008
2010
2012
2014
Nominal gold prices Real gold prices
Source: UNCTAD secretariat based on UNCTADstat (nominal gold prices) and IMF, International Financial Statistics database (consumer price index, United States of America, accessed 8 June 2015). Note: Real gold prices are based on United States inflation rate (i.e. consumer price index, all items, city average), IMF, Inter-national Financial Statistics database.

34 COMMODITIES AT A GLANCE - Special issue on gold
also characterized by a net selling position adopted by central banks, mainly in Europe. This is considered to have been a major factor affecting gold prices over this period, and it led to the first CBGA in 1999. The period ended when Switzerland became the last country to abandon the pegging of its currency to gold in 2000.
c. Evolution of gold prices since the beginning of the 2000s
From 2001 to 2012, gold prices recorded a historical price rise, gaining about six times their nominal value of 2001 (about 4.5 times in inflation-adjusted terms) to reach an average of $1,670 in 2012. This massive price rise was just 2 per cent lower than their record level of 1980 in real terms. The rise was supported by strong physical market conditions, with gold mine production contracting between 2000 and 2008 (by 11 per cent). This was mainly due to low gold prices during the previous period and the progressive deterioration of ore grades worldwide. In addition, due to the worsening global economic conditions since 2008, the share of gold acquired as a financial asset started to supplant the demand for jewellery and industrial applications. This had a positive impact on prices, which started to rise again. For example, demand associated with exchange traded funds (ETFs) jumped from 253 tons in 2007 to 623 tons two years later. At the same time, demand for bars and coins more than doubled between 2007 and 2008. While the change in ETFs was short-lived, growth in physical demand for bars and coins remained robust up to 2013, when this sector reached a record level of 1,772 tons − an increase of more than 300 per cent compared with 2007.
Since the beginning of the financial and economic crisis in 2008, the United States, followed by the United Kingdom, Japan and, more recently, the EU, initiated a number of quantitative easing programmes aimed at increasing money supply, as well as supporting domestic demand and spending by households and companies. This unorthodox monetary policy, with its potential inflationary and currency devaluation risks, contributed to attracting a new wave of investors into the gold market (figure 18) that considered gold to be a more attractive and secure asset when other financial investments took a dive. For instance, between the first quarter of 2008 and the second quarter of 2015, 10-year bonds lost 97 per cent of their yield in Germany, 54 per cent in the United States and about 75 per cent in Japan.29
29 Thomson Reuters Eikon.
Since 2010, central banks have become net buyers of gold after more than two decades as net sellers, mainly driven by large purchasing programmes initiated by emerging market economies’ central banks, as well as a reluctance by European countries’ central banks to sell their gold reserves (chapter 2). This too has influenced the general trend in gold prices.
The highs in gold prices up to the end of 2012 have been compared to the price boom of the 1970s. However, even though the pre-2012 nominal gold prices sharply exceeded the levels of the 1970s, in real terms they remained below their levels of the 1970s. Moreover, price volatility during the period 2002−2012 remained far lower than in the 1970s (figure 19a). For instance, while the average monthly change in gold
Figure 18. How quantitative easing affects gold prices
Short-term interestrates close to zero
Commercialbanks can
keepextra-moneyin reserves
Purchase of corporatebonds by central banks
Increase the lending capacityof commerial banks to
households and corporations
Can result in thedollar losing value
Investors sellUS dollars
INCREASEMONEY SUPPLY
INVESTORS BUY GOLDGENERATING AN INCREASE
IN GOLD PRICES
Source: UNCTAD secretariat.

CHAPTER 4 - PRICES 35
prices was 2.4 per cent between 1970 and 1980, this percentage dropped to 1.5 per cent between 2002 and 2012. Furthermore, extreme changes were more significant during the 1970s than the 2000s, with several monthly growth rates exceeding 15 per cent during the 1970s.
year, gold prices peak during the seven months from August to February. This period starts with the beginning of a major festival in India in August, followed by the wedding season in the country (September to January), and then the New Year celebrations in China (January and February). These events are recurrent and generally explain the increase in gold prices during these periods.
2. GOLD PRICES AND IMPACTS ON PRODUCING COUNTRIES
The sharp rise in gold prices in dollars on international markets, has not necessarily translated into a similar growth in the prices received by producing countries, notably as a result of the depreciation of their national currencies against the dollar. Moreover, the rise of other commodity prices worldwide, particularly energy, led to a fourfold increase in production costs in the gold industry between 2002 and 2012. This also negatively affected revenues received by producing countries. For instance, while international gold prices increased by 275 per cent between 2005 and 2012, in Ghana, revenues from gold rose by only 90 per cent.
Apart from gold export earnings, producing countries also receive revenues from their gold sector through the collection of taxes and royalties. For instance, according to the World Gold Council (2011), “the [Peruvian gold] sector contributed an average 14% to government revenues between 2000 and 2010 (whereas its GDP contribution was 6%)”. As a result of the recent increases in gold prices, some producing countries, especially in Africa, have decided to revise their national mining codes in order to benefit more from their extractive sector. The example of Burkina Faso is particularly interesting in this regard. In 2003, Burkina Faso instituted a minimum ad valorem royalty tax rate of 3 per cent on precious metals extraction. This rate is the most commonly applied throughout Africa. However, in Burkina Faso, this minimum rate has been pegged to gold prices, and increases following the rise in gold prices (table 11). Gajigo et al. (2012a) indicate that “royalties, as a share of production cost, are small in Africa… [and that] the level at which royalties, as a share of costs, begins to have a significant effect on mine profit is far above the prevailing average rate in Africa”. Moreover, as noted by these authors, producing countries also receive revenues through their taxation of corporate incomes. In Africa, for instance, this tax averaged 32 per cent.
Figure19a. Averagemonthlychangeintheprice ofgold,1970-2014(percent)
Figure19b. Seasonalityofgoldprices,2000-2014 (monthly percentage change)
-4
-2
0
2
4
6
8
1970
1973
1976
1979
1982
1985
1988
1991
1994
1997
2000
2003
2006
2009
2012
-1.0
-0.5
0
0.5
1.0
1.5
2.0
2.5
Janu
ary
Febr
uary
Mar
ch
April
May
June
July
Augu
st
Sept
embe
r
Octo
ber
Nove
mbe
r
Dece
mbe
r
-4
-2
0
2
4
6
8
1970
1973
1976
1979
1982
1985
1988
1991
1994
1997
2000
2003
2006
2009
2012
-1.0
-0.5
0
0.5
1.0
1.5
2.0
2.5
Janu
ary
Febr
uary
Mar
ch
April
May
June
July
Augu
st
Sept
embe
r
Octo
ber
Nove
mbe
r
Dece
mbe
r
Source: UNCTAD secretariat, based on UNCTADstat.
Source: UNCTAD secretariat, based on UNCTADstat.
Gold prices started to decline from October 2012. In August 2015, the value of gold had lost about 35 per cent of its October 2012 value, reaching its lowest price since April 2010. This decline is mainly attributed to economic recovery in the United States, which pushed investors to switch to dollar-denominated assets. Moreover, gold prices also largely suffered from an appreciation of the dollar compared to other major currencies and the euro.
Gold also displays marked seasonal behavior as can be seen from figure 19b. For an average

36 COMMODITIES AT A GLANCE - Special issue on gold
Country Nameofthemineraltax Rate BasisArgentina Provincial mining royalties 3% Mine head value
Australia State royalties 0%−2.5% Volume of minerals extractedBotswana Mining royalty 5%Brazil Compensation for the Exploitation of Mineral
Resources (CFEM)1% Adjusted revenue
Burkina Faso Mining royalty Min. 3%4% ($1 000−$1 300 )
5% (> $1 300 )
Effective rate varies positively with gold prices (ranges are indicated between parenthesis)
Cameroon Mining royalty 2.5%Canada Quebec mining tax 16% Adjusted profit before tax (PBT)Canada British Columbia mining tax 2%-13% Adjusted PBTCanada Ontario mining tax 5%-10% Adjusted PBTCentral African Republic
Mining royalty 3%
Chile Specific mining tax 0%-14% Adjusted PBT China Resource tax RMB 1.5−RMB 7 per ton Units produced (weight)China Compensation for mineral resource 0.5%−4.0% TurnoverChina Royalty fee for exploration right and
exploitation rightYears 1, 2 and 3: RMB 100
From year 4: + RMB 100 per yearCeiling of RMB 500
Mining area (per annum per km²)
Côte d’Ivoire Mining royalty 3%Democratic Republic of the Congo
Mining royalty 2.5% Adjusted revenue
Congo Mining royalty 5% Market valueGabon Mining royalty 3%−7% As a function of the difficulty of the
projectGhana Mining royalty 5% TurnoverGuinea Mining royalty 5%India Mining royalty 2% Units produced
India Deadrent INR 4,000/ha Area of mine Indonesia Government royalty 3.75% Turnover Kazakhstan Mining extraction tax 5% Value of mineralsLiberia Mining royalty 3% - 10% Mali Mining royalty 3%Mauritania Mining royalty 4%Morocco Mining royalty 3%Namibia Mining royalty 3%Niger Mining royalty 5.5%Peru Mining royalty 1%-12% PBTPeru Special mining tax 2%−8.4% PBTPeru Special mining contribution 4%−13.12% PBTPhilippines Excise tax 2% Market valuePhilippines Royalties to mineral reservations Min 5% Market valuePhilippines Royalties to indigenous cultural communities As agreed Min. of 1% gross outputRussian Federation Mining resources extraction tax 6% Value or quantity of extracted
mineral resources Senegal Mining royalty 3%Sierra Leone Mining royalty 5%South Africa Mining and Petroleum Resources Royalty
(MPRD)0.5% - 5% Adjusted revenues
Ukraine Charge for use of subsoil and pollution tax UAH 15.98/ton extracted Units producedUganda Mining royalty 3%United Republic of Tanzania
Mining royalty 4% Market value
United States of America
Federal Land Royalty 0% Turnover
United States of America
Nevada Net Proceeds Tax 2%−5% Adjusted PBT
United States of America
Other State severance taxes 2%−5% Adjusted PBT
Zambia Mining royalty 5%Source: UNCTAD secretariat based on PricewaterhouseCoopers, 2012, and Gajigo et al., 2012b.
Table11. Mineraltaxongoldmineproductioninproducingcountries,asofJanuary2012

CHAPTER 4 - PRICES 37
As taxes and royalties contribute to government revenues, they could also be used by producing countries as a tool to limit the environmental and social costs generated by gold mining operations. In Ghana, for example, surface mining is the root cause of the destruction of most of the rainforest (88 per cent), and such potentially irreversible damage can considerably reduce the biodiversity and have an adverse impact on food security (Akpalu and Parks, 2007). For instance, rural populations living in rainforest areas in Ghana derive three quarters of their consumption of proteins from bush meat, while this percentage reaches 80−90 per cent in Liberia, according to the Food and Agriculture Organization of the United Nations (FAO, undated). Moreover, rainforests are also a large source of drinking water. As a solution, Akpalu and Parks (2007) propose the introduction of a flexible ad valorem severance tax on gross revenues adjustable to the depletion of the rainforest stock. Indeed, Ghana is losing out if the environmental damage caused by gold mining is incorporated in the calculation of the net income
derived from gold in the country. Internalizing these costs would imply a much higher tax on gold.
While gold prices are expected to remain low in the coming months, it is highly likely that population and demand growth as well as the general improvement in the standard of living, mainly in China and India, will contribute to supporting gold prices over the long term.
Just as the price boom of the 2000s resulted in the expansion of gold mining activities worldwide and led to the development of new operations with higher production costs, it is highly likely that the current downward trend in gold prices will lead to the closure of non-profitable producing facilities, which may also contribute to rebalancing supply and demand in the years to come and help support gold prices.
Gold demand has tended to increase with economic and financial uncertainties. As the economic situation is gradually improving in the United States and stabilizing in Europe, the situation in the gold market may improve in the foreseeable future.

CHAPTER 4 - PRICES 39
CHAPTER 5:CONCLUSIONS

CHAPTER 5 - CONCLUSIONS 41
Mining is a foundation industry and the gold industry is of particular importance for the economies of a large number of countries in Africa, Asia and Latin America. For Burkina Faso, Guyana, Mali and Suriname, for instance, gold exports fetched the largest revenues in 2012−2013, accounting for more than 40 per cent of their total merchandise export revenues. However, some exporting countries were not able to take advantage of the recent rise in gold prices to reduce their poverty and generate substantial resources to finance their development programmes. The following are among the major challenges facing gold-producing countries in this respect: (1) a lack of transparency and poor governance in the mining sector, (2) the potential short-term and long-term negative impacts of the gold industry on the environment and local populations, and (3) the volatility and unpredictability of gold revenues.
1. IMPROVING GOVERNANCE AND ENHANCING MARKET TRANSPARENCY
Poor governance, a lack of transparency, a weak regulatory framework and lack of monitoring are among the main challenges affecting the development of the gold sector in developing countries. These elements tend to be highly damaging in terms of lost government revenues, but also, and more importantly, in terms of political and social stability and development. Chapter 3 of this report noted that the prevalence of illegal gold production and smuggling can lead to the financing of armed conflicts leading to political and social unrest. Poor monitoring of the gold sector also tends to be associated with poor social practices, such as the use of child labour, widening inequalities between men and women, and numerous cases of breaches of human rights, among others. In order to deal with these issues:
• Governments should define long-term sound and predictable strategies and policies aimed at creating an enabling business environment and enhancing development linkages.
• Resource-rich countries, mining firms, consuming countries, civil society, and final consumers should pool their efforts to ensure that gold revenues contribute to the sustainable development of developing countries.
• All stakeholders should ensure that gold production adheres to the principles of
respecting human rights, prohibiting child labour and promoting gender equality; it should not contribute to local instability. The Kimberley process30 developed for preventing trade in “conflict diamonds” could be of interest in regions where gold production and trade have been observed to contribute to the financing of armed conflicts.
2. ENSURING THE USE OF ENVIRONMENT-FRIENDLY PRACTICES
While large-scale gold mining operations are making considerable efforts to eliminate the use of mercury and reduce the use of cyanide to minimum levels in gold extraction, such hazardous substances continue to be widely used in small-scale artisanal operations, where they have negative impacts on local populations and the environment:
• Governments, local authorities, mining companies and civil society should ensure that the extraction of gold does not damage the environment during the life cycles of the mining activities. This may entail the participation of local communities in the decision-making process.
• Governments should abolish the use of mercury in their countries, and ensure that the use of cyanide follows the best practices available.
• The international community should promote market transparency in the gold value chain, and, more particularly, disseminate information on how best to avoid the negative effects of mercury and cyanide on local populations and the environment, among others. This is particularly relevant for artisanal and small-scale mining.
3. SECURING HIGHER REVENUES FROM GOLD PRODUCTION
The volatility of international prices of gold is one of the major issues the sector has to deal with worldwide. Since the beginning of the 1970s, gold prices have experienced a series of booms and busts, resulting in unpredictable revenues received by gold-producing developing countries. This volatility affects planning for medium- and long-term development.
Devising solutions to this problem should take into account the current context of rising operating
30 See: www.kimberleyprocess.com/en/faq

42 COMMODITIES AT A GLANCE - Special issue on gold
costs, contraction of gold reserves worldwide and a general degradation of gold ore grades. Moreover, it is essential for developing countries to put in place institutions that will help them to manage better the revenues they receive from gold, be they export earnings, mining taxes or royalties.
• Local authorities and investors should ensure that statistical information concerning revenues
received from taxes and mining royalties is made public in order to foster transparency.
• Local authorities should put in place strong, reliable and effective institutions to deal with the monitoring of the gold value chain in their country and to manage, with due diligence, the revenues received from gold production and trade.
CHAPTER 4 - PRICES 43
REFERENCES


REFERENCES 45
Akpalu W and Parks PJ (2007). Natural resource use conflict: Gold mining in tropical rainforest in Ghana. Environment and Development Economics,12 (01): 55−72. Available at: http://dx.doi.org/10.1017/S1355770X0600338X.
Bordo MD and Eichengreen B (1988). The rise and fall of a barbarous relic: The role of gold in the international monetary system. NBER Working Paper No. 6436, Cambridge, MA. Available at: http://www.nber.org/papers/w6436.
Boston Consulting Group and World Gold Council (2015). The Ups and Downs of Gold Recycling: Understanding Market Drivers and Industry Challenges. http://www.gold.org/supply-and-demand/ups-and-downs-gold-recycling.
British Geological Survey (2015). World Mineral Production 2009−2013. Nottingham. Available at: http://www.bgs.ac.uk/mineralsUK/statistics/worldStatistics.html
Butterman WC andAmey, EB III (2005). Mineral Commodity Profiles − Gold. Reston, VA, United States Geological Survey. Available at: http://pubs.usgs.gov/of/2002/of02-303/OFR_02-303.pdf
Capie F, Mills TC and Wood G (2004). Gold as a hedge against the US dollar. London, World Gold Council. Available at: https://www.gold.org/research/gold-hedge-against-us-dollar
Denver Mineral Engineers, Inc. (undated). The basic processes of gold recovery. Available at: http://www.denvermineral.com/gold-mining-process-development/
Dorgan G (2015). The six major fundamental factors that determine gold and silver prices. Available at: http://snbchf.com/gold/gold-and-silver-prices/.
FAO (undated). Bushmeat sourcebook. Rome. Available at: http://www.fao.org/forestry/wildlife-partnership/bushmeat-sourcebook/87946/en/
Gajigo O, Mutambatsere E and Ndiaye G (2012a). Gold mining in Africa: Maximizing economic returns for countries. Working paper no. 147, African Development Bank Group, Tunis. Available at: http://www.afdb.org/fileadmin/uploads/afdb/Documents/Publications/WPS%20No%20147%20Gold%20Mining%20in%20Africa%20Maximizing%20Economic%20Returns%20for%20Countries%20120329.pdf.
Gajigo O, Mutambatsere E and Ndiaye G (2012b). Royalty rates in African mining revisited: Evidence from gold mining. Africa Economic Brief, 3(6):1−11. African Development Bank, Tunis. Available at: http://www.afdb.org/fileadmin/uploads/afdb/Documents/Publications/AEB%20VOL%203%20Issue%206%20avril%202012%20Bis_AEB%20VOL%203%20Issue%206%20avril%202012%20bis_01.pdf.
Knosp H, Holliday RJ and Corti CW (2003). Gold in dentistry: Alloys, uses and performance. Gold Bulletin, 36(3): 93.
Létourneau A (2014). World’s largest gold producing countries: Australia. Kitco News. Available at: http://www.kitco.com/news/2014-06-17/Worlds-Largest-Gold-Producing-Countries-Australia.html.
Létourneau A (2014). World’s largest gold producing countries: China. Kitco News. Available at: Available at: http://www.kitco.com/news/2014-06-16/Worlds-Largest-Gold-Producing-Countries-China.htm.l
Létourneau A (2014). World’s largest gold producing countries: Russia. Kitco News. Available at: http://www.kitco.com/news/2014-06-18/Worlds-Largest-Gold-Producing-Countries-Russia.html.
Létourneau A (2014). World’s largest gold producing countries: South Africa. Kitco News. Available at: http://www.kitco.com/news/2014-06-20/Worlds-Largest-Gold-Producing-Countries-South-Africa.html.
Létourneau A (2014). World’s largest gold producing countries: United States. Kitco News. Available at: http://www.kitco.com/news/2014-06-19/World-Largest-Gold-Producing-Countries-United-States.html.
Minerals Council of Australia (2013). 6 challenges facing the gold sector − Gold Fields. Available at: http://www.mineweb.com/archive/6-challenges-facing-the-gold-sector-gold-fields/.

46 COMMODITIES AT A GLANCE - Special issue on gold
Minerals Council of Australia (undated). Australia’s gold industry: A valuable asset. Forrest, ACT. Available at: http://www.minerals.org.au/file_upload/files/resources/gold/Australia%27s_Gold_Industry_a_valuable_asset.pdf.
Moison M and Blanchard F (2013). Utilisation de la cyanuration dans l’industrie aurifère en Guyane : impacts potentiels sur l’environnement et recommandations. Etude réalisées dans le cadre des projets de service public du BRGM. Rapport final BRGM/RP-61986-FR. Available at: http://infoterre.brgm.fr/rapports/RP-61968-FR.pdf.
Official Monetary and Financial Institutions Forum and World Gold Council (2013). Gold, the renminbi and the multi-currency reserve system. London. Available at: https://www.gold.org/sites/default/files/documents/gold_renminbi_multi-currency_reserve_system.pdf.
Oxford Economics (2011). The impact of inflation and deflation on the case for gold. Paper commissioned by the World Gold Council, London. Available at: https://www.gold.org/sites/default/files/documents/gold-investment-research/the_impact_of_inflation_and_deflation_on_the_case_for_gold.pdf
PricewaterhouseCoopers (2013). The direct economic impact of gold. Report produced for the World Gold Council, London. Available at: http://www.pwc.com/en_GX/gx/mining/publications/assets/pwc-the-direct-economic-impact-of-gold.pdf.
PricewaterhouseCoopers (2012). Corporate income taxes, mining royalties and other mining taxes − A summary of rates and rules in selected countries. Available at: https://www.pwc.com/en_GX/gx/energy-utilities-mining/publications/pdf/pwc-gx-miining-taxes-and-royalties.pdf.
Reuters (10 February 2015). Gabon’s new mining code to boost investments, state share in deals. Available at: https://uk.finance.yahoo.com/news/gabons-mining-code-boost-investments-155046723.html.
Richard M, Moher P and Telmer K (2014). Health issues in artisanal and small-scale gold mining: Training for health professionals (version 1.0). Victoria, BC, Artisanal Gold Council. Available at: http://www.unep.org/chemicalsandwaste/Portals/9/Mercury/Documents/ASGM/Health_Training_Oct2014_version1.0_eng_lowQ.pdf
Telmer K (2014). Améliorer le secteur artisanal de l’or de la RDC par la réduction de l’utilisation de mercure comme point d’entrée. Artisanal Gold Council, Promines, World Bank and UKaid. Available at: http://www.artisanalgold.org/publications/presentations.
Thomson Reuters GFMS (various). Gold Survey (various issues). Available at: https://forms.thomsonreuters.com/gfms/.
UNEP (2011a). Global Forum on Artisanal and Small-scale Gold Mining: Final report. Nairobi. Available at; http://www.unep.org/chemicalsandwaste/GlobalForumonASGM/tabid/6005/Default.aspx.
UNEP (2011b). Reducing mercury use in artisanal and small-scale gold mining. Nairobi. Available at: http://www.unep.org/hazardoussubstances/Portals/9/Mercury/Documents/ASGM/Techdoc/LAST%20VERSION%20UNEP_Technical_Document__DEC_31_E%5B1%5D.pdf.
UNEP (2012). Analysis of formalization approaches in the artisanal and small-scale gold mining sector based on experiences in Ecuador, Mongolia, Peru, Tanzania and Uganda: A compendium of case studies. Nairobi. Available at: http://www.unep.org/chemicalsandwaste/Portals/9/Mercury/Documents/ASGM/Formalization_ARM/Case%20Studies%20Compendium%20June%202012.pdf.
UNEP (2013a). Global Mercury Assessment 2013: Sources, Emissions, Releases and Environmental Transport. UNEP Chemicals Branch, Geneva, Switzerland. Available at: http://www.unep.org/publications/contents/pub_details_search.asp?ID=6282
UNEP (2013b). Mercury: Time to act. Nairobi. Available at: http://www.unep.org/PDF/PressReleases/Mercury_TimeToAct.pdf.
UNEP (2013c). Minamata Convention on Mercury. Nairobi. Available at: http://www.mercuryconvention.org/Portals/11/documents/Booklets/Minamata%20Convention%20on%20Mercury_booklet_English.pdf.

REFERENCES 47
UNEP (2015a). Addressing the Role of Natural Resources in Conflict and Peacebuilding - A Summary of Progress from UNEP’s Environmental Cooperation for Peacebuilding Programme, 2008 - 2015 http://www.unep.org/disastersandconflicts/Introduction/EnvironmentalCooperationforPeacebuilding_/ECPProgressReport/tabid/1060787/Default.aspx
UNEP (2015b). Waste or Wealth: Keeping in Touch Need not Cost the Earth. Nairobi.
USGS (various). Mineral commodity summaries − Gold. Reston, VA. Available at: http://minerals.usgs.gov/minerals/pubs/commodity/gold/.
USGS (various). Minerals Yearbook - Gold (various issues). Reston, VA. Available at: http://minerals.usgs.gov/minerals/pubs/commodity/gold/.
WHO (2005). Mercury in health care, Policy paper, Geneva. Available at: http://www.who.int/water_sanitation_health/medicalwaste/mercurypolpap230506.pdf?ua=1.
WHO (2013a). Exposure to mercury: A major public health concern. Geneva. Available at: http://www.who.int/phe/news/Mercury-flyer.pdf
WHO (2013b). Fact sheet 361: Mercury and health. Geneva, September. Available at: http://www.who.int/mediacentre/factsheets/fs361/en/.
WHO (2013c). Preventing disease through healthy environments: Mercury exposure and health impacts among individuals in the artisanal and small-scale gold mining (ASGM) Community. Geneva. Available at: http://www.who.int/ipcs/assessment/public_health/mercury_asgm.pdf.
World Gold Council (2009).The golden building block: Gold mining and the transformation of developing economies. London. Available at: https://www.gold.org/research/golden-building-block-%E2%80%93-gold-mining-and-transformation-developing-economies.
World Gold Council (2010a). China gold report: Gold in the Year of the Tiger. London. Available at: https://www.gold.org/research/china-gold-report-gold-year-tiger.
World Gold Council (2010b).The evolution in central bank attitudes toward gold. London.
World Gold Council (2011a). Liquidity in the global gold market. London. Available at: https://www.gold.org/research/liquidity-global-gold-market.
World Gold Council and World Bank (2011b). Gold for development. Conference summary. London. Available at: https://www.gold.org/research/gold-development-conference-summary.
World Gold Council (2011c). The evolving structure of gold demand and supply. London. Available at: https://www.gold.org/research/evolving-structure-gold-demand-and-supply.
World Gold Council (2011d). The economic contribution of large-scale gold mining in Peru, second edition. London. Available at: http://www.gold.org/research/economic-contribution-large-scale-gold-mining-peru-second-edition.
World Gold Council (2011e). Gold: alternative investment, foundation asset. London.
World Gold Council (2012a). Gold: a commodity like no other. London. Available at: https://www.gold.org/research/gold-commodity-no-other.
World Gold Council (2012b). Norme sur l’or libre de conflit. London. Available at: http://www.gold.org/sites/default/files/documents/Conflict_Free_Gold_Standard-Fr.pdf.
World Gold Council (2012c). Conflict-free gold standard. London. Available at: http://www.gold.org/sites/default/files/documents/Conflict_Free_Gold_Standard_English.pdf
World Gold Council (2013a). Extraction responsable de l’or et distribution de la valeur: ne appréciation globale de la valeur économique créée et distribuée par les membres du World Gold Council. London. Available at: http://www.gold.org/research/extraction-responsable-de-l%E2%80%99or-et-distribution-de-la-valeur.

World Gold Council (2013b). Guidance note on non-GAAP metrics: All-in sustaining costs and all-in costs. London. Available at: http://www.gold.org/research/guidance-note-non-gaap-metrics-%E2%80%93-all-sustaining-costs-and-all-costs.
World Gold Council (2013c). Gold and US interest rates: A reality check. London. Available at: https://www.gold.org/research/gold-and-us-interest-rates-reality-check
World Gold Council (2013d). Central banks’ diversification strategies: Rebalancing from the dollar and euro. London. Available at: https://www.gold.org/sites/default/files/documents/Central_bank_diversification_strategies_paper.pdf.
World Gold Council (2014a). Responsible gold mining and value distribution. London. Available at: http://www.gold.org/gold-mining/economic-contribution/value-distribution.
World Gold Council (2014b). Understanding China’s gold market. London. Available at: http://www.gold.org/research/understanding-chinas-gold-market
World Gold Council (2015). Gold recycling. Press release: New report examines the evolving industry that contributes a third of global gold supply, London. Available at: http://www.gold.org/news-and-events/press-releases/gold-recycling-new-report-examines-evolving-industry-contributes.
World Gold Council (various). Gold Demand Trends (various quarterly issues). http://www.gold.org/supply-and-demand/gold-demand-trends.
World Gold Council (various), Gold Investor (various issues). London. Available at: http://www.gold.org/investment/gold-investment-research/gold-investor.

CHAPTER 4 - PRICES 49
APPENDIX 1:THE METALLURGY OF GOLD


APPENDIX 1 - THE METALLURGY OF GOLD 51
1. LEACHING
The first step in gold processing is known as leaching. Assuming that gold appears as an oxide, and depending on the gold content in host rocks, leaching can be achieved by: (i) heap leaching for low-grade ores, or (ii) tank leaching for high-grade ores. Both these processes rely on the use of sodium cyanide (NaCN) to extract gold. In fact, according to Elsner’s equation,31 cyanide and gold form a complex, which can ease the recovery of the latter.
Based on its cost advantage and its efficiency, and despite its potential damaging impacts on local populations and the environment, the cyanidation process developed at the end of the nineteenth century is still the main process used in the world for gold extraction (about 90 per cent of all gold extracted).32 Usually, between 300 mg/l and 500 mg/l of cyanide are necessary to extract gold efficiently depending on the type of ore treated, but this quantity may reach 2,000 mg/l in some cases.
a. Heap leaching
Heap leaching, which was introduced in 1969, involves spraying a dilute alkaline solution of sodium cyanide (pH 10−11) uniformly on the top of a heap of gold ore. The homogeneity of the heap and its permeability are key success criteria for gold extraction. Strict control of the pH level of the cyanide solution is also extremely important: below pH 10, the consumption of cyanide will increase and above pH 11, gold recovery will decrease. During the operation, the solution percolates through the ore to the bottom of the heap, where the pregnant solution containing gold is collected through a drainage system and further processed. The resulting barren solution with cyanide added to it is reinjected onto the heap or sent to tailing storage facilities. The potential danger posed by this type of leaching process requires the careful configuration of leaching facilities (e.g. analysis of local meteorological conditions, probability of heavy rainfall and the use of impervious geomembranes).
31 Elsner’s equation: 4 Au + 8 CN- + 02 + 2H2O = 4 Au(CN)2- + 4OH (see: International Cyanide Management Code, at: http://www.cyanidecode.org/cyanide-facts/use-mining).
32 Despite this general use by the gold sector, this industry only accounts for 6 per cent of the 1.1 million tons of the cyanide produced every year (International Cyanide Management Code (undated). Cyanide use in mining. Available at: http://www.cyanidecode.org/cyanide-facts/use-mining).
Heap leaching is time-consuming (from a few weeks to several months) and recovery rates are low (generally between 40 per cent and 85 per cent).33 However, this method can be used to treat lower grade gold ores, as it offers a less costly solution than tank leaching, thus greatly contributing to the development of mines worldwide where low grade geological resources are found. Moreover, as heap leaching can be undertaken on run-of-mine ores or on more coarsely crushed ores, the grinding phase is less costly than for tank leaching.
b. Tank leaching
Gold ore is ground into a fine powder (also known as pulp or slurry) to increase the exposure of gold particles and facilitate their recovery. Oversized pieces may be removed by screening and ground again. Gold ores can also be concentrated by gravity in order to recover native gold before processing. If gold ores are not permeable enough (e.g. having a high clay content), lime may be added to ease the operation. The agglomeration with lime will also ensure that the alkalinity of the solution remains between pH 10 and 1134 to prevent the formation of hydrogen cyanide gas (HCN), which is poisonous, extremely flammable, and can become explosive when in contact with air.35 The slurry is then loaded into a series of leaching agitated tanks and flooded with a cyanide solution. Oxygen is also injected to improve the environmental conditions for gold recovery.
Tank leaching entails high capital and operating costs. This is why it is only used to process ores with high gold content (more than 20 grams of gold per ton). However, it is also a fast processing method (24-48 hours on average) and offers high recovery rates (about 90 per cent).
OUTPUT: CYANIDE LEACHATE
2. GOLD RECOVERY
Gold may be recovered from cyanide leachate using the Merrill Crowe (MC) process or one of the gold adsorption techniques. Both processes can be used
33 Techniques de l’ingénieur, La métallurgie de l’or, 10 June 2006; available at: http://www.techniques-ingenieur.fr/base-documentaire/materiaux-th11/elaboration-et- recyclage-des-metaux-non-ferreux-42370210/metallurgie-de-l-or-m2401/.
34 According to some sources, the alkalinity may range from pH 9.5 to pH 13.
35 It is colourless, with a recognizable smell of bitter almonds that not all individuals are able to detect.

52 COMMODITIES AT A GLANCE - Special issue on gold
separately or successively with carbon adsorption used first, followed by the MC process.
a. Merrill Crowe process
Also known as zinc dust cementation or zinc dust precipitation, the MC process was first introduced at the end of the nineteenth century. It is particularly suitable for gold with a high silver content. It is one of the most common methods used for gold recovery from pregnant cyanide solution. It is based on the fact that gold and silver are more noble metals than zinc.
The MC process involves four steps: (i) As the presence of solids in the leachate is likely to reduce the efficiency of the process and could therefore have a negative impact on gold recovery, the cyanide solution is first clarified (filtered). This step is particularly important after heap leaching, as it generates more solids than any other leaching technique. Filtration is done using media filters by counter-current filtration circuits or counter-current decantation. Specific filters may sometimes be used (pre-coated with diatomaceous earth) depending on the particular turbidity of the solution. (ii) The dissolved oxygen contained in the pregnant solution is then removed using vacuum pumps. This phase is called vacuum deaeration (or deoxygenation). (iii) Zinc powder is then added to precipitate the gold content. Lead salts in small quantities may also be added to accelerate the process by activating zinc particles. However, lead addition should remain limited as too high a content (>20 ppm) could generate an increase of zinc consumption. (iv) Gold precipitate and other particles are filtered out of the solution and sent for electrowinning.
OUTPUT: GOLD PULP
b. Adsorption on activated carbon
Carbon-in-column (CIC)
After the heap leaching step, the cyanide leachate is processed preferably using carbon-in-column (CIC) technology (also called “expanded carbon bed”). This method offers the possibility to treat solutions with high solid contents, which is often the case when gold is primarily heap-leached, as ores are coarsely ground or not crushed at all.
The pregnant solution circulates through a series of tall columns fuelled with activated carbon (most frequently made from coconut shells) and the gold is adsorbed onto the surface of the carbon. The solution flows upwards to the following column which is generally
located lower than the previous one. The organization of the CIC in this kind of step fashion contributes to a reduction of the costs of production by eliminating the need to resort to a pumping system. The loaded carbon is periodically removed from the columns and stripped.
Carbon-in-pulp (CIP)
When activated carbon granulates are added as a separate step after the leaching, the process is known as carbon-in-pulp (CIP). Here, the pulp flows through a series of agitated vessels (generally 6) with activated carbon introduced at the tail end and the pulp containing gold loaded at the other end. Both the activated carbon and the slurry flow counter-current, and relying on the natural affinity between gold and carbon, gold is gradually adsorbed onto the carbon. The loaded carbon is filtered between each tank using coarse screens.
Carbon-in-leach (CIL)
When granular activated carbon is added in agitated tanks during the leaching phase, the dissolved gold contained in the solution gets directly adsorbed onto the carbon particles. The CIL process is mostly used when native carbon is already present in the ore. The adjunction of more active carbon in the tank (than the one already present naturally) will encourage the gold to preferentially load onto the new added carbon particles.
OUTPUT: GOLD-LOADED CARBON
3. ELUTION (STRIPPING OR DESORPTION)
The elution (also known as stripping or desorption) process aims to reverse gold adsorption onto activated carbon. Several techniques exist, two of the most commonly used being Zadra stripping and Anglo American Research Laboratories (AARL) stripping.
a. Zadra stripping
Developed in the early 1950s, the Zadra elution process is based on the principle of the flooding of activated carbon at atmospheric pressure with a water-based solution containing 1 per cent sodium hydroxide (NaOH) and 0.1 per cent to 0.3 per cent sodium cyanide (NaCN) at a temperature of 200°F (93°C).
Zadra is probably the easiest and the least expensive process to implement, but also gives the lowest yields
APPENDIX 1 - THE METALLURGY OF GOLD 53
and is the most time-consuming, as the operation may take two to three days. The process can be accelerated using higher temperatures of about 275°F (135°C) in pressure stripping columns (400kPa to 500kPa). Accordingly, the “pressure Zadra process” can be reduced to half a day.
After elution, the barren solution can be recycled and reused.
b. Anglo American Research Laboratories (AARL) stripping
AARL technology has been used by the gold industry since 1980. In this process, the loaded activated carbon is treated in pressure stripping columns, where it is successively wetted with a solution of 1 per cent of sodium hydroxide (NaOH) and 3 per cent of sodium cyanide (NaCN). It is then eluted through successive baths of deionized water and heated at a temperature of about 240°F (115°C) under a pressure of between 70kPa and 100kPa. This process takes to 8−14 hours, on average.
OUTPUT: PREGNANT ELUATE,CONCENTRATED LIQUOR
4. ELECTROWINNING AND SMELTING
The liquor resulting from the Merrill Crowe process or the carbon adsorption processes is passed through a series of electrowinning cells. Electrowinning entails passing an electric current from a set of stainless steel anodes (positively charged electrodes) to a set of cathodes (negatively charged electrodes) through a liquor (the electrolyte).
The gold plated on the cathodes is collected for smelting in furnaces at high temperatures (> 1,200°C - 2,192°F) to stimulate the separation between the gold and the slag36 (e.g. silver, copper, zinc or iron). Fluxing elements may be added to the blending (e.g. borax, niter and silica) to facilitate the removal of impurities in the slag. After smelting, the molten material is poured into a series of moulds for the production of Doré bars, also called bullions.
The weight and gold content of Doré bars may vary considerably from one facility to another; however they generally contain between 65 per cent and 95 per cent of gold. Although they can be sold as such, Doré bars are generally further purified to reach
36 Defined by Oxford Dictionaries.as «Stony waste matter separated from metals during the smelting or refining of ore».
a purity level of 99.95−99.99 per cent, depending on their final potential uses.
OUTPUT: DORÉ BULLION OFPRECIOUS METALS
5. REFINING, FINAL PURIFICATION
a. Miller process
Doré bullions are heated in furnaces at temperatures higher than the melting point of gold (1,064°C). Some gaseous chlorine is blown onto the molten gold, which leads all elements present in the crucible, except gold, to form chlorides and rise to the surface of the container where they can be skimmed off. The molten gold is finally cast.
The Miller process produces gold of 99.5 per cent purity. It is a somewhat easy and rapid process (taking one and a half hours), and it is generally preferred to the Wohlwill process as it is comparatively cheaper. However, refining gold through the Wohlwill process can be necessary when very pure gold is required. In this case, the Miller process may be combined with the Wohlwill process to produce ingots of 99.99 per cent pure gold.
b. Wohlwill process
The Wohlwill process is the final step in gold processing and refining. It is a technique of purification of gold by electrolysis. Developed in the late nineteenth century, this method is preferred when metals from the platinum group are present, or when maximum gold purity is required.
The anodes are cast with “impure gold” of 95 per cent gold purity as a minimum. A lower purity reduces the efficiency of the process. Under the action of an electric current passing from the anodes to the cathodes plated with pure gold (24k gold sheets), through an electrolytic solution of pure chloroauric acid (HAuCl4), impurities sink to the bottom of the tank, while pure gold deposits settle onto the cathodes. Once anodes are entirely dissolved, gold cathodes are removed from the cells, melted and cast into ingots. The whole operation may take up to two days.
The Wohlwill process is more time-consuming than the Miller process, and more costly, mainly due to the high level of gold contained in the anodes, cathodes and electrolyte, which is needed for the operation.
OUTPUT: GOLD INGOTS READYTO BE SOLD ON MARKETS


CHAPTER 4 - PRICES 55
APPENDIX 2:THE STATE OF GOLD MINES AROUND THE WORLD, 2015

56 COMMODITIES AT A GLANCE - Special issue on gold
Coun
try
Min
e
Ow
ner-
ship
(p
er
cent
)
Pro
duct
ion,
20
13 (o
z)
Rec
over
ed
grade,2014
(g/t
)
Pro
duct
ion,
2014(oz)
Reserves,2014
(oz)
AISC,2014
($/o
z)Co
mm
ents
BARRICKGOLDCORP.
Arge
ntin
a
Vela
dero
100
6
41 0
00
1.0
0 7
22 0
00
4 7
37 0
00
815
Aust
ralia
Co
wal
100
2
97 0
00
268
000
1
555
000
7
87
Aust
ralia
Su
per P
it 5
0 3
15 0
00
2.0
1 3
26 0
00
3 4
82 0
00
1 0
37
Min
e op
erat
ed b
y Ka
lgoo
rlie
Cons
olid
ated
Gol
d M
ines
PTY
Ltd
– a
50
/50
join
t ven
ture
bet
wee
n Ba
rric
k Go
ld a
nd N
ewm
ont m
inin
g
Cana
daHe
mlo
100
2
04 0
00
n.a
2
06 0
00
820
000
1
059
Dom
inic
an R
epub
licPu
eblo
Vie
jo 6
0 4
88 0
00
5.5
3 6
65 0
00
9 3
18 0
00
588
Go
ldco
rp (o
wne
rshi
p: 4
0 pe
r cen
t)
Papu
a Ne
w G
uine
a Po
rger
a 9
5 4
82 0
00
3.1
0 4
93 0
00
3 0
08 0
00
996
Go
vern
men
t of P
apua
New
Gui
nea
(ow
ners
hip:
5 p
er c
ent)
Peru
Lagu
nas
Norte
1
00
606
000
0
.99
582
000
2
833
000
5
43
Peru
Pier
ina
100
9
7 00
0 n
.a
17
000
n.a
. 2
277
Cl
osur
e de
cide
d as
of A
ugus
t 201
3
Unite
d St
ates
Gold
en S
unlig
ht 1
00
92
000
n.a
8
6 00
0 1
27 0
00
1 1
81
Unite
d St
ates
Bald
Mou
ntai
n 1
00
94
000
n.a
1
61 0
00
1 3
61 0
00
1 0
70
Unite
d St
ates
Corte
z 1
00
1 3
40 0
00
1.3
4 9
02 0
00
9 8
51 0
00
706
Unite
d St
ates
Gold
strik
e 1
00
892
000
6
.28
902
000
9
614
000
8
54
Unite
d St
ates
Roun
d M
ount
ain
50
156
000
n
.a
164
000
6
90 0
00
1 1
70
Kinr
oss
Gold
Cor
p. (o
wne
rshi
p: 5
0 pe
r cen
t)
Unite
d St
ates
Ruby
Hill
100
9
1 00
0 n
.a
33
000
24
000
713
Unite
d St
ates
Turq
uois
e Ri
dge
75
167
000
1
9.62
1
95 0
00
4 4
58 0
00
628
Ne
wm
ont m
inin
g Co
rp (o
wne
rshi
p: 2
5 pe
r cen
t)
NEW
MON
T M
ININ
G CO
RP.
Aust
ralia
Bodd
ingt
on 1
00
177
000
n
.a
696
000
1
2 17
0 00
0 9
72
Aust
ralia
Tana
mi
100
6
0 00
0 n
.a
345
000
3
310
000
1
038
Aust
ralia
Jund
ee 1
00
76
000
n.a
1
38 0
00
2 0
80 0
00
771
Aust
ralia
Su
per P
it 5
0 7
8 00
0 n
.a
329
000
3
480
000
1
009
M
ine
oper
ated
by
Kalg
oorli
e Co
nsol
idat
ed G
old
Min
es P
TY L
td –
a
50/5
0 jo
int v
entu
re b
etw
een
Barr
ick
Gold
and
New
mon
t min
ing
Ghan
a Ah
afo
100
1
25 0
00
n.a
4
42 0
00
9 9
10 0
00
849
Ghan
a Ak
yem
100
-
n
.a
472
000
6
670
000
4
23
Indo
nesi
aBa
tu H
ijau
48.
5 1
4 00
0 n
.a
76
000
3 3
40 0
00
1 4
58
Sum
itom
o Co
rpor
atio
n an
d Ne
wm
ont o
pera
te th
e m
ine.
It is
ow
ned
by P
T Ne
wm
ont N
usa
Teng
gara
(PTN
NT),
a jo
int v
entu
re c
ompa
ny
betw
een
Nusa
Ten
ggar
a Pa
rtner
ship
B.V
, PT
Mul
ti Da
erah
Ber
sain
g (P
TMDB
), PT
Puk
uafu
Inda
h an
d PT
Indo
nesi
a M
asba
ga In
vest
ama
Mex
ico
La H
erra
dura
44
55
000
n.a
1
24 0
00
-
1 6
01
Sold
to F
resn
illo
plc
on 7
Oct
ober
201
4
New
Zea
land
Wai
hi 1
00
30
000
n.a
1
32 0
00
360
000
6
87

APPENDIX 2 - THE STATE OF GOLD MINES AROUND THE WORLD, 2015 57
Coun
try
Min
e
Ow
ner-
ship
(p
er
cent
)
Pro
duct
ion,
20
13 (o
z)
Rec
over
ed
grade,2014
(g/t
)
Pro
duct
ion,
2014(oz)
Reserves,2014
(oz)
AISC,2014
(US$
/oz)
Com
men
ts
Peru
Yana
coch
a 5
1.35
2
85 0
00
n.a
4
98 0
00
2 4
90 0
00
943
Co
mpa
ñia
de M
inas
Bue
nave
ntur
a, S
.A.A
.(ow
ners
hip:
43.
65 p
er
cent
) and
Inte
rnat
iona
l Fin
ance
Cor
pora
tion
(ow
ners
hip:
5 p
er c
ent)
Unite
d St
ates
Carli
n co
mpl
ex 1
00
231
000
n
.a
907
000
1
6 96
0 00
0 1
072
Unite
d St
ates
Phoe
nix
100
5
1 00
0 n
.a
211
000
5
620
000
9
11
Unite
d St
ates
Twin
cre
eks
100
9
9 00
0 n
.a
389
000
2
150
000
8
20
Unite
d St
ates
Turq
uois
e Ri
dge
25
n.a
Ba
rric
k Go
ld C
orp
(ow
ners
hip:
75
per c
ent)
ANGLOGOLDASHANTILTD
Arge
ntin
a
Cerr
o Va
ngua
r-di
a 9
2.5
241
000
6
.08
246
000
1
570
000
9
38
Fom
icru
z (o
wne
rshi
p: 7
.5 p
er c
ent)
Aust
ralia
Sunr
ise
Dam
100
2
76 0
00
2.1
3 2
62 0
00
1 1
80 0
00
1 2
14
Aust
ralia
Trop
ican
a 7
0 6
6 00
0 2
.78
358
000
2
630
000
7
52
Inde
pend
ence
Gro
up N
L (o
wne
rshi
p: 3
0 pe
r cen
t). O
pera
tions
beg
an
in 2
013.
Braz
ilAG
A M
iner
ação
100
3
91 0
00
5.6
5 4
03 0
00
1 9
70 0
00
966
2
oper
atio
nal u
nits
: the
Cui
abá
and
the
Córr
ego
de S
ítio
Braz
ilSe
rra
Gran
de
100
1
38 0
00
3.2
8 1
36 0
00
560
000
1
062
3
mec
hani
zed
unde
rgro
und
min
es: M
ina
III, M
ina
Nova
and
Pal
mei
-ra
s an
d an
ope
n-pi
t min
e at
Min
a III
.
Dem
ocra
tic R
epub
lic o
f th
e Co
ngo
Kiba
li 4
5 4
0 00
0 2
.95
237
000
5
170
000
5
88
Rand
gold
(ow
ners
hip:
45
per c
ent)
and
Soci
été
Min
ière
de
Kilo
-M
oto–
SOKI
MO
(ow
ners
hip:
10
per c
ent).
Sta
rted
com
mer
cial
pro
duc-
tion
in O
ctob
er 2
013
Guin
eaSi
guiri
85
268
000
0
.89
290
000
1
840
000
9
17
Gove
rnm
ent o
f Gui
nea
(ow
ners
hip:
15
per c
ent)
Ghan
a Id
uapr
iem
100
2
21 0
00
1.1
3 1
77 0
00
1 9
70 0
00
1 0
20
Ghan
a Ob
uasi
100
2
39 0
00
4.6
7 2
43 0
00
8 1
40 0
00
1 3
74
Gove
rnm
ent o
f Gha
na h
olds
a 1
.58
per c
ent d
irect
sta
ke in
Ang
loGo
ld
Mal
iM
orila
40
57
000
1.0
6 4
4 00
0 4
0 00
0 1
298
Ra
ndgo
ld R
esou
rces
(ow
ners
hip:
40
per c
ent)
and
Gove
rnm
ent o
f M
ali (
owne
rshi
p: 2
0 pe
r cen
t). H
alte
d m
inin
g ac
tiviti
es in
200
9.
Prod
uctio
n is
from
the
proc
essi
ng o
f rem
aini
ng s
tock
pile
s
Mal
iSa
diol
a 4
1 8
6 00
0 1
.28
85
000
1 1
33
IAM
Gol
d (o
wne
rshi
p: 4
1 pe
r cen
t) an
d Go
vern
men
t of M
ali (
owne
r-sh
ip: 1
8 pe
r cen
t)
Mal
iYa
tela
40
27
000
0.5
9 1
1 00
0 1
795
IA
M G
old
(ow
ners
hip:
40
per c
ent)
and
Gove
rnm
ent o
f Mal
i (ow
ner-
ship
: 20
per c
ent).
Hea
ding
s to
war
ds c
losu
re a
nd p
roce
ssin
g of
st
ockp
iles
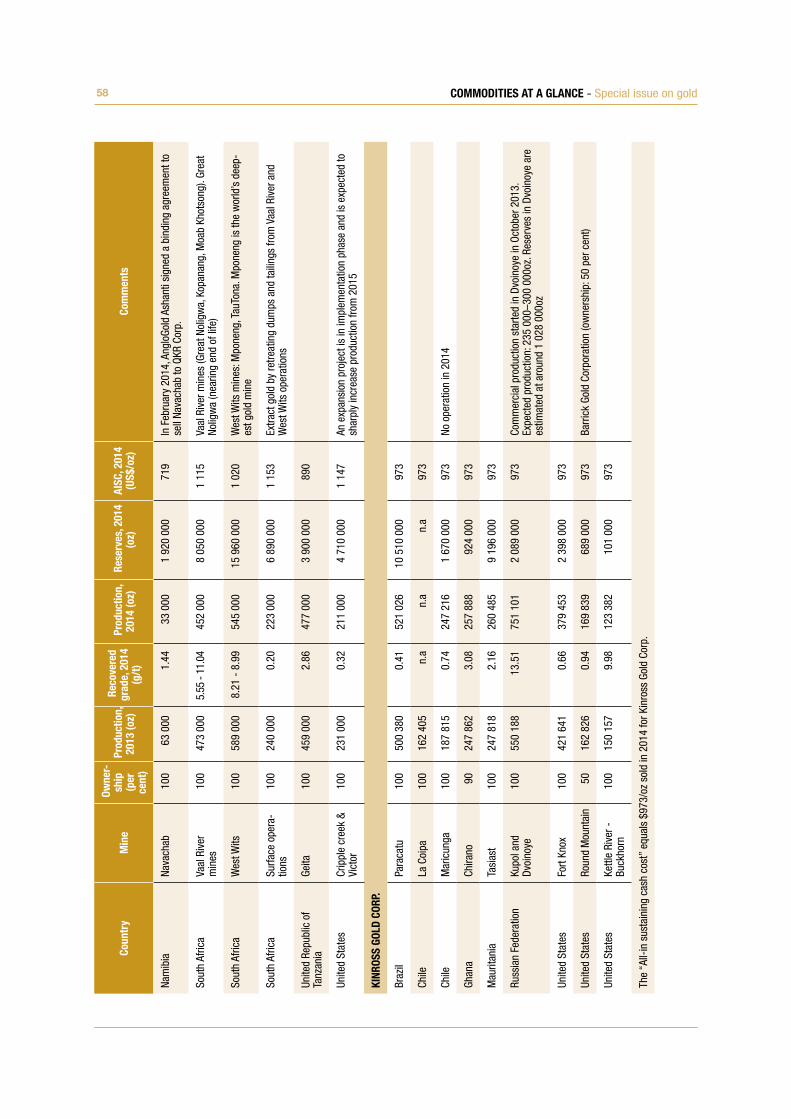
58 COMMODITIES AT A GLANCE - Special issue on gold
Coun
try
Min
e
Ow
ner-
ship
(p
er
cent
)
Pro
duct
ion,
20
13 (o
z)
Rec
over
ed
grade,2014
(g/t
)
Pro
duct
ion,
2014(oz)
Reserves,2014
(oz)
AISC,2014
(US$
/oz)
Com
men
ts
Nam
ibia
Na
vach
ab 1
00
63
000
1.4
4 3
3 00
0 1
920
000
7
19
In F
ebru
ary
2014
, Ang
loGo
ld A
shan
ti si
gned
a b
indi
ng a
gree
men
t to
sell
Nava
chab
to Q
KR C
orp.
Sout
h Af
rica
Vaal
Riv
er
min
es 1
00
473
000
5
.55
- 11.
04
452
000
8
050
000
1
115
Va
al R
iver
min
es (G
reat
Nol
igw
a, K
opan
ang,
Moa
b Kh
otso
ng).
Grea
t No
ligw
a (n
earin
g en
d of
life
)
Sout
h Af
rica
Wes
t Wits
1
00
589
000
8
.21
- 8.
99
545
000
1
5 96
0 00
0 1
020
W
est W
its m
ines
: Mpo
neng
, Tau
Tona
. Mpo
neng
is th
e w
orld
’s d
eep-
est g
old
min
e
Sout
h Af
rica
Surfa
ce o
pera
-tio
ns 1
00
240
000
0
.20
223
000
6
890
000
1
153
Ex
tract
gol
d by
retre
atin
g du
mps
and
taili
ngs
from
Vaa
l Riv
er a
nd
Wes
t Wits
ope
ratio
ns
Unite
d Re
publ
ic o
f Ta
nzan
ia
Geita
100
4
59 0
00
2.8
6 4
77 0
00
3 9
00 0
00
890
Unite
d St
ates
Crip
ple
cree
k &
Vict
or 1
00
231
000
0
.32
211
000
4
710
000
1
147
An
exp
ansi
on p
roje
ct is
in im
plem
enta
tion
phas
e an
d is
exp
ecte
d to
sh
arpl
y in
crea
se p
rodu
ctio
n fro
m 2
015
KINROSSGOLDCORP.
Braz
il Pa
raca
tu 1
00
500
380
0
.41
521
026
1
0 51
0 00
0 9
73
Chile
La C
oipa
100
1
62 4
05
n.a
n
.a
n.a
9
73
Chile
Mar
icun
ga
100
1
87 8
15
0.7
4 2
47 2
16
1 6
70 0
00
973
No
ope
ratio
n in
201
4
Ghan
a Ch
irano
90
247
862
3
.08
257
888
9
24 0
00
973
Mau
ritan
ia
Tasi
ast
100
2
47 8
18
2.1
6 2
60 4
85
9 1
96 0
00
973
Russ
ian
Fede
ratio
nKu
pol a
nd
Dvoi
noye
100
5
50 1
88
13.
51
751
101
2
089
000
9
73
Com
mer
cial
pro
duct
ion
star
ted
in D
voin
oye
in O
ctob
er 2
013.
Ex
pect
ed p
rodu
ctio
n: 2
35 0
00–3
00 0
00oz
. Res
erve
s in
Dvo
inoy
e ar
e es
timat
ed a
t aro
und
1 02
8 00
0oz
Unite
d St
ates
Fort
Knox
1
00
421
641
0
.66
379
453
2
398
000
9
73
Unite
d St
ates
Roun
d M
ount
ain
50
162
826
0
.94
169
839
6
89 0
00
973
Ba
rric
k Go
ld C
orpo
ratio
n (o
wne
rshi
p: 5
0 pe
r cen
t)
Unite
d St
ates
Kettl
e Ri
ver -
Bu
ckho
rn 1
00
150
157
9
.98
123
382
1
01 0
00
973
The
“All-
in s
usta
inin
g ca
sh c
ost”
equ
als
$973
/oz
sold
in 2
014
for K
inro
ss G
old
Corp
.

APPENDIX 2 - THE STATE OF GOLD MINES AROUND THE WORLD, 2015 59
Coun
try
Min
e
Ow
ner-
ship
pe
r ce
nt)
Pro
duct
ion,
20
13 (o
z)
Rec
over
ed
grade,2014
(g/t
)
Pro
duct
ion,
2014(oz)
Reserves,2014
(oz)
AISC,2014
(US$
/oz)
Com
men
ts
GOLDCORPINC.
Arge
ntin
a
Alum
brer
a 3
8 1
17 5
00
0.3
9 1
20 1
00
760
000
6
09
Xstra
ta (o
wne
rshi
p: 5
0 pe
r cen
t) op
erat
es th
e m
ine,
Yam
ana
Gold
(o
wne
rshi
p: 1
2.5
per c
ent)
Arge
ntin
a
Cerr
o Ne
gro
100
n
.a
n.a
1
52 1
00
5 2
60 0
00
n.a
Co
mm
erci
al p
rodu
ctio
n ac
hiev
ed o
n 1
Janu
ary
2015
. Hig
h-gr
ade
depo
sit
Cana
daM
usse
lwhi
te 1
00
256
300
7
.38
278
300
1
660
000
8
11
Expe
cted
life
of m
ine
until
202
6
Cana
daPo
rcup
ine
100
2
91 9
00
2.4
5 3
00 0
00
2 9
80 0
00
908
Ex
pect
ed li
fe o
f min
e un
til 2
026
Cana
daRe
d La
ke
100
4
93 0
00
19.
47
414
400
2
060
000
9
34
Gold
corp
top
prod
ucin
g m
ine.
Exp
ecte
d lif
e of
min
e un
til 2
025
Dom
inic
an R
epub
licPu
eblo
Vie
jo 4
0 3
24 0
00
n.a
4
39 1
00
6 2
10 0
00
n.a
Ba
rric
k Go
ld C
orpo
ratio
n (o
wne
rshi
p: 6
0 pe
r cen
t)
Guat
emal
aM
arlin
100
2
02 2
00
3.1
1 1
86 5
00
310
000
8
62
Expl
orat
ion
activ
ities
indi
cate
pot
entia
l for
ext
ensi
on o
f min
ing
activ
i-tie
s. E
xpec
ted
life
of m
ine
until
201
8
Mex
ico
El S
auza
l 1
00
80
600
1.4
0 N
o pr
oduc
tion
150
000
6
28
Clos
ure
sche
dule
d in
201
5
Mex
ico
Los
Filo
s 1
00
332
400
0
.67
258
700
6
770
000
9
93
Expe
cted
life
of m
ine
until
202
7
Mex
ico
Peña
squi
to 1
00
403
800
0
.65
567
800
1
0 55
0 00
0 8
13
Expe
cted
life
of m
ine
until
202
6
Unite
d St
ates
Wha
rf 1
00
56
200
0.0
2 6
2 50
0 5
60 0
00
1 1
65
Expe
cted
life
of m
ine
until
202
0
NEWCRESTMININGLTD
Aust
ralia
Ca
dia
Valle
y 1
00
446
879
0
.52
592
831
2
8 00
0 00
0 3
26
Aust
ralia
Telfe
r 1
00
525
500
0
.91
536
342
6
300
000
1
005
Indo
nesi
aGo
sow
ong
75
312
711
1
2.00
3
44 7
47
1 2
00 0
00
823
PT
Ane
ka T
amba
ng (o
wne
rshi
p: 2
5 pe
r cen
t)
Papu
a Ne
w G
uine
a Li
hir
100
6
49 3
40
2.4
0 7
21 6
24
29
000
000
1 2
61
Papu
a Ne
w G
uine
a Hi
dden
Val
ley
50
85
004
1.6
0 1
05 8
45
1 7
00 0
00
1 4
02
Part
of M
orob
e M
inin
g Jo
int V
entu
re. O
wne
rshi
p: 5
0 pe
r cen
t with
Ha
rmon
y Go
ld M
inin
g Co
mpa
ny L
imite
d
Côte
d’Iv
oire
Bo
nikr
o 8
9.9
90
350
1.3
0 9
4 99
4 1
500
000
1
193
Go
vern
men
t of C
ôte
d’Iv
oire
(ow
ners
hip:
10
per c
ent)
and
a m
inor
ity
shar
ehol
der (
owne
rshi
p: 0
.11
per c
ent)

60 COMMODITIES AT A GLANCE - Special issue on gold
Coun
try
Min
e
Ow
ner-
ship
(p
er
cent
)
Pro
duct
ion,
20
13 (o
z)
Rec
over
ed
grade,2014
(g/t
)
Pro
duct
ion,
2014(oz)
Reserves,2014
(oz)
AISC,2014
(US$
/oz)
Com
men
ts
GOLDFIELDSLTD
Aust
ralia
Agne
w/L
awle
rs 1
00
215
600
7
.44
271
000
8
70 0
00
990
Ex
pect
ed li
fe o
f min
e un
til 2
017
Aust
ralia
Darlo
t 1
00
19
700
7.3
6 8
4 00
0 9
0 00
0 1
222
Ex
pect
ed li
fe o
f min
e un
til 2
015
Aust
ralia
Gran
ny S
mith
100
6
2 20
0 6
.02
315
000
8
70 0
00
809
Ex
pect
ed li
fe o
f min
e un
til 2
020
Aust
ralia
St Iv
es
100
4
02 7
00
3.1
4 3
62 0
00
1 8
00 0
00
1 1
64
Expe
cted
life
of m
ine
until
201
9
Ghan
aDa
man
g 9
0 1
53 1
00
1.4
9 1
78 0
00
1 2
30 0
00
1 1
75
Expe
cted
life
of m
ine
until
201
9. G
over
nmen
t of G
hana
(ow
ners
hip:
10
per
cen
t)
Ghan
aTa
rkw
a 9
0 6
32 2
00
1.0
5 5
58 0
00
7 4
90 0
00
1 0
68
Expe
cted
life
of m
ine
until
203
0. G
over
nmen
t of G
hana
(ow
ners
hip:
10
per
cen
t)
Peru
Cerr
o Co
rona
99.
5 3
13 0
00
0.9
0 3
27 0
00
1 7
60 0
00
316
Ex
pect
ed li
fe o
f min
e un
til 2
023
Sout
h Af
rica
Sout
h De
ep 9
1.9
302
000
5
.30
201
000
3
4 90
0 00
0 1
732
Ex
pect
ed li
fe o
f min
e un
til 2
087.
10%
to s
hare
hold
ers
as p
art o
f BB
BEE(
b) tr
ansa
ctio
n co
nclu
ded
in D
ec. 2
010
POLYUSGOLDINT.LTD
Russ
ian
Fede
ratio
nAl
luvi
al d
epos
its
(Bod
aybo
di
stric
t)
(38.
4 -
62.9
) 2
05 0
00
0.6
4 1
90 0
00
61
100
000
952
Ex
pect
ed li
fe o
f min
e un
til 2
020
Russ
ian
Fede
ratio
nBl
agod
atno
ye 9
5.1
395
000
2
.25
394
000
8
700
000
5
61
Expe
cted
life
of m
ine
until
203
6
Russ
ian
Fede
ratio
nKu
rana
kh 9
5.1
138
000
1
.39
137
000
2
600
000
9
92
Expe
cted
life
of m
ine
until
203
3
Russ
ian
Fede
ratio
nOl
impi
ada
95.
1 6
91 0
00
3.2
9 7
26 0
00
29
300
000
854
Ex
pect
ed li
fe o
f min
e un
til 2
054
Russ
ian
Fede
ratio
nTi
timuk
hta
95.
1 1
31 0
00
3.4
5 9
3 00
0 1
500
000
1
183
Ex
pect
ed li
fe o
f min
e un
til 2
030
Russ
ian
Fede
ratio
nVe
rnin
skoy
e an
d Sm
ezhn
y 9
5.1
89
000
2.5
2 1
46 0
00
4 1
00 0
00
728
Ex
pect
ed li
fe o
f min
e un
til 2
042
SIBANYEGOLDLTD
Sout
h Af
rica
Beat
rix
100
3
12 6
00
2.4
0 3
22 0
00
3 6
30 0
00
1 0
87
Sout
h Af
rica
Drie
font
ein
100
6
03 6
00
3.5
0 5
51 5
59
6 1
00 0
00
1 0
27
Sout
h Af
rica
Kloo
f 1
00
513
700
3
.80
529
882
6
020
000
1
014
POLY
MET
AL IN
T. PL
C
Kaza
khst
anVa
rvar
a 1
00
106
700
1
.30
98
000
1 7
00 0
00
1 0
49
Expe
cted
life
of m
ine
until
203
0
Russ
ian
Fede
ratio
nAl
bazi
no
100
2
37 7
00
5.1
0 2
27 0
00
2 7
00 0
00
901
Ex
pect
ed li
fe o
f min
e un
til 2
030
Russ
ian
Fede
ratio
nDu
kat H
ub 1
00
40
600
7.7
0 4
5 00
0 3
500
000
1
1 Ex
pect
ed li
fe o
f min
e un
til 2
024
Russ
ian
Fede
ratio
nKh
akan
ja
100
1
03 4
00
3.5
0 9
8 00
0 1
000
000
9
09
Expe
cted
life
of m
ine
until
201
8
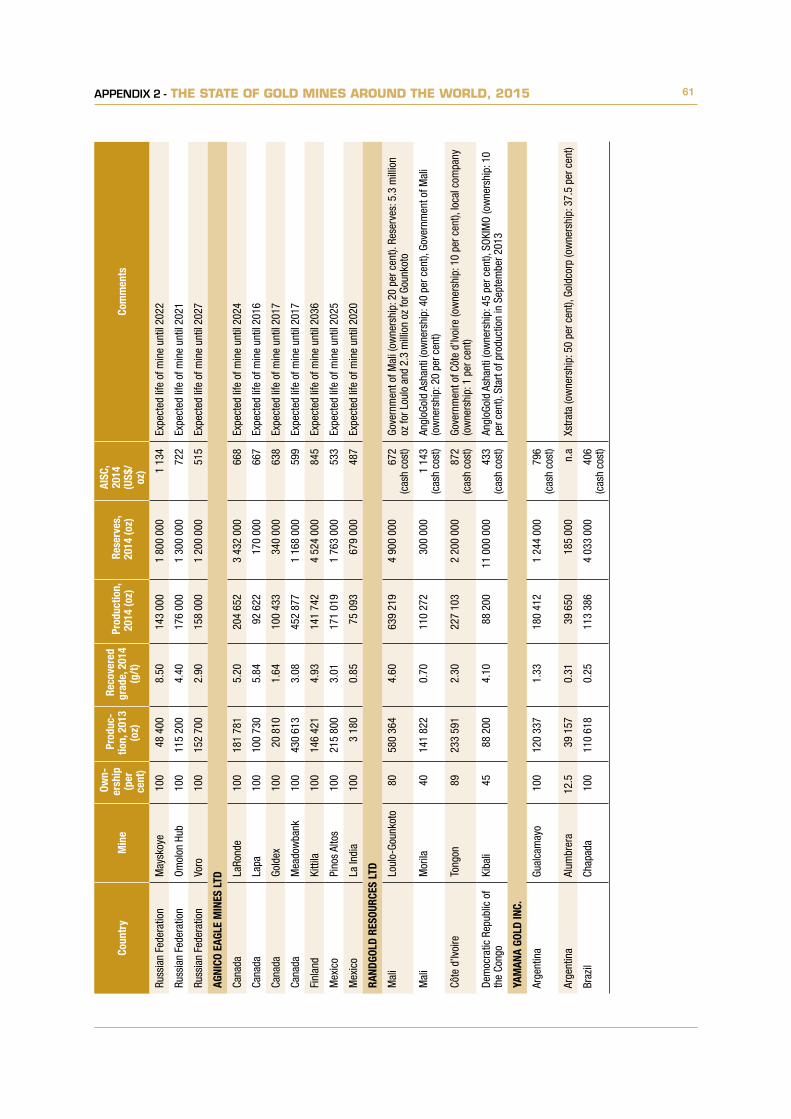
APPENDIX 2 - THE STATE OF GOLD MINES AROUND THE WORLD, 2015 61
Coun
try
Min
e
Ow
n-er
ship
(p
er
cent
)
Pro
duc-
tion,
201
3 (o
z)
Rec
over
ed
grade,2014
(g/t
)
Pro
duct
ion,
2014(oz)
Res
erve
s,
2014(oz)
AISC
, 2014
(US$
/oz
)
Com
men
ts
Russ
ian
Fede
ratio
nM
aysk
oye
100
4
8 40
0 8
.50
143
000
1
800
000
1
134
Ex
pect
ed li
fe o
f min
e un
til 2
022
Russ
ian
Fede
ratio
nOm
olon
Hub
100
1
15 2
00
4.4
0 1
76 0
00
1 3
00 0
00
722
Ex
pect
ed li
fe o
f min
e un
til 2
021
Russ
ian
Fede
ratio
nVo
ro 1
00
152
700
2
.90
158
000
1
200
000
5
15
Expe
cted
life
of m
ine
until
202
7
AGNICOEAGLEMINESLTD
Cana
da
LaRo
nde
100
1
81 7
81
5.2
0 2
04 6
52
3 4
32 0
00
668
Ex
pect
ed li
fe o
f min
e un
til 2
024
Cana
da
Lapa
1
00
100
730
5
.84
92
622
170
000
6
67
Expe
cted
life
of m
ine
until
201
6
Cana
da
Gold
ex
100
2
0 81
0 1
.64
100
433
3
40 0
00
638
Ex
pect
ed li
fe o
f min
e un
til 2
017
Cana
da
Mea
dow
bank
100
4
30 6
13
3.0
8 4
52 8
77
1 1
68 0
00
599
Ex
pect
ed li
fe o
f min
e un
til 2
017
Finl
and
Kitti
la 1
00
146
421
4
.93
141
742
4
524
000
8
45
Expe
cted
life
of m
ine
until
203
6
Mex
ico
Pino
s Al
tos
100
2
15 8
00
3.0
1 1
71 0
19
1 7
63 0
00
533
Ex
pect
ed li
fe o
f min
e un
til 2
025
Mex
ico
La In
dia
100
3
180
0
.85
75
093
679
000
4
87
Expe
cted
life
of m
ine
until
202
0
RANDGOLDRESOURCESLTD
Mal
iLo
ulo-
Goun
koto
80
580
364
4
.60
639
219
4
900
000
6
72
(cas
h co
st)
Gove
rnm
ent o
f Mal
i (ow
ners
hip:
20
per c
ent).
Res
erve
s: 5
.3 m
illio
n oz
for L
oulo
and
2.3
mill
ion
oz fo
r Gou
nkot
o
Mal
iM
orila
40
141
822
0
.70
110
272
3
00 0
00
1 1
43
(cas
h co
st)
Angl
oGol
d As
hant
i (ow
ners
hip:
40
per c
ent),
Gov
ernm
ent o
f Mal
i (o
wne
rshi
p: 2
0 pe
r cen
t)
Côte
d’Iv
oire
To
ngon
8
9 2
33 5
91
2.3
0 2
27 1
03
2 2
00 0
00
872
(c
ash
cost
) Go
vern
men
t of C
ôte
d’Iv
oire
(ow
ners
hip:
10
per c
ent),
loca
l com
pany
(o
wne
rshi
p: 1
per
cen
t)
Dem
ocra
tic R
epub
lic o
f th
e Co
ngo
Kiba
li 4
5 8
8 20
0 4
.10
88
200
11
000
000
433
(c
ash
cost
) An
gloG
old
Asha
nti (
owne
rshi
p: 4
5 pe
r cen
t), S
OKIM
O (o
wne
rshi
p: 1
0 pe
r cen
t). S
tart
of p
rodu
ctio
n in
Sep
tem
ber 2
013
YAMANAGOLDINC.
Arge
ntin
aGu
alca
may
o 1
00
120
337
1
.33
180
412
1
244
000
7
96
(cas
h co
st)
Arge
ntin
aAl
umbr
era
12.
5 3
9 15
7 0
.31
39
650
185
000
n
.a
Xstra
ta (o
wne
rshi
p: 5
0 pe
r cen
t), G
oldc
orp
(ow
ners
hip:
37.
5 pe
r cen
t)
Braz
ilCh
apad
a 1
00
110
618
0
.25
113
386
4
033
000
4
06
(cas
h co
st)

62 COMMODITIES AT A GLANCE - Special issue on gold
Coun
try
Min
e
Ow
ner-
ship
(p
er
cent
)
Pro
duct
ion,
20
13 (o
z)
Rec
over
ed
grade,2014
(g/t
)
Pro
duct
ion,
2014(oz)
Reserves,2014
(oz)
AISC,2014
(US$
/oz)
Com
men
ts
Braz
ilBr
io G
old
100
9
8 45
0 2
.19
144
663
1
45 0
00
798
(c
ash
cost
) Ho
lds
Faze
nda
Bras
ileiro
, Pila
r min
es a
nd C
1 Sa
nta
Luz
proj
ect
Braz
ilJa
cobi
na 1
00
73
695
2.8
2 7
5 65
0 2
074
000
1
078
(c
ash
cost
)
Cana
daCa
nadi
an
Mal
artic
50
n.a
1
.06
143
008
4
329
000
7
02
(cas
h co
st)
Agni
co E
agle
Lim
itée
(ow
ners
hip:
50
per c
ent)
Chile
El P
eñón
100
4
67 5
23
5.0
3 4
52 1
20
1 6
82 0
00
488
(c
ash
cost
)
Chile
Min
era
Flor
ida
100
1
18 5
90
3.7
0 1
19 5
82
516
000
6
17
(cas
h co
st)
Mex
ico
Mer
cede
s 1
00
141
618
5
.03
113
174
6
48 0
00
671
(c
ash
cost
)
ALAM
OSGOLDINC.
Mex
ico
Mul
atos
1
00
190
000
1
.16
140
500
1
731
921
1
022
Ex
pect
ed li
fe o
f min
e un
til 2
021
COMPANIADEMINASBUENAVENTURAS.A.A.
Peru
Orco
pam
pa
100
2
24 6
71
16.
39
203
226
3
21 0
00
n.a
Peru
Pora
cota
100
4
67
10.
67
1 4
20
n.a
n
.a
Peru
Julc
ani
100
1
032
0
.56
414
5
000
n
.a
Peru
Anta
pite
1
00
509
1
0.42
8
52
n.a
n
.a
Peru
Shila
Pau
la
100
7
692
1
0.92
n
.a
n.a
n
.a
Peru
Brea
pam
pa 1
00
81
882
1.3
1 7
4 80
7 1
9 00
0 n
.a
Peru
“Col
quiji
rca
& M
arca
punt
a” 5
4 4
954
0
.34
7 6
42
276
000
n
.a
Peru
La Z
anja
5
3 7
2 90
2 0
.72
76
180
244
000
n
.a
Peru
Tant
ahua
tay
40
57
202
0.4
4 5
7 59
4 8
50 0
00
n.a
Peru
Yana
coch
a 4
4 4
44 0
34
0.8
6 4
23 3
81
17
482
000
n.a
Ne
wm
ont M
inin
g Co
rp (o
wne
rshi
p: 5
1.35
per
cen
t) an
d In
tern
atio
nal
Fina
nce
Corp
orat
ion
(ow
ners
hip:
5 p
er c
ent)

APPENDIX 2 - THE STATE OF GOLD MINES AROUND THE WORLD, 2015 63
Coun
try
Min
e O
wne
r-sh
ip (p
er
cent
)
Pro
duct
ion,
20
13 (o
z)
Rec
over
ed
grade,2014
(g/t
)
Pro
duct
ion,
2014(oz)
Reserves,2014
(oz)
AISC,2014
(US$
/oz)
Com
men
ts
CENTERRAGOLDINC.
Kyrg
yzst
anKu
mto
r 1
00
600
402
2
.80
423
381
6
136
000
7
79
Expe
cted
life
of m
ine
until
202
3
Mon
golia
Bo
roo
100
9
0 31
8 N
o m
ore
prod
uctio
n in
201
4
973
CHINAGOLDINTERNATIONALRESOURCESCORP.
Chin
aCS
H 1
00
145
000
0
.61
165
000
6
700
000
n
.a
Expe
cted
life
of m
ine
until
202
4
NAVOIM
ININGANDMETALLURGICALCOM
BINAT
Uzbe
kist
an. A
ccor
ding
to N
MM
C w
ebsi
te, t
he c
ompa
ny a
ccou
nts
for 8
0 pe
r cen
t of g
old
prod
uctio
n in
Uzb
ekis
tan
(e.g
. Mur
unta
u, o
ne o
f the
fifth
larg
est w
orld
gol
d m
ines
in th
e w
orld
, with
2 m
illio
n ou
nces
of g
old
prod
uced
ann
ually
)
FREE
PORT
-MCM
ORAN
INC.
Indo
nesi
aGr
asbe
rg 1
00
1 1
42 0
00
0.9
9 1
132
000
5
800
000
n
.a
Gras
berg
ope
n pi
t, de
ep o
re z
one
and
big
goss
an
ELDORADOGOLDCORP.
Chin
aJi
nfen
g 8
2 1
23 2
46
3.8
1 1
68 5
03
2 0
00 0
00
779
Gu
izho
u La
nnig
ou G
old
Min
e Li
mite
d (o
wne
rshi
p: 1
8 pe
r cen
t).
Expe
cted
life
of m
ine
until
202
6
Chin
aTa
njia
nsha
n 9
0 1
01 4
51
2.7
0 1
07 6
14
288
000
7
79
“Firs
t Ins
titut
e of
Geo
logy
and
Min
eral
Exp
lora
tion
of
Quin
ghai
Pro
vinc
e (Q
ingh
ai) (
5%),
The
Inve
stm
ent a
nd O
pera
tion
Com
pany
Sta
te–O
wne
d As
set o
f Dac
haid
an A
dmin
istra
tive
Com
mit-
tee
(Dac
haid
an) (
5%).
Expe
cted
life
of m
ine
until
201
7”
Chin
aW
hite
Mou
ntai
n 9
5 7
3 06
0 3
.13
85
308
571
000
7
79
“Jili
n Pr
ovin
cial
Geo
logi
c Su
rvey
Inst
itute
No.
4 (T
ongh
ua) (
owne
rshi
p: 5
per
cen
t). E
xpec
ted
life
of m
ine
until
201
9”
Turk
eyKi
şlad
ağ 1
00
306
182
0
.69
311
233
8
100
000
7
79
Expe
cted
life
of m
ine
until
203
5
Turk
eyEf
emçu
kuru
100
9
0 81
8 7
.23
98
829
1 0
00 0
00
779
Ex
pect
ed li
fe o
f min
e un
til 2
023
The
“All-
in s
usta
inin
g ca
sh c
ost”
equ
als
779
US$
per o
unce
sol
d in
201
4 fo
r the
who
le c
ompa
ny
GOLDENSTARRESOURCESLTD
Ghan
a W
assa
1
00
186
000
2
.04
113
000
1
578
000
7
78
Ghan
a Bo
goso
90
145
000
2
.52
148
000
3
50 0
00
518
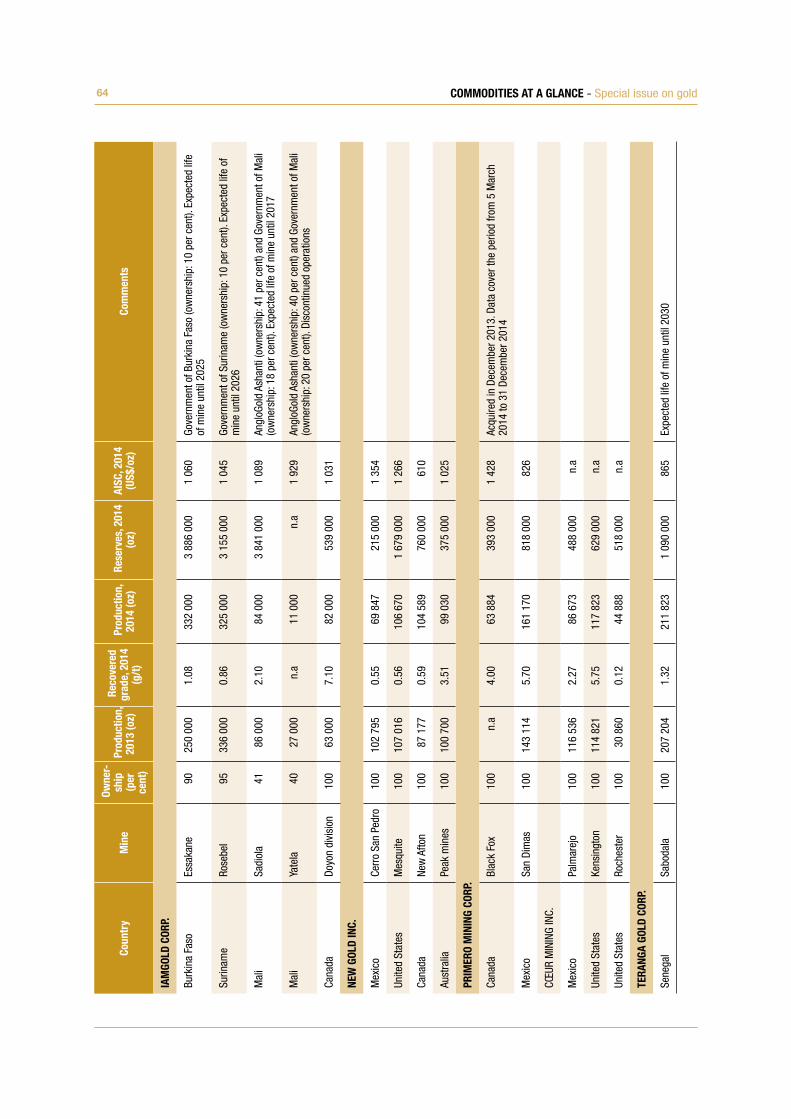
64 COMMODITIES AT A GLANCE - Special issue on gold
Coun
try
Min
e
Ow
ner-
ship
(p
er
cent
)
Pro
duct
ion,
20
13 (o
z)
Rec
over
ed
grade,2014
(g/t
)
Pro
duct
ion,
2014(oz)
Reserves,2014
(oz)
AISC,2014
(US$
/oz)
Com
men
ts
IAMGOLDCORP.
Burk
ina
Faso
Essa
kane
90
250
000
1
.08
332
000
3
886
000
1
060
Go
vern
men
t of B
urki
na F
aso
(ow
ners
hip:
10
per c
ent).
Exp
ecte
d lif
e of
min
e un
til 2
025
Surin
ame
Rose
bel
95
336
000
0
.86
325
000
3
155
000
1
045
Go
vern
men
t of S
urin
ame
(ow
ners
hip:
10
per c
ent).
Exp
ecte
d lif
e of
m
ine
until
202
6
Mal
iSa
diol
a 4
1 8
6 00
0 2
.10
84
000
3 8
41 0
00
1 0
89
Angl
oGol
d As
hant
i (ow
ners
hip:
41
per c
ent)
and
Gove
rnm
ent o
f Mal
i (o
wne
rshi
p: 1
8 pe
r cen
t). E
xpec
ted
life
of m
ine
until
201
7
Mal
iYa
tela
40
27
000
n.a
1
1 00
0 n
.a
1 9
29
Angl
oGol
d As
hant
i (ow
ners
hip:
40
per c
ent)
and
Gove
rnm
ent o
f Mal
i (o
wne
rshi
p: 2
0 pe
r cen
t). D
isco
ntin
ued
oper
atio
ns
Cana
daDo
yon
divi
sion
100
6
3 00
0 7
.10
82
000
539
000
1
031
NEWGOLDINC.
Mex
ico
Cerr
o Sa
n Pe
dro
100
1
02 7
95
0.5
5 6
9 84
7 2
15 0
00
1 3
54
Unite
d St
ates
Mes
quite
100
1
07 0
16
0.5
6 1
06 6
70
1 6
79 0
00
1 2
66
Cana
daNe
w A
fton
100
8
7 17
7 0
.59
104
589
7
60 0
00
610
Aust
ralia
Peak
min
es 1
00
100
700
3
.51
99
030
375
000
1
025
PRIM
ERO
MIN
ING
CORP
.
Cana
daBl
ack
Fox
100
n
.a
4.0
0 6
3 88
4 3
93 0
00
1 4
28
Acqu
ired
in D
ecem
ber 2
013.
Dat
a co
ver t
he p
erio
d fro
m 5
Mar
ch
2014
to 3
1 De
cem
ber 2
014
Mex
ico
San
Dim
as 1
00
143
114
5
.70
161
170
8
18 0
00
826
CŒUR
MIN
ING
INC.
Mex
ico
Palm
arej
o 1
00
116
536
2
.27
86
673
488
000
n
.a
Unite
d St
ates
Kens
ingt
on 1
00
114
821
5
.75
117
823
6
29 0
00
n.a
Unite
d St
ates
Roch
este
r 1
00
30
860
0.1
2 4
4 88
8 5
18 0
00
n.a
TERANGAGOLDCORP.
Sene
gal
Sabo
dala
100
2
07 2
04
1.3
2 2
11 8
23
1 0
90 0
00
865
Ex
pect
ed li
fe o
f min
e un
til 2
030

APPENDIX 2 - THE STATE OF GOLD MINES AROUND THE WORLD, 2015 65
Coun
try
Min
e
Ow
ner-
ship
(p
er
cent
)
Pro
duct
ion,
20
13 (o
z)
Rec
over
ed
grade,2014
(g/t
)
Pro
duct
ion,
2014(oz)
Reserves,2014
(oz)
AISC,2014
(US$
/oz)
Com
men
ts
FIRSTQUANTUMMINERALSLTD
Mau
ritan
ia
Guel
b M
oghr
ein
100
5
8 19
1 0
.71
55
000
- 60
000
6
00 3
56
n.a
JAGUARMININGINC.
Braz
ilTu
rmal
ina
100
4
1 20
0 5
.33
47
996
217
000
n
.a
Braz
ilPa
ciên
cia
100
9
987
(in
201
2)
n.a
n
.a
n.a
n
.a
Care
and
mai
nten
ance
sin
ce 9
Aug
ust 2
012
Braz
ilCa
eté
100
5
2 17
0 2
.55
44
089
50
000
n.a
HOCHSCHILDMININGPLC
Arge
ntin
aSa
n Jo
se 5
1 9
8 83
0 6
.80
94
160
214
200
n
.a
McE
wen
Min
ing
Inc.
(ow
ners
hip:
49
per c
ent)
Peru
Arca
ta 1
00
16
830
1.0
0 1
6 89
0 6
7 90
0 n
.a
Peru
Ares
100
2
3 40
0 n
.a
11
630
n.a
n
.a
Oper
atio
ns s
uspe
nded
in J
une
2014
Peru
Palla
ncat
a 1
00
27
830
1.3
0 2
4 34
0 7
2 80
0 n
.a
STANDREWGOLDFIELDSLTD
Cana
daHo
lt 1
00
58
898
4.7
5 6
3 00
0 5
91 0
00
966
Cana
daHo
llow
ay 1
00
21
330
5.3
5 2
4 00
0 4
0 00
0 9
66
Cana
daHi
slop
100
1
9 32
1 5
.16
4 3
00
46
000
966
The
“All-
in s
usta
inin
g ca
sh c
ost”
equ
als
966
US$
per o
unce
sol
d in
201
4 fo
r the
who
le c
ompa
ny
AVOCETMININGPLC
Burk
ina
Faso
Inat
a 9
0 1
18 4
43
2.1
6 8
6 03
7 4
42 0
00
1 4
64
Gove
rnm
ent o
f Bur
kina
Fas
o (o
wne
rshi
p: 1
0 pe
r cen
t). E
xpec
ted
life
of m
ine
until
201
7
STBARBARALTD
Aust
ralia
Leon
ora
(Gw
alia
, Kin
g of
th
e Hi
lls)
100
2
73 0
00
6.9
0 2
85 0
30
2 2
80 0
00
n.a
Papu
a Ne
w G
uine
a Si
mbe
ri 1
00
45
609
1.1
4 4
4 25
1 2
210
000
n
.a
Solo
mon
Isla
nds
Gold
Rid
ge 1
00
45
931
1.6
0 4
5 12
1 6
70 0
00
n.a
Op
erat
ions
sus
pend
ed in
Apr
il 20
14

66 COMMODITIES AT A GLANCE - Special issue on gold
Coun
try
Min
e
Ow
ner-
ship
(p
er
cent
)
Pro
duct
ion,
20
13 (o
z)
Rec
over
ed
grade,2014
(g/t
)
Pro
duct
ion,
2014(oz)
Reserves,2014
(oz)
AISC,2014
(US$
/oz)
Com
men
ts
NORDGOLDNV
Burk
ina
Faso
Biss
a 9
0 2
54 3
00
1.5
2 2
50 7
00
1 6
75 0
00
570
Go
vern
men
t of B
urki
na F
aso
(ow
ners
hip:
10
per c
ent).
Sta
rt-up
: Ja
nuar
y 20
13
Burk
ina
Faso
Tapa
rko
90
108
400
2
.77
112
000
5
78 0
00
919
Go
vern
men
t of B
urki
na F
aso
(ow
ners
hip:
10
per c
ent)
Guin
eaLe
fa 1
00
162
700
1
.22
205
100
2
600
000
1
133
Kaza
khst
anSu
zdal
100
8
1 10
0 7
.46
76
800
700
000
8
68
Russ
ian
Fede
ratio
nBe
rezi
tovy
100
1
20 3
00
1.6
2 1
22 8
00
644
000
7
13
Russ
ian
Fede
ratio
nBu
ryat
zolo
to 1
00
98
500
5.0
8 1
19 7
00
151
000
9
92
Russ
ian
Fede
ratio
nNe
ryun
gri
100
6
6 50
0 0
.75
65
900
312
000
8
55
Russ
ian
Fede
ratio
nAp
relk
ovo
100
3
2 70
0 1
.09
31
700
169
000
1
094
ORVANAMINERALSCORP.
Spai
nEl
Val
le-B
oiná
s/Ca
rlés
100
6
5 99
2 4
.29
62
957
302
000
1
160
Boliv
iaDo
n M
ario
100
1
4 54
9 1
.13
21
127
46
400
955
ATNARESOURCESLTD
Unite
d St
ates
Brig
gs 1
00
31
700
0.5
3 3
0 90
0 6
8 89
9 n
.a
MINERAIRLLTD
Peru
Corih
uarm
i 1
00
25
223
0.3
0 2
3 65
4 2
0 00
0 n
.a
PETROPAVLOVSKPLC
Russ
ian
Fede
ratio
nPi
onee
r 1
00
301
600
0
.85
319
900
2
910
000
9
70
Russ
ian
Fede
ratio
nPo
krov
skiy
100
7
8 30
0 1
.30
35
900
390
000
9
70
Russ
ian
Fede
ratio
nM
alom
ir 1
00
158
700
1
.03
92
200
3 0
70 0
00
970
Russ
ian
Fede
ratio
nAl
byn
100
1
38 4
00
1.3
7 1
87 4
00
1 3
80 0
00
970
The
“All-
in s
usta
inin
g ca
sh c
ost”
equ
als
$970
/oz
sold
in 2
014
for P
etro
pavl
ovsk
Plc
TURQUOISEHILLRESOURCESLTD
Mon
golia
Oy
u To
lgoi
66
157
000
0
.32
311
000
(J
an to
Se
pt)
11
900
000
n.a
Go
vern
men
t of M
ongo
lia (o
wne
rshi
p: 3
4 pe
r cen
t)
ENDEAVOURMININGCORP.
Burk
ina
Faso
Youg
a 9
0 1
.80
76
561
202
000
8
24
Gove
rnm
ent o
f Bur
kina
Fas
o (o
wne
rshi
p: 1
0 pe
r cen
t)
Côte
d’Iv
oire
Ag
baou
85
2.5
0 1
46 7
57
787
000
6
21
Gove
rnm
ent o
f Côt
e d’
Ivoi
re (o
wne
rshi
p: 1
0 pe
r cen
t) an
d SO
DEM
I (o
wne
rshi
p: 5
per
cen
t). O
pera
tions
sta
rted
in 2
014
Ghan
aNz
ema
90
2.1
0 1
15 1
29
496
000
1
036
Go
vern
men
t of G
hana
(ow
ners
hip:
10
per c
ent)
Mal
iTa
bako
to 8
0 3
.90
127
323
8
07 0
00
1 3
35
Gove
rnm
ent o
f Mal
i (ow
ners
hip:
20
per c
ent)

67PREVIOUS ISSUES OF THE COMMODITIES AT A GLANCE
PREVIOUS ISSUES OF THE COMMODITIES AT A GLANCE
– Commodities at a glance, N°1: An historical perspective
– Commodities at a glance, N°2: Special issue on cotton in Africa
– Commodities at a glance, N°3: Special issue on energy
– Commodities at a glance, N°4: Special issue on food security
– Commodities at a glance, N°5: Special issue on rare earths

U N I T E D N AT I O N S C O N F E R E N C E O N T R A D E A N D D E V E L O P M E N T
N°6
COMMODITIES AT A GLANCESpecial issue on gold
Phot
o cr
edit:
Fot
olia
© R
oman
Bod
narc
huk
Layout and Printing at United Nations, Geneva – 1606266 (E) – April 2016 – 1,033 – UNCTAD/SUC/2015/3


![[LSD]LSD - Complete FBI Blotter Microgram Analysis Manual (1987)](https://img.dokumen.tips/doc/110x75/55cf98fa550346d0339acf6a/lsdlsd-complete-fbi-blotter-microgram-analysis-manual-1987.jpg)


