Embed Size (px)
Citation preview

SPECIAL ISSUE: NATURE’S MICROBIOME
Nitrogen deposition alters plant–fungal relationships:linking belowground dynamics to abovegroundvegetation change
SARAH L. HICKS,* EMILY C. FARRER,† D. LEE TAYLOR,*‡ ANDREA PORRAS-ALFARO,*§
KATHERINE N. SUDING† and ROBERT L. SINSABAUGH*
*Department of Biology, University of New Mexico, Albuquerque, NM, USA, †Department of Environmental Science, Policy &
Management, University of California, Berkeley, CA, USA, ‡Department of Biology and Wildlife, University of Alaska
Fairbanks, Fairbanks, AK, USA, §Department of Biological Sciences, Western Illinois University, Macomb, IL, USA1; 2; 31; 2; 31; 2; 3
Abstract
Nitrogen (N) deposition rates are increasing globally due to anthropogenic activities.
Plant community responses to N are often attributed to altered competitive interactions
between plants, but may also be a result of microbial responses to N, particularly root-
associated fungi (RAF), which are known to affect plant fitness. In response to N, Des-
champsia cespitosa, a codominant plant in the alpine tundra at Niwot Ridge (CO),
increases in abundance, while Geum rossii, its principal competitor, declines. Impor-
tantly, G. rossii declines with N even in the absence of its competitor. We examined
whether contrasting host responses to N are associated with altered plant–fungal sym-
bioses, and whether the effects of N are distinct from effects of altered plant competi-
tion on RAF using 454 pyrosequencing. Host RAF communities were very distinct
(only 9.4% of OTUs overlapped). N increased RAF diversity in G. rossii, but decreased
it in D. cespitosa. D. cespitosa RAF communities were more responsive to N than
G. rossii RAF communities, perhaps indicating a flexible microbial community aids
host adaptation to nutrient enrichment. Effects of removing D. cespitosa were distinct
from effects of N on G. rossii RAF, and D. cespitosa presence reversed RAF diversity
response to N. The most dominant G. rossii RAF order, Helotiales, was the most
affected by N, declining from 83% to 60% of sequences, perhaps indicating a loss of
mutualists under N enrichment. These results highlight the potential importance of
belowground microbial dynamics in plant responses to N deposition.
Keywords: 454 pyrosequencing, endophytes, Helotiales, ITS, nitrogen deposition, root fungi
Received 1 March 2013; revision received 17 September 2013; accepted 20 September 2013
Introduction
Nitrogen (N) emissions are increasing globally due to
anthropogenic activities (Vitousek et al. 1997; Dentener
et al. 2006), and N deposition rates in many areas of the
world are more than an order of magnitude higher
than they would be in the absence of human activity
(Galloway et al. 2008). Increased N availability can cause
a cascade of effects, including alteration of ecosystem
function (Carreiro et al. 2000; Knorr et al. 2005; Treseder
2008; De Vries et al. 2010), shifts in dominance between
plant species (Pennings et al. 2005; Suding et al. 2008),
reductions in plant species diversity (Strengbom et al.
2003; Bobbink 2004; Suding et al. 2005; Clark & Tilman
2008) and increased vulnerability of systems to invasion
(Bobbink 2004; Cherwin et al. 2009).
Traditionally, ecologists have assumed that interspe-
cific competition drives plant community response to
N, because species with adaptations for low nutrient
availability lose their competitive advantage as nutrient
availability increases (Bobbink et al. 2010). Recent stud-
ies have challenged the traditional assumption, showing
Correspondence: Andrea Porras-Alfaro and Sarah Hicks,
Fax: 309 298 2270; E-mails: [email protected] and
1
2
3
4
5
6
7
8
9
10
11
12
13
14
15
16
17
18
19
20
21
22
23
24
25
26
27
28
29
30
31
32
33
34
35
36
37
38
39
40
41
42
43
44
45
46
47
48
49
50
51
52
53
54
© 2013 John Wiley & Sons Ltd
Molecular Ecology (2013) doi: 10.1111/mec.12541
ME
C1
25
41
Dispa
tch:
10.10.13
Jour
nal:
MEC
CE:M
anim
ekalai
JournalName
ManuscriptNo.
No.
ofpa
ges:
15PE
:Pun
itha
-

that plant community response to N is not due solely
to altered plant competitive interactions (Roem &
Berendse 2000; Johnson et al. 2003; Suding et al. 2005),
and some studies suggest plant–microbe interactions may
play a key role (Johnson et al. 2008; Suding et al. 2008).
Over the past few decades, Niwot Ridge (CO, USA),
a long-term ecological research (LTER) site, has experi-
enced a steady increase in N deposition from the cities
of Boulder and Denver (Sievering et al. 1996; Williams
et al. 1996). Two codominant plant species, Geum rossii
(Rosaceae) and Deschampsia cespitosa (Poaceae), each
cover 30% of moist meadow alpine tundra at Niwot
Ridge (Suding et al. 2008). Long-term N fertilization,
and G. rossii and D. cespitosa removal plots established
in 2001 show that G. rossii declines in N plots whether
or not it is in competition with D. cespitosa, while
D. cespitosa abundance increases (Suding et al. 2008;
Farrer et al. 2013). These findings suggest that competi-
tion is not the only driver of vegetation community
response to N in alpine tundra. We suspect that fungal
response to N may drive aboveground plant response.
All plants harbour root-associated fungi (RAF),
defined here as any fungi within or in contact with
plant roots. Mutualist RAF can increase disease resis-
tance and abiotic stress tolerance, aid in nutrient acqui-
sition and/or reduce growth of targeted competitor
plants (Rodriguez et al. 2008; Porras-Alfaro & Bayman
2011). Parasitic RAF can play a major role in plant–soil
feedback processes that affect plant abundance (Kliron-
omos 2002). Therefore, how RAF respond to N, for
example, loss or gain of mutualists or parasites, should
influence host response to N.
Root-associated fungi respond in a variety of ways to
nutrient enrichment. N enrichment can encourage
purely parasitic species (Strengbom et al. 2002), or
mutualistic infection rates may decline (Yesmin et al.
1996; Treseder 2004; Morgan et al. 2005) or increase
with a parallel increase in parasitic tendencies (Johnson
et al. 1997; Upson et al. 2009b). Molecular studies that
examine RAF response to N report changes to RAF
community composition (Frey et al. 2004; Porras-Alfaro
et al. 2007; Avis et al. 2008; Cox et al. 2010), but the
functional meaning of these community shifts is rarely
discussed. Next-generation sequencing, which uncovers
more of the microbial communities in environmental
samples than traditional methods, has rarely been used
to assess microbial response to N.
At Niwot Ridge, soil fungal communities shifted with
N and community shifts were accompanied by altered
soil conditions, such as increased soil lignin content and
altered enzyme activity related to N cycling (Nemergut
et al. 2008). However, RAF communities are distinct
from soil fungal communities due to the unique envi-
ronment provided by the rhizosphere (Morgan et al.
2005; Porras-Alfaro & Bayman 2011) 4, so may respond
independently. Although RAF communities have been
described in several plant hosts from Niwot (Mullen &
Schmidt 1993; Schadt et al. 2001; Schmidt et al. 2008),
the effect of N on RAF has not yet been examined, and
the communities of the two moist meadow codominants
remain undescribed. Because RAF can directly impact
host fitness, their response to N enrichment could be
critical to aboveground vegetation dynamics (Klirono-
mos et al. 2011).
To determine whether RAF could be associated with
plant host response to N, we used barcoded 454
sequencing to characterize the RAF community in
G. rossii and D. cespitosa, and examine community
response to N. We hypothesize D. cespitosa may benefit
from N because it is able to terminate relationships with
symbiotic RAF as they become less valuable under
nutrient enrichment, resulting in a more flexible RAF
community. We predicted that D. cespitosa RAF commu-
nities would respond more to N addition than G. rossii
RAF, and that G. rossii would be more prone to infec-
tion by parasitic and pathogenic species than D. cespito-
sa in N plots. The identity of plant species in a focal
individual’s neighbourhood can have a significant,
though often weak, effect on the RAF community of
that individual (Bahram et al. 2011; Bogar & Kennedy
2012) 5. Because D. cespitosa increases in abundance in N
plots, shifts of G. rossii RAF in N plots could be due to
altered D. cespitosa abundance rather than to N itself.
By removing D. cespitosa from some plots, we examined
the effect of releasing G. rossii from competition on its
RAF. We predicted the presence or absence of a pri-
mary plant competitor would have minimal effect on
RAF communities compared with the effect of N, and
that N would have a distinct effect on RAF from D.
cespitosa removal. Interactions between N addition and
D. cespitosa removal would imply that the RAF commu-
nities of different host species mediate each other’s
responses to N enrichment.
Methods
Field
The study was conducted in moist meadow alpine
tundra on Niwot Ridge, an LTER site located 35 km
west of Boulder, CO, in the Front Range of the Rocky
Mountains, elevation 3297–3544 m. Winter and summer
mean temperatures are �13 and 8 °C. Soil is under
snow pack 9–10 months per year (http://culter.colorado.
edu/NWT/site_info/climate/climate.html 6). The moist
meadow is composed of forbes and grasses, dominated
by G. rossii, a rosaceous forb and D. cespitosa, a tillering
bunchgrass (May & Webber 1982).
© 2013 John Wiley & Sons Ltd
2 S . L . HICKS ET AL.
1
2
3
4
5
6
7
8
9
10
11
12
13
14
15
16
17
18
19
20
21
22
23
24
25
26
27
28
29
30
31
32
33
34
35
36
37
38
39
40
41
42
43
44
45
46
47
48
49
50
51
52
53
54

Plots used for this study are a subset of those estab-
lished by Suding et al. (2008) (coordinates between 40
03 01 N, 105 34 13 W and 40 03 38 N, 105 36 02 W).
Briefly, 1 9 1 m2 plots were set up at seven replicate
sites, between 200 and 800 m apart, in 2001. We
used four treatment plot types per site: N addition,
D. cespitosa removal, D. cespitosa removal + N addition
and control. N has been added annually to N addition
plots in the form of urea (at a maximum rate of
28.8 g N/m2/y, ~40 times natural deposition rates),
completely saturating soils. D. cespitosa has been
removed annually by repeated clipping (hereafter called
removal treatment). Clipping succeeded in killing most
of the D. cespitosa plants in the removal plots; clipped
biomass of D. cespitosa in 2008 was only 2% of the
clipped biomass in 2001.
In 2008, a G. rossii individual (defined by a single
aboveground rosette) was uprooted at random from
each treatment combination at each site. D. cespitosa
was collected from N and control plots in a subset of
sites. This resulted in a total of 28 G. rossii and 11
D. cespitosa root samples. Two D. cespitosa samples were
later excluded from analysis due to extremely different
RAF composition, indicative of contamination. Plants
were sent to University of New Mexico for storage and
processing.
Laboratory preparation
Root surfaces were washed aggressively with milliQ-
filtered water and stored at �80 °C. Roots were not
surface-sterilized because we were interested in both
endophytes and fungi associated with the root surface.
A mix of small, medium and large healthy looking
roots were selected from each plant and combined for
DNA extraction. Tissue was lysed with liquid N using
a mortar and pestle. DNA was extracted using DNEasy
Plant MiniKit (Qiagen). Geum rossii tissue is high in
phenolics, which inhibit polymerase enzymes. To
ensure a good extraction product, we checked that each
sample could be successfully amplified using ITS1F-4
primers. Extracts that could not be amplified were
diluted 1:10 in milliQ-filtered water to dilute phenolics,
which resulted in successful amplification of all
samples. Extracts were sent to Research and Testing
Laboratories (RTL) in Lubbock, TX for 454 titanium
pyrosequencing of the fungal ITS region, which has
been identified as the fungal barcode and has been used
in multiple environmental studies for its resolution at
the species level (Schoch et al. 2012), using ITS 1F-4
primers. Fungal libraries were created using a one-step
PCR with HotStar Taq master mix (Qiagen) and the
following thermocycles: initial denaturation at 95 °C for
5 min, and then 30 cycles of 95 °C for 30 s, 54 °C for
30 s and 72 °C for 1 min, and a final extension at 72 °C
for 10 min. Amplification products were pooled to equi-
molar concentrations and cleaned using Diffinity Rapid-
Tip (Diffinity Genomics) and size selected using
Agencourt AMPure XP (BeckmanCoulter). Hybridiza-
tions, emPCRs and sequencing followed manufacturer’s
protocols (454 Life Sciences). Samples were sequenced
in three runs (on a single region each), each sample
within a run had its own 8-nt barcode.
Sequence analysis
We used QIIME 1.7.0 (Caporaso et al. 2010) to remove
reads with mean quality scores less than 25 and shorter
than 150 bp. Because current curated databases fail to
encompass much of the diversity of fungal ITS
sequences recovered from environmental samples, we
used the de novo method in UCHIME as implemented in
QIIME (Edgar 2010; Edgar et al. 2011) to identify putative
chimeric ITS sequences. Each query was compared with
all sequences in the sequence library to identify poten-
tial pairs of parents and chimeric ‘offspring’ via 3-way
alignments. A total of 385 chimeras were removed from
140 561 sequences.
After chimera removal, sequences that were 97%
similar to each other were clustered into operational
taxonomic units (OTU) representative of distinct species
(Nilsson et al. 2008) using UCLUST (Edgar 2010) through
QIIME. The most common sequence in each cluster was
selected as the representative sequence for each OTU.
Representative sequences were BLASTed (Altschul et al.
1990) in QIIME against the Fungal Metagenomics Project’s
curated ITS database (University of Alaska, Fairbanks)
to assign taxonomy. Our results show that multiple
OTUs hit to the same species. If a sequence does not
have an identical match in the database, the BLAST
method results in hits to the best match available (with
e-value <0.001), so OTUs that obtained the same taxon-
omy assignment are closely related to each other, but
not necessarily the same species.
Data analysis
In all analyses, we test two models. First, we exclude
removal plots and test the effect of host, N addition,
and their interaction on various RAF community char-
acteristics, such as diversity, community composition
and relative abundance of individual taxa. Second, we
exclude D. cespitosa samples and test the effect of N,
removal and their interaction on G. rossii RAF commu-
nity characteristics. Community characteristics may
change at some taxonomic levels but not others.
Because ITS cannot be used to build accurate phyloge-
nies across the Fungi, the degree of relatedness of
© 2013 John Wiley & Sons Ltd
PLANT–FUNGAL RESPONSE TO N POLLUTION 3
1
2
3
4
5
6
7
8
9
10
11
12
13
14
15
16
17
18
19
20
21
22
23
24
25
26
27
28
29
30
31
32
33
34
35
36
37
38
39
40
41
42
43
44
45
46
47
48
49
50
51
52
53
54

affected OTUs is not incorporated into any of our
analyses. To assess which taxonomic levels were most
affected by host and treatment, we performed analyses
at all taxonomic levels.
Four hundred and fifty four sequencing poorly
resolves the exact length of homopolymers, which
occasionally results in sequences that diverge more
than 3% from the cluster to which they belong. The
resulting singletons (OTUs comprised of only one
sequence) are likely to be sequencing artefacts. Because
these artefacts are made without site bias, they have
no effect on community composition estimates
(Kuczynski et al. 2010). However, they result in overes-
timation of species richness (Reeder & Knight 2010).
We therefore excluded singletons from our analyses.
Doing so also excludes some true members of the rare
biosphere, but we are interested in taxa that may
impact overall plant fitness so are not concerned with
extremely rare taxa.
Alpha diversity was calculated in QIIME, version 1.7.0
(Caporaso et al. 2010), using Simpson’s diversity index,
Simpson’s evenness and taxonomic richness. There was
large variation in sequencing depth among samples. To
control biasing effects of sequencing depth on alpha
diversity measures, we rarefied samples by subsam-
pling to the depth of the most shallowly sequenced
sample (557 sequences). Rarefaction curves were not
saturated at this depth (Fig. S1, Supporting Informa-
tion). Alpha diversity measures were calculated on each
of 100 rarefactions, and averaged. Type III ANOVA (pack-
age nlme, Pinheiro et al. 2011; in R, R Development Core
Team 2011) was used to analyse effect of host and treat-
ments on RAF alpha diversity.
Redundancy analysis (RDA) and Monte Carlo permu-
tation tests based on Euclidean distances of unrarefied
data normalized by sample were used to test treatment
effects on RAF community composition (vegan package,
Oksanen et al. 2011; package nlme, Pinheiro et al. 2011).
One thousand permutations were used to obtain
pseudo-F and P statistics. OTUs present in fewer than
three plots were removed from analyses, as we were
primarily interested in members of the community that
are ubiquitous and whose presence or absence could be
responsible for G. rossii decline across N plots (McCune
et al. 2002). Euclidean distances were chosen because
shared absences reduce distance between communities.
This is a useful approach to address hypotheses con-
cerning species disappearance as well as invasion with
disturbance (Anderson et al. 2011). Our hypothesis is
that loss or gain of RAF species could be responsible
for G. rossii response to N and thus shared losses
should be counted as important. Data were log-trans-
formed to improve signal from less abundant OTUs in
community distance calculations, and site was included
as a cofactor in all analyses. SIMPER (PRIMER, version 6)
was used to identify which species contributed most
to pairwise distances between host and treatment
combinations.
SIMPER can confound mean group distances with
within group variability, which causes it to sometimes
identify the most variable species rather than the taxa
that contribute most to community distances (Warton
et al. 2012). Additionally, low abundance taxa that con-
tribute little to community distances may be important
if they are responsible for disease in the host. We there-
fore used type III ANOVA (package nlme, Pinheiro et al.
2011) on rarefied data to verify SIMPER results and to
detect less dominant RAF taxa that shift significantly
with host and/or treatment. Taxa in fewer than three
plots were removed from the analysis to focus on ubiq-
uitous taxa whose presence or absence could be respon-
sible for G. rossii decline, and because two replicates are
too few to make statistical comparisons. Due to the
large number of comparisons, a false discovery rate
(FDR, Yoav & Yosef 1995) correction was applied
to P-values. Only one taxa was correlated with N
amendments after FDR correction, so we also discuss
uncorrected results. Overall communities significantly
differed between host and treatment plots, suggesting
more than a single OTU is affected by N. Our statistical
power may be weak given the small number of repli-
cates (n = 7 at most per treatment) and disregarding
raw P-values likely results in discarding many true pos-
itives. Several OTUs with identical database hits were
significantly correlated with N in the same direction
when FDR was not applied, strengthening support for
the effect of N on those related taxa.
Results
Host RAF communities
After filtering and chimera checking, a total of 104 668
sequences were obtained. 103 169 sequences were from
G. rossii roots constituting 1499 OTUs (averaging 3685
sequences and 118 OTUs/sample; SE = 403.46 and 6.33,
respectively) and 19 210 sequences from D. cespitosa
making up 479 OTUs (averaging 2134 sequences and 89
OTUs/sample; SE = 279.36 and 8.54, respectively). Only
9.4% of the 785 OTUs found in control plots were
shared between hosts.
In control plots, both hosts were dominated by
Ascomycota (95% in G. rossii, 82% in D. cespitosa). In
G. rossii, the next dominant phylum was Basidiomycota
(4%), followed by Glomeromycota (1%) and fungi
with no BLAST hits or hits to unclassified fungi (1%).
D. cespitosa roots obtained more hits to unclassified
fungi (12%) than Basidiomycota (6%).
© 2013 John Wiley & Sons Ltd
4 S . L . HICKS ET AL.
1
2
3
4
5
6
7
8
9
10
11
12
13
14
15
16
17
18
19
20
21
22
23
24
25
26
27
28
29
30
31
32
33
34
35
36
37
38
39
40
41
42
43
44
45
46
47
48
49
50
51
52
53
54

Geum rossii roots were strongly dominated by fungi
in the order Helotiales (83%), and more than a third of
sequences were unidentified Helotiales. The most abun-
dant orders in D. cespitosa were as follows: Helotiales
(30%), Mortierellales (16%), Pleosporales (15%), Hypo-
creales (7%) and Agaricales (6%). Another 9% of the
communities were comprised of unknown orders in
Ascomycota. We compared alpha diversity measures
between hosts from control plots only. D. cespitosa com-
munities were more diverse than those from G. rossii,
mainly due to greater order evenness, and a trend
towards greater richness (Table 1, Fig. 1).
Treatment effects on RAF alpha diversity
There were marginal and significant interactions
between host and N on Simpson’s diversity from family
through phylum, in which N decreased or did not
change diversity of D. cespitosa RAF, but increased
diversity of G. rossii RAF. N also tended to decrease
richness in D. cespitosa but increased richness in G. rossii
(Table 1).
When the effects of N addition and removal were
examined on G. rossii, removal did not have a significant
effect on alpha diversity on its own, but there were mar-
ginal and significant interactions between treatments on
taxonomic richness at most taxonomic levels, in which N
increased richness in the presence of D. cespitosa but
decreased it in the competitor’s absence. Simpson’s
diversity at the class and order level also exhibited inter-
active effects: N increased diversity in the presence of
D. cespitosa, but decreased diversity in its absence. Over-
all, N and removal treatments had the most significant
effects on family through class alpha diversity (Table 2).
Treatment effects on RAF community composition
Geum rossii and D. cespitosa RAF community composition
were significantly different at all taxonomic levels (as
shown by RDA, Fig. 2a, Table 3). This effect was strongest
when communities were described by coarser taxonomic
groupings such as phylum, where 35.35% of community
variation was explained by host (pseudo-F = 11.69,
Table 1 Effect of treatment on alpha diversity measures of RAF in G. rossii and Deschampsia cespitosa at each taxonomic level
Means Model: host + N + host*N
Model: host (control plots only)
DesC DesN GeumC GeumN P (Host) P (N) P (interaction) P (host)
OTU
Simpson’s 0.93 0.89 0.94 0.96 0.05* 0.62 0.23 0.56
Evenness 0.15 0.15 0.26 0.20 0.06 0.43 0.45 0.17
Richness 105.30 79.66 112.03 134.45 0.03* 0.90 0.08 0.77
Genus
Simpson’s 0.88 0.80 0.82 0.82 0.46 0.18 0.13 0.06
Evenness 0.26 0.22 0.24 0.20 0.52 0.21 0.90 0.61
Richness 34.62 28.18 26.52 33.20 0.68 0.97 0.09 0.13
Family
Simpson’s 0.84 0.79 0.69 0.76 <0.01* 0.84 0.06 <0.01*
Evenness 0.27 0.24 0.21 0.20 0.08 0.59 0.82 0.19
Richness 25.72 23.28 18.34 23.26 0.18 0.64 0.18 0.07
Order
Simpson’s 0.77 0.78 0.32 0.56 <0.01* <0.01* <0.01* <0.01*
Evenness 0.29 0.34 0.12 0.15 <0.01* 0.39 0.89 <0.01*
Richness 17.39 15.30 13.87 16.79 0.56 0.81 0.16 0.21
Class
Simpson’s 0.73 0.68 0.30 0.49 <0.01* 0.11 0.01* <0.01*
Evenness 0.42 0.45 0.15 0.2 <0.01* 0.45 0.82 0.002*
Richness 9.72 7.56 9.85 10.36 0.12 0.37 0.15 0.92
Phylum
Simpson’s 0.38 0.21 0.08 0.13 <0.01* 0.25 0.05* <0.01*
Evenness 0.42 0.41 0.34 0.36 0.16 0.92 0.66 0.25
Richness 4.07 3.24 3.45 3.50 0.58 0.23 0.18 0.29
Diversity measure means for each host 9 treatment combination, as well as P-values for effect of each treatment and their interaction
on alpha diversity, are displayed. Removal plots are excluded from this analysis.
DesC, D. cespitosa control; DesN, D. cespitosa N addition; GeumC, G. rossii control; GeumN, Geum rossii N addition.
Marginal and significant effects are italicized, significant effects include an asterisk.
© 2013 John Wiley & Sons Ltd
PLANT–FUNGAL RESPONSE TO N POLLUTION 5
1
2
3
4
5
6
7
8
9
10
11
12
13
14
15
16
17
18
19
20
21
22
23
24
25
26
27
28
29
30
31
32
33
34
35
36
37
38
39
40
41
42
43
44
45
46
47
48
49
50
51
52
53
54

PMC = 0.001). There were marginal or significant interac-
tions between host and N at all taxonomic levels: N
addition caused greater shifts in D. cespitosa than in
G. rossii community composition (Fig. 2a, Table 3). These
patterns were consistent when using NMDS plots and
permutation of Bray–Curtis distances to identify between
group variation (vegan package in R, Oksanen et al. 2011)
(Fig S1 and Table S1, Supporting Information). According
to SIMPER analyses, the OTUs that contributed most to
N-induced community shifts in G. rossii were related to
Articulospora tetracladia (increased), several Lachnum spp.
(decreased), Helotiales spp. (decreased), Phialocephala spp.
(increased) and a Phialophora spp. (increased) (Table S2,
Supporting Information). Most OTUs belonged to the
order Helotiales. The OTUs that contributed most to
community shifts with N in D. cespitosa were identified as
Microdochium spp. (increased), Geomyces spp. (increased)
and Herpotrichia juniperi (decreased) (Table S2, Supporting
Information).
When both treatments were considered, we found N
affected G. rossii communities at finer taxonomic levels
(species through order) and explained up to 10.34% of
community variation (at the genus level). Removal also
had an effect on community composition, but only at
the species and genus level (in the latter it explained
5.62% of community variation, Table 3, Fig. 2b). Signifi-
cant interactions between treatments were found on
Bray–Curtis distances at taxonomic levels family, order
and class but not on Euclidean distances at any taxo-
nomic level (Table S1, Supporting Information). Species
that contributed most to community shifts with N addi-
tion according to SIMPER were again, Articulospora tetracl-
adia, several Lachnum, Helotiales and Phialocephala spp
and a Phialophora spp. Species that contributed most to
community shifts with removal also belonged to
Articulospora tetracladia, Lachnum and unidentified
Helotiales spp, and Phialocephala europa (Table S3,
Supporting Information).
Treatment effects on individual RAF taxa
ANOVA found only four OTUs to be significantly affected
by N in G. rossii and four to be significantly affected by
N in D. cespitosa (Table 4). In G. rossii, these were iden-
tified as close relatives of a Rhizoscyphus ericae aggregate
spp., Meliniomyces bicolor and two unidentified Heloti-
ales. All declined with N except one unidentified
Helotiales. In D. cespitosa, affected species belonged to the
genera Geomyces (positively affected by N), Gyoerffyella,
Gibberella, and Mortierella (negatively affected). All
G. rossii OTUs that responded belonged to the order
Helotiales. When tested, the order Helotiales as a whole
declined significantly with N, from 83% to 60% of com-
munity composition. This was also the only taxonomic
group to shift significantly with N after FDR correction.
No OTUs related to known pathogens responded signif-
icantly to N in G. rossii, and one putative pathogen
responded negatively to N in D. cespitosa (Table 4).
When the effects of both treatments on G. rossii RAF
were examined, many more taxa were found to be sig-
nificantly affected by N, likely due to inclusion of more
N vs. no N replicates crossed with removal (Table 5).
Most taxa affected were also identified as important
using SIMPER (Table S3, Supporting Information). Several
putative saprobes increased with N, but these were of
low abundance and were not found to be important to
community shifts using SIMPER. Dark septate endophytes
(DSE) increased with N, whereas several species identi-
fied as ericoid mycorrhizal fungi (ERM) decreased with
N. Eight OTUs were affected by the interaction between
N and removal, responding to N differently depending
on the presence or absence of D. cespitosa. These were
Fig. 1 15Order profiles of the two hosts
from control plots.
COLOR
© 2013 John Wiley & Sons Ltd
6 S . L . HICKS ET AL.
1
2
3
4
5
6
7
8
9
10
11
12
13
14
15
16
17
18
19
20
21
22
23
24
25
26
27
28
29
30
31
32
33
34
35
36
37
38
39
40
41
42
43
44
45
46
47
48
49
50
51
52
53
54

mostly unknown Helotiales or Lachnum spp, one was
related to a common soil fungi in cold soils, one to an
ERM and one to a potential pathogen.
A number of OTUs related to known ERM decreased
with removal. Other than this, no consistent trend could
be found between ecological function and removal.
Though several OTUs affected by removal had BLAST
hits to the same genus or species as those affected by
N, several genera were affected by only one treatment
type.
Table 2 Effect of treatment on alpha diversity measures of RAF in Geum rossii at each taxonomic level
Means Model: N + removal + N*removal
CC CN DC DN P (N) P (removal) P (interaction)
OTU
Simpson’s 0.94 0.96 0.94 0.90 0.43 0.12 0.11
Evenness 0.26 0.20 0.16 0.15 0.22 0.02* 0.51
Richness 112.03 134.45 121.51 100.87 0.94 0.31 0.08
Genus
Simpson’s 0.82 0.82 0.77 0.79 0.59 0.07 0.74
Evenness 0.24 0.20 0.15 0.21 0.72 0.11 0.06
Richness 26.52 33.20 32.99 24.70 0.82 0.77 0.04*
Family
Simpson’s 0.69 0.76 0.69 0.73 0.05* 0.67 0.68
Evenness 0.21 0.20 0.16 0.23 0.11 0.84 0.04*
Richness 18.34 23.26 22.01 17.77 0.89 0.72 0.08
Order
Simpson’s 0.32 0.56 0.42 0.40 0.02* 0.50 <0.01*
Evenness 0.12 0.15 0.11 0.14 0.02* 0.38 0.86
Richness 13.87 16.79 17.04 13.25 0.80 0.91 0.05*
Class
Simpson’s 0.30 0.49 0.40 0.37 0.08 0.85 0.02*
Evenness 0.15 0.2 0.16 0.19 <0.01* 0.85 0.51
Richness 9.85 10.36 11.09 8.71 0.27 0.81 0.09
Phylum
Simpson’s 0.08 0.13 0.10 0.07 0.77 0.58 0.29
Evenness 0.34 0.36 0.29 0.36 0.23 0.47 0.56
Richness 3.45 3.50 4.28 3.29 0.21 0.40 0.17
Diversity measure means for each host 9 treatment combination, as well as P-values for effect of each treatment and their interaction
on alpha diversity, are displayed.
Deschampsia cespitosa is excluded from this analysis. CC, control; CN, N addition; DC, D. cespitosa removal; DN, D. cespitosa
removal + N addition.
Marginal and significant effects are italicized, significant effects include an asterisk.
–
–
– – –
(a) (b) Fig. 2 RDA plots of host and treatment
effects on RAF communities at the genus
level, the taxonomic level at which effects
were strongest. (a) Axes are constrained
by host and N addition. Diamonds indi-
cate N plots, circles indicate no N plots.
Dark symbols indicate D. cespitosa, open
circles indicate G. rossii. Significant inter-
action (pseudo-F = 2.4081, Monte Carlo
permutation test PMC = 0.009). (b) Axes
are constrained by N and removal.
Diamonds indicate N plots, circles indi-
cate no N plots. Dark symbols indicate
D. cespitosa removal plots, open circles
received no removal.
COLOR
© 2013 John Wiley & Sons Ltd
PLANT–FUNGAL RESPONSE TO N POLLUTION 7
1
2
3
4
5
6
7
8
9
10
11
12
13
14
15
16
17
18
19
20
21
22
23
24
25
26
27
28
29
30
31
32
33
34
35
36
37
38
39
40
41
42
43
44
45
46
47
48
49
50
51
52
53
54

Table 3 Results of permutation tests on Euclidean distances. ‘F‘ indicate pseudo-F
Taxonomic Level Host (F) Host (P) N (F) N (P) Host 9 N (F) Host 9 N (P)
Host + N + Host 9 N
Phylum 12.252 0.001* 1.184 0.295 2.523 0.093
Class 9.782 0.001* 2.502 0.023* 1.815 0.105
Order 7.247 0.001* 2.920 0.011* 2.129 0.030*
Family 5.584 0.001* 2.825 0.003* 2.178 0.011*
Genus 5.766 0.001* 2.871 0.001* 2.252 0.009*
OTU 3.657 0.001* 1.919 0.005* 1.587 0.033*
Taxonomic Level N (F) N (P) Removal (F) Removal (P) N 9 removal (F) N 9 removal (P)
N + removal + N 9 removal
Phylum 0.887 0.428 0.812 0.474 0.708 0.549
Class 1.710 0.092 1.865 0.085 0.815 0.572
Order 2.215 0.014* 1.296 0.213 1.140 0.320
Family 1.722 0.051 1.085 0.379 1.349 0.164
Genus 3.299 0.001* 1.786 0.026* 1.067 0.376
OTU 2.003 0.001* 1.564 0.019* 1.068 0.387
The first model tests the effects of host plant and N on RAF community composition. The second model tests the effect of N and
removal on Geum rossii RAF.
Marginal and significant effects are italicized, significant effects include an asterisk.
Table 4 Geum rossii and Deschampsia cespitosa RAF taxa significantly correlated with N addition with type III ANOVA
Taxon Effect direction P
Relative
abundance
(C) (%)
Relative
abundance
(N) (%) Ecological function
Geum rossii
Class Leotiomycetes – 0.014 83.87 66.65
Order Helotiales* – <0.001 83.24 60.27
Genus Geomyces + 0.014 0.11 2.40
Meliniomyces – 0.018 7.03 0.15
Papulaspora + 0.017 0.00 0.54
Rhizoscyphus – 0.023 7.18 0.57
Unknown Helotiales + 0.038 4.29 0.91
OTU Helotiales sp. B1 + 0.002 0.05 1.67 Ubiquitous and diverse order
Helotiales sp .16 MV-2011 – 0.044 6.10 0.90 Ubiquitous and diverse order
Rhizoscyphus ericae aggregate – 0.039 1.63 0.05 Ericoid mycorrhizae
Meliniomyces bicolor – 0.024 3.62 0.00 Ericoid mycorrhizae
Deschampsia cespitosa
Phylum Ascomycota + 0.003 75.13 87.29
Order Mortierellales – 0.046 15.63 8.48
Genus Mortierella – 0.046 18.86 9.01
Unknown Helotiales – 0.023 5.78 1.33
OTU Geomyces sp. FMCC-3 + 0.018 0.07 1.00 Psychrotolerant soil fungi, Saprobe
Gibberella sp. PPn9-A Fr – 0.043 2.51 0.46 Potential pathogen
Gyoerffyella sp. PB1-R3-D Fr.3 – 0.007 0.39 0.30 Dark septate fungi
Mortierella sp. W161 – 0.047 1.19 0.10 Saprobic
These data exclude removal plots from G. rossii samples. Taxa present in fewer than three plots were removed from analysis.
Uncorrected P-values, direction of N effect and relative abundance of the taxa are listed.
Taxa significantly correlated with treatment after FDR correction are indicated by an asterisk. Putative ecological functions of OTUs
correlated with N are included.
© 2013 John Wiley & Sons Ltd
8 S . L . HICKS ET AL.
1
2
3
4
5
6
7
8
9
10
11
12
13
14
15
16
17
18
19
20
21
22
23
24
25
26
27
28
29
30
31
32
33
34
35
36
37
38
39
40
41
42
43
44
45
46
47
48
49
50
51
52
53
54
Discussion
Here, we report substantial host-specific effects of N
enrichment on RAF, suggesting that RAF communities
may be important drivers of response to N in two
dominant alpine tundra plants.
Plant species host different RAF communities
There were substantial differences between the RAF
communities of the two hosts under natural conditions,
perhaps accounting for their divergent responses to N.
G. rossii’s RAF community was strongly dominated by
the order Helotiales. Helotiales are common root fungi,
and include many ERM and DSE (Zijlstra et al. 2005;
Newsham et al. 2009;7 Tedersoo et al. 2009). ERM are
common mutualists in nutrient poor soils (Read 1996),
and can provide hosts with resistance to plant-
produced phytotoxic tannins and other environmental
stresses (Cairney & Ashford 2002; Cairney & Meharg
2003). DSE from the Helotiales are common mutualists
in cold-stressed habitats, particularly of Rosaceae plants
(Newsham et al. 2009; Upson et al. 2009a; Newsham
2011). ERM and DSE have both been shown to harvest
and provide their hosts with nutrients immobilized in
organic matter (which is high in cold soils due to slow
decomposition rates) (Read 1996; Caldwell et al. 2000;
Upson et al. 2009a).
In this study, many of G. rossii’s most abundant
OTUs match known DSE and ERM, and more are
unidentified Helotiales. Inoculation experiments deduc-
ing the function of unidentified Helotiales root isolates
from cold or heathland soils suggest many are mutual-
ists, especially when supplied with an organic N
source, and are likely DSE or ERM (Zijlstra et al. 2005;
Upson et al. 2009b; Newsham 2011). A large abundance
of this taxonomic group might suggest G. rossii RAF
specialize in harvesting immobilized nutrients from
these high organic matter soils and/or influence G.
rossii tolerance to environmental stresses associated
with cold climates. Interestingly, G. rossii immobilizes
N in the biomass of associated microbes and phenolic
exudates (Bowman et al. 2004; Meier et al. 2009).
Perhaps G. rossii’s RAF community improves uptake of
these sequestered nutrients.
Deschampsia espitosa RAF were more diverse than
those of G. rossii. D. cespitosa covers a much broader
geographic and environmental range than G. rossii (bio-
diversity occurrence data accessed through GBIF data
portal, data.gbif.org), which may be facilitated by its
diversified symbiont community. Diverse RAF may
provide versatility via resistance to a wider variety of
stresses, and access to nutrients from a wider variety of
sources.
That the RAF communities of the two hosts differ is
not surprising, as other research has found unique fun-
gal communities associated with different host species
residing in the same habitat (Upson et al. 2009a). More
interesting is that the RAF communities from the
two hosts differed in their response to N, perhaps
due to differences in RAF communities under ambient
conditions.
N and plant competition differentially impact RAFcommunities in two codominant plant hosts
Nitrogen had opposing effects on the RAF from the two
hosts, increasing Simpson’s diversity in G. rossii but
decreasing or not changing it in D. cespitosa. D. cespitosa
lost RAF taxonomic richness under N, while G. rossii
gained richness. N also caused a massive reduction in
the dominant order, Helotiales, in G. rossii, contributing
to the positive effect of N on G. rossii diversity. These
results contrast with other studies, which have shown a
decrease in fungal biodiversity under elevated N (Frey
et al. 2004; Avis et al. 2008; Lilleskov et al. 2008). How-
ever, these studies have primarily examined above-
ground fruiting bodies rather than DNA from root
tissue. Observed aboveground fungal diversity may not
correlate with belowground diversity (Gardes & Bruns
1996). Porras-Alfaro et al. (2007) found N increased ar-
buscular mycorrhizal fungal (AMF) diversity using
molecular methods and also attributed this to loss of
the dominant AMF species.
When D. cespitosa was removed, the alpha diversity
trends in G. rossii were reversed. The ecological or bio-
logical implications of these interactions are difficult to
determine. As far as we know, no other study has
described such interactions between N and neighbour
identity on RAF diversity. These data show that pres-
ence of certain plant species can influence the effect of
N on a focal individual’s RAF diversity.
It has been shown that initial evenness in microbial
communities provides resilience and preserves func-
tional stability in the face of environmental stress,
because uneven communities depend heavily upon the
functional role of the most dominant taxa, which may
decline without replacement (Wittebolle et al. 2009).
Thus, the extreme dominance and potential functional
importance of Helotiales in G. rossii may make G. rossii
RAF vulnerable to functional disturbance. D. cespitosa
RAF diversity may provide functional stability in the
face of environmental change due to greater functional
redundancy.
Deschampsia cespitosa communities were more sensi-
tive to N than were G. rossii communities. Perhaps this
flexible RAF response contributes to D. cespitosa’s ability
to adapt to N enrichment. Research suggests hosts that
© 2013 John Wiley & Sons Ltd
PLANT–FUNGAL RESPONSE TO N POLLUTION 9
1
2
3
4
5
6
7
8
9
10
11
12
13
14
15
16
17
18
19
20
21
22
23
24
25
26
27
28
29
30
31
32
33
34
35
36
37
38
39
40
41
42
43
44
45
46
47
48
49
50
51
52
53
54

Tab
le5
Geum
rossiiRAFthat
aresignificantlycorrelated
withtreatm
ent
Tax
athat
withN
Speciesnam
eEffect
CC
CN
DC
DN
PEcological
function
Ascomycota
Leo
tiomycetesHelotiales
Helotiaceae
Articulosporatetracladia
–0.18
0.00
0.00
0.00
0.036
Sap
robic
Meliniomyces
bicolor
–2.03
0.00
0.23
0.06
0.028
Ericoid
mycorrhizae
Meliniomycesbicolor
–3.14
0.00
0.31
0.10
0.002
Ericoid
mycorrhizae
Rhizoscyphu
sericae
–0.97
0.00
0.03
0.03
0.021
Ericoid
mycorrhizae
Rhizoscyphu
sericae
–1.04
0.04
0.16
0.07
0.031
Ericoid
mycorrhizae
Rhizoscyphu
sericae
aggregate
–1.41
0.03
0.63
0.11
0.004
Ericoid
mycorrhizae
Rhizoscyphu
sericae
aggregate
–1.22
0.00
0.06
0.03
0.038
Ericoid
mycorrhizae
Leo
tiomycetesHelotiales
Hyaloscyphaceae
Lachnum
sp.YM272
–/+
0.07
0.00
0.00
0.03
0.049
Mostly
saprobic,commonly
rootassociated
Lachn
um
sp.252
–0.08
0.00
0.00
0.03
0.037
Mostly
saprobic,commonly
rootassociated
Leo
tiomycetesHelotiales
unknown
Helotialessp.16MV-2011
–/+
5.32
0.70
0.95
1.85
0.005
Ubiquitousan
ddiverse
ord
er
Leo
tiomycetesHelotiales
incertae
sedis
Phialocephala
fortinii
+0.00
0.27
0.07
0.04
0.028
Darkseptate
endophyte
Phialocephala
turiciensis
+0.00
1.25
0.40
0.54
0.033
Darkseptate
endophyte
Leo
tiomycetesincertae
sedis
Myxotrichaceae
Geomyces
pannorum
+0.00
0.18
0.00
0.00
0.009
Psych
rotolerantsoilfungi,saprobe
Geomyces
sp.FFI30
+0.06
0.99
0.18
0.55
0.025
Psych
rotolerantsoilfungi,saprobe
Geomycessp.FMCC-2
+0.00
0.11
0.00
0.00
0.008
Psych
rotolerantsoilfungi,saprobe
Geomyces
sp.FMCC-2
+0.00
0.25
0.00
0.00
0.013
Psych
rotolerantsoilfungi,saprobe
Sord
ariomycetesHypocrealesHypocreaceae
Hypocrearufa
+0.00
0.17
0.00
0.04
0.032
Mostly
saprobic
Incertae
sedis
Papulasporasp.MTFD02
+0.00
0.40
0.00
0.04
0.012
Potential
plantan
dfungal
pathogen
s
Papulaspora
sp.MTFD02
+/–
0.00
0.16
0.09
0.00
0.049
Potential
plantan
dfungal
pathogen
s
Spirosphaerabeverw
ijkiana
–0.57
0.00
0.34
0.00
0.021
Aquatic
hyphomycete
Tetracladium
furcatum
+0.14
0.89
0.13
0.00
0.028
Sap
robic
Incertae
sedis
Incertae
sedis
Mortierellales
Mortierellaceae
Mortierella
alpine
+0.00
0.14
0.00
0.00
0.009
Sap
robic
Tax
athat
shiftwithDescham
psia
cespitosaremoval
SpeciesNam
eEffectdirection
CC
CN
DC
DN
PEcological
function
Ascomycota
EurotiomycetesChaetothyriales
Herpotrichiellaceae
Capronia
sp.UBCTRA
+0.09
0.00
0.53
0.05
0.030
Root-associated
saprobes
Capronia
sp.UBCTRA
+0.00
0.10
0.24
0.03
0.037
Root-associated
saprobes
Leo
tiomycetesHelotiales
Helotiaceae
Articulosporatetracladia
–0.18
0.00
0.00
0.00
0.036
Sap
robic
Meliniomyces
bicolor
–0.22
0.03
0.00
0.04
0.028
Ericoid
mycorrhizae
Meliniomyces
bicolor
–2.03
0.00
0.23
0.06
0.049
Ericoid
mycorrhizae
Meliniomycesbicolor
+/–
3.13
0.00
0.31
0.10
0.002
Ericoid
mycorrhizae
Rhizoscyphysericae
–0.97
0.00
0.03
0.03
0.021
Ericoid
mycorrhizae
Leo
tiomycetesHelotiales
Hyaloscyphaceae
Lachnum
sp.252
+/–
0.08
0.00
0.00
0.03
0.045
Mostly
saprobic,commonly
rootassociated
Lachn
um
sp.YM272
–0.07
0.00
0.00
0.03
0.048
Mostly
saprobic,commonly
rootassociated
Lachn
um
sp.YM272
+0.00
0.03
0.54
0.00
0.048
Mostly
saprobic,commonly
rootassociated
Lachn
um
sp.YM272
+0.55
0.09
1.98
0.16
0.030
Mostly
saprobic,commonly
rootassociated
Lachn
um
sp.YM272
+0.00
0.00
0.66
0.00
0.011
Mostly
saprobic,commonly
rootassociated
Lachn
um
sp.YM272
+0.00
0.05
0.56
0.00
0.047
Mostly
saprobic,commonly
rootassociated
© 2013 John Wiley & Sons Ltd
10 S . L . HICKS ET AL.
1
2
3
4
5
6
7
8
9
10
11
12
13
14
15
16
17
18
19
20
21
22
23
24
25
26
27
28
29
30
31
32
33
34
35
36
37
38
39
40
41
42
43
44
45
46
47
48
49
50
51
52
53
54
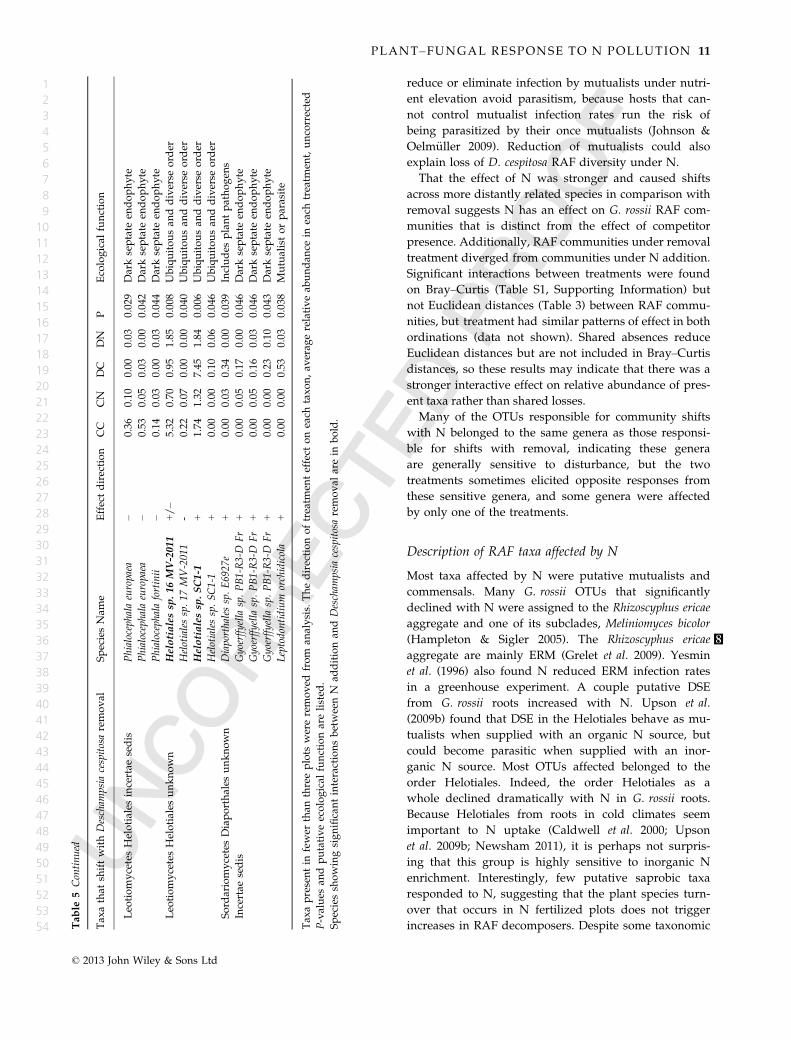
reduce or eliminate infection by mutualists under nutri-
ent elevation avoid parasitism, because hosts that can-
not control mutualist infection rates run the risk of
being parasitized by their once mutualists (Johnson &
Oelm€uller 2009). Reduction of mutualists could also
explain loss of D. cespitosa RAF diversity under N.
That the effect of N was stronger and caused shifts
across more distantly related species in comparison with
removal suggests N has an effect on G. rossii RAF com-
munities that is distinct from the effect of competitor
presence. Additionally, RAF communities under removal
treatment diverged from communities under N addition.
Significant interactions between treatments were found
on Bray–Curtis (Table S1, Supporting Information) but
not Euclidean distances (Table 3) between RAF commu-
nities, but treatment had similar patterns of effect in both
ordinations (data not shown). Shared absences reduce
Euclidean distances but are not included in Bray–Curtis
distances, so these results may indicate that there was a
stronger interactive effect on relative abundance of pres-
ent taxa rather than shared losses.
Many of the OTUs responsible for community shifts
with N belonged to the same genera as those responsi-
ble for shifts with removal, indicating these genera
are generally sensitive to disturbance, but the two
treatments sometimes elicited opposite responses from
these sensitive genera, and some genera were affected
by only one of the treatments.
Description of RAF taxa affected by N
Most taxa affected by N were putative mutualists and
commensals. Many G. rossii OTUs that significantly
declined with N were assigned to the Rhizoscyphus ericae
aggregate and one of its subclades, Meliniomyces bicolor
(Hampleton & Sigler 2005) 8. The Rhizoscyphus ericae
aggregate are mainly ERM (Grelet et al. 2009). Yesmin
et al. (1996) also found N reduced ERM infection rates
in a greenhouse experiment. A couple putative DSE
from G. rossii roots increased with N. Upson et al.
(2009b) found that DSE in the Helotiales behave as mu-
tualists when supplied with an organic N source, but
could become parasitic when supplied with an inor-
ganic N source. Most OTUs affected belonged to the
order Helotiales. Indeed, the order Helotiales as a
whole declined dramatically with N in G. rossii roots.
Because Helotiales from roots in cold climates seem
important to N uptake (Caldwell et al. 2000; Upson
et al. 2009b; Newsham 2011), it is perhaps not surpris-
ing that this group is highly sensitive to inorganic N
enrichment. Interestingly, few putative saprobic taxa
responded to N, suggesting that the plant species turn-
over that occurs in N fertilized plots does not trigger
increases in RAF decomposers. Despite some taxonomicTable
5Continued
Tax
athat
shiftwithDescham
psia
cespitosaremoval
SpeciesNam
eEffectdirection
CC
CN
DC
DN
PEcological
function
Leo
tiomycetesHelotiales
incertae
sedis
Phialocephala
europaea
–0.36
0.10
0.00
0.03
0.029
Darkseptate
endophyte
Phialocephala
europaea
–0.53
0.05
0.03
0.00
0.042
Darkseptate
endophyte
Phialocephala
fortinii
–0.14
0.03
0.00
0.03
0.044
Darkseptate
endophyte
Leo
tiomycetesHelotiales
unknown
Helotialessp.16MV-2011
+/–
5.32
0.70
0.95
1.85
0.008
Ubiquitousan
ddiverse
ord
er
Helotialessp.17
MV-2011
-0.22
0.07
0.00
0.00
0.040
Ubiquitousan
ddiverse
ord
er
Helotialessp.SC1-1
+1.74
1.32
7.45
1.84
0.006
Ubiquitousan
ddiverse
ord
er
Helotialessp.SC1-1
+0.00
0.00
0.10
0.06
0.046
Ubiquitousan
ddiverse
ord
er
Sord
ariomycetesDiaporthales
unknown
Diaporthalessp.E6927e
+0.00
0.03
0.34
0.00
0.039
Includes
plantpathogen
s
Incertae
sedis
Gyoerffyellasp.PB1-R3-D
Fr
+0.00
0.05
0.17
0.00
0.046
Darkseptate
endophyte
Gyoerffyellasp.PB1-R3-D
Fr
+0.00
0.05
0.16
0.03
0.046
Darkseptate
endophyte
Gyoerffyellasp.PB1-R3-D
Fr
+0.00
0.00
0.23
0.10
0.043
Darkseptate
endophyte
Leptodontidium
orchidicola
+0.00
0.00
0.53
0.03
0.038
Mutualistorparasite
Tax
apresentin
fewer
than
threeplots
wereremoved
from
analysis.
Thedirectionoftreatm
enteffect
oneach
taxon,av
erag
erelativeab
undan
cein
each
treatm
ent,uncorrected
P-values
andputativeecological
functionarelisted
.
Speciessh
owingsignificantinteractionsbetweenN
additionan
dDescham
psia
cespitosaremoval
arein
bold.
© 2013 John Wiley & Sons Ltd
PLANT–FUNGAL RESPONSE TO N POLLUTION 11
1
2
3
4
5
6
7
8
9
10
11
12
13
14
15
16
17
18
19
20
21
22
23
24
25
26
27
28
29
30
31
32
33
34
35
36
37
38
39
40
41
42
43
44
45
46
47
48
49
50
51
52
53
54

overlap, several RAF species responded only to N or to
removal, again highlighting the distinct effects of N vs.
competitor presence.
Deschampsia cespitosa OTUs found to be affected by N
did not share a common phylogeny or known ecologi-
cal function. The order Mortierellales declined with N,
which contains mostly saprobes, and includes many
genera with the ability of complex organic substrate
transformations (Wagner et al. 2013), but members of
this order were rare.
RAF and host response to N
Geum rossii are asymptomatic in N addition plots
(Farrer, pers. comm.), they simply do not return after a
4-year lag from the start of N addition (Suding et al.
2008). Parasites may be depleting C resources required
for overwintering. There is substantial evidence that
G. rossii plants are C limited in N plots, having very
reduced C/N ratios, lower nonstructural carbohydrate
levels in rhizomes and fewer preformed leaves (neces-
sary for resprouting in the spring) compared with those
in unfertilized conditions (Farrer et al. 2013). However,
Farrer et al. (2013) also shows that parasitism is not
occurring in the summer. Schadt et al. (2003) found that
microbial activity peaks in winter in Niwot alpine tun-
dra soils and that most of winter microbial biomass is
fungal. These fungi would require substantial C sources
during the 9-month dormant season when plants are
not photosynthesizing.
Dark septate endophytes from the Helotiales can
become parasitic when supplied with inorganic N (Upson
et al. 2009b). Geum rossii DSE may parasitize their host as
inorganic N rises. If this were true, however, we would
expect Helotiales relative abundance to increase rather
than decline in N plots. Some OTUs related to known DSE
did increase with N, but given that other related groups
primarily declined, evidence for parasitism is weak. One
potentially pathogenic genus increased with N, Papulas-
pora spp. Species in this genus can be either plant or fungal
pathogens, making its role in G. rossii fitness unclear here.
Winter sampling and fungal quantification methods may
provide different insights in this regard.
Members of the Helotiales could also simply be bene-
ficial to G. rossii, and their lessened dominance corre-
sponds to reduced G. rossii fitness due to loss of
associated benefits, such as access to organically bound
nutrients (Michelsen et al. 1996; Caldwell et al. 2000)
and resistance to phytotoxic tannins and other harsh
environmental conditions (Cairney & Ashford 2002;
Cairney & Meharg 2003), services provided by DSE and
ERM. This hypothesis is bolstered by Schmidt et al.
(2004) findings that N amendments selected against
microbes that break down phenolics and complex
organic matter at Niwot Ridge. We found that putative
ERM declined with N. Greenhouse experiments are
needed to further assess the role of Helotiales spp. in
host fitness, but given the extreme dominance of this
order in G. rossii and research on similar taxa in similar
ecosystems, their presence likely influences G. rossii fit-
ness, and they are likely involved in N uptake and/or
tolerance to stress associated with cold ecosystems.
Summary 9
Few studies have employed DNA sequencing to exam-
ine the effect of N on RAF community composition.
Culture- and microscopy-based techniques have shown
repeatedly that soil fertility drives fungal symbiont
abundance, richness and community composition (Peter
et al. 2000; Frey et al. 2004; Edgerton-Warburton et al.
2007; Avis et al. 2008; Lilleskov et al. 2008; Cox et al.
2010). We compared RAF response to altered plant
competition and to N to assess whether similar taxa
were affected by both.
We found that N affects RAF differently than does
altering competitor abundance. We show for the first
time that a host plant that thrives under N enrichment
harbours a diverse fungal community that is highly
responsive to N relative to the fungal community of a
host plant that responds negatively to N. Perhaps a
flexible RAF community is key to adapting to nutrient
enrichment. We confirm that Helotiales are dominant
root symbionts in cold soils and find they are particu-
larly abundant and sensitive to N in a host plant that is
negatively impacted by N enrichment, but less abun-
dant and sensitive to N in a plant that is unaffected by
N enrichment. RAF are known to affect plant fitness, so
these N-induced shifts in RAF community could affect
plant fitness. If they do, belowground microbial dynam-
ics are implicated in aboveground plant response to abi-
otic change. Future research should be directed to
better describing these alpine RAF and their interactions
with alpine vegetation.
Acknowledgements
The authors would like to thank A. Jumpponen, D. VanHorn
and C. Lauber for bioinformatics advice andalso J. Dean for
laboratory assistance. Funding was provided by NSF-0919510
to R.L. Sinsabaugh, A. Porras-Alfaro and K.N. Suding. S. Hicks
thanks the Mycological Society of America for the Denison
Mentor Student Travel Award and the Fungal Environmental
Sampling and Informatics Network for the FESIN travel award.
References
Altschul SF, Gish W, Miller W, Myers EW, Lipman DJ (1990)
Basic local alignment search tool. Journal of Molecular Biology,
215, 403–410.
© 2013 John Wiley & Sons Ltd
12 S . L . HICKS ET AL.
1
2
3
4
5
6
7
8
9
10
11
12
13
14
15
16
17
18
19
20
21
22
23
24
25
26
27
28
29
30
31
32
33
34
35
36
37
38
39
40
41
42
43
44
45
46
47
48
49
50
51
52
53
54

Anderson MJ, Crist TO, Chase JM et al. (2011) Navigating the
multiple meanings of b diversity: a roadmap for the practic-
ing ecologist. Ecology Letters, 14, 19–28.
Avis PG, Mueller GM, Lussenhop J (2008) Ectomycorrhizal
fungal communities in two North American oak forests
respond to nitrogen addition. New Phytologist, 179, 472–483.
Bahram M, P~olme S, K~oljalg U, Tedersoo L (2011) A single
European aspen (Populaus tremula) tree individual may
potentially harbor dozens of Cenococcum geophilum ITS geno-
types and hundreds of species of ectomycorrhizal fungi.
FEMS Microbiology Ecology, 75, 313–320.
Bobbink R (2004) Plant Species Richness and the Exceedance of
Empirical Nitrogen Critical Loads: an Inventory. Report Land-
scape Ecology. Utrecht University/RIVM, Bilthoven, The
Netherlands.
Bobbink R, Hicks K, Galloway J et al. (2010) Global assessment
of nitrogen deposition effects on terrestrial plant diversity: a
synthesis. Ecological Applications, 20, 30–59.
Bogar LM, Kennedy PG (2012) New wringles in an old para-
digm: neighborhood effects can modify the structure and
specificity of Alnus-associated ectomycorrhizal fungal com-
munities. FEMS Microbiology Ecology, 83, 767–777.
Bowman WD, Steltzer H, Rosentiel TN, Cleveland CC, Meier
CL (2004) Litter effects of two co-occurring alpine species on
plant growth, microbial activity and immobilization of nitro-
gen. Oikos, 104, 336–344.
Bowman WD, Gartner JR, Holland K, Wiedermann M (2006)
Nitrogen critical loads for alpine vegetation and terrestrial
ecosystem response: are we there yet? Ecological Applications,
16, 1183–1193.10
Cairney JWG, Ashford AE (2002) Biology of mycorrhizal
associations of epacrids (Ericaceae). New Phytologist, 154,
305–326.
Cairney JWG, Meharg AA (2003) Ericoid mycorrhiza: a
partnership that exploits harsh edaphic conditions. European
Journal of Soil Science, 54, 735–740.
Caldwell BA, Jumpponen A, Trappe JM (2000) Utilization of
major detrital substrates by dark-septate, root endophytes.
Mycologia, 92, 230–232.
Caporaso JG, Kuczynski J, Stombaugh J et al. (2010) QIIME
allows analysis of high-throughput community sequence
data. Nature Methods, ?????, ?????–?????, doi:10.1038/nmeth.f.
303.11
Carreiro MM, Sinsabaugh RL, Repert DA, Parkhurst DF (2000)
Microbial enzyme shifts explain litter decay responses to
simulated nitrogen deposition. Ecology, 81, 2359–2365.
Cherwin KL, Seastedt TR, Suding KN (2009) Effects of nutrient
manipulations and grass removal on cover, species composi-
tion, and invisibility of a novel grassland in Colorado. Resto-
ration Ecology, 17, 818–826.
Clark CM, Tilman D (2008) Loss of plant species after chronic
low-level nitrogen deposition to prarie grasslands. Nature,
451, 712–715.
Cox F, Barsoum N, Lilleskov EA, Bidartondo MI (2010) Nitro-
gen availability is a primary determinant of conifer mycor-
rhizas across complex environmental gradients. Ecology
Letters, 13, 1103–1113.
De Vries W, Wamelink GWW, Van Dobben H et al. (2010) Use
of dynamic soil-vegetation models to assess impacts of nitro-
gen deposition on plant species composition: an overview.
Ecological Applications, 20, 60–79.
Dentener F, Drevet J, Lamarque JF et al. (2006) Nitrogen and
sulfur deposition on regional and global scales: A multimod-
el evaluation. Global Biogeochemical Cycles, 20, GB4003.
Edgar RC (2010) Search and clustering orders of magnitude
faster than BLAST. Bioinformatics, 26, 2460–2461.
Edgar R, Haas BJ, Clemente JC, Quince C, Knight R (2011)
UCHIME improves sensitivity and speed of chimera detec-
tion. Bioinformatics, 27, 2194–2200.
Edgerton-Warburton LM, Johnson NC, Allen EB (2007) Mycor-
rhizal community dynamics following nitrogen fertilization:
a cross-site test in five grasslands. Ecological Monographs, 77,
527–544.
Farrer EC, Herman DJ, Franzova E, Pham T, Suding KN (2013)
Nitrogen deposition, plant carbon allocation, and soil
microbes: changing interactions due to enrichment. American
Journal of Botany, 100, 1458–1470.
Frey SD, Knorr M, Parrent JL, Simpson RT (2004) Chronic
nitrogen enrichment affects the structure and function of the
soil microbial community in temperate hardwood and pine
forests. Forest Ecology and Management, 196, 159–171.
Galloway JN, Townsend AR, Erisman JW et al. (2008) Transfor-
mation of the nitrogen cycle: recent trends, questions and
potential solutions. Science, 320, 889–892.
Gardes M, Bruns T (1996) Community structure of ectomycor-
rhizal fungi in a Pinus muricata forest: above- and below-
ground views. Canadian Journal of Botany, 74, 1572–1583.
Grelet GA, Johnson D, Paterson E, Anderson IC, Alexander IJ
(2009) Reciprocal carbon and nitrogen transfer between an
ericaceous dwarf shrub and fungi isolated from Piceirhiza
bicolorata ectomycorrhizas. New Phytologist, 182, 359–366.
Hampleton S, Sigler L (2005) Meliniomyces, a new anamorph
genus for root-associated fungi with phylogenetic affinities
to Rhizoscyphus ericae (= Hymenoscyphus ericae), Leotiomyce-
tes. Studies in Mycology, 53, 1–27.
Johnson JM, Oelm€uller R (2009) Mutualism or parasitism: life
in an unstable continuum. What can we learn from the
mutualistic interaction between Piriformospora indica and Ara-
bidopsis thaliana? –review. Endocytobiosis Cell Research, 19,
81–111.
Johnson NC, Graham JH, Smith FA (1997) Functioning of
mycorrhizal associations along the mutualism-parasitisim
continuum. New Phytolotist, 135, 575–586.
Johnson NC, Wolf J, Koch GW (2003) Interactions among
mycorrhizae, atomospheric CO2 and soil N impact plant
community composition. Ecology Letters, 6, 532–540.
Johnson NC, Rowland DL, Corkidi L, Allen EB (2008) Plant
winners and losers during grassland N-eutrophication
differ in biomass allocation and mycorrhizas. Ecology, 89,
2868–2878.
Klironomos JN (2002) Feedback with soil biota contributes to
plant rarity and invasiveness in communities. Nature, 417,
67–70.
Klironomos J, Zobel M, Tibbett M et al. (2011) Forces that struc-
ture plant communities: quantifying the importance of the
mycorrhizal symbiosis. New Phytologist, 189, 366–370.
Knorr M, Frey SD, Curtis PS (2005) Nitrogen additions and
litter decomposition: a meta-analysis. Ecology, 86, 3252–
3257.
Kogel KH, Franken P, Huckelhoven R (2006) Mycorrhizae or
parasite-what decides? Current Opinion in Plant Biology, 9,
358–363. 12
© 2013 John Wiley & Sons Ltd
PLANT–FUNGAL RESPONSE TO N POLLUTION 13
1
2
3
4
5
6
7
8
9
10
11
12
13
14
15
16
17
18
19
20
21
22
23
24
25
26
27
28
29
30
31
32
33
34
35
36
37
38
39
40
41
42
43
44
45
46
47
48
49
50
51
52
53
54

Kuczynski J, Costello EK, Nemergut DR et al. (2010) Direct
sequencing of the human microbiome readily reveals com-
munity differences. Genome Biology, 11, 210.
Lilleskov EA, Wargo PM, Vogt KA, Vogt DJ (2008) Mycorrhizal
fungal community relationship to root nitrogen concentration
over a regional atmospheric nitrogen deposition gradient in
the northeastern USA. Canadian Journal of Forest Research, 38,
1260–1266.
May DE, Webber PJ (1982) Spatial and temporal variation of
the vegetation and its productivity on Niwot Ridge, Colo-
rado. Ecological Studies of the Colorado Alpine: a Festschrift for
John W Marr. Occasional Paper, 37, 35–62.
McCune B, Grace JD, Urban DL (2002) Analysis of Ecological
Communities. MJM Software Design, Glenden Beach, OR,
USA.
Meier CL, Keyserling K, Bowman WD (2009) Fine root inputs
to soil reduce growth of a neighbouring plant via distinct
mechanisms dependent on root carbon chemistry. Journal of
Ecology, 97, 941–949.
Michelsen A, Schmidt IK, Jonasson S, Quarmby C, Sleep D
(1996) Leaf 15N abundance of subarctic plants provides field
evidence that ericoid, ectomycorrhizal and non- and arbus-
cular mycorrhizal species access different sources of soil
nitrogen. Oecologia, 105, 53–63.
Morgan JAW, Bending GD, White PJ (2005) Biological costs
and benefits to plant-microbe interactions in the rhizosphere.
Journal of Experimental Botany, 56, 1729–1739.
Mullen RB, Schmidt SK (1993) Mycorrhizal infection, phospho-
rus uptake, and phenology in Ranunculus adoneus: implica-
tions for the functioning of mycorrhizae in alpine systems.
Oecologia, 94, 229–234.
Nemergut DR, Townsend AR, Sattin SR et al. (2008) The effects
of chronic nitrogen fertilization on alpine tundra soil micro-
bial communities: implications for carbon and nitrogen
cycling. Environmental Microbiology, 10, 3093–3105.
Newsham KK (2011) A meta-analysis of plant responses to
dark septate root endophytes. New Phytologist, 190, 783–793.
Newsham KK, Upson R, Read DJ (2009) Mycorrhizas and dark
septate root endophytes in polar regions. Fungal Ecology, 2,
10–20.
Nilsson RH, Kristiansson E, Ryberg M, Hallenberg N, Larsson
KH (2008) Intraspecific ITS variability in the kingdom Fungi
as expressed in the international sequence databases and its
implications for molecular species identification. Evolutionary
Bioinformatics, 4, 193–201.
Oksanen J, Blanchet FG, Kindt R et al. (2011) vegan: Commu-
nity Ecology Package. R package version 1.17-3.
Pennings SC, Clark CM, Cleland EE et al. (2005) Do individual
species show predictable responses to nitrogen addition
across multiple experiments? Oikos, 110, 547–555.
Peter M, Ayer F, Egli S (2000) Nitrogen addition in a Norway
spruce stand altered macromycete sporocarp production and
below-ground ectomycorrhizal species composition. New
Phytologist, 149, 311–325.
Pinheiro J, Bates D, DebRoy S, Sarkar D, the R Core team
(2011) nlme: Linear and nonlinear mixed effects models, R
package version 3.1-96.
Porras-Alfaro A, Bayman P (2011) Hidden fungi, emergent
properties: Endophytes and Microbiomes. Annual Review of
Phytopathology, 49, 291–315.
Porras-Alfaro A, Herrera J, Natvig DO, Sinsabaugh RL (2007)
Effect of long-term nitrogen fertilization on mycorrhizal
fungi associated with a dominant grass in a semiarid grass-
land. Plant and Soil, 296, 65–75.
R Development Core Team (2011) R: A Language and Environ-
ment for Statistical Computing. R Foundation for Statistical
Computing, Vienna, Austria.
Read DJ (1996) The structure and function of the ericoid
mycorrhizal root. Annals of Botany, 77, 365–374.
Reeder J, Knight R (2010) Rapid denoising of pyrosequencing
amplicon data: exploiting the rank-abundance distribution.
Nature Methods, 7, 668–669.
Rodriguez RJ, White JF Jr, Arnold AE, Redman RS (2008) Fun-
gal endophytes: diversity and functional roles. New Phytolo-
gist, 182, 314–330.
Roem WJ, Berendse F (2000) Soil acidity and nutrient supply
ratio as possible factors determining changes in plant species
diversity in grassland and heathland communities. Biological
Conservation, 92, 151–161.
Schadt CW, Mullen RB, Schmidt SK (2001) Isolation and phylo-
genetic identification of a dark-septate fungus associated
with the alpine plant Ranunculus adoneus. New Phytologist,
150, 747–755.
Schadt CW, Martin AP, Lipson DA, Schmidt SK (2003) Sea-
sonal dynamics of previously unknown fungal lineages in
Tundra Soils. Science, New Series, 301, 1250–1362.
Schmidt SK, Lipson DA, Ley RE, Fisk MC, West AE (2004)
Impacts of chronic nitrogen additions vary seasonally and by
microbial functional group in tundra soils. Biogeochemistry,
69, 1–17.
Schmidt SK, Sobieniak-Wiseman LC, Kageyama SA, Halloy
SRP, Schadt CW (2008) Mycorrhizal and dark-septate fungi
in plant roots above 4270 meters elevation in the andes and
rocky mountains. Arctic, Antarctic, and Alpine Research, 40,
576–583.
Schoch CL, Siefert KA, Huhndorf S et al. (2012) Nuclear ribo-
somal internal transcribed spacer (ITS) region as a universal
DNA barcode marker for Fungi. PNAS, 109, 6241–6246.
Sievering H, Rusch D, Marquez L (1996) Nitric acid, particulate
nitrate and ammonium in the continental free troposphere:
nitrogen deposition to an alpine tundra ecosystem. Atmo-
spheric Environment, 30, 2527–2537.
Strengbom J, Nordin A, N€asholm T, Ericson L (2002) Parasitic
fungus mediates change in nitrogen-exposed boreal forest
vegetation. Journal of Ecology, 90, 61–67.
Strengbom J, Walheim M, N€asholm T, Ericson L (2003) Regio-
nal differences in the occurrence of understory species reflect
nitrogen deposition in Swedish forests. AMBIO: A Journal of
the Human Environment, 32, 91–97.
Suding KN, Collins SL, Gough L et al. (2005) Functional- and
abundance-based mechanisms explain diversity loss due to
N fertilization. PNAS, 102, 4387–4392.
Suding KN, Ashton IW, Bechtold H, Bowman WD, Mobley
ML, Winkleman R (2008) Plant and microbe contribution to
community resilience in a directionally changing environ-
ment. Ecological Monographs, 78, 313–329.
Tedersoo L, P€artel K, Jairus T, Gates G, P~oldmaa K, Tamm H
(2009) Ascomycetes associated with ectomycorrhizas: molec-
ular diversity and ecology with particular reference to the
Helotiales. Environmental Microbiology, 11, 3166–3178.
© 2013 John Wiley & Sons Ltd
14 S . L . HICKS ET AL.
1
2
3
4
5
6
7
8
9
10
11
12
13
14
15
16
17
18
19
20
21
22
23
24
25
26
27
28
29
30
31
32
33
34
35
36
37
38
39
40
41
42
43
44
45
46
47
48
49
50
51
52
53
54
Treseder KK (2004) A meta-analysis of mycorrhizal responses
to nitrogen, phosphorus, and atmospheric CO2 in field stud-
ies. New Phytologist, 164, 347–355.
Treseder KK (2008) Nitrogen additions and microbial biomass:
a meta-analysis of ecosystem studies. Ecology Letters, 11,
1111–1120.
Upson R, Newsham KK, Bridge PD, Pearce DA, Read DJ
(2009a) Taxonomic affinities of dark septate root endophytes
of Colobanthus quitensis and Deschampsia Antarctica, the two
native Antarctic vascualar plant species. Fungal Ecology, 2,
184–196.
Upson R, Read DJ, Newsham KK (2009b) Nitrogen form influ-
ences the response of Deschampsia Antarctica to dark septate
root endophytes. Mycorrhiza, 20, 1–11.
Vitousek PM, Aber JD, Howarth RW et al. (1997) Human alter-
ations of the global nitrogen cycle: Sources and conse-
quences. Ecological Applications, 7, 737–750.
Wagner L, Stielow B, Hoffmann K et al. (2013) A comprehen-
sive molecular phylogeny of the Morierellales (Mortierellomy-
cotina) based on nuclear ribosomal DNA. Persoonia, 30,
77–93.
Warton DI, Wright TW, Wang Y (2012) Distance-based multi-
variate analyses confound location and dispersion effects.
Methods in Ecology and Evolution, 3, 89–101.
Williams MW, Baron JS, Caine N, Sommerfeld R, Sanford R
(1996) Nitrogen saturation in the Rocky Mountains. Environ-
mental Science and Technology, 30, 640–646.
Wittebolle L, Marzorati M, Clement L et al. (2009) Initial com-
munity evenness favors functionality under selective stress.
Nature, Letters, 458, 623–626.
Yesmin L, Gammack SM, Cresser MS (1996) Effects of atmo-
spheric nitrogen deposition on ericoid mycorrhizal infection
of Calluna vulgarism growing in peat soils. Applied Soil Ecol-
ogy, 4, 49–60.
Yoav B, Yosef H (1995) Controlling the false discovery rate: a
practical and powerful approach to multiple testing. Journal
of the Royal Statistical Society, Series B, 57, MR 1325392.
Zijlstra JD, Van’t Hof P, Baar J et al. (2005) Diversity of symbi-
otic root endophytes of the Helotiales in ericaceous plants
and the grass, Deschampsia flexuosa. Studies in Mycology, 53,
147–162.
S.L. Hicks conducted laboratory work, bioinformatics,
statistical analyses, and wrote the paper. A. Porras-
Alfaro did initial sample processing. E.C. Farrer conducted
field work and helped with the statistical analyses. D.L.
Taylor contributed to bioinformatics. A. Porras-Alfaro,
K.N. Suding and R.L. Sinsabaugh developed project
design and acquired funding. All authors edited and
participated in discussions related with this manuscript.
Data accessibility
Raw DNA sequences, R code, and OTU tables and
other R input files are available on Dryad (doi:10.5061/
dryad.sv33f).
Supporting information
Additional supporting information may be found in the online ver-
sion of this article.
Fig. S1 Alpha rarefaction curves showing species richness for
all host 9 treatment groups.
Fig. S2 NMDS plot of Bray-Curtis distances between RAF 13com-
munities from different hosts and treatments.
Table S1 Results of permutation tests on Bray Curtis distance
matrices.
Table S2 SIMPER results indicating which OTUs are most
responsible 14for RAF community shifts with N for each plant
host, and their taxonomic assignments.
Table S3 SIMPER results indicating which G. rossii RAF OTUs
are responsible for community shifts with N and removal, and
their taxonomic assignments.
© 2013 John Wiley & Sons Ltd
PLANT–FUNGAL RESPONSE TO N POLLUTION 15
1
2
3
4
5
6
7
8
9
10
11
12
13
14
15
16
17
18
19
20
21
22
23
24
25
26
27
28
29
30
31
32
33
34
35
36
37
38
39
40
41
42
43
44
45
46
47
48
49
50
51
52
53
54
Author Query Form
Journal: MEC
Article: 12541
Dear Author,During the copy-editing of your paper, the following queries arose. Please respond to these by markingup your proofs with the necessary changes/additions. Please write your answers on the query sheet ifthere is insufficient space on the page proofs. Please write clearly and follow the conventions shown onthe attached corrections sheet. If returning the proof by fax do not write too close to the paper’s edge.Please remember that illegible mark-ups may delay publication.
Many thanks for your assistance.
Query reference Query Remarks
1 AUTHOR: Please check that authors and their affiliations are correct.
2 AUTHOR: Please identify and encircle the forename and surname of all
authors.
3 AUTHOR: Please check and provide full forename for author ‘D. Lee Tay-
lor’.
4 AUTHOR: Porras-Alfaro et al. 2011 has been changed to Porras-Alfaro and
Bayman 2011 so that this citation matches the Reference List. Please confirm
that this is correct.
5 AUTHOR: Bogar and Kennedy 2013 has been changed to Bogar and Kennedy
2012 so that this citation matches the Reference List. Please confirm that this
is correct.
6 AUTHOR: Please check this website address and confirm that it is correct.
(Please note that it is the responsibility of the author(s) to ensure that all
URLs given in this article are correct and useable).
7 AUTHOR: Newsham 2009 has been changed to Newsham et al. 2009 so that
this citation matches the Reference List. Please confirm that this is correct.
8 AUTHOR: Hambleton and Sigler 2005 has been changed to Hampleton and
Sigler 2005 so that this citation matches the Reference List. Please confirm
that this is correct.
9 AUTHOR: Please check level heading.
10 AUTHOR: Bowman et al. (2006) has not been cited in the text. Please indi-
cate where it should be cited; or delete from the Reference List.
11 AUTHOR: Please provide the volume number, page range for reference
Caporaso et al. (2010).
12 AUTHOR: Kogel et al. (2006) has not been cited in the text. Please indicate
where it should be cited; or delete from the Reference List.
13 AUTHOR: Figure S2 has not been mentioned in the text. Please indicate
where it should be cited in the relevant place in the text.

14 AUTHOR: Table S2 has not been mentioned in the text. Please indicate
where it should be cited in the relevant place in the text.
15 AUTHOR: If you would like the figures in your article to appear as colour in
print, please promptly post or courier the completed hard copy of the Colour
Work Agreement Form (including payment information) to this mailing
address: Customer Services (OPI) John Wiley & Sons Ltd European Distribu-
tion Centre New Era Estate, Oldlands Way Bognor Regis West Sussex PO22
9NQ The form and charge information can be found online at: http://online-
library.wiley.com/journal/10.1111/(ISSN)1365-294X/homepage/ForAuthors.html

USING e-ANNOTATION TOOLS FOR ELECTRONIC PROOF CORRECTION
Required software to e-Annotate PDFs: Adobe Acrobat Professional or Adobe Reader (version 8.0 or
above). (Note that this document uses screenshots from Adobe Reader X)
The latest version of Acrobat Reader can be downloaded for free at: http://get.adobe.com/reader/
Once you have Acrobat Reader open on your computer, click on the Comment tab at the right of the toolbar:
1. Replace (Ins) Tool Î for replacing text.
Strikes a line through text and opens up a text
box where replacement text can be entered.
How to use it
‚ Highlight a word or sentence.
‚ Click on the Replace (Ins) icon in the Annotations
section.
‚ Type the replacement text into the blue box that
appears.
This will open up a panel down the right side of the document. The majority of
tools you will use for annotating your proof will be in the Annotations section,
rkevwtgf"qrrqukvg0"YgÓxg"rkemgf"qwv"uqog"qh"vjgug"vqqnu"dgnqy<
2. Strikethrough (Del) Tool Î for deleting text.
Strikes a red line through text that is to be
deleted.
How to use it
‚ Highlight a word or sentence.
‚ Click on the Strikethrough (Del) icon in the
Annotations section.
3. Add note to text Tool Î for highlighting a section
to be changed to bold or italic.
Highlights text in yellow and opens up a text
box where comments can be entered.
How to use it
‚ Highlight the relevant section of text.
‚ Click on the Add note to text icon in the
Annotations section.
‚ Type instruction on what should be changed
regarding the text into the yellow box that
appears.
4. Add sticky note Tool Î for making notes at
specific points in the text.
Marks a point in the proof where a comment
needs to be highlighted.
How to use it
‚ Click on the Add sticky note icon in the
Annotations section.
‚ Click at the point in the proof where the comment
should be inserted.
‚ Type the comment into the yellow box that
appears.
USING e-ANNOTATION TOOLS FOR ELECTRONIC PROOF CORRECTION
For further information on how to annotate proofs, click on the Help menu to reveal a list of further options:
5. Attach File Tool Î for inserting large amounts of
text or replacement figures.
Inserts an icon linking to the attached file in the
appropriate pace in the text.
How to use it
‚ Click on the Attach File icon in the Annotations
section.
‚ Enkem"qp"vjg"rtqqh"vq"yjgtg"{qwÓf"nkmg"vjg"cvvcejgf"file to be linked.
‚ Select the file to be attached from your computer
or network.
‚ Select the colour and type of icon that will appear
in the proof. Click OK.
6. Add stamp Tool Î for approving a proof if no
corrections are required.
Inserts a selected stamp onto an appropriate
place in the proof.
How to use it
‚ Click on the Add stamp icon in the Annotations
section.
‚ Select the stamp you want to use. (The Approved
stamp is usually available directly in the menu that
appears).
‚ Enkem"qp"vjg"rtqqh"yjgtg"{qwÓf"nkmg"vjg"uvcor"vq"appear. (Where a proof is to be approved as it is,
this would normally be on the first page).
7. Drawing Markups Tools Î for drawing shapes, lines and freeform
annotations on proofs and commenting on these marks.
Allows shapes, lines and freeform annotations to be drawn on proofs and for
comment to be made on these marks..
How to use it
‚ Click on one of the shapes in the Drawing
Markups section.
‚ Click on the proof at the relevant point and
draw the selected shape with the cursor.
‚ To add a comment to the drawn shape,
move the cursor over the shape until an
arrowhead appears.
‚ Double click on the shape and type any
text in the red box that appears.


![Aboveground mechanical stimuli affect belowground plant ......phototropism. These mechano stimuli can act as cues of neighbour presence [19]. Canopy shy-ness in trees is a famous example](https://img.dokumen.tips/doc/110x75/60698371b3b5f51acc1b83bd/aboveground-mechanical-stimuli-affect-belowground-plant-phototropism-these.jpg)