Embed Size (px)
Citation preview

SPECIAL ALTERNATIVE INCARCERATION
MPRI In-Reach Facility
ANNUAL REPORT
-2010-
Pursuant to: PA 188 of 2010 MCL 791.234a (9)
Richard M. McKeon, Director

REPORT HIGHLIGHTS A scientifically rigorous evaluation conducted by the JFA Institute found that SAI Prison graduates
performed better on every measure of recidivism (Return to Prison, New Convictions and New Arrests) than a Comparison Group carefully matched on characteristics related to parole success.
672 SAI male prisoners from 72 counties, and 110 SAI female prisoners from 42 counties, were
enrolled in the program. 462 male probationers from 38 counties, and 19 female probationers from 10 counties, were enrolled in the program. See pages 21 through 26.
25.9% of the male prisoners, 33.6% of the female prisoners, 13.2% of the male probationers, and
21.1% of the female probationers enrolled in the program were serving for drug related offenses. See pages 15 - 17 for a list of the offenses of which program participants were convicted.
669 SAI male prisoners, 86 SAI female prisoners, 432 male probationers, and 14 female
probationers successfully completed the program. The successful completion rates were 97.2% for SAI male prisoners, 96.6% for SAI female prisoners, 91.7% for male probationers, and 94.7% for female probationers. See pages 9 through 14 for complete program results.
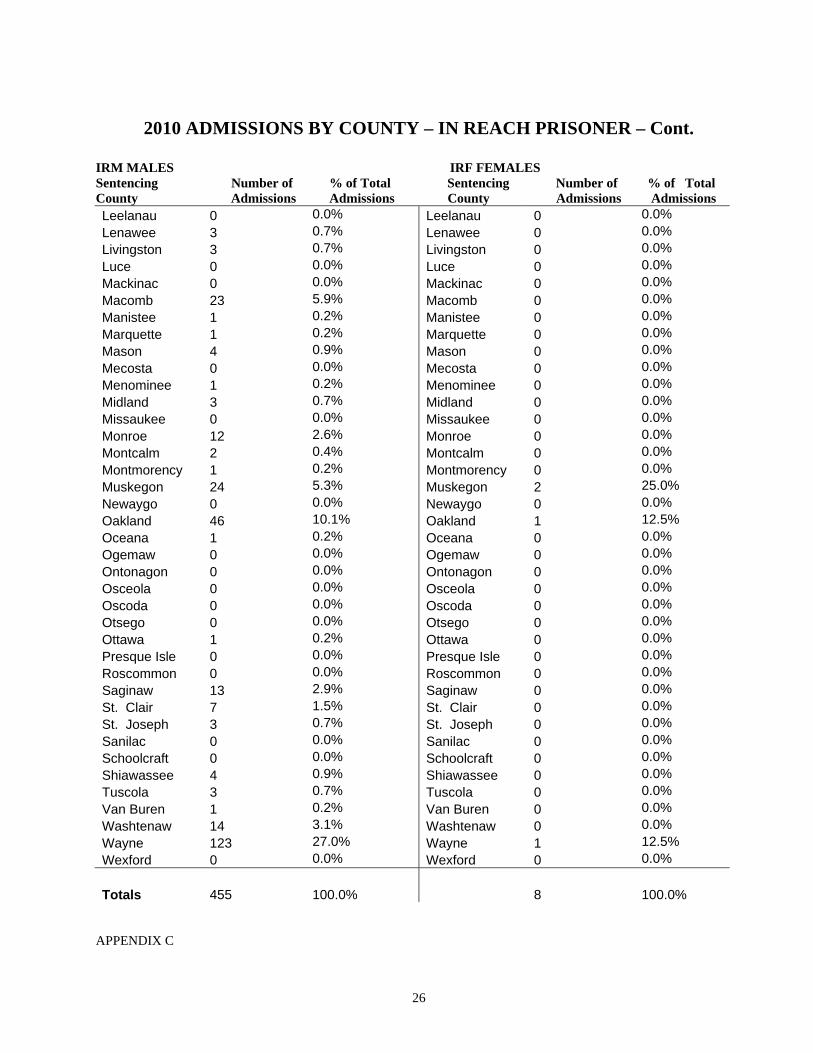
455 In Reach male prisoners (IRM) from 45 counties and 8 In Reach female prisoners (IRF) from 6
counties were enrolled in the program. 257 IRM prisoners and 4 IRF prisoners successfully completed the program. The successful
completion rates were 93.8% for IRM prisoners and 100.0% for IRF prisoners. See pages 13 through 14 for complete program results.
The program is cost effective as compared to prison. See page 8. 74.0% of offenders taking the mandatory battery of GED tests earned their GED Certificates while
enrolled in the program. See page 8.

TABLE OF CONTENTS Page
What is Offender Re-Entry?. . . . . . . . . . . . . . . . . . . ………. 1-3 Special Alternative Incarceration Progress Report 4-7 Program Cost Effectiveness 8 Evening Educational and Re-Entry Programming 8 Summary of 2010 Male Probationer Program Statistics 9 Summary of 2010Female Probationer Program Statistics 10 Summary of 2010 SAI Male Prisoner Program Statistics 11 Summary of 2010 SAI Female Prisoner Program Statistics 12 Summary of 2010 In Reach Male Prisoner (IRM) Statistics……………………………………………………………………… 13 Summary of 2010 In Reach Female Prisoner (IRF) Statistics…………………………………………………………………….. 14 Probationer Admissions by Offense Type 15 Prisoner Admissions by Offense Type 16 In Reach Prisoner Admission by Offense Type…………………………………………………………………………………… 17 Comparison of Outcomes SAI-Prison vs. Non-SAI 18-20 APPENDICES A-N 21-48 A. 2010 Admissions by County - Probationer B. 2010 Admissions by County – SAI Prisoner C. 2010 Admission by County – In Reach Prisoners D. 2010 Admissions by Month E 2010 Admissions by Sex F. 2010 Monthly Population Totals G. 2010 Program Outcomes by County - Probationer H. 2010 Program Outcomes by County – Prisoner I. 2010 Program Outcomes by County-In Reach Prisoner J. 2010 Monthly Program Outcomes - Prisoner K. 2010 Monthly Program Outcomes – Probationer L. 2010 Monthly Program Outcomes – In Reach Prisoners M. 2010 Graduates by Sex
N. Comparative Program Outcomes - 2009 and 2010

1
What is Offender ReEntry?
Offender re-entry is the process of leaving prison or jail and returning to society. All former offenders experience re-entry into the community whether they are released on parole or without supervision. With successful re-entry, there are great benefits to the community including improved public safety, a tremendous cost savings by reducing the chances for recidivism, and the long-term reintegration of the former offender.
The MPRI Vision
The VISION of the Michigan Prisoner ReEntry Initiative (MPRI) is that every offender released from prison will have the tools needed to succeed in the community.
The MPRI Mission
The MISSION of the MPRI is to reduce crime by implementing a seamless plan of services and supervision developed with each prisoner–delivered through state and local collaboration–from the time of their entry into prison through their transition, reintegration, and aftercare in the community.
The Three-Phase, Decision-Point MPRI Model
The MPRI Model involves improved decision making at critical decision points in the three phases of the custody, release, and community supervision/discharge process. The Special Alternative Incarceration Program encompasses both the Getting Ready and Going Home phases.
GETTING READY
The institutional phase describes the details of events and responsibilities that occur during the prisoner’s imprisonment from admission until the point of the parole decision and involves two major decision points:
1. Assessment and classification: Measuring the prisoner’s risks, needs, and strengths.
2. Prisoner programming: Assignments to reduce risk, address need, and build on strengths.
Participation in each program is the result of assessing each offender’s strengths and weaknesses using the Correctional Offender Management Profilling for Alternative Sanctions (COMPAS) and the Transition Accountability Plan (TAP).
The evidence based programs provided during the offender’s SAI experience are: Cognitive Behavioral Restructuring: Thinking Matters, Journaling (thinking report format), Cage Your Rage and Outpatient Substance Abuse Therapy.

2
Family/Community Structure: Family Focus Education, Family Focus Meeting, Premarital Interpersonal Choices and Knowledge (PICK a Partner), Smart Steps for Step Families, Prevention and Relationship Enhancement Program (PREP), Religious Services, Transition Team Visits and In-Reach Services. Daily Living Skills: Work Keys-Vocational Education, GED, Computer Lab, Financial Management, Pre-Release, Public Works and Institutional Work Assignments. Self Discipline: Interaction within a highly structured disciplined setting-Offenders rise at 6:00 A.M., attend programs and work assignments throughout the day and participate in physical exercise. (exercise designed for the offender’s physical ability) Bed time is at 10:00 P.M. There are no individual televisions, radios, games or other distractions that prevent the offender from learning and applying the skills they learn while incarcerated in the SAI Program. The offender is challenged mentally, emotionally and physically while at SAI.
GOING HOME
The transition to the community or re-entry phase begins before the prisoner’s target release date. In this phase, highly specific re-entry plans are organized that address housing, employment, and services to address addiction and mental illness. Phase Two involves the next two major decision points:
3. Prisoner release preparation: Developing a strong, public-safety-conscious parole plan.
4. Release decision making: Improving parole release guidelines.
The second phase is the “Going home or transitioning from prison to the community” phase. Prior to re-entering the community, a plan utilizing community in-reach resources is developed in collaboration with the offender and those state and local resources.
The community plan is designed to enhance public safety by effective risk management, treatment programs, offender accountability and community and victim participation. These plans are developed prior to the offender leaving SAI with the assistance of Transition Teams.
During the Transition Team or “In-reach” meeting, the offender is introduced to their parole or probation agent. The agent will discuss their home placement and brief initial reporting instructions. Transition Team members from various service providers will be present at the meeting to inquire as to what services the offender will initially require upon release. The offender is allowed the opportunity to discuss or ask questions regarding their release and transition.

3
STAYING HOME
The community and discharge phase begins when the prisoner is released from prison and continues until discharge from community parole supervision. In this phase, it is the responsibility of the former prisoner, human services providers, and the offender’s network of community supports and mentors to assure continued success. Phase Three involves the final three major decision points of the transition process:
5. Supervision and services: Providing flexible and firm supervision and services.
6. Revocation decision making: Using graduated sanctions to respond to behavior.
7. Discharge and aftercare: Determining community responsibility to “take over” the case.
Upon release from Special Alternative Incarceration, prisoners are placed on parole for 18 months, or the expiration of their minimum sentence, whichever is greater. The first 120 days of this parole period is under intense supervision. For the first 90 days of this period, the offender will be on tether. After the intensive supervision period, the offender will transfer to a regular parole caseload. Probationers upon release are continued on probation. The first 120 days of this probation period is under intense supervision. For the first 90 days of this period, the offender will be on tether. After the intensive supervision period, the offender will transfer to a regular probation caseload.

4
Special Alternative Incarceration Program Progress Report
During 2008, the Special Alternative Incarceration Program (SAI) was established as a Michigan Prisoner Re-Entry Initiative (MPRI) In-Reach Facility. Early on in this transition it was evident that SAI needed to make and be able to demonstrate significant changes in its structure and operation to meet the standards of Evidence Based Practice established in the MPRI Model. The SAI program provides for a decrease in the costs of incarceration by reducing the need for premium bed space for more extended periods of time. SAI is unique in the sense that they are a Phase I (Getting Ready) and a Phase II (Going Home) facility requiring the approval of the offender’s judge to participate in the 90 day program. Changes are illustrated in this report using the MPRI three phase, seven decision point paradigm. The program and structural (evidence based) modifications to the SAI program that have been fully implemented are:
SAI Before SAI After Boot Camp: Strong focus on structure, physical activity and punitive disciplinary sanctions.
Inreach facility: Focus on individual risk and needs. Embraces attributes of a therapeutic community.
Phase One- Getting Ready Phase One – Getting Ready 1. Assessment and classification : Trainees were classified to platoons based
on their arrival date at SAI Information was retrieved from PSI’s and
assessment tools used by RGC and courts. Each platoon uniformly received a
standard programming regime that was not responsive to individual need
Trainees were assigned jobs based on their progress and time in the program
1. Assessment and classification: Each offender who enters SAI receives a COMPAS assessment upon arrival. The COMPAS profile is used by the classification director in assigning the offender to programs and work assignments that will increase their knowledge and provide the tools to become successful in the community upon their release. Offenders are now provided specific and appropriate responsive programming based upon their individual strengths and needs as profiled by the COMPAS and entered into the Transition Accountability Plan.
2. Offender programming: Every offender was required to earn/complete: GED Cage Your Rage Substance Abuse Education SAI designed pre-release program Current Events Work Assignments
2. Offender programming : The programming menu at SAI has been changed to meet the goals of the MPRI and the programming recommendation made by Lee H. Rome, M.D., Forensic and Correctional Mental Health Consultant. These programs are delivered in a 90 day period. Thinking Matters (Cognitive Behavioral Program) Cage Your Rage (Cognitive Behavioral Program) Journaling -Thinking Reports (Cognitive Behavioral
Program) Family Focus Education Workshop Family Focus Meetings Premarital Interpersonal Choices and Knowledge
(PICK a Partner) Smart Steps for Step Families Prevention and Relationship Enhancement Program for
couples delivered by the Wayne County MarriageResource Center
Substance Abuse Outpatient Therapy provided by ApexBehavioral Health (this program was changed fromeducation to therapy, based on Dr. Rome's recommendation).

5
Work Keys – Assessment Financial Planning GED Computer Lab Pre-Release Vocational Educational Planning
3. Release decision making: All offenders entering SAI were either given automatic paroles or probation depending on the successful 90 day completion.
Offenders at SAI either continued on the SAI program or were terminated and returned to prison as a prisoner or county as a probation violator. Individual program assessments based on performance were lacking with the exception of specific program failures. Individual reports to probation or parole agents informed agents of program completions but not of individual needs in the community. There was no significant collaboration with FOA field agents other than conditions set by the parole board and agreements of statute which required intensive parole/probation in the first 120 days.
3. Release decision making: The COMPAS and Transitional Accountability Plan are used in developing the offender’s release plan. All offenders entering SAI are either given automatic paroles or probation depending on the successful 90 day completion. A corrections program coordinator enters the COMPAS profile into the Transition Accountability Plan. This entry is created by COMPAS Assessment, criminal history and the trainee interview. The Transition Accountability Plan (TAP) is used to identify programming and needed intervention to reduce recidivism The TAP profile is used by the classification director to classify trainees to the programs needed to strengthen weaknesses and to strengthen the existing skills of an offender to become successful in the community. Once the programs are completed, the completion and evaluation for SAI offender is entered into the TAP by the classification director. Completion and offender progress evaluation is provided by a supplemental 363 which was developed for SAI study evaluation purposes. This supplemental form provides both qualitative and quantitative information that allows for better audit information gathering and release decision making.
4. Offender release preparation: Two reports were completed: 30 Day Report-reporting court information, after care agent, placement information including employment plans. Final Report: identified court information, agent, approved placement and program participation.
4. Offender release preparation: Three reports currently completed by staff at the SAI are: 30 Day Report-reporting court information, after care agent, placement information including employment plans. Final Report: identifies court information, agent, approved placement and program participation. Transition Accountability Plan: An IPA interviews the trainees and enters SAI completion data into OCMS that is used in the field to supervise the trainee when released to the community. It is also used by the Transition Teams that meet with the trainee before SAI completion for the purpose of offender release preparation. Transition Team visits are coordinated by the MPRI Facility Coordinator. This team works collaboratively to develop a strong public safety conscious release plan with the offender prior to release from SAI. The meetings are either in person, by phone or teleconference.

6
Disciplinary Process Disciplinary Process Intake Mode of Communication - Loud in-
the-face shouting.
Disciplinary Physical Training (PT)
Motivation Logs - Carry a log for up to 5 days.
Run Confidence Course - A track with
various obstacles.
Leaning Rest – Push-up position up to 3 minutes at a time.
Motivation Vest - An orange vest
indicating extra PT.
Speed Drills - Intense housing unit drills to practice routine tasks.
Motivation Detail - Hard physical labor all
day with 15 minutes of PT every hour.
This change modeled behavior expected in the community. The focus was on the offender’s use of reasoning and thinking process to continue the change of behavior in the community that began in the SAI program.
No Intake Mode No Disciplinary PT for any Trainee No Motivation Logs No Confidence Course No Leaning Rest No Motivation Vest No Speed Drills The disciplinary process has changed significantly with a strong focus on pro-social modeling and intrinsic motivation. Immediate Verbal Counseling - Counsel trainee pointing out infraction of a rule or negative behavior. Extra Drill - Marching and facing movements. Extra Duty - Cleaning trash cans, washing windows etc., up to two hours. Journaling - Writing in a journal about behavior, emotions, and making good decisions based upon what they are being taught in programming, i.e. Cage Your Rage, Thinking Matters, Journaling. Detention Class - Class usually given by the 2nd shift Captain on the weekend to teach trainees who are not progressing how to properly act and react, and to correct negative behavior and thought patterns. Motivation Detail - An extra work detail usually consisting of cutting wood on the weekends when good behaving trainees are on free time, for those that are physically able. Program Review Board - A board usually consisting of the Deputy or ADW, Treatment Manager, and Shift Commander to review poor or disruptive behavior, major misconduct results, medical issues, lack of progress in the program etc., and determine whether the trainee referred should continue in the program or be terminated. SAI Health Care also designates certain trainees with medical issues in a "Medically Compromised Platoon". These trainees are not allowed to do any physical training and are not assigned to any work assignments which require intense physical labor without health care approval. They are carefully monitored and are allowed to benefit by participating in the MPRI classes.

7
Staff Development Staff Development
Drill Instructor Academy Offenders in Our Care Program Facilitation training in specialized
topics
Modified to the SAI Staff Academy, which incorporates the changes made to become a MPRI In-Reach Facility. Staff currently attending the Academy will join the ranks of staff at SAI that have been trained/certified during 2008 to facilitate current programs, supervise trainees (medical and non-medical), using skills received by attending the "Offenders Under Our Care" module, SAI Staff Academy and the MDOC New Employees’ School . Significant training in the areas of Evidence Based Programming for each facilitator.
Capacity Building Capacity Building May 1 through October 1, heat-related
illness restrictions for those w/BMI >31 No restricted medications on special diets Condition which would exclude an
offender from participating in physical exercise
No individuals taking or who have taken psychotropic medications within the previous six (6) months
No urgent dental care which cannot be postponed until after release
Those who have a medical condition that is not considered ‘in good control”
A medical criterion was issued on January 6, 2009 to change the medical requirements of SAI to allow medically compromised prisoners and probationers to participate in the program (see Attachment 2). Further criterion was developed to screen outpatient mental health prisoners for participation in the SAI Program. These changes, combined with those of the Psychological Service Unit screening criteria, have now increased the number of prisoners available to participate in the SAI program. To accommodate the medically compromised offenders, health care staff has been increased to include four R.N.'s, one L.P.N., staff from the Outpatient Mental Health Team and Psychological Services Unit. Physical structure now includes a medication room, medical teleconferencing room, and plans for a dental clinic. In keeping with the components of the Michigan Prisoner Re-Entry Initiative and expected participation of medically comprised/mentally ill trainees in the SAI program, two modifications have been made to the structure of the program. The changes affect the SAI trainee disciplinary process and physical training regiment. Based on the expected increased risk of heat related illnesses and number of trainees now on "restricted physical training status" for medical and mental health related illnesses, the operating procedure has been changed to eliminate physical discipline sanctions for medically restricted and non-medically restricted trainees. This change significantly increased the number of offenders who can participate in the SAI program.

8
PROGRAM COST EFFECTIVENESS
A process and impact evaluation conducted by the JFA Institute included a cost benefit assessment to estimate net savings that can be attributed to the SAI program. The analysis incorporated up-to-date information regarding SAI population, cumulative SAI program costs (including programs), estimated length of stay in prison for non-SAI cases and per diem costs for Level I and Level II facilities in its calculation. It further controlled for higher parole grant rates that have occurred recently. Finally, recognizing that Length of Stay (LOS) and probability of parole are different, separate estimates were done for each SAI group: Probation, Prison and Intensive Reentry. The figure below is a consolidation of those separate estimates and reflects the mix of trainee types at the time the study was conducted. Net savings figures are subject to change according to SAI population (and resulting per diem costs) and the mix of referral sources.
EVENING EDUCATIONAL AND SELF-HELP PROGRAMMING While enrolled in the program, all 1726 offenders admitted in 2010, participated in programming classes consisting of Thinking Matters, Smart Steps for Step Families, Family Focus Workshop, PICK a Partner, Pre-Release, Substance Abuse Therapy, Financial Planning, Cage Your Rage, Computer Lab, and Journaling. Seven hundred ten offenders (41.0% of all admissions), earned their high school diploma, or received their GED prior to their admission into SAI. One thousand twenty five offenders (59.1% of all admissions) who had not graduated from high school or earned their General Educational Development (GED) Certificate were enrolled in Adult Basic Education (ABE) programming. As a result of this programming, 416 offenders (74.0% of those completing all mandatory GED test modules) earned their GED Certificates. Those offenders that did not have the academic skills necessary to take the GED test as determined by Test of Adult Basic Education (TABE) were enrolled in academic education classes. Program graduates who have completed a portion of the GED test battery are enrolled in adult education programs in the community during the residential aftercare portion of the program.

9
SUMMARY OF 2010 MALE PROBATIONER PROGRAM STATISTICS Male probationer program statistics for 2010 are presented in the attached appendices. These key data are summarized as follows:
Of the 462 probationers enrolled in the program:
1. 262 (56.8%) were African-American 2. 196 (42.4%) were Caucasian 3. 4 (0.8%) were Hispanic 4. 0 (0.0%) were of other races
Probationers sentenced in 38 counties enrolled in the program.
Probationer age at sentencing ranged from 17 years to 52 years, with the 17-22 year age group comprising 69.4% of all admissions.
As of December 31, 2010, 66 male probationers were enrolled in the program.
Of the 471 probationers who either completed or were terminated from the program: (Note: Completed figures include probationers who were already in the program as of January 1, 2010).
1. 432 (91.7%) successfully completed the program 2. 5 (1.1%) voluntarily withdrew 3. 34 (7.2%) were terminated as rule violators
Eighteen probationers were terminated for medical reasons, and thirteen probationers were terminated as unqualified. (Note: Probationers terminated for medical reasons or for being unqualified are reasons out of the probationer’s control).

10
SUMMARY OF 2010 FEMALE PROBATIONER PROGRAM STATISTICS Female probationer program statistics for 2010 are presented in the attached appendices. These key data are summarized as follows: Of the 19 probationers enrolled in the program: 1. 8 (42.1%) were African-American 2. 11 (57.8%) were Caucasian 3. 0 (0.0%) were Hispanic 4. 0 (0.0%) were of other races Probationers sentenced in 10 counties enrolled in the program. Probationer age at sentencing ranged from 19 years to 39 years, with the 17-22 year age group comprising 31.5% of all admissions. As of December 31, 2010, 3 female probationers were enrolled in the program. Of the 18 probationers who either completed or were terminated from the program: (Note: Completed figures include probationers who were already in the program as of January 1, 2010). 1. 14 (77.8%) successfully completed the program 2. 1 (0.6%) voluntarily withdrew 3. 3 (1.6%) were terminated as rule violators One probationer was terminated for medical reasons, and zero probationers were terminated as unqualified. (Note: Probationers terminated for medical reasons or for being unqualified are reasons out of the probationer’s control).

11
SUMMARY OF 2010 SAI MALE PRISONER PROGRAM STATISTICS SAI male prisoner program statistics for 2010 are presented in the attached appendices. These key data are summarized as follows: Of the 672 prisoners enrolled in the program: 1. 236 (35.1%) were African-American 2. 433 (64.4%) were Caucasian 3. 0 (0.0%) were Hispanic 4. 3 (0.1%) were of other races SAI male prisoners sentenced in 72 counties enrolled in the program. SAI male prisoner age at sentencing ranged from 17 years to 69 years, with the 17-22 year age group comprising 28.5% of all admissions. As of December 31, 2010, 137 prisoners were enrolled in the program. Of the 688 SAI male prisoners who either completed or were terminated from the program: (Note: Completed figures include prisoners who were already in the program as of January 1, 2010). 1. 669 (97.2%) successfully completed the program 2. 4 (0.6%) voluntarily withdrew 3. 15 (2.2%) were terminated as rule violators Ten SAI male prisoners were terminated for medical reasons, and 12 SAI male prisoners were terminated as unqualified. (Note: Prisoners terminated for medical reasons or for being unqualified are reasons out of the prisoner’s control).

12
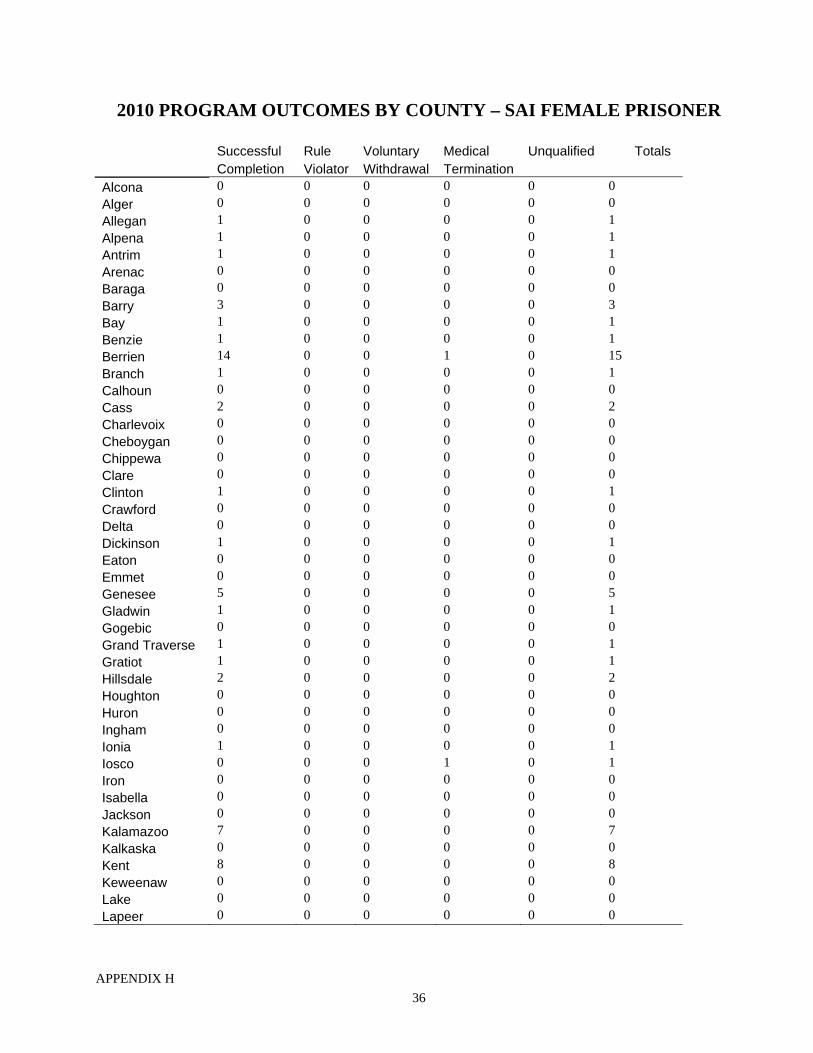
SUMMARY OF 2010 SAI FEMALE PRISONER PROGRAM STATISTICS SAI female prisoner program statistics for 2010 are presented in the attached appendices. These key data are summarized as follows: Of the 110 prisoners enrolled in the program: 1. 24 (21.8%) were African-American 2. 86 (78.1%) were Caucasian 3. 0 (0.0%) were Hispanic 4. 0 (0.0%) were of other races Prisoners sentenced in 42 counties enrolled in the program. Prisoner age at sentencing ranged from 19 years to 55 years, with the 17-22 year age group comprising 8.2% of all admissions. As of December 31, 2010, 32 SAI female prisoners were enrolled in the program. Of the 89 SAI female prisoners who either completed or were terminated from the program: (Note: Completed figures include prisoners who were already in the program as of January 1, 2010). 1. 86 (96.6%) successfully completed the program 2. 1 (1.1%) voluntarily withdrew 3. 2 (2.2%) was terminated as a rule violator Two SAI female prisoners were terminated for medical reasons, and 3 SAI female prisoners were terminated as unqualified. (Note: Prisoners terminated for medical reasons or for being unqualified are reasons out of the prisoner’s control).

13
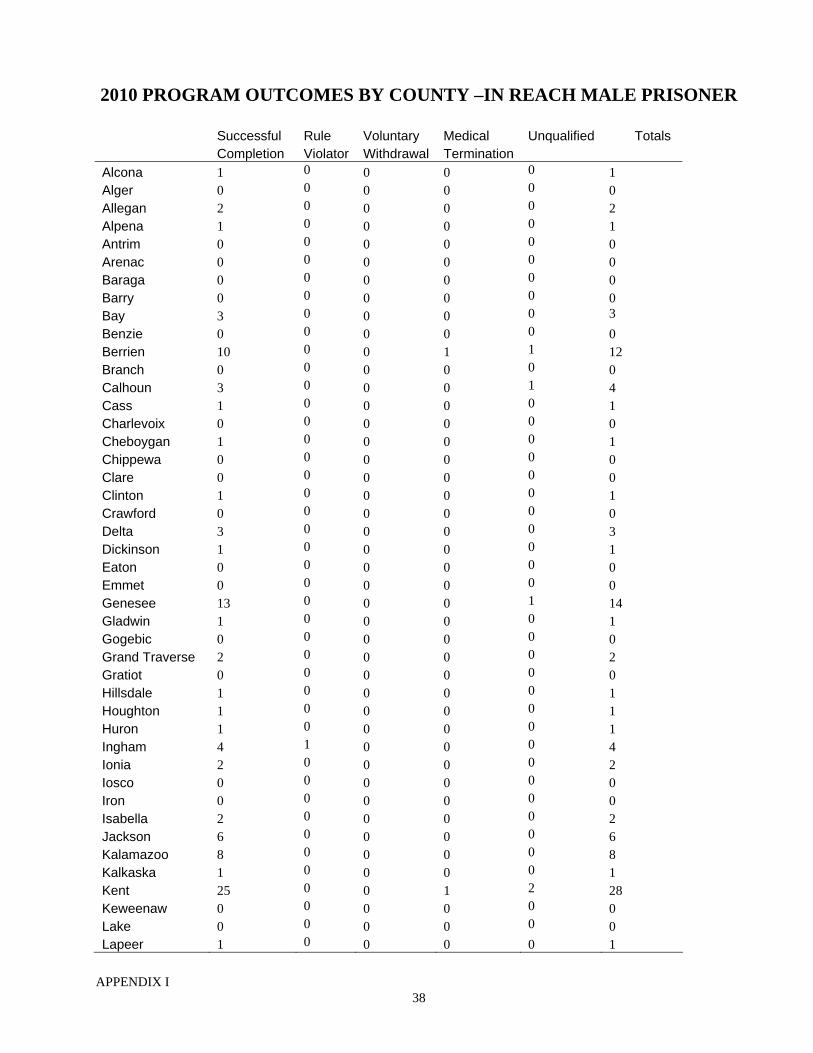
SUMMARY OF 2010 IN-REACH MALE PRISONER (IRM) PROGRAM STATISTICS IRM prisoner program statistics for 2010 are presented in the attached appendices. These key data are summarized as follows: Of the 455 IRM prisoners enrolled in the program: 1. 267 (59.0%) were African-American 2. 184 (40.4%) were Caucasian 3. 1 (0.2%) were Hispanic 4. 3 (0.6%) were of other races IRM prisoners sentenced in 45 counties enrolled in the program. IRM prisoner’s age at sentencing ranged from 19 years to 57 years, with the 17-22 year age group comprising 15.0% of all admissions. As of December 31, 2010, 170 IRM prisoners were enrolled in the program. Of the 274 IRM prisoners who either completed or were terminated from the program: 1. 257 (93.8%) successfully completed the program 2. 6 (2.2%) voluntarily withdrew 3. 11 (4.0%) were terminated as rule violators Seven IRM prisoners were terminated for medical reasons, and eight IRM prisoners were terminated as unqualified. (Note: Prisoners terminated for medical reasons or for being unqualified are reasons out of the prisoner’s control).

14
SUMMARY OF 2010 IN REACH FEMALE PRISONER (IRF) PROGRAM STATISTICS IRF prisoner program statistics for 2010 are presented in the attached appendices. These key data are summarized as follows: Of the 8 IRF prisoners enrolled in the program: 1. 6 (75.0%) were African-American 2. 2 (25.0%) were Caucasian 3. 0 (0.0%) were Hispanic 4. 0 (0.0%) were of other races IRF prisoners sentenced in 6 counties enrolled in the program. IRF prisoner age at sentencing ranged from 27 years to 43 years, with the 17-22 year age group comprising 0.0% of all admissions. As of December 31, 2010, 2 IRF female prisoners were enrolled in the program. Of the 4 IRF female prisoners who either completed or were terminated from the program: 1. 4 (100.0%) successfully completed the program 2. 0 (0.0%) voluntarily withdrew 3. 0 (0.0%) was terminated as a rule violator Two IRF female prisoners were terminated for medical reasons, and zero IRF female prisoners were terminated as unqualified. (Note: Prisoners terminated for medical reasons or for being unqualified are reasons out of the prisoner’s control).
15
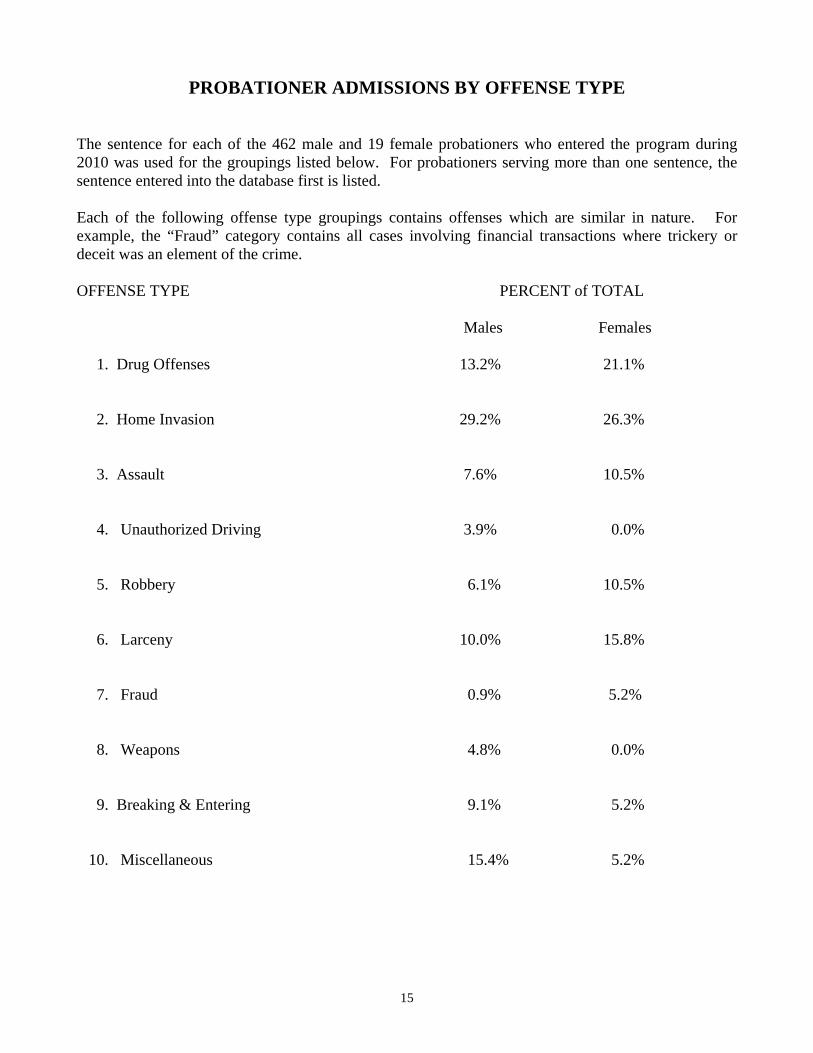
PROBATIONER ADMISSIONS BY OFFENSE TYPE The sentence for each of the 462 male and 19 female probationers who entered the program during 2010 was used for the groupings listed below. For probationers serving more than one sentence, the sentence entered into the database first is listed. Each of the following offense type groupings contains offenses which are similar in nature. For example, the “Fraud” category contains all cases involving financial transactions where trickery or deceit was an element of the crime. OFFENSE TYPE PERCENT of TOTAL Males Females 1. Drug Offenses 13.2% 21.1% 2. Home Invasion 29.2% 26.3% 3. Assault 7.6% 10.5% 4. Unauthorized Driving 3.9% 0.0% 5. Robbery 6.1% 10.5% 6. Larceny 10.0% 15.8% 7. Fraud 0.9% 5.2% 8. Weapons 4.8% 0.0% 9. Breaking & Entering 9.1% 5.2% 10. Miscellaneous 15.4% 5.2%

16
SAI PRISONER ADMISSIONS BY OFFENSE TYPE The controlling sentence for each of the 672 SAI male and 110 SAI female prisoners who entered the program during 2010 was used for the groupings listed below. For prisoners serving more than one sentence, the sentence with the longest minimum term is the controlling sentence. Each of the following offense type groupings contains offenses which are similar in nature. For example, the "Fraud" category contains all cases involving financial transactions where trickery or deceit was an element of the crime. OFFENSE TYPE PERCENT of TOTAL Males Females 1. Drug Offenses 25.9% 33.6% 2. Home Invasion 18.2% 10.0% 3. Assault 6.5% 6.4% 4. Unauthorized driving 12.4% 10.9% 5. Robbery 6.5% 6.4% 6. Larceny 3.7% 2.7% 7. Fraud 4.1% 13.6% 8. Weapons 6.4% 0.0% 9. Breaking & Entering 6.4% 4.5% 10. Miscellaneous 8.7% 11.8%

17
IN-REACH PRISONER ADMISSIONS BY OFFENSE TYPE
The controlling sentence for each of the 455 In Reach male and 8 In Reach female prisoners who entered the program during 2010 was used for the groupings listed below. For prisoners serving more than one sentence, the sentence with the longest minimum term is the controlling sentence. Each of the following offense type groupings contains offenses which are similar in nature. For example, the "Fraud" category contains all cases involving financial transactions where trickery or deceit was an element of the crime. OFFENSE TYPE PERCENT of TOTAL IRM IRF 1. Drug Offenses 24.7% 25.0% 2. Home Invasion 18.1% 0.0% 3. Assault 6.4% 12.5% 4. Unauthorized driving 7.9% 0.0% 5. Robbery 8.4% 0.0% 6. Larceny 5.7% 12.5% 7. Fraud 4.1% 25.0% 8. Weapons 9.0% 0.0% 9. Breaking & Entering 7.0% 0.0% 10. Miscellaneous 7.9% 25.0%
18
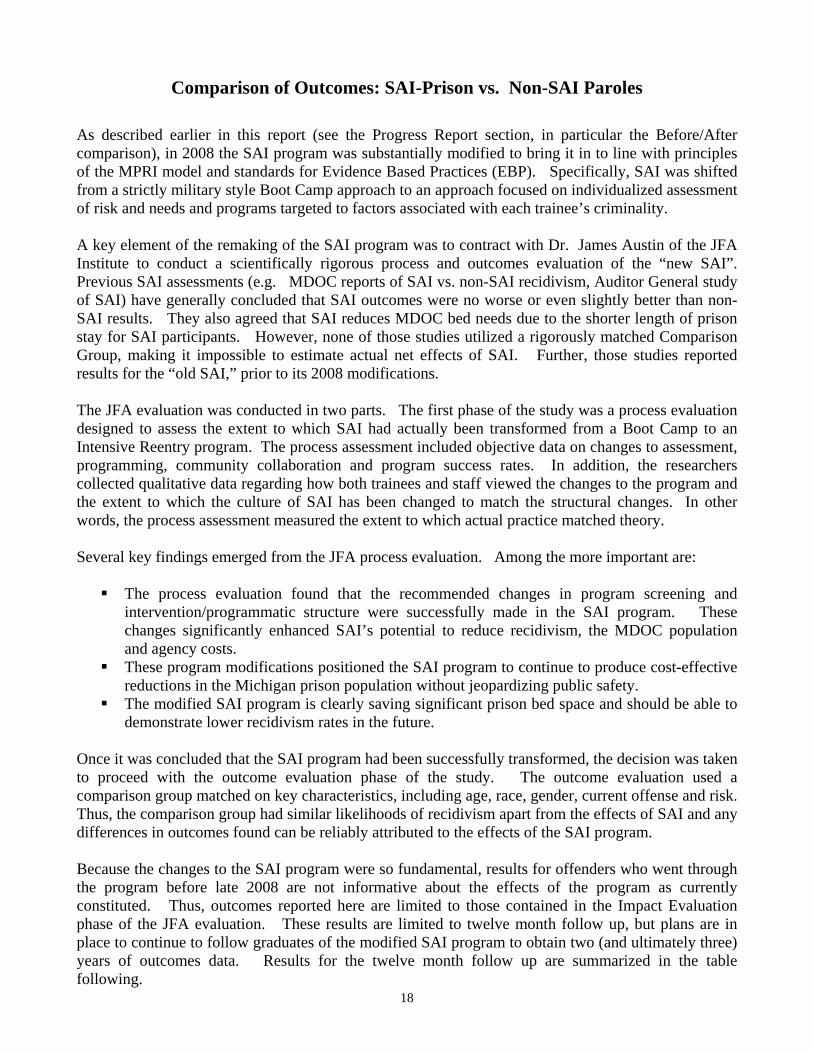
Comparison of Outcomes: SAI-Prison vs. Non-SAI Paroles
As described earlier in this report (see the Progress Report section, in particular the Before/After comparison), in 2008 the SAI program was substantially modified to bring it in to line with principles of the MPRI model and standards for Evidence Based Practices (EBP). Specifically, SAI was shifted from a strictly military style Boot Camp approach to an approach focused on individualized assessment of risk and needs and programs targeted to factors associated with each trainee’s criminality. A key element of the remaking of the SAI program was to contract with Dr. James Austin of the JFA Institute to conduct a scientifically rigorous process and outcomes evaluation of the “new SAI”. Previous SAI assessments (e.g. MDOC reports of SAI vs. non-SAI recidivism, Auditor General study of SAI) have generally concluded that SAI outcomes were no worse or even slightly better than non-SAI results. They also agreed that SAI reduces MDOC bed needs due to the shorter length of prison stay for SAI participants. However, none of those studies utilized a rigorously matched Comparison Group, making it impossible to estimate actual net effects of SAI. Further, those studies reported results for the “old SAI,” prior to its 2008 modifications. The JFA evaluation was conducted in two parts. The first phase of the study was a process evaluation designed to assess the extent to which SAI had actually been transformed from a Boot Camp to an Intensive Reentry program. The process assessment included objective data on changes to assessment, programming, community collaboration and program success rates. In addition, the researchers collected qualitative data regarding how both trainees and staff viewed the changes to the program and the extent to which the culture of SAI has been changed to match the structural changes. In other words, the process assessment measured the extent to which actual practice matched theory. Several key findings emerged from the JFA process evaluation. Among the more important are: The process evaluation found that the recommended changes in program screening and
intervention/programmatic structure were successfully made in the SAI program. These changes significantly enhanced SAI’s potential to reduce recidivism, the MDOC population and agency costs.
These program modifications positioned the SAI program to continue to produce cost-effective reductions in the Michigan prison population without jeopardizing public safety.
The modified SAI program is clearly saving significant prison bed space and should be able to demonstrate lower recidivism rates in the future.
Once it was concluded that the SAI program had been successfully transformed, the decision was taken to proceed with the outcome evaluation phase of the study. The outcome evaluation used a comparison group matched on key characteristics, including age, race, gender, current offense and risk. Thus, the comparison group had similar likelihoods of recidivism apart from the effects of SAI and any differences in outcomes found can be reliably attributed to the effects of the SAI program. Because the changes to the SAI program were so fundamental, results for offenders who went through the program before late 2008 are not informative about the effects of the program as currently constituted. Thus, outcomes reported here are limited to those contained in the Impact Evaluation phase of the JFA evaluation. These results are limited to twelve month follow up, but plans are in place to continue to follow graduates of the modified SAI program to obtain two (and ultimately three) years of outcomes data. Results for the twelve month follow up are summarized in the table following.

19
Four separate outcomes are reported: Return as Technical Violator, Return with a New Sentence, Conviction for a New Crime and Arrest for a New Felony. Two levels of comparison are of interest in determining the effects of SAI.
1. Comparison of results for the Matched Comparison Group to those for all non-SAI parolees provides a measure of how offenders who look like SAI trainees would be expected to perform on parole relative to the overall parole population. In other words, what would their recidivism rate be without SAI?
2. Comparison of outcomes for SAI graduates to the Comparison Group measures the net effects of SAI on recidivism after other offender characteristics are controlled for. In other words, this comparison captures the net effects of the SAI program itself.
Comparison of Twelve Month Outcomes SAI Prison Parolees vs.
Matched Comparison Group and All non-SAI Parolees (Parole Releases January 2008 – May 2009)
GROUP
SAI Prison Matched Non-SAI
Comparison All Non-SAI
Paroles N % N % N %
1,006 100% 1,006 100% 13,951 100% Returned to Prison Technical Parole Violator
38 3.8% 43 4.3% 695 5.0%
Returned to Prison Parole Violator New Sentence
53 5.3% 61 6.1% 624 4.5%
New Conviction 130 12.9% 174 17.3% 1,674 12.0%
New Arrest 317 31.5% 371 36.9% 3,787 27.1%
DATA SOURCE: JFA Institute, Special Alternative Incarceration Program: Second Year Process and Impact Evaluation (2010)

Looking at the two types of comparison noted above, some key findings emerge from the table. On all measures except Return for Technical Violations, the matched comparison group
showed outcomes worse than those for all non-SAI parolees. In other words, offenders who looked like SAI trainees had higher rates of failure than all other parolees if they were not exposed to SAI. This demonstrates that, on the whole, SAI deals with offenders that are more difficult, i.e. riskier, than parolees in general.
On every measure of recidivism, the SAI Prison cases performed better than the matched Comparison Group. They were arrested, convicted and returned to prison at lower rates than comparable cases that did not go through the SAI program. In many cases, rates for the SAI Prison graduates were not much higher than the overall parole population despite their overall riskier profile.
It is worth noting that SAI Prison group includes trainees who graduated in 2008 and who did not go through the “new SAI”. Thus, any effects from the substantial modifications to SAI would not show up for these cases. The JFA report also notes that the effects of SAI are higher for the 2008-2009 releases than they were for a cohort of 2004 releases compared to a matched comparison group. This suggests that the modifications to the SAI program are producing better outcomes than the old Boot Camp model. Thus, it is reasonable to expect that follow up of more cases that have gone through the modified SAI program will demonstrate better results than what has been captured in this first JFA outcomes analysis.

21
2010 ADMISSIONS BY COUNTY –PROBATIONER MALES FEMALES Sentencing Number of % of Total Sentencing Number of % of Total County Admissions Admissions County Admissions Admissions Alcona 0 0.0% Alcona 0 0.0% Alger 0 0.0% Alger 0 0.0%
Allegan 0 0.0% Allegan 0 0.0%
Alpena 3 0.6% Alpena 0 0.0%
Antrim 0 0.0% Antrim 0 0.0%
Arenac 0 0.0% Arenac 0 0.0%
Baraga 0 0.0% Baraga 0 0.0%
Barry 0 0.0% Barry 0 0.0%
Bay 13 2.8% Bay 0 0.0%
Benzie 0 0.0% Benzie 0 0.0%
Berrien 3 0.6% Berrien 0 0.0%
Branch 0 0.0% Branch 0 0.0%
Calhoun 2 0.4% Calhoun 0 0.0%
Cass 0 0.0% Cass 0 0.0%
Charlevoix 1 0.2% Charlevoix 0 0.0%
Cheboygan 0 0.0% Cheboygan 0 0.0%
Chippewa 1 0.2% Chippewa 0 0.0%
Clare 2 0.4% Clare 0 0.0%
Clinton 0 0.0% Clinton 0 0.0%
Crawford 0 0.0% Crawford 0 0.0%
Delta 1 0.2% Delta 0 0.0%
Dickinson 0 0.0% Dickinson 0 0.0%
Eaton 0 0.0% Eaton 1 5.3%
Emmet 0 0.0% Emmet 0 0.0%
Genesee 48 10.4% Genesee 3 15.8%
Gladwin 1 0.2% Gladwin 0 0.0%
Gogebic 0 0.0% Gogebic 0 0.0%
Grand Traverse 1 0.2% Grand Traverse 0 0.0%
Gratiot 0 0.0% Gratiot 0 0.0%
Hillsdale 2 0.4% Hillsdale 0 0.0%
Houghton 0 0.0% Houghton 0 0.0%
Huron 0 0.0% Huron 0 0.0%
Ingham 9 1.9% Ingham 2 10.5%
Ionia 0 0.0% Ionia 0 0.0%
Iosco 0 0.0% Iosco 0 0.0%
Iron 0 0.0% Iron 0 0.0%
Isabella 1 0.2% Isabella 0 0.0%
Jackson 12 2.6% Jackson 0 0.0%
Kalamazoo 34 7.4% Kalamazoo 3 15.8%
Kalkaska 0 0.2% Kalkaska 0 0.0%
Kent 21 4.5% Kent 0 0.0%
Keweenaw 0 0.0% Keweenaw 0 0.0%
Lake 0 0.0% Lake 0 0.0%
Lapeer 1 0.2% Lapeer 0 0.0% APPENDIX A

22
2010 ADMISSIONS BY COUNTY –PROBATIONER – Cont. MALES FEMALES Sentencing Number of % of Total Sentencing Number of % of Total County Admissions Admissions County Admissions Admissions Leelanau 0 0.0% Leelanau 0 0.0%
Lenawee 5 1.1% Lenawee 1 5.3%
Livingston 7 1.5% Livingston 2 10.5%
Luce 0 0.0% Luce 0 0.0%
Mackinac 0 0.0% Mackinac 0 0.0%
Macomb 36 7.8% Macomb 0 0.0%
Manistee 4 0.8% Manistee 0 0.0%
Marquette 0 0.0% Marquette 0 0.0%
Mason 3 0.6% Mason 0 0.0%
Mecosta 2 0.4% Mecosta 0 0.0%
Menominee 0 0.0% Menominee 0 0.0%
Midland 5 1.1% Midland 0 0.0%
Missaukee 0 0.0% Missaukee 0 0.0%
Monroe 15 3.2% Monroe 0 0.0%
Montcalm 1 0.2% Montcalm 0 0.0%
Montmorency 0 0.0% Montmorency 0 0.0%
Muskegon 9 2.0% Muskegon 1 5.3%
Newaygo 1 0.2% Newaygo 0 0.0%
Oakland 15 3.2% Oakland 0 0.0%
Oceana 0 0.0% Oceana 0 0.0%
Ogemaw 0 0.0% Ogemaw 0 0.0%
Ontonagon 0 0.0% Ontonagon 0 0.0%
Osceola 1 0.2% Osceola 0 0.0%
Oscoda 0 0.0% Oscoda 0 0.0%
Otsego 0 0.0% Otsego 0 0.0%
Ottawa 3 0.6% Ottawa 0 0.0%
Presque Isle 0 0.0% Presque Isle 0 0.0%
Roscommon 0 0.0% Roscommon 0 0.0%
Saginaw 25 5.4% Saginaw 2 10.5%
St. Clair 11 2.4% St. Clair 0 0.0%
St. Joseph 1 0.2% St. Joseph 0 0.0%
Sanilac 0 0.0% Sanilac 0 0.0%
Schoolcraft 0 0.0% Schoolcraft 0 0.0%
Shiawassee 0 0.0% Shiawassee 0 0.0%
Tuscola 5 1.1% Tuscola 0 0.0%
Van Buren 3 0.6% Van Buren 1 5.3%
Washtenaw 23 5.0% Washtenaw 1 5.3%
Wayne 130 28.1% Wayne 2 10.5%
Wexford 0 0.0% Wexford 0 0.0%
Totals 462 0.0% 19 0.0% APPENDIX A

23
2010 ADMISSIONS BY COUNTY – SAI PRISONER MALES FEMALES Sentencing Number of % of Total Sentencing Number of % of Total County Admissions Admissions County Admissions Admissions Alcona 0 0.0% Alcona 0 0.0%
Alger 1 0.1% Alger 0 0.0%
Allegan 21 3.1% Allegan 1 0.9%
Alpena 3 0.4% Alpena 1 0.9%
Antrim 2 0.3% Antrim 1 0.9%
Arenac 0 0.0% Arenac 0 0.0%
Baraga 0 0.0% Baraga 0 0.0%
Barry 6 0.9% Barry 3 2.7%
Bay 13 1.9% Bay 1 0.9%
Benzie 0 0.0% Benzie 1 0.9%
Berrien 42 6.2% Berrien 13 11.8%
Branch 7 1.0% Branch 3 2.7%
Calhoun 4 0.6% Calhoun 0 0.0%
Cass 15 2.2% Cass 3 2.7%
Charlevoix 4 0.6% Charlevoix 1 0.9%
Cheboygan 0 0.0% Cheboygan 1 0.9%
Chippewa 1 0.1% Chippewa 0 0.0%
Clare 3 0.4% Clare 1 0.9%
Clinton 5 0.7% Clinton 1 0.9%
Crawford 3 0.4% Crawford 0 0.0%
Delta 0 0.0% Delta 0 0.0%
Dickinson 2 0.3% Dickinson 1 0.9%
Eaton 2 0.3% Eaton 0 0.0%
Emmet 4 0.6% Emmet 0 0.0%
Genesee 27 4.0% Genesee 6 5.4%
Gladwin 4 0.6% Gladwin 2 1.8%
Gogebic 1 0.1% Gogebic 0 0.0%
Grand Traverse 7 1.0% Grand Traverse 2 1.8%
Gratiot 1 0.1% Gratiot 1 0.9%
Hillsdale 2 0.3% Hillsdale 2 1.8%
Houghton 0 0.0% Houghton 0 0.0%
Huron 3 0.4% Huron 0 0.0%
Ingham 14 2.0% Ingham 1 0.9%
Ionia 9 1.3% Ionia 1 0.9%
Iosco 0 0.0% Iosco 1 0.9%
Iron 3 0.4% Iron 1 0.8%
Isabella 1 0.1% Isabella 0 0.0%
Jackson 36 5.4% Jackson 0 0.0%
Kalamazoo 26 3.8% Kalamazoo 7 6.4%
Kalkaska 0 0.0% Kalkaska 0 0.0%
Kent 51 7.6% Kent 7 6.4%
Keweenaw 0 0.0% Keweenaw 0 0.0%
Lake 3 0.4% Lake 0 0.0%
Lapeer 2 0.3% Lapeer 0 0.0% APPENDIX B

24
2010 ADMISSIONS BY COUNTY – SAI PRISONER – Cont.
MALES FEMALES Sentencing Number of % of Total Sentencing Number of % of Total County Admissions Admissions County Admissions Admissions Leelanau 3 0.4% Leelanau 0 0.0%
Lenawee 11 1.6% Lenawee 5 4.5%
Livingston 8 1.2% Livingston 0 0.0%
Luce 1 0.1% Luce 0 0.0%
Mackinac 1 0.1% Mackinac 0 0.0%
Macomb 49 7.3% Macomb 7 6.4%
Manistee 0 0.0% Manistee 0 0.0%
Marquette 0 0.0% Marquette 0 0.0%
Mason 2 0.3% Mason 0 0.0%
Mecosta 8 1.2% Mecosta 2 1.8%
Menominee 0 0.0% Menominee 0 0.0%
Midland 1 0.1% Midland 0 0.0%
Missaukee 5 0.7% Missaukee 0 0.0%
Monroe 16 2.4% Monroe 2 1.8%
Montcalm 7 1.0% Montcalm 1 0.9%
Montmorency 1 0.1% Montmorency 1 0.9%
Muskegon 17 2.5% Muskegon 0 0.0%
Newaygo 4 0.5% Newaygo 1 0.9%
Oakland 32 4.8% Oakland 2 1.8%
Oceana 0 0.0% Oceana 0 0.0%
Ogemaw 2 0.3% Ogemaw 1 0.9%
Ontonagon 0 0.0% Ontonagon 0 0.0%
Osceola 0 0.0% Osceola 0 0.0%
Oscoda 0 0.0% Oscoda 0 0.0%
Otsego 4 0.5% Otsego 0 0.0%
Ottawa 8 1.2% Ottawa 1 0.9%
Presque Isle 1 0.1% Presque Isle 0 0.0%
Roscommon 6 0.9% Roscommon 0 0.0%
Saginaw 12 1.8% Saginaw 1 0.9%
St. Clair 11 1.6% St. Clair 2 1.8%
St. Joseph 12 1.8% St. Joseph 2 1.8%
Sanilac 0 0.0% Sanilac 0 0.0%
Schoolcraft 1 0.1% Schoolcraft 0 0.0%
Shiawassee 3 0.4% Shiawassee 0 0.0%
Tuscola 2 0.3% Tuscola 0 0.0%
Van Buren 9 1.3% Van Buren 1 0.9%
Washtenaw 19 2.8% Washtenaw 6 5.5%
Wayne 78 17.4% Wayne 11 10.0%
Wexford 11 1.6% Wexford 2 1.8%
Totals 672 100.0% 110 100.0%
APPENDIX B

25
2010 ADMISSIONS BY COUNTY – IN REACH PRISONER
IRM MALES IRF FEMALES Sentencing Number of % of Total Sentencing Number of % of Total County Admissions Admissions County Admissions Admissions Alcona 1 0.2% Alcona 0 0.0%
Alger 0 0.0% Alger 0 0.0%
Allegan 5 1.1% Allegan 0 0.0%
Alpena 1 0.2% Alpena 0 0.0%
Antrim 0 0.0% Antrim 0 0.0%
Arenac 0 0.0% Arenac 0 0.0%
Baraga 0 0.0% Baraga 0 0.0%
Barry 1 0.2% Barry 0 0.0%
Bay 8 1.8% Bay 0 0.0%
Benzie 0 0.0% Benzie 0 0.0%
Berrien 15 3.3% Berrien 0 0.0%
Branch 0 0.0% Branch 0 0.0%
Calhoun 5 1.1% Calhoun 0 0.0%
Cass 2 0.4% Cass 0 0.0%
Charlevoix 0 0.0% Charlevoix 0 0.0%
Cheboygan 1 0.2% Cheboygan 0 0.0%
Chippewa 0 0.0% Chippewa 0 0.0%
Clare 0 0.0% Clare 0 0.0%
Clinton 1 0.2% Clinton 0 0.0%
Crawford 0 0.0% Crawford 0 0.0%
Delta 3 0.7% Delta 0 0.0%
Dickinson 1 0.2% Dickinson 0 0.0%
Eaton 2 0.4% Eaton 0 0.0%
Emmet 0 0.0% Emmet 0 0.0%
Genesee 20 4.4% Genesee 0 0.0%
Gladwin 2 0.4% Gladwin 0 0.0%
Gogebic 0 0.0% Gogebic 0 0.0%
Grand Traverse 6 1.3% Grand Traverse 0 0.0%
Gratiot 0 0.0% Gratiot 0 0.0%
Hillsdale 1 0.2% Hillsdale 0 0.0%
Houghton 1 0.2% Houghton 0 0.0%
Huron 1 0.2% Huron 0 0.0%
Ingham 9 2.0% Ingham 1 12.5%
Ionia 2 0.4% Ionia 0 0.0%
Iosco 2 0.4% Iosco 1 12.5%
Iron 0 0.0% Iron 0 0.0%
Isabella 2 0.4% Isabella 0 0.0%
Jackson 10 2.2% Jackson 0 0.0%
Kalamazoo 15 3.3% Kalamazoo 0 0.0%
Kalkaska 2 0.4% Kalkaska 0 0.0%
Kent 40 8.8% Kent 2 25.0%
Keweenaw 0 0.0% Keweenaw 0 0.0%
Lake 0 0.0% Lake 0 0.0%
Lapeer 2 0.4% Lapeer 0 0.0% APPENDIX C
26
2010 ADMISSIONS BY COUNTY – IN REACH PRISONER – Cont.
IRM MALES IRF FEMALES Sentencing Number of % of Total Sentencing Number of % of Total County Admissions Admissions County Admissions Admissions Leelanau 0 0.0% Leelanau 0 0.0%
Lenawee 3 0.7% Lenawee 0 0.0%
Livingston 3 0.7% Livingston 0 0.0%
Luce 0 0.0% Luce 0 0.0%
Mackinac 0 0.0% Mackinac 0 0.0%
Macomb 23 5.9% Macomb 0 0.0%
Manistee 1 0.2% Manistee 0 0.0%
Marquette 1 0.2% Marquette 0 0.0%
Mason 4 0.9% Mason 0 0.0%
Mecosta 0 0.0% Mecosta 0 0.0%
Menominee 1 0.2% Menominee 0 0.0%
Midland 3 0.7% Midland 0 0.0%
Missaukee 0 0.0% Missaukee 0 0.0%
Monroe 12 2.6% Monroe 0 0.0%
Montcalm 2 0.4% Montcalm 0 0.0%
Montmorency 1 0.2% Montmorency 0 0.0%
Muskegon 24 5.3% Muskegon 2 25.0%
Newaygo 0 0.0% Newaygo 0 0.0%
Oakland 46 10.1% Oakland 1 12.5%
Oceana 1 0.2% Oceana 0 0.0%
Ogemaw 0 0.0% Ogemaw 0 0.0%
Ontonagon 0 0.0% Ontonagon 0 0.0%
Osceola 0 0.0% Osceola 0 0.0%
Oscoda 0 0.0% Oscoda 0 0.0%
Otsego 0 0.0% Otsego 0 0.0%
Ottawa 1 0.2% Ottawa 0 0.0%
Presque Isle 0 0.0% Presque Isle 0 0.0%
Roscommon 0 0.0% Roscommon 0 0.0%
Saginaw 13 2.9% Saginaw 0 0.0%
St. Clair 7 1.5% St. Clair 0 0.0%
St. Joseph 3 0.7% St. Joseph 0 0.0%
Sanilac 0 0.0% Sanilac 0 0.0%
Schoolcraft 0 0.0% Schoolcraft 0 0.0%
Shiawassee 4 0.9% Shiawassee 0 0.0%
Tuscola 3 0.7% Tuscola 0 0.0%
Van Buren 1 0.2% Van Buren 0 0.0%
Washtenaw 14 3.1% Washtenaw 0 0.0%
Wayne 123 27.0% Wayne 1 12.5%
Wexford 0 0.0% Wexford 0 0.0%
Totals 455 100.0% 8 100.0%
APPENDIX C
27
0
51
0
10
20
53
3
62
03
26
43
0
59
2
2127
57
0
45
1
5
4544
2
111
2
8
40
73
3
47
4
6
5049
00
2
7
53
87
00
0
7
35
81
00
2
16
46
78
00
3
18
5656
00
12
32
55
00
2
7
32
54
0
20
40
60
80
100
120
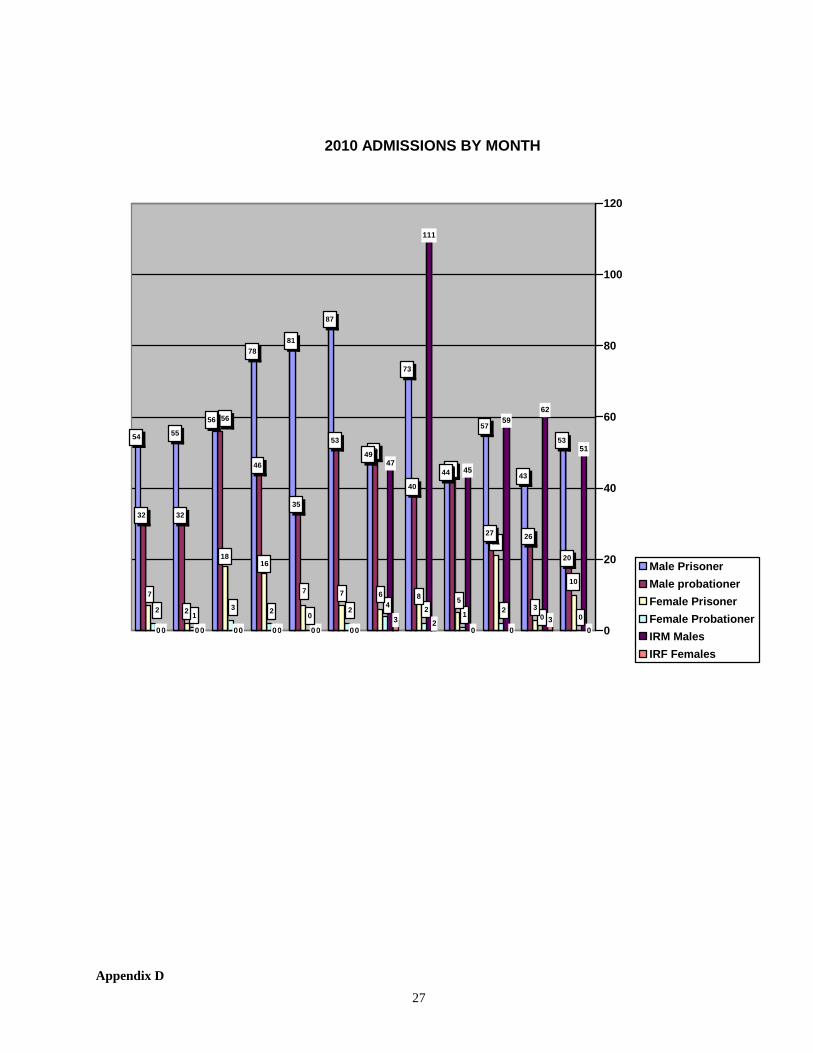
2010 ADMISSIONS BY MONTH
Male Prisoner
Male probationer
Female Prisoner
Female Probationer
IRM Males
IRF Females
Appendix D

28
462
672
19
110
455
8
0 100 200 300 400 500 600 700
Male Probationers
Male Prisoners
Female Probationer
Female Prisoner
IRM Prisoner
IRF Prisoner
2010 ADMISSIONS BY SEX
Male Priosners Male Probationers Female Probationer Female Priosner IRM Prisoner IRF Prisoner
Appendix E

29
2010 MONTHLY POPULATION TOTALS
134
102
17
3
00
156
98
17
3
00
161
110
30
5
00
185
125
35
4
00
212
128
38
4
00
233
112
28
2
00
162
129
17
5
112
3
176
130
19
6
183
5
142
122
16
6
199
5
165
103
34
5
208
5
126
92
27
3
174
4
137
66
32
2
170
20
50
100
150
200
250
Jan Feb Mar Apr May Jun Jul Aug Sep Oct Nov Dec
Male Prisoners Male Probationers Female Prisoners Female Probationers IRM Prisoners IRF Prisoners
Appendix F

30
2010 PROGRAM OUTCOMES BY COUNTY – MALE PROBATIONER Successful Rule Voluntary Medical Unqualified Totals Completion Violator Withdrawal Termination Alcona 0 0 0 0 0 0 Alger 0 0 0 0 0 0 Allegan 0 0 0 0 0 0 Alpena 3 0 0 0 0 3 Antrim 0 0 0 0 0 0 Arenac 0 0 0 0 0 0 Baraga 0 0 0 0 0 0 Barry 0 0 0 0 0 0 Bay 11 2 0 0 0 13 Benzie 0 0 0 0 0 0 Berrien 6 0 0 0 0 6 Branch 0 0 0 0 0 0 Calhoun 0 0 0 1 0 1 Cass 0 0 0 0 0 0 Charlevoix 1 0 0 0 0 1 Cheboygan 1 0 0 0 0 1 Chippewa 1 0 0 0 0 1 Clare 2 0 0 0 0 2 Clinton 0 0 0 0 0 0 Crawford 0 0 0 0 0 0 Delta 0 0 0 0 0 0 Dickinson 0 0 0 0 0 0 Eaton 0 0 0 0 0 0 Emmet 0 0 0 0 0 0 Genesee 44 4 0 1 2 51 Gladwin 1 0 0 0 0 1 Gogebic 0 0 0 0 0 0 Grand Traverse 3 0 0 0 0 3 Gratiot 0 0 0 0 0 0 Hillsdale 0 0 0 0 0 0 Houghton 0 0 0 0 0 0 Huron 0 0 0 0 0 0 Ingham 5 2 0 1 0 8 Ionia 0 0 0 0 0 0 Iosco 0 0 0 0 0 0 Iron 0 0 0 0 0 0 Isabella 2 0 0 0 0 2 Jackson 13 0 0 0 0 13 Kalamazoo 28 2 1 3 2 37 Kalkaska 0 0 0 0 0 0 Kent 21 0 0 0 0 21 Keweenaw 0 0 0 0 0 0 Lake 0 0 0 0 0 0 Lapeer 0 0 0 0 0 0
APPENDIX G

31
2010 PROGRAM OUTCOMES BY COUNTY – MALE PROBATIONER –Cont.
Successful Rule Voluntary Medical Unqualified Totals Completion Violator Withdrawal Termination
Leelanau 0 0 0 0 0 0 Lenawee 2 0 0 2 1 5 Livingston 12 0 0 0 0 12 Luce 0 0 0 0 0 0 Mackinac 0 0 0 0 0 0 Macomb 37 6 0 0 0 43 Manistee 3 0 0 1 0 4 Marquette 0 0 0 0 0 0 Mason 3 0 0 0 0 3 Mecosta 2 0 0 0 0 2 Menominee 0 0 0 0 0 0 Midland 4 0 0 0 0 4 Missaukee 0 0 0 0 0 0 Monroe 10 1 0 0 1 12 Montcalm 0 0 0 0 0 0 Montmorency 0 0 0 0 0 0 Muskegon 11 0 0 0 0 11 Newaygo 0 0 0 0 0 0 Oakland 24 1 0 1 0 26 Oceana 0 0 0 0 0 0 Ogemaw 0 0 0 0 0 0 Ontonagon 0 0 0 0 0 0 Osceola 1 0 0 0 0 1 Oscoda 0 0 0 0 0 0 Otsego 0 0 0 0 0 0 Ottawa 1 0 1 0 0 2 Presque Isle 0 0 0 0 0 0 Roscommon 0 0 0 0 0 0 Saginaw 26 4 0 0 0 30 St. Clair 9 0 0 0 1 10 St. Joseph 1 0 0 0 0 1 Sanilac 0 0 0 0 0 0 Schoolcraft 0 0 0 0 0 0 Shiawassee 2 0 0 0 0 2 Tuscola 4 0 0 0 0 4 Van Buren 2 0 0 0 0 2 Washtenaw 30 1 1 1 0 33 Wayne 104 11 2 8 5 130 Wexford 0 0 0 0 0 0
TOTAL 432 34 5 18 13 502
APPENDIX G

32
2010 PROGRAM OUTCOMES BY COUNTY – FEMALE PROBATIONER Successful Rule Voluntary Medical Unqualified Totals Completion Violator Withdrawal Termination Alcona 0 0 0 0 0 0 Alger 0 0 0 0 0 0 Allegan 0 0 0 0 0 0 Alpena 0 0 0 0 0 0 Antrim 0 0 0 0 0 0 Arenac 0 0 0 0 0 0 Baraga 0 0 0 0 0 0 Barry 0 0 0 0 0 0 Bay 0 0 0 0 0 0 Benzie 0 0 0 0 0 0 Berrien 0 0 0 0 0 0 Branch 0 0 0 0 0 0 Calhoun 0 0 0 0 0 0 Cass 0 0 0 0 0 0 Charlevoix 0 0 0 0 0 0 Cheboygan 0 0 0 0 0 0 Chippewa 0 0 0 0 0 0 Clare 0 0 0 0 0 0 Clinton 0 0 0 0 0 0 Crawford 0 0 0 0 0 0 Delta 0 0 0 0 0 0 Dickinson 0 0 0 0 0 0 Eaton 0 0 0 1 0 1 Emmet 1 0 0 0 0 1 Genesee 2 1 0 1 0 3 Gladwin 0 0 0 0 0 0 Gogebic 0 0 0 0 0 0 Grand Traverse 0 0 0 0 0 0 Gratiot 0 0 0 0 0 0 Hillsdale 0 0 0 0 0 0 Houghton 0 0 0 0 0 0 Huron 0 0 0 0 0 0 Ingham 1 1 0 0 0 2 Ionia 0 0 0 0 0 0 Iosco 0 0 0 0 0 0 Iron 0 0 0 0 0 0 Isabella 0 0 0 0 0 0 Jackson 0 0 0 0 0 0 Kalamazoo 3 0 0 0 0 3 Kalkaska 0 0 0 0 0 0 Kent 0 0 0 0 0 0 Keweenaw 0 0 0 0 0 0 Lake 0 0 0 0 0 0 Lapeer 0 0 0 0 0 0
APPENDIX G

33
2010 PROGRAM OUTCOMES BY COUNTY – FEMALE PROBATIONER – Cont.
Successful Rule Voluntary Medical Unqualified Totals Completion Violator Withdrawal Termination Leelanau 0 0 0 0 0 0 Lenawee 1 0 0 0 0 1 Livingston 2 0 0 0 0 2 Luce 0 0 0 0 0 0 Mackinac 0 0 0 0 0 0 Macomb 0 0 0 0 0 0 Manistee 0 0 0 0 0 0 Marquette 0 0 0 0 0 0 Mason 0 0 0 0 0 0 Mecosta 0 0 0 0 0 0 Menominee 0 0 0 0 0 0 Midland 0 0 0 0 0 0 Missaukee 0 0 0 0 0 0 Monroe 0 0 0 0 0 0 Montcalm 0 0 0 0 0 0 Montmorency 0 0 0 0 0 0 Muskegon 0 0 1 0 0 1 Newaygo 0 0 0 0 0 0 Oakland 0 0 0 0 0 0 Oceana 0 0 0 0 0 0 Ogemaw 0 0 0 0 0 0 Ontonagon 0 0 0 0 0 0 Osceola 0 0 0 0 0 0 Oscoda 0 0 0 0 0 0 Otsego 0 0 0 0 0 0 Ottawa 0 0 0 0 0 0 Presque Isle 0 0 0 0 0 0 Roscommon 0 0 0 0 0 0 Saginaw 1 1 0 0 0 2 St. Clair 0 0 0 0 0 0 St. Joseph 0 0 0 0 0 0 Sanilac 0 0 0 0 0 0 Schoolcraft 0 0 0 0 0 0 Shiawassee 0 0 0 0 0 0 Tuscola 0 0 0 0 0 0 Van Buren 1 0 0 0 0 1 Washtenaw 0 0 0 0 0 0 Wayne 2 0 0 0 0 2 Wexford 0 0 0 0 0 0 TOTAL 14 3 1 1 0 19
APPENDIX G

34
2010 PROGRAM OUTCOMES BY COUNTY – SAI MALE PRISONER Successful Rule Voluntary Medical Unqualified Totals Completion Violator Withdrawal Termination
Alcona 0 0 0 0 0 0 Alger 0 0 0 0 0 0 Allegan 18 0 0 1 0 19 Alpena 3 0 0 0 0 3 Antrim 2 0 0 0 0 2 Arenac 0 0 0 0 0 0 Baraga 0 0 0 0 0 0 Barry 5 0 0 0 1 6 Bay 12 0 0 0 1 13
Benzie 0 0 0 0 0 0 Berrien 41 1 0 0 1 43 Branch 7 0 0 0 0 7 Calhoun 4 0 0 0 0 4 Cass 18 0 0 0 0 18 Charlevoix 4 0 0 0 0 4 Cheboygan 0 0 0 0 0 0 Chippewa 0 1 0 0 0 1 Clare 3 0 0 0 0 3 Clinton 5 0 0 0 0 5 Crawford 3 0 0 0 0 3 Delta 0 0 0 0 0 0 Dickinson 2 0 0 0 0 2 Eaton 3 0 0 0 0 3 Emmet 4 0 0 0 0 4 Genesee 30 1 0 0 1 32 Gladwin 4 0 0 0 0 4 Gogebic 1 0 0 0 0 1 Grand Traverse 8 0 0 0 0 8 Gratiot 1 0 0 0 0 1 Hillsdale 2 0 0 0 0 2 Houghton 0 0 0 0 0 0 Huron 3 0 0 0 0 3 Ingham 14 0 0 0 0 14 Ionia 9 0 0 0 0 9 Iosco 0 0 0 0 0 0 Iron 3 0 0 0 0 3 Isabella 1 0 0 0 0 1 Jackson 30 2 0 1 2 35 Kalamazoo 35 3 0 1 0 39 Kalkaska 0 0 0 0 0 0 Kent 62 0 2 0 0 64 Keweenaw 0 0 0 0 0 0 Lake 3 0 0 0 0 3 Lapeer 2 0 0 0 0 2
APPENDIX H

35
2010 PROGRAM OUTCOMES BY COUNTY – SAI MALE PRISONER – Cont. Successful Rule Voluntary Medical Unqualified Totals Completion Violator Withdrawal Termination Leelanau 3 0 0 0 0 3 Lenawee 11 0 0 0 0 11 Livingston 7 0 0 0 1 8 Luce 1 0 0 0 0 1 Mackinac 1 0 0 0 0 1 Macomb 45 1 0 2 1 49 Manistee 0 0 0 0 0 0 Marquette 0 0 0 0 0 0 Mason 2 0 0 0 0 2 Mecosta 8 0 0 0 0 8 Menominee 0 0 0 0 0 0 Midland 1 0 0 0 0 1 Missaukee 5 0 0 0 0 5 Monroe 14 1 0 1 0 16 Montcalm 7 0 0 0 0 7 Montmorency 1 0 0 0 0 1 Muskegon 17 0 0 0 0 17 Newaygo 4 0 0 0 0 4 Oakland 27 0 0 0 2 29 Oceana 0 0 0 0 0 0 Ogemaw 2 0 0 0 0 2 Ontonagon 0 0 0 0 0 0 Osceola 0 0 0 0 0 0 Oscoda 0 0 0 0 0 0 Otsego 4 0 0 0 0 4 Ottawa 8 0 0 0 0 8 Presque Isle 0 0 0 1 0 1 Roscommon 6 0 0 0 0 6 Saginaw 10 0 0 0 0 10 St. Clair 11 0 0 0 0 11 St. Joseph 12 0 0 0 0 12 Sanilac 0 0 0 0 0 0 Schoolcraft 1 0 0 0 0 1 Shiawassee 2 0 0 0 1 3 Tuscola 2 0 0 0 0 2 Van Buren 9 0 0 0 0 9 Washtenaw 17 2 0 1 0 20 Wayne 78 3 2 2 1 86 Wexford 11 0 0 0 0 11 TOTAL 669 15 4 10 12 710
APPENDIX H
36
2010 PROGRAM OUTCOMES BY COUNTY – SAI FEMALE PRISONER Successful Rule Voluntary Medical Unqualified Totals Completion Violator Withdrawal Termination Alcona 0 0 0 0 0 0
Alger 0 0 0 0 0 0
Allegan 1 0 0 0 0 1
Alpena 1 0 0 0 0 1
Antrim 1 0 0 0 0 1
Arenac 0 0 0 0 0 0
Baraga 0 0 0 0 0 0
Barry 3 0 0 0 0 3
Bay 1 0 0 0 0 1
Benzie 1 0 0 0 0 1
Berrien 14 0 0 1 0 15
Branch 1 0 0 0 0 1
Calhoun 0 0 0 0 0 0
Cass 2 0 0 0 0 2
Charlevoix 0 0 0 0 0 0
Cheboygan 0 0 0 0 0 0
Chippewa 0 0 0 0 0 0
Clare 0 0 0 0 0 0
Clinton 1 0 0 0 0 1
Crawford 0 0 0 0 0 0
Delta 0 0 0 0 0 0
Dickinson 1 0 0 0 0 1
Eaton 0 0 0 0 0 0
Emmet 0 0 0 0 0 0
Genesee 5 0 0 0 0 5
Gladwin 1 0 0 0 0 1
Gogebic 0 0 0 0 0 0
Grand Traverse 1 0 0 0 0 1
Gratiot 1 0 0 0 0 1
Hillsdale 2 0 0 0 0 2
Houghton 0 0 0 0 0 0
Huron 0 0 0 0 0 0
Ingham 0 0 0 0 0 0
Ionia 1 0 0 0 0 1
Iosco 0 0 0 1 0 1
Iron 0 0 0 0 0 0
Isabella 0 0 0 0 0 0
Jackson 0 0 0 0 0 0
Kalamazoo 7 0 0 0 0 7
Kalkaska 0 0 0 0 0 0
Kent 8 0 0 0 0 8
Keweenaw 0 0 0 0 0 0
Lake 0 0 0 0 0 0
Lapeer 0 0 0 0 0 0 APPENDIX H

37
2010 PROGRAM OUTCOMES BY COUNTY – SAI FEMALE PRISONER – Cont.
Successful Rule Voluntary Medical Unqualified Totals Completion Violator Withdrawal Termination Leelanau 0 0 0 0 0 0
Lenawee 4 0 1 0 0 5
Livingston 0 0 0 0 0 0
Luce 0 0 0 0 0 0
Mackinac 0 0 0 0 0 0
Macomb 3 0 0 0 0 3
Manistee 0 0 0 0 0 0
Marquette 0 0 0 0 0 0
Mason 0 0 0 0 0 0
Mecosta 1 0 0 0 0 1
Menominee 0 0 0 0 0 0
Midland 0 0 0 0 0 0
Missaukee 0 0 0 0 0 0
Monroe 2 0 0 0 0 2
Montcalm 0 0 0 0 1 1
Montmorency 0 0 0 0 1 1
Muskegon 1 0 0 0 0 1
Newaygo 0 0 0 0 0 0
Oakland 4 0 0 0 0 4
Oceana 0 0 0 0 0 0
Ogemaw 0 0 0 0 0 0
Ontonagon 0 0 0 0 0 0
Osceola 0 0 0 0 0 0
Oscoda 0 0 0 0 0 0
Otsego 0 0 0 0 0 0
Ottawa 0 0 0 0 0 0
Presque Isle 0 0 0 0 0 0
Roscommon 0 0 0 0 0 0
Saginaw 0 0 0 0 0 0
St. Clair 1 0 0 0 0 1
St. Joseph 2 0 0 0 0 2
Sanilac 0 0 0 0 0 0
Schoolcraft 0 0 0 0 0 0
Shiawassee 0 0 0 0 0 0
Tuscola 0 0 0 0 0 0
Van Buren 1 0 0 0 0 1
Washtenaw 4 0 0 0 1 5
Wayne 10 2 0 0 0 12
Wexford 0 0 0 0 0 0
TOTAL 86 2 1 2 3 94
APPENDIX H
38
2010 PROGRAM OUTCOMES BY COUNTY –IN REACH MALE PRISONER Successful Rule Voluntary Medical Unqualified Totals Completion Violator Withdrawal Termination
Alcona 1 0 0 0 0 1 Alger 0 0 0 0 0 0 Allegan 2 0 0 0 0 2 Alpena 1 0 0 0 0 1 Antrim 0 0 0 0 0 0 Arenac 0 0 0 0 0 0 Baraga 0 0 0 0 0 0 Barry 0 0 0 0 0 0 Bay 3 0 0 0 0 3
Benzie 0 0 0 0 0 0 Berrien 10 0 0 1 1 12 Branch 0 0 0 0 0 0 Calhoun 3 0 0 0 1 4 Cass 1 0 0 0 0 1 Charlevoix 0 0 0 0 0 0 Cheboygan 1 0 0 0 0 1 Chippewa 0 0 0 0 0 0 Clare 0 0 0 0 0 0 Clinton 1 0 0 0 0 1 Crawford 0 0 0 0 0 0 Delta 3 0 0 0 0 3 Dickinson 1 0 0 0 0 1 Eaton 0 0 0 0 0 0 Emmet 0 0 0 0 0 0 Genesee 13 0 0 0 1 14 Gladwin 1 0 0 0 0 1 Gogebic 0 0 0 0 0 0 Grand Traverse 2 0 0 0 0 2 Gratiot 0 0 0 0 0 0 Hillsdale 1 0 0 0 0 1 Houghton 1 0 0 0 0 1 Huron 1 0 0 0 0 1 Ingham 4 1 0 0 0 4 Ionia 2 0 0 0 0 2 Iosco 0 0 0 0 0 0 Iron 0 0 0 0 0 0 Isabella 2 0 0 0 0 2 Jackson 6 0 0 0 0 6 Kalamazoo 8 0 0 0 0 8 Kalkaska 1 0 0 0 0 1 Kent 25 0 0 1 2 28 Keweenaw 0 0 0 0 0 0 Lake 0 0 0 0 0 0 Lapeer 1 0 0 0 0 1
APPENDIX I

39
2010 PROGRAM OUTCOMES BY COUNTY – IN REACH MALE PRISONER – Cont.
Successful Rule Voluntary Medical Unqualified Totals Completion Violator Withdrawal Termination Leelanau 0 0 0 0 0 0 Lenawee 2 0 0 0 0 2 Livingston 3 0 0 0 0 3 Luce 0 0 0 0 0 0 Mackinac 0 0 0 0 0 0 Macomb 7 0 0 0 0 7 Manistee 1 0 0 0 0 1 Marquette 1 0 0 0 0 1 Mason 3 0 0 0 0 3 Mecosta 0 0 0 0 0 0 Menominee 0 0 0 0 0 0 Midland 2 0 0 0 0 2 Missaukee 0 0 0 0 0 0 Monroe 4 0 1 0 0 5 Montcalm 2 0 0 0 0 2 Montmorency 1 0 0 0 0 1 Muskegon 15 1 0 0 1 17 Newaygo 0 0 0 0 0 0 Oakland 27 1 1 1 0 30 Oceana 1 0 0 0 0 1 Ogemaw 0 0 0 0 0 0 Ontonagon 0 0 0 0 0 0 Osceola 0 0 0 0 0 0 Oscoda 0 0 0 0 0 0 Otsego 0 0 0 0 0 0 Ottawa 1 0 0 0 0 1 Presque Isle 0 0 0 0 0 0 Roscommon 0 0 0 0 0 0 Saginaw 6 1 1 0 0 8 St. Clair 4 0 0 1 0 5 St. Joseph 2 0 0 0 0 2 Sanilac 0 0 0 0 0 0 Schoolcraft 0 0 0 0 0 0 Shiawassee 4 0 0 0 0 4 Tuscola 1 0 0 0 0 1 Van Buren 0 0 0 0 0 0 Washtenaw 11 0 0 0 0 11 Wayne 64 7 3 3 2 79 Wexford 0 0 0 0 0 0 TOTAL 257 11 6 7 8 289
APPENDIX I

40
2010 PROGRAM OUTCOMES BY COUNTY – IN REACH FEMALE PRISONER
Successful Rule Voluntary Medical Unqualified Totals Completion Violator Withdrawal Termination Alcona 0 0 0 0 0 0
Alger 0 0 0 0 0 0
Allegan 0 0 0 0 0 0
Alpena 0 0 0 0 0 0
Antrim 0 0 0 0 0 0
Arenac 0 0 0 0 0 0
Baraga 0 0 0 0 0 0
Barry 0 0 0 0 0 0
Bay 0 0 0 0 0 0
Benzie 0 0 0 0 0 0
Berrien 0 0 0 0 0 0
Branch 0 0 0 0 0 0
Calhoun 0 0 0 0 0 0
Cass 0 0 0 0 0 0
Charlevoix 0 0 0 0 0 0
Cheboygan 0 0 0 0 0 0
Chippewa 0 0 0 0 0 0
Clare 0 0 0 0 0 0
Clinton 0 0 0 0 0 0
Crawford 0 0 0 0 0 0
Delta 0 0 0 0 0 0
Dickinson 0 0 0 0 0 0
Eaton 0 0 0 0 0 0
Emmet 0 0 0 0 0 0
Genesee 0 0 0 0 0 0
Gladwin 0 0 0 0 0 0
Gogebic 0 0 0 0 0 0
Grand Traverse 0 0 0 0 0 0
Gratiot 0 0 0 0 0 0
Hillsdale 0 0 0 0 0 0
Houghton 0 0 0 0 0 0
Huron 0 0 0 0 0 0
Ingham 0 0 0 0 1 1
Ionia 0 0 0 0 0 0
Iosco 0 0 0 0 1 1
Iron 0 0 0 0 0 0
Isabella 0 0 0 0 0 0
Jackson 0 0 0 0 0 0
Kalamazoo 0 0 0 0 0 0
Kalkaska 0 0 0 0 0 0
Kent 1 0 0 0 0 1
Keweenaw 0 0 0 0 0 0
Lake 0 0 0 0 0 0
Lapeer 0 0 0 0 0 0 APPENDIX I

41
2010 PROGRAM OUTCOMES BY COUNTY – IN REACH FEMALE PRISONER – Cont.
Successful Rule Voluntary Medical Unqualified Totals Completion Violator Withdrawal Termination Leelanau 0 0 0 0 0 0
Lenawee 0 0 0 0 0 0
Livingston 0 0 0 0 0 0
Luce 0 0 0 0 0 0
Mackinac 0 0 0 0 0 0
Macomb 0 0 0 0 0 0
Manistee 0 0 0 0 0 0
Marquette 0 0 0 0 0 0
Mason 0 0 0 0 0 0
Mecosta 0 0 0 0 0 0
Menominee 0 0 0 0 0 0
Midland 0 0 0 0 0 0
Missaukee 0 0 0 0 0 0
Monroe 0 0 0 0 0 0
Montcalm 0 0 0 0 0 0
Montmorency 0 0 0 0 0 0
Muskegon 1 0 0 0 0 1
Newaygo 0 0 0 0 0 0
Oakland 1 0 0 0 0 1
Oceana 0 0 0 0 0 0
Ogemaw 0 0 0 0 0 0
Ontonagon 0 0 0 0 0 0
Osceola 0 0 0 0 0 0
Oscoda 0 0 0 0 0 0
Otsego 0 0 0 0 0 0
Ottawa 0 0 0 0 0 0
Presque Isle 0 0 0 0 0 0
Roscommon 0 0 0 0 0 0
Saginaw 0 0 0 0 0 0
St. Clair 0 0 0 0 0 0
St. Joseph 0 0 0 0 0 0
Sanilac 0 0 0 0 0 0
Schoolcraft 0 0 0 0 0 0
Shiawassee 0 0 0 0 0 0
Tuscola 0 0 0 0 0 0
Van Buren 0 0 0 0 0 0
Washtenaw 0 0 0 0 0 0
Wayne 1 0 0 0 0 1
Wexford 0 0 0 0 0 0
TOTAL 4 0 0 2 0 6
APPENDIX I

42
2010 MONTHLY PROGRAM OUTCOMES – SAI PRISONER MALE Successful Rule Voluntary Medical Unqualified Totals Completion Violator Withdrawal Termination JANUARY 98 1 1 2 1 103 FEBRUARY 31 0 0 2 0 33 MARCH 50 0 0 0 1 51 APRIL 52 0 0 1 1 54 MAY 51 1 1 1 0 54 JUNE 62 2 0 0 2 66 JULY 52 1 0 0 1 54 AUGUST 55 2 0 2 0 59 SEPTEMBER 75 2 0 0 1 78 OCTOBER 27 4 0 0 3 34 NOVEMBER 76 2 1 1 2 82 DECEMBER 40 0 1 1 0 42 TOTAL 669 15 4 10 12 710
FEMALE Successful Rule Voluntary Medical Unqualified Totals Completion Violator Withdrawal Termination JANUARY 8 0 0 0 0 8 FEBRUARY 2 0 0 0 0 2 MARCH 3 1 1 0 0 5 APRIL 11 0 0 0 0 11 MAY 2 0 0 1 1 4 JUNE 16 0 0 1 0 17 JULY 14 1 0 0 0 15 AUGUST 6 0 0 0 0 6 SEPTEMBER 8 0 0 0 0 8 OCTOBER 3 0 0 0 0 3 NOVEMBER 9 0 0 0 1 10 DECEMBER 4 0 0 0 1 5 TOTAL 86 2 1 2 3 94
APPENDIX J

43
2010 MONTHLY PROGRAM OUTCOMES – PROBATIONER MALE Successful Rule Voluntary Medical Unqualified Totals Completion Violator Withdrawal Termination JANUARY 26 3 0 0 3 32 FEBRUARY 30 1 1 2 2 36 MARCH 38 4 0 1 1 44 APRIL 26 1 1 2 1 31 MAY 29 0 1 1 1 32 JUNE 59 5 1 4 0 69 JULY 30 3 0 4 0 37 AUGUST 35 3 0 0 1 39 SEPTEMBER 45 4 1 1 2 53 OCTOBER 39 6 0 0 1 46 NOVEMBER 35 0 0 1 1 37 DECEMBER 40 4 0 2 0 46 TOTAL 432 34 5 18 13 502
FEMALE Successful Rule Voluntary Medical Unqualified Totals Completion Violator Withdrawal Termination JANUARY 1 0 0 0 0 1 FEBRUARY 0 0 1 0 0 1 MARCH 1 0 0 0 0 1 APRIL 2 1 0 0 0 3 MAY 0 0 0 0 0 0 JUNE 3 0 0 1 0 4 JULY 1 0 0 0 0 1 AUGUST 0 1 0 0 0 1 SEPTEMBER 0 1 0 0 0 1 OCTOBER 3 0 0 0 0 3 NOVEMBER 2 0 0 0 0 2 DECEMBER 1 0 0 0 0 1 TOTAL 14 3 1 1 0 19
APPENDIX K
44
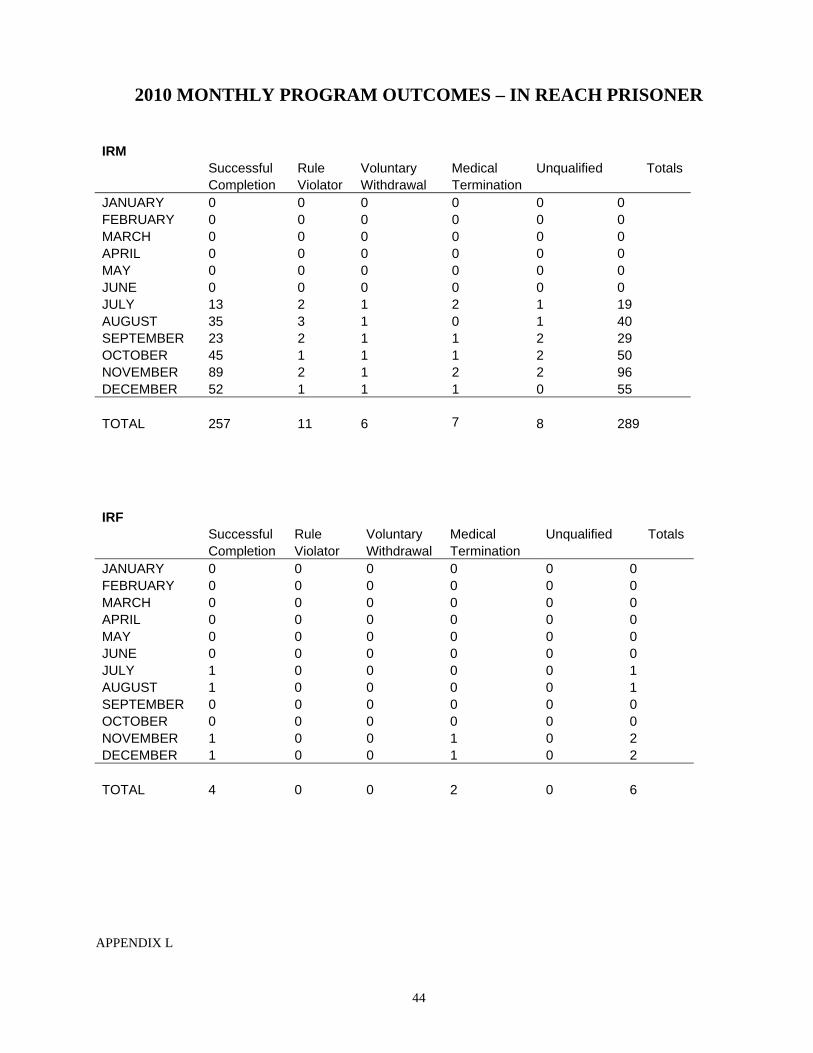
2010 MONTHLY PROGRAM OUTCOMES – IN REACH PRISONER IRM Successful Rule Voluntary Medical Unqualified Totals Completion Violator Withdrawal Termination JANUARY 0 0 0 0 0 0 FEBRUARY 0 0 0 0 0 0 MARCH 0 0 0 0 0 0 APRIL 0 0 0 0 0 0 MAY 0 0 0 0 0 0 JUNE 0 0 0 0 0 0 JULY 13 2 1 2 1 19 AUGUST 35 3 1 0 1 40 SEPTEMBER 23 2 1 1 2 29 OCTOBER 45 1 1 1 2 50 NOVEMBER 89 2 1 2 2 96 DECEMBER 52 1 1 1 0 55 TOTAL 257 11 6 7 8 289
IRF Successful Rule Voluntary Medical Unqualified Totals Completion Violator Withdrawal Termination JANUARY 0 0 0 0 0 0 FEBRUARY 0 0 0 0 0 0 MARCH 0 0 0 0 0 0 APRIL 0 0 0 0 0 0 MAY 0 0 0 0 0 0 JUNE 0 0 0 0 0 0 JULY 1 0 0 0 0 1 AUGUST 1 0 0 0 0 1 SEPTEMBER 0 0 0 0 0 0 OCTOBER 0 0 0 0 0 0 NOVEMBER 1 0 0 1 0 2 DECEMBER 1 0 0 1 0 2 TOTAL 4 0 0 2 0 6
APPENDIX L

45
2010 GRADUATES BY SEX
669
432
14
257
4
86
0 100 200 300 400 500 600 700 800
Prisoner Males
Probationer Males
Prisoner Females
Probationer females
IRM Prisoners
IRF Prisoners
Prisoner Males Probationer Males Prisoner Females Probationer Females IRM Prisoners IRF Prisoner
APPENDIX M

46
COMPARATIVE PROGRAM OUTCOMES – SAI PRISONER MALES 2009 AND 2010 Prisoners Probationers 2009 2010 2009 2010 Terminations Successful Completions 917(95.3 %) 669 (97.2%) 499 (91.0%) 432 (91.7%) Voluntary Withdrawals 10 (1.0 %) 4 (0.5%) 7 (1.3%) 5 (1.1%) Rule Violators 35 (3.6 %) 15 (2.1%) 45 (8.2%) 34 (7.2%) Total 962 688 551 471 Unqualified Medical Terminations 16 10 23 18 Unqualified by statute 34 12 13 13 Total Program Exits 1012 710 587 502
APPENDIX N

47
COMPARATIVE PROGRAM OUTCOMES – SAI PRISONER FEMALES 2009 AND 2010
Prisoners Probationers 2009 2010 2009 2010 Terminations Successful Completions 115 (99.0%) 86 (97.0%) 18 (95.0%) 14 (78.0%) Voluntary Withdrawals 0 (0.0%) 1 (1.1%) 0 (0.0%) 1 (5.6%) Rule Violators 1 (0.9%) 2 (2.2%) 1 (5.3%) 3 (16.7%) Total 116 89 19 18 Unqualified Medical Terminations 7 2 3 0 Unqualified by statute 3 3 0 1 Total Program Exits 126 94 22 19
APPENDIX N

48
COMPARATIVE PROGRAM OUTCOMES – IN REACH PRISONER MALES 2009 AND 2010
IRM Prisoners IRF Prisoners 2009 2010 2009 2010 Terminations Successful Completions 0 (0.0%) 257 (94.0%) 0 (0.0%) 4 (100.0%) Voluntary Withdrawals 0 (0.0%) 6 (2.2%) 0 (0.0%) 0 (0.0%) Rule Violators 0 (0.0%) 11 (4.0%) 0 (0.0%) 0 (0.0%) Total 0 274 0 4 Unqualified Medical Terminations 0 7 0 2 Unqualified by statute 0 8 0 0 Total Program Exits 0 289 0 6
APPENDIX N