Embed Size (px)
Citation preview

Speaker Bio – Mike Darrish
• Certified Lean Six Sigma Black Belt since March 2008
• Specialty – CPI in large service organizations
• Prior IT career – tech, sales (soft skills)
• Value Proposition– induce people to change without formal authority
1

Non-Partisan Process Improvement
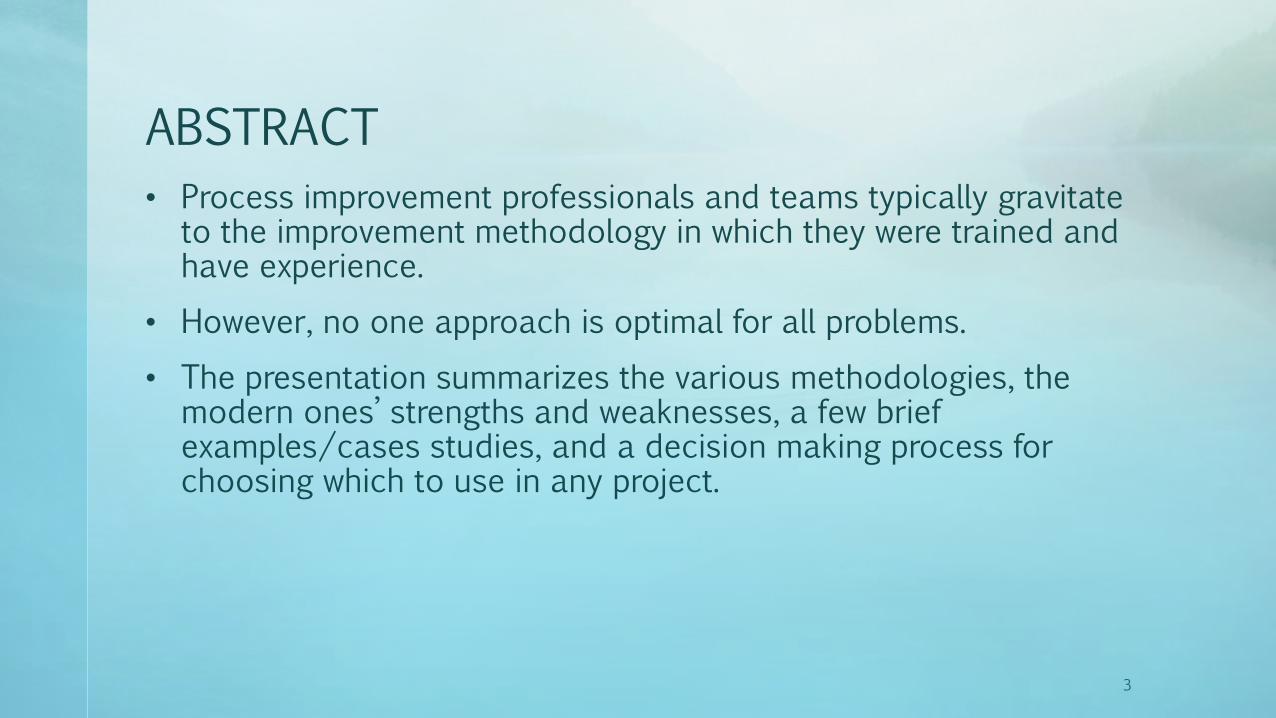
ABSTRACT
• Process improvement professionals and teams typically gravitate to the improvement methodology in which they were trained and have experience.
• However, no one approach is optimal for all problems.
• The presentation summarizes the various methodologies, the modern ones’ strengths and weaknesses, a few brief examples/cases studies, and a decision making process for choosing which to use in any project.
3

What is CPI?
• SEI’s niche: The SEI researches, develops, and transitions integrated measurement and process-based methods to improve the development, acquisition, sustainment, and quality of software in software-reliant systems.
• Business Context– Business activities - many processes, created consciously or not
– Process: Inputs -> transformations -> output
– Output meets requirements (quality) or doesn’t (defective)
– Process has value-added and non-value added (waste) activities
– Goal - produce quality outputs minimizing non-value added activities
– Continuous – multiple projects over years, so long as economical
4

Why do Continuous Process Improvement?
• Increase customer satisfaction– Reliability
– Availability
– Serviceability
• Compete more effectively– Reduce lead time
– Differentiate offerings
– Reduce cost and/or price
• Result – business grows
• Needs strategic focus– Don’t be the low cost buggy whip producer
5

Process Improvement Select Major Milestones
6
1300s Craft Guildspride in work
1800s Industrial Revolution interchangeable parts
1920s SPC/TQM/PDCAmathematical, expand past factory
1900s Scientific Managementstudy, plan, apportion work
1910s Production FlowFord moving assembly line
1950s TPS: mass production reactionidentify, reduce wastes
1940s-50’s Japanese quality surgeDeming, Juran teach Japanese quality
1970s Quality Is Freecustomers demand high quality
1960s Quality Circlesworker/engineer/manager teams
1980s 6variation, defect reduction focus
1980s Leanwaste reduction focus
2000s LSSintegrate Lean and 6
1980s The Goal/TOCsole way to speed up process
1930s TRIZInvention driven improvement
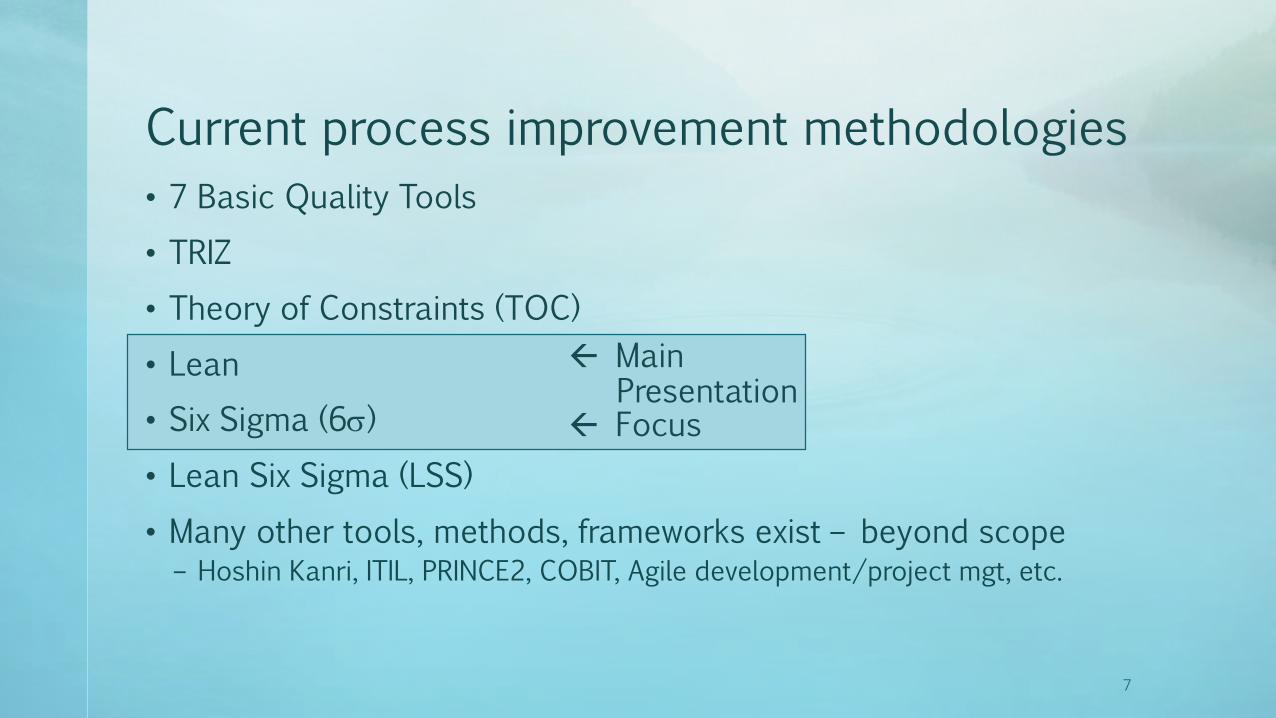
Current process improvement methodologies
• 7 Basic Quality Tools
• TRIZ
• Theory of Constraints (TOC)
• Lean
• Six Sigma (6)
• Lean Six Sigma (LSS)
• Many other tools, methods, frameworks exist – beyond scope– Hoshin Kanri, ITIL, PRINCE2, COBIT, Agile development/project mgt, etc.
Main Presentation
Focus
7
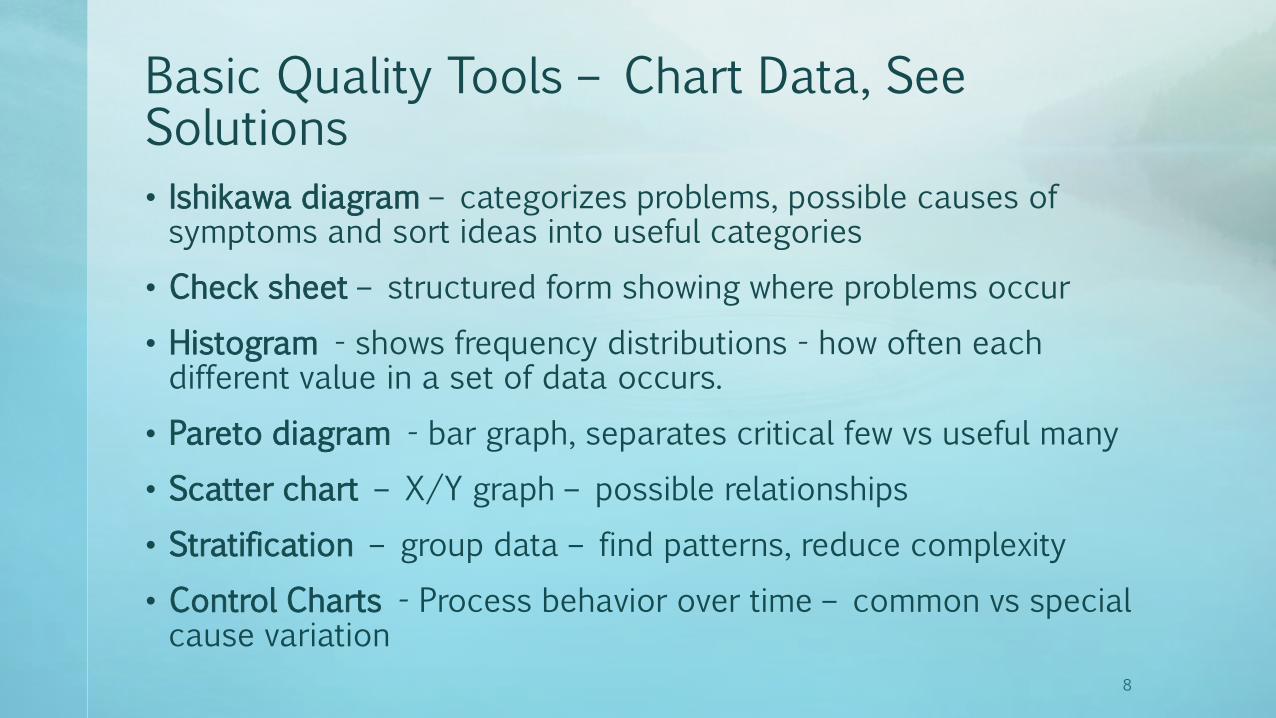
Basic Quality Tools – Chart Data, See Solutions
• Ishikawa diagram – categorizes problems, possible causes of symptoms and sort ideas into useful categories
• Check sheet – structured form showing where problems occur
• Histogram - shows frequency distributions - how often each different value in a set of data occurs.
• Pareto diagram - bar graph, separates critical few vs useful many
• Scatter chart – X/Y graph – possible relationships
• Stratification – group data – find patterns, reduce complexity
• Control Charts - Process behavior over time – common vs special cause variation
8
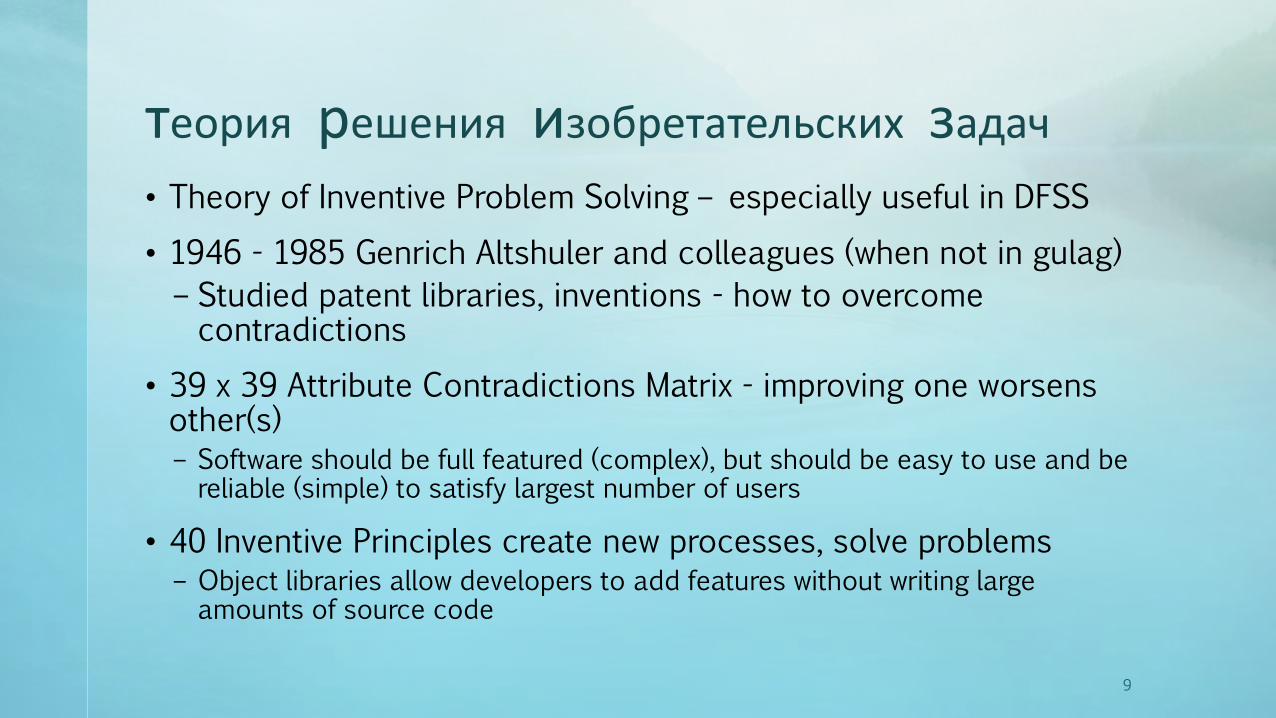
теория решения изобретательских задач• Theory of Inventive Problem Solving – especially useful in DFSS
• 1946 - 1985 Genrich Altshuler and colleagues (when not in gulag)
– Studied patent libraries, inventions - how to overcome contradictions
• 39 x 39 Attribute Contradictions Matrix - improving one worsens other(s) – Software should be full featured (complex), but should be easy to use and be reliable (simple) to satisfy largest number of users
• 40 Inventive Principles create new processes, solve problems– Object libraries allow developers to add features without writing large amounts of source code
9

Interactive Contradiction Matrix
10
Try it at:http://www.triz40.com/TRIZ_GB.php

TRIZ Example Project
• City needs better public transit
• Light rail not feasible
• Must increase bus passenger volume (feature to improve)
• More buses = more drivers, ongoing expense, not feasible
• Bus can navigate city streets (feature to preserve)– Making current bus longer bus not workable
– Wider bus not workable
• Innovate – Build bus with accordion center
11

Theory of Constraints (TOC)
• Speed up any process via relatively simple method, often short projects – 1+ weeks
• 1984, Eliyahu Goldratt, business novel The Goal
• Address constraint (bottleneck) only way to speed up process – Elsewhere: work piles up at constraint or starves downstream workstations
– One or two constraints in any process
– Five focusing steps to address constraint (next slide)
– Cyclical: new constraint appears when previous one addressed
• Drum - buffer - rope model (similar to Lean flow)
• Many additional contributions to solve business problems.
12

Theory of Constraints (TOC)
1Identify
Constraint
2Exploit
Constraint
3 Subordinate Everything
Else
4Elevate
Constraint
5 Repeat, Avoid
Inertia
Five focusing steps
• Identify constraint: slowest process step
• Exploit Constraint: squeeze most out of it as it is (running 100% of time?)
• Subordinate Everything Else: else accumulate useless WIP (inventory)
• Elevate Constraint: Add capacity at that station – buy another machine, run in parallel, hire more workers
• Repeat: New bottleneck will appear, speed it up, don’t stop until reach goal
13

Six Sigma (DMAIC)
• Motorola 1986 Bill Smith, Mikel Harry, Bob Galvin, Richard Schroeder
• Breakthrough results, 4 – 6 month initial wave training with projects, then projects up to 6 months
• Reduce variation, center process output within spec limits, statistically focused, rigorous
• Strengths – Useful for difficult business process problems, mathematically sound if done right, proven in largest organizations
• Weaknesses – human infrastructure - belts/champions, long start up, long term commitment, long projects, difficult to deploy properly, executives have little patience, many failed initiatives
14

Project Charter
Problem Statement:
Business Case:
Goal:
Scope:
Cost/Benefit Estimate:
Milestones:
Measure
Includes project description,
baseline measures, business
results, team members,
schedule.
VOC Key Issue CTQDelighters
More Is Better
Must Be
Gather / display
data verifying
customer needs,
requirements
VOC
OutputsProcess
SIPOC
S
U
P
P
L
I
E
R
S
C
U
S
T
O
M
E
R
S
Inputs
Complete high-level “as is”
process map, analyze yield
to find step with highest
impact
DefineBusiness
Case
Document
project’s value
I P O
Input Measures
Process Measures
Output Measures
Measures
Develop
measures
based on
CTQ’s and
SIPOC map
Funnel
Determine critical
few measures
Gage R&R
Validate
measurement system
Col# 1 2 3 4 5 6
Inspector A B
Sample #1st Trial 2nd Trial Diff 1st Trial 2nd Trial Diff
1 2.0 1.0 1.0 1.5 1.5 0.0
2 2.0 3.0 1.0 2.5 2.5 0.0
3 1.5 1.0 0.5 2.0 1.5 0.5
4 3.0 3.0 0.0 2.0 2.5 0.5
5 2.0 1.5 0.5 1.5 0.5 1.0
Totals 10.5 9.5 3.0 9.5 8.5 2.0
Averages 2.1 1.9 0.6 1.9 1.7 0.4
Sum 4.0 Sum 3.6
XA 2.0 XB 1.8RA
RB
Graph data to show
variation, other patterns
Process
Capability
Calculate current process
capability, sigma
Data Display
0
1000
-1000
10 20 30
UCL
X
LCL
D B F A C E Other
Yield: 60%
Yield: 90%
Yield: 45%
Yield: 98%
Define
Measure
Analyze
Improve
Control
Data Collection Plan
Operational Definition and Procedures
Data Collection PlanWhat questions do you want to answer?
Data
What Measure type/
Data type
How
measured
Related
conditions
Sampling
notes
How/
where
How will you ensure
consistency and stability?
What is your plan for
starting data collection?
How will the data be displayed?
Develop data
collection plan
LSL USL
Cp =0.4
= 2.7
6 Methodology
(DMAIC)
From an original diagram by
I1
I2
I3
I4
O1 O2 O3 O4
FMEA
15
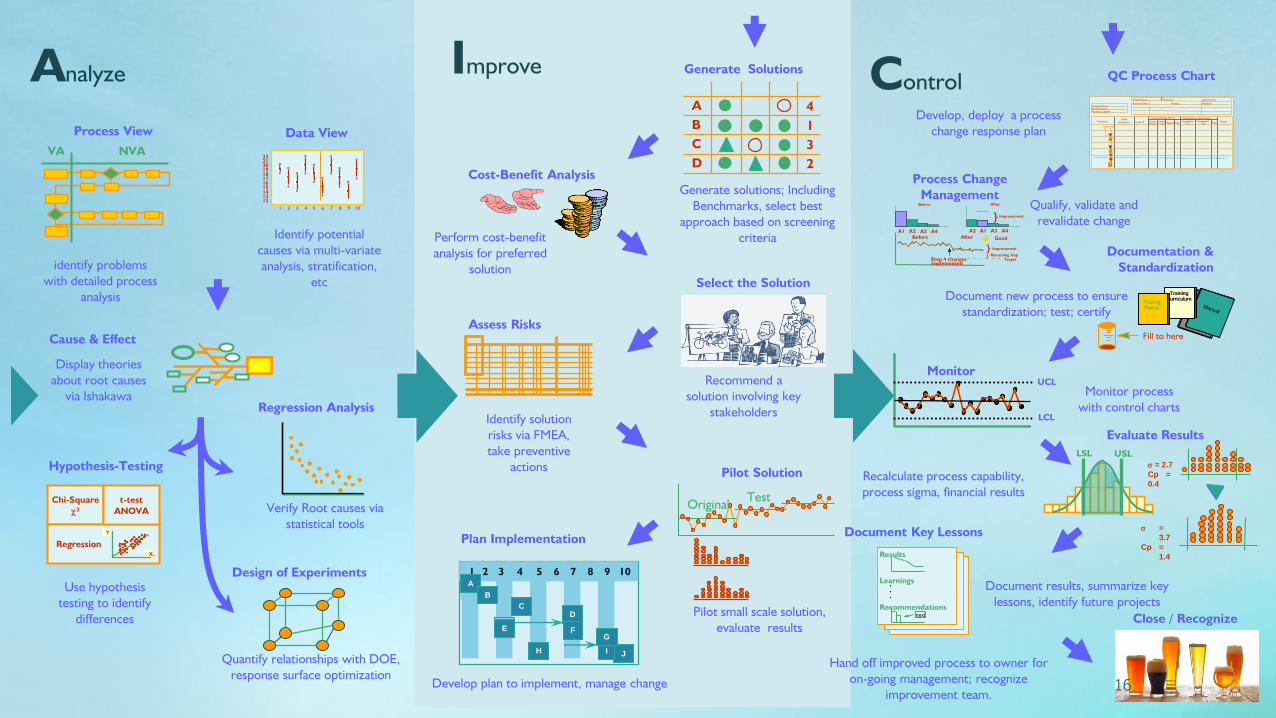
ControlAnalyze
Improve
VA NVA
Process View
identify problems
with detailed process
analysis
Cause & Effect
Display theories
about root causes
via Ishakawa
Regression Analysis
Verify Root causes via
statistical tools
Chi-Square
²
Regression
t-test
ANOVA
X1
Y
Hypothesis-Testing
Use hypothesis
testing to identify
differences
Cost-Benefit Analysis
Perform cost-benefit
analysis for preferred
solution
Generate Solutions
Generate solutions; Including
Benchmarks, select best
approach based on screening
criteria
Design of Experiments
Quantify relationships with DOE,
response surface optimization
Assess Risks
Identify solution
risks via FMEA,
take preventive
actionsPilot Solution
Pilot small scale solution,
evaluate results
Plan Implementation
Develop plan to implement, manage change
=
3.7
Cp =
1.4
Evaluate Results
LSL USL
= 2.7
Cp =
0.4Recalculate process capability,
process sigma, financial results
UCL
LCL
Monitor
Monitor process
with control charts
Develop, deploy a process
change response plan
Work
Instructions
Control/Check Points Response to Abnormality
NotesCode #Charac-
teristics
Control
Limits MethodWhoImmediate
Fix
Permanent
FixWho
Flowchart
2
12
Product Name
Process Name
Process Code #
Date of Issue: Issued by: Approved by:
Revision Date Reason Signature
1
QC Process Chart
Before After
Step 4 changes
implemented
} Improvement
Target
} Remaining Gap
Good
} Improvement
Before After
A1 A2 A3 A4 A2 A1 A3 A4
Process Change
Management
Qualify, validate and
revalidate change
Learnings
Recommendations
Results
•••
next
Document Key Lessons
Document results, summarize key
lessons, identify future projects
Documentation &
Standardization
Document new process to ensure
standardization; test; certify
TrainingCurriculum
Training
Manual
Fill to here
Hand off improved process to owner for
on-going management; recognize
improvement team.
Close / Recognize
Data View
Identify potential
causes via multi-variate
analysis, stratification,
etc
22
21
20
19
18
17
16
15
14
13
12
1 2 3 4 5 6 7 8 9 10
X
O
n
X
O
n
X
O
n
X
O
n
X
O
n
X
O
n
X
O
n
X
O
n
O
n
X
O
n
Select the Solution
Recommend a
solution involving key
stakeholders
Test Original
A
B
C
D
4
1
3
2
2 4 86 10
G
1 3 5 7 9
A
B
CD
FE
JIH
G
16

https://www.youtube.com/watch?v=H4vZN-cMJyY
Six Sigma Career Day
17

Case Study - Six Sigma for Internet Application Development*
• Systemcorp – began as a medical device manufacturer
• Wanted to compete in their segment using the Internet– Application development slow, buggy
– Mapped DMAIC to s/w development model – dev involved from Define phase
• Project Benefits for CTQ KPIs– Reliability 88% Customer complaints 75%
– Cycle time 28% Rework in the virtual environment 82%
• Transformed into project management software company– IBM purchased Systemcorp in 2004
– Intent to integrate capabilities into IBM Rational software unit
18
* http://asq.org/pub/sqp/past/vol4_issue1/sqpv4i1harrington.html - published 2001
6 - Design for Six Sigma (DFSS/DMADV)
• Multiple methodologies – CDOV, IDOV, DDICA, DMEDI, DCCDI
• Create new process, or redesign an existing process, oriented to big breakthrough results, 6+ month projects after 6 training
• Uses different steps than DMAIC, new tools
• Use if existing process cannot be improved enough to meet business goals
19

DFSS versus traditional design - IT• Characteristics
– More up-front work in DFSS
– More time in planning stage
– Project finishes sooner
– Overall, requires less work
– Less rework, dot releases, QA
– Happier, more loyal customers
– Leapfrogs competitors
20
Traditional Design
DFSS Design
LEGEND
Resourc
es R
equired
Time to market
Release Date Release Date
Design Activities Fixes, Redesign Activities
Lean/Lean Thinking
• Oriented to incremental repetitive improvements, 1 – 2 week projects (Kaizen), including training
• MIT worldwide automobile manufacturing study, The Machine That Changed The World, 1990, Womack, Jones, Roos
• Evolved from TPS – Increase value, identify/reduce wastes– Value Added Activity: Customer would pay, moves to end state, right 1st time
• Strengths – Deploys quickly, easier to execute than 6, solves many small problems – benefits begin quickly, add up over time
• Weaknesses – Not as rigorous as 6 - lack of control charts, less effective on more complex process problems,
21

Value, Wastes, Lean Principles*
Mura (Unevenness)
Muri (Overloading)
Muda (Uselessness)
Transportation Waiting
Overproduction Defects
Inventory Motion
Extra Processing (Wasted Talent)
* Lean Enterprise Institute, Taiichi Ohno’s original wastes found in mass production
1Identify Value
2Map Value Stream
3 Create Flow
4Establish
Pull
5 Seek
Perfection
Value Added Activity: Customer would pay, moves toward end state, done right 1st time
Necessary versus Unnecessary Waste
22

Lean Concepts, Tools – manufacturing, (IT)• Standardize Work: one best way
• Takt (T/D) : avg prod time to meet demand (sys response time)
• Single Piece Flow: reduce waiting (near real time vs batch process)
• Pull, Kanban signaling: reduce inventory (optimize sys resources)
• Five Why's: find, fix root cause (solve problem, don’t fix symptoms)
• SMED: Just in time, smaller batches, (VMs – reduce h/w costs, system maint)
• Heijunka/Lvl Workload: reduces all waste forms in spite of mixed demand
• TPM: Optimize overall effectiveness (O/S vs app based memory mgt)
• PDCA: iterative improvement via scientific method (system tuning)
• Gemba: go to the real work place (can’t fix all IT operations from desk in HQ)
• Just In Time: deliver supplies only as needed (allocate h/w only as needed)
23

Lean Concepts, Tools – manufacturing, (IT)• Value Stream, Mapping: eliminate wastes (screens show only info of interest)
• Cellular Workflow : co-locate work (surface level integration)
• Five S: organize facility, workstation (surface level integration)
• Poka Yoke: prevent operator error (only allow valid data entry, step user thru)
• Spaghetti Diagram: identify motion in a diagram (show control, data flow)
• Andon: Visual factory status (visual network, system status)
• Bottleneck Analysis : see TOC
• Hoshin Kanri : Top down goal setting, tasking (separate O/S from apps)
• Jidoka: partial automation, stop on error (more AI over time)
• Kaizen: improvement projects (patches/releases/new systems)
24

Lean Project Example
• Vehicle auction – photo booth process – thousands/week
• Drivers walked to parked cars, drove them to photo booth
• Photographers took photos
• Drivers parked cars wherever they chose – usually minimized walk
• Cars scattered on enormous lot (think regional mall size)
• Can’t find cars to move to next process step – many wastes
• Added Kanban with cones - move cones as lanes empty, fill
• Drive cars from emptying lane, drive cars to adjacent filling lanes
• Reduced labor costs, space, emergency searches25
Lean 6 (LSS) - DMAIC projects + Lean Tools
• Book– Lean Six Sigma: Combining Six Sigma Quality with Lean Production Speed 2002, Michael George, Robert Lawrence, Jr.
• DMAIC project phases, belt roles
• Lean tools to address waste reduction – if in project charter
• Incremental repetitive progress within DMAIC phases– Kaizen events to obtain early wins, buy-in
• Strengths – Combine best of both worlds, more tools, faster than pure DMAIC
• Weaknesses – Still need human infrastructure
26

A Process Improvement Methodology Choice
27
Any business problem
Basic Quality Tools
Process Speed*
Lean
Fast Enough
DMAIC TOCDefectsTeam Knows
Capable
TRIZ
VAConstraint
DMAIC help
DFSS (w, w/o TRIZ)
Marketingprob?
Kano Modeling
Lean ProcSpd
VACon
Proc Spd
* Or general waste reduction; also do Lean when no specific problem exists
Start LeanVA Con
Start
Y
Y
YY
Y
Start
Y
YProblemDefinition
Start
Y
N
N
NN
N
N
N
Capable
Start
Y
N

Questions