Embed Size (px)
Citation preview

ANNUAL REPORT2013 SPC
ISSN 1017-1983


Secretariat of the Pacific CommunityNoumea, New Caledonia, 2014
ANNUAL REPORT
2013
© Copyright Secretariat of the Pacific Community, 2014
All rights for commercial/for profit reproduction or translation, in any form, reserved. SPC authorises the partial reproduction or translation of this material for scientific, educational or research purposes, provided that SPC and the source document are properly acknowledged. Permission to reproduce the document and/or translate in whole, in any form, whether for commercial/for profit or non-profit purposes, must be requested in writing. Original SPC artwork may not be altered or separately published without permission.
Original text: English
Secretariat of the Pacific Community Cataloguing-in-publication data
Annual report 2013 Secretariat of the Pacific Community: (Annual Report of the SPC / Secretariat of the Pacific Community)
ISSN 1017-1983
1. Secretariat of the Pacific Community – Periodicals.
24 kg of landfill
3 kg CO2 and greenhouse gases
666 litres of water
61 kWh of energy
39 kg of wood
By using Cocoon Offset rather than a nonrecycled paper, the environmental impact was reduced by:
Carbon footprint data evaluated by Labelia Conseil in accordance with the Bilan Carbone® methodology.Calculations are based on a comparison between the recycled paper used versus a virgin fibre paper according to the latest European BREF data (virgin fibre paper) available.

Contents
Foreword iAcknowledgements iiEighth SPC Conference and CRGA 43 1SPC staff profile 3Reducing our carbon footprint 3SPC’s work 4Financial statements and audit reports for year ending December 2013 7 Auditor’s report 8 Balance sheet 11 Statement of income and expenditure - Core Funds 12 Statement of cash flows 13Notes to the financial statements 14 Cash on hand and at bank/term deposits 14 Other accounts receivable 14 Creditors, accruals and provisions 14 Other income and transfers 14 Assessed contributions receivable and received in advance 15 Property, plant and equipment 16 Deferred income 17 Reconciliation of net cash 18 Loans 18 General reserve 18 Specific funds 19 Special funds 19 Assessed government contributions 20 Statement of consolidated income and expenditure 21 Summary of movements in extra-budgetary funds 22 Detail of movements in extra-budgetary funds 23 Statement of accounting policies 42Supplementary information 47 Income by source 47 Statistical information 49Provident fund financial statements 51 Auditor’s report 52 Balance sheet 54 Statement of income and expenditure 55 Members’ accounts 56 Statement of accounting policies 57


Foreword
I am pleased as the incoming Director-General in 2014 to present the Secretariat of the Pacific Community’s Annual Report for 2013 comprising a brief overview of the highlights of the year’s activities and the financial statements and audit reports.
This year for the first time SPC is producing a Programme Results Report 2013–2014. This Annual Report should be read in conjunction with the Programme Results Report, which provides a full account of SPC’s work and its contribution to our members’ development priorities in the relevant period.
The 2013 report covers Dr Jimmie Rodgers’ last year as SPC’s Director-General. I wish to pay tribute to Dr Rodgers for his outstanding service to the Pacific Community during his eight years in office. His commitment to the region and dedication to advancing the well-being of Pacific people were acknowledged in the many tributes paid to him by both Pacific and international leaders during the 8th Conference of the Pacific Community.
In relation to the 2013 financial statements and audit report, it is my particular pleasure to underscore that, for the 18th successive year, the independent auditors have provided an unqualified audit opinion on SPC’s accounts.
The sustainable financing of SPC’s work into the future is a major challenge. The process began in 2013 with an increased focus on forming long-term partnerships and obtaining the resources needed to support the advancement of the development agendas of SPC’s member countries and territories and the Pacific region as a whole.
In 2014, SPC strengthened its internal controls and systems, under the auspices of the Audit and Risk Committee, by engaging internal auditors and formally creating an internal audit function for the organisation. The internal audit programme is well underway and its initial findings have been endorsed and acted on by the Audit and Risk Committee and by senior management. Work is also underway to upgrade SPC’s financial software, financial regulations and policies and processes, which will further strengthen financial management. In line with international best practice in financial reporting, SPC has moved, in 2014, to preparing its financial statements according to the International Public Sector Accounting Standards.
I wish to thank SPC’s partners for their continued support. Without these partners and without this support, SPC’s work on behalf of its members and the region would not be possible.
Finally, I would like to thank all SPC staff for their work and their commitment to excellence in delivering development services to the people of the Pacific.
Colin TukuitongaDirector-General
i

ANNUAL REPORT 2013 1
AcknowledgementsSPC is a membership organisation that works in close partnership with its members: American Samoa, Australia, Cook Islands, Federated States of Micronesia, Fiji, France, French Polynesia, Guam, Marshall Islands, Nauru, New Caledonia, Kiribati, New Zealand, Niue, Northern Mariana Islands, Palau, Papua New Guinea, Pitcairn Islands, Samoa, Solomon Islands, Tokelau, Tonga, Tuvalu, United States of America, Vanuatu, and Wallis and Futuna. We thank them for their support.
We would also like to thank our principal donor partners for their generous support of Pacific development outcomes: Asian Development Bank, Australia, Commonwealth Secretariat, European Union, Food and Agriculture Organization of the United Nations, France, Deutsche Gesellschaft für Internationale Zusammenarbeit (GIZ), Global Environment Facility, International Maritime Organization, Korea, New Zealand, Pacific Islands Forum Secretariat, United Nations Children’s Fund (UNICEF), United Nations Development Programme (UNDP), UN WOMEN, United States of America, Western and Central Pacific Fisheries Commission (WCPFC), World Bank.
Secretariat of the Pacific Community | [email protected] | www.spc.int
Headquarters: Noumea, New Caledonia | Suva Regional Office | North Pacific Regional Office | Solomon Islands Country Office
ii

ANNUAL REPORT 2013 1
Eighth SPC Conference and CRGA 43
The Eighth Conference of the Pacific Community took place in Suva, Fiji on 18 and 19 November 2013. The meeting, which was chaired and hosted by Fiji, was preceded by the 43rd meeting of the Committee of Representatives of Governments and Administrations (CRGA 43).
The theme of the Conference was ‘Enhancing sustainable development in Pacific Communities – helping shape the post-2015 agenda’.
Appointment of Dr Colin Tukuitonga as SPC Director-General
The Conference appointed Dr Colin Tukuitonga to the position of Director-General of SPC. The meeting noted that Dr Tukuitonga, who is from Niue, has first-hand appreciation of the development challenges facing the Pacific and more than 27 years’ experience working in a variety of roles, including as a clinician, academic, programme manager and consultant adviser.
Global development agendaThe Conference noted that Samoa would host the Third United Nations Conference on Small Island Developing States in September 2014, giving the Pacific Island region a unique opportunity to influence the global development agenda in 2014. Delegates welcomed SPC’s commitment to assist its island members to engage in shaping the post-2015 development agenda and requested that it take a leadership role in this effort.
SPC MembershipThe Conference approved a resolution extending the territorial scope of the Pacific Community to include Timor Leste to accommodate a probable request for full membership by Timor Leste. Conference also approved in principle the creation of new membership categories such as ‘associate member’ and ‘observer’.
Tribute to Dr Jimmie RodgersDelegates paid tribute to outgoing Director-General, Dr Jimmie Rodgers, for his ‘inspirational leadership of SPC from 2006 to 2013, and his commitment and vision in developing a dynamic and effective organisation that has the development needs of its Pacific Island members and their people at its centre’. Letters commending Dr Rodgers’ service to the region during his eight years as SPC Director-General were received from the Chair of the 8th conference on behalf of all members, from the Prime Minister of Fiji and from the Secretary of State of the United States of America.

ANNUAL REPORT 2013 2
Highlights of divisional workThe Conference noted the following highlights of the work of SPC’s technical divisions in 2013:
■ Applied Geoscience and Technology Division – Support for the development of a joint regional disaster risk management/climate change strategy by 2015; delineation of maritime boundaries for several countries; building of emergency operations centres (for example, in FSM and Solomon Islands); overseeing the construction of a sand and gravel barge for Kiribati; completion of water catchment studies for Samoa; and roll-out of the world’s first template for a legal framework covering deep sea minerals.
■ Economic Development Division – Provision of technical, legal and policy advice on energy issues; implementation of the North-REP project, bringing reliable renewable energy services to thousands of people in more remote areas of Marshall Islands and Federated States of Micronesia; provision of petroleum advisory services to island countries and territories, saving some members millions of dollars in 2013; support for compliance with international maritime obligations and building capacity to meet international transport safety and security requirements.
■ Education, Training and Human Development Division – Support for legislative change addressing gender equality and violence against women; convening of the successful 5th Pacific Women’s Ministerial Meeting and the 12th Triennial Conference of Pacific Women; and the Community Education Training Centre’s (CETC) celebration of its 50th Jubilee in 2013, noting that CETC closed in December 2013 with its programmes transferring to the University of the South Pacific (USP) in January 2014. In this regard, Conference commended the work of CETC over the past 50 years in empowering women in the region and acknowledged the commitment by USP to continued and improved delivery of CETC’s programmes. Conference noted the recommendations of the review of the Secretariat of the Pacific Board for Educational Assessment (SPBEA), acknowledged the importance of expanding the mandate of SPBEA to encompass education quality, and agreed to establish a joint working group of members and the secretariat to further assess the optimum approach and resources required to take the recommendations forward.
■ Fisheries, Aquaculture and Marine Ecosystems Division – Continued provision of scientific services to support the Western and Central Pacific Fisheries Commission; completion of the third and final phase of large-scale tagging operations in PNG waters, with National Fisheries Authority staff taking on increasing
responsibility for the tagging cruises; work with partners in member countries to establish viable new aquaculture enterprises; and roll-out of the findings of the study on the vulnerability of Pacific fisheries to climate change.
■ Land Resources Division – Support for agricultural and forest resource enterprises through the Increasing Agricultural Commodity Trade (IACT) project; biosecurity support through pest and disease surveys and pest management, including of invasive species; training of para-veterinarians to help combat zoonotic diseases; conservation of agrobiodiversity through the Centre for Pacific Crops and Trees; and provision of advice on sustainable forest management.
■ Public Health Division – Support for changes to the governance and leadership of regional health developments in association with the Quintilateral Partners; support for Pacific Island countries and territories (PICTs) to continue to implement non-communicable disease (NCD) plans and strategies; preparation of a submission to the Forum Economic Ministers Meeting (FEMM) on the cost of NCDs in the Pacific region on behalf of the Quintilateral Partners; support for 12 PICTs to implement rapid testing and diagnosis for HIV; and public health surveillance and response preparedness for the 2013 Pacific Mini Games held in Wallis and Futuna.
■ Statistics for Development Division – Support for national counterparts to improve administrative databases and information management systems in economics, education and vital statistics; improvements in data dissemination; updating the National Minimum Development Indicators database, including expanding coverage to French and US territories; and integration of recent census results in various national Population Geographical Information System (PopGIS) systems, giving planners and policy analysts ready access to spatially referenced demographic, economic and social statistics.
■ Operations and Management Directorate – The Conference welcomed the significant steps taken by the Operations and Management Directorate in 2013 to ensure that its services (administration, human resources, finance, ICT, library, publications and translation/interpretation) meet the needs of an expanded organisation, including the appointment of a new Director of Human Resources as recommended by the 2012 independent external review. Recognising the challenges faced by the secretariat in recruitment, and anomalies in the salaries of CROP (Council of Regional Organisations in the Pacific) CEOs, Conference approved the establishment of a CRGA Working Group to look at these issues.

ANNUAL REPORT 2013 3
Reducing our carbon footprintIn late 2012, SPC adopted a target of reducing its greenhouse gas emissions by 30% below its 2011 level by the end of 2016. The emissions reduction programme forms part of SPC’s Climate Change Engagement Strategy, which was adopted by its governing body in November 2011. In its climate change strategy, SPC committed to establish a greenhouse gas emissions inventory and to implement measures to reduce its carbon footprint. The process has involved compiling accurate emissions inventories for all its offices and operations, in compliance with international emission quantification guidelines.
Audit and Risk Committee Report – The Conference noted the report of SPC’s Audit and Risk Committee and its three-year work plan (2013–2015), including the appointment of an international accounting firm to undertake the internal audit work described in the plan.
Financial year 2014 budget – The Conference approved a forward looking budget of 95,357,400 CFP units, comprising a core budget of 26,762,600 CFP units and project funding of 68,594,800 CFP units for financial year 2014, which reflected shifting priorities based on the 2012 independent external review. The secretariat’s proactive approach to building its reserve was also acknowledged.
The annual greenhouse gas monitoring report has revealed that SPC made substantive progress towards achieving this target during the first year of its emissions reduction programme. In total, the organisation’s carbon footprint was reduced by approximately 12% (equivalent to more than 200 tonnes of carbon dioxide per year), even though the organisation has continued to grow in the level of programme activity and number of staff since 2011, the base year against which the organisation is measuring its emission reduction achievements. A significant proportion of these reductions have been achieved through basic housekeeping measures. A range of more substantive emission reduction measures is planned or in the process of implementation and these are expected to deliver additional reductions over the next two years.
SPC staff profileAs of the end of 2013, SPC employed 604 people, of whom 51% were women. Of the total number of staff, 295 (49%) were internationally recruited. In the internationally recruited category, 38% were women and 49% were Pacific Islanders, and in the locally recruited category 63% were women.
Among SPC’s management (bands 13 and above), women made up 23% and Pacific Islanders were 40%.
The Suva Regional Office counted about 360 staff (59%), with about 210 (35%) based at Noumea headquarters, about 20 (4%) at the North Pacific Regional Office in Pohnpei, about 10 (2%) at the Solomon Islands Country Office in Honiara, and a small number of staff based in other locations in the region.
604 295
49%49%
51%
309
51%

ANNUAL REPORT 2013 4
SPC’s workThree development goals guide SPC’s work on behalf of its members:
The Pacific region and its people benefit from inclusive and sustainable economic growth
Pacific communities are empowered and resilient
Pacific Island people reach their potential and live long and healthy lives
SPC works with its members to achieve these goals by providing technical and scientific assistance across a broad range of sectors. The majority of its services are delivered through regional or subregional approaches to enhance their effectiveness and take advantage of economies of scale.
As noted, this Annual Report should be read in conjunction with the SPC Programme Results Report 2013–2014, which presents its work in detail. Below is a summary of some aspects of this work:
Supporting sustainable Pacific fisheriesSPC continues to manage the region’s tuna data holdings. The regional tuna database captures catch data from fishing operations provided on log sheets, observer data, sampling data from when vessels are unloaded, satellite-based vessel monitoring system (VMS) data, and tagging and other biological data. The maintenance of this centralised repository allows SPC to compile data sets for regional stock assessment and other analyses and provide scientific support to the Western and Central Pacific Fisheries Commission (WCPFC), the Forum Fisheries Agency (FFA) and subregional fisheries management arrangements.
Improved law for regulation and management of deep sea minerals (DSM) The development and enforcement of national DSM policy, law and regulations is vital to enable Pacific Island nations to regulate DSM activities within their respective jurisdictions, as well as in the international seabed area. SPC, working with members, has developed a DSM policy guide and ‘model law’ template that have been adopted across the Pacific. SPC is also working on drafting seabed minerals bills and regulations with several countries and reviewing draft versions of environmental permit regulations.

ANNUAL REPORT 2013 5
Resilience to climate change and disastersThe Pacific region is exceptionally vulnerable to climate change and disaster risks. SPC worked with Pacific Island governments, civil society organisations and community-based organisations to empower and build the resilience of vulnerable communities, including through: enhanced understanding of human rights standards; improved regional planning and coordination of climate change and disaster risk management across the Pacific; applied science for mitigating the impact of climate change and disasters; and improved food security and livelihoods in the face of climate change and disaster risk.
Improved crop diversityTo support food and nutrition security, SPC worked with eight Pacific countries that are non-contracting parties to the International Treaty on Plant Genetic Resources for Food and Agriculture established by the Food and Agriculture Organization of the United Nations (FAO). Assistance was provided to countries on their cabinet submissions for ratification and accession to the treaty. Through the multilateral system of the treaty, countries will be able to access diverse resilient crop varieties important for sustainable food security.
taro or tissue culture
Supporting energy infrastructure and analysisA key challenge in the energy sector is the region’s heavy reliance on fossil fuels, with resulting economic and environmental effects. To assist countries in addressing their energy needs, SPC’s energy programme focuses on delivering the following regional services: coordination of the implementation of the Framework for Action on Energy Security in the Pacific; provision of technical, legal and policy advice on energy issues; improvement of energy efficiency; development and synchronisation of standards across the region; provision of petroleum advisory services; capacity building in countries and provision of energy statistics, information and networking; monitoring and evaluation; and applied research.
Support for Pacific transportationPacific Islands Forum Leaders called for improved coordination and delivery of safe, secure and competitive regional transport services. In response, Pacific Island governments and their partners developed the regional Framework for Action on Transport Services. Coordinated by SPC, the framework provides guidance to enhance national efforts and achieve safe, reliable and affordable transport services. SPC’s Transport Programme has focused on addressing maritime transport challenges and meeting international standards and requirements. SPC is the only regional agency dealing with maritime matters in the Pacific region.

ANNUAL REPORT 2013 6
Empowerment of womenGender equality has long been acknowledged as a critical condition for achieving development goals. Laws, policies and practices that discriminate against women still exist and norms and values determine and effectively limit the role, place and behaviour of women in the home, community and society. Beginning in June 2013, with the assistance of the Australian Aid Programme, SPC conducted gender mainstreaming capacity stocktakes in eight countries.The information gathered outlines country context as well as priorities and needs, and provides a baseline on which to design and deliver interventions to mainstream gender across government policies, plans and programmes.
Improved access to national and regional dataAs requested by Pacific Leaders, SPC developed the Pacific’s regional statistics database: the National Minimum Development Indicator (NMDI) database. This database provides users with easy access to statistics and indicators across major sectors. It contains over 200 indicators which provide an accurate and comprehensive snapshot of the state of development or ‘health’ of specific sectors of each country. It also provides information on: national economies and labour markets in the region; the health and overall well-being of Pacific Island people; and agriculture and fisheries.
Improving education qualitySPC contributes to developing quality standards across the Pacific with a view to raising educational standards and helping students progress onto higher education or compete for jobs. Two key results include: a) the development of a register of qualifications and standards in the Pacific to facilitate benchmarking and labour mobility; and b) the nationalisation of the Form 6 Pacific Senior Secondary Certificate.
classroom or teacher
Multi-sector approach to prevention of non-communicable diseasesIn 2013, SPC, in collaboration with the Quintilateral Partners in Health (Australia, New Zealand, SPC, World Bank and WHO) developed the NCD Roadmap Report. This report outlines a multi-sector country and regional response to the NCD crisis in the Pacific. It sets out four key strategies: tobacco control; regulation of food and drink products; improved efficiency of current health spending by reallocating existing health resources to targeted primary and secondary prevention; and strengthened research and evidence for better planning. SPC is supporting the development and implementation of these strategies.
FINANCIAL STATEMENTS AND AUDIT REPORTS FOR YEAR ENDING DECEMBER 2013

ANNUAL REPORT 2013 7
FINANCIAL STATEMENTS AND AUDIT REPORTS FOR YEAR ENDING DECEMBER 2013

ANNUAL REPORT 2013 8

ANNUAL REPORT 2013 9

ANNUAL REPORT 2013 10

ANNUAL REPORT 2013 11
ASSETS Note 2013 CFP units
2012 CFP units
CURRENT ASSETS
Cash at bank and on hand 1 46,778,835 43,016,588
Term deposits 1 12,731,978 15,675,819
Assessed contributions receivable 5 585,087 775,389
Extra-budgetary funds receivable 15 4,020,667 13,786,277
Other receivables 2 5,635,732 5,848,949
Inventories 511,004 418,310
70,263,303 79,521,332
PROPERTY, PLANT AND EQUIPMENT
Property, plant and equipment - cost 6 53,361,576 52,265,793
Less accumulated depreciation 6 21,204,842 20,699,106
32,156,734 31,566,687
TOTAL ASSETS 102,420,037 111,088,019
LIABILITIES
CURRENT LIABILITIES
Creditors, accruals and provisions 3 11,564,896 14,207,183
Assessed contributions in advance 5 34,840 19,737
Extra-budgetary funds unexpended 15 53,570,173 59,183,820
Loans 9 291,045 662,421
65,460,954 74,073,161
NON-CURRENT LIABILITIES
Deferred income 7 27,441,110 28,006,631
Loan 9 4,424,779 2,897,837
31,865,889 30,904,468
TOTAL LIABILITIES 97,326,843 104,977,629
NET ASSETS 5,093,194 6,110,390
REPRESENTED BY:
General reserve 10 3,614,497 3,695,753
Specific funds 11 1,030,643 2,064,759
Special funds 12 448,054 349,878
TOTAL RESERVES 5,093,194 6,110,390
The accompanying Notes and Statement of Accounting Policies form an integral part of these financial statements.
For the Secretariat of the Pacific Community
Dr Colin Tukuitonga John Yee Chief DIRECTOR-GENERAL ACTING DIRECTOR FINANCE
BALANCE SHEET AS AT 31 DECEMBER 2013

ANNUAL REPORT 2013 12
Note 2013
CFP units
2013 Revised Budget
CFP units
2013 Variation CFP units
2012 CFP units
INCOME & TRANSFERS
Assessed contributions & host grants 13 10,693,900 10,693,900 - 9,481,332
Voluntary contributions member countries 10,613,900 10,693,920 (80,020) -
Other income & transfers 4 3,822,019 4,452,780 (630,761) 6,165,337
TOTAL INCOME & TRANSFERS 25,129,819 25,840,600 (710,781) 15,646,669
EXPENDITURE
Administration:
Office of the Director General 2,455,500 2,545,400 (89,900) 1,995,913
Operations and Management 10,729,357 10,731,200 (1,843) 8,606,657
TOTAL ADMINISTRATION 13,184,857 13,276,600 (91,743) 10,602,570
Programmes:
Applied Geoscience & Technology 2,013,500 2,263,700 (250,200) 345,099
Economic Development 536,500 567,000 (30,500) 131,803
Education, Training & Human Development (ETHD) 2,501,400 2,607,600 (106,200) 1,908,588
Fisheries, Aquaculture & Marine Ecosystems (FAME) 2,911,100 2,921,300 (10,200) 614,300
Land Resources 1,642,000 1,733,700 (91,700) 212,511
Public Health 1,226,100 1,340,600 (114,500) 411,434
Statistics for Development 1,063,100 1,130,100 (67,000) 200,500
TOTAL PROGRAMMES 11,893,700 12,564,000 (670,300) 3,824,235
Other 946 - 946 (28,835)
TOTAL EXPENDITURE BEFORE ADJUSTMENTS & DEPRECIATION 25,079,503 25,840,600 (761,097) 14,397,970
SURPLUS / (DEFICIT) FOR THE YEAR 50,316 - 50,316 1,248,699
Less - depreciation (1,845,704) (1,976,088)
Add - transfer from deferred income 1,845,704 1,976,088
Less - income transferred to deferred income (2,823,894) (1,745,328)
Add - expenditure transferred to capital expenditure 2,823,894 1,745,328
Less balance b/f general reserve exchange adjustment (131,572) -
Add balance b/f general reserve 3,695,753 3,186,925
TOTAL GENERAL RESERVE 3,614,497 4,435,624
Less - funds approved to specific funds - (739,871)
TOTAL GENERAL RESERVE TRANSFERRED TO BALANCE SHEET 3,614,497 3,695,753
Statement of income and expenditure - core funds for the year ended 31 December 2013

ANNUAL REPORT 2013 13
Note 2013 CFP units
2012 CFP units
CASH FLOWS FROM OPERATING ACTIVITIES
INFLOWS:
Member government contributions 71,172,120 66,349,236
Non-member contributions 51,012,811 27,062,691
Rentals from housing 2,180,841 2,111,749
Canteen sales 776,648 815,489
Interest 481,100 419,215
Other - 112,976
125,623,520 96,871,356
OUTFLOWS:
Salaries and related costs (31,869,135) (29,598,900)
Other operating expenses (87,252,772) (44,772,651)
Housing expenses (2,055,257) (2,037,831)
Canteen purchases (804,056) (796,864)
(121,981,220) (77,206,246)
NET CASH FLOWS PROVIDED BY OPERATING ACTIVITIES 8 3,642,300 19,665,110
CASH FLOWS FROM INVESTING ACTIVITIES
INFLOWS:
Proceeds from sale of property, plant & equipment - -
OUTFLOWS:
Purchase of property, plant and equipment (2,823,894) (1,745,328)
NET CASH FLOWS PROVIDED BY INVESTING ACTIVITIES (2,823,894) (1,745,328)
Net increase in cash held 818,406 17,919,782
Cash at the beginning of the year 58,692,407 40,772,625
CASH AT THE END OF THE YEAR 1 59,510,813 58,692,407
Statement of cash flows for the year ended 31 December 2013

ANNUAL REPORT 2013 ANNUAL REPORT 2013 14
Notes to the financial statements
1. CASH ON HAND AND AT BANK / TERM DEPOSITS2013 2012
CFP units CFP units
Cash - local currency 18,297,726 21,437,911
Cash - foreign currency 28,481,109 21,578,677
46,778,835 43,016,588
Term deposits - local currency 2,500,000 3,896,585
Term deposits - foreign currency 10,231,978 11,779,234
12,731,978 15,675,819
2. OTHER ACCOUNTS RECEIVABLE2013 2012
CFP units CFP units
Canteen 61,730 75,222
Staff - 89,151
Deposits 98,967 106,369
School debtors 78,258 104,659
Project and other debtors 5,396,777 5,473,548
5,635,732 5,848,949
3. CREDITORS, ACCRUALS AND PROVISIONS2013 2012
CFP units CFP units
Trade creditors and accruals 3,442,069 5,939,575
Staff 153,015 -
Provision for employees’ contractual entitlements (core) 2,054,892 1,444,792
Provision for employees’ contractual entitlements (non-core) 3,188,134 3,309,023
Project and other creditors 2,726,786 3,513,793
11,564,896 14,207,183
4. OTHER INCOME AND TRANSFERS2013 2012
CFP units CFP units
Bank interest 481,100 595,492
Programme management fees 3,265,200 3,786,297
Canteen rental 25,000 25,000
Student fee income 390,400 847,812
Miscellaneous (339,681) 910,736
3,822,019 6,165,337

ANNUAL REPORT 2013 15ANNUAL REPORT 2013
5. ASSESSED CONTRIBUTIONS RECEIVABLE AND RECEIVED IN ADVANCE
MEMBER COUNTRIES1997 to 2009
CFP units2010
CFP units2011
CFP units2012
CFP units2013
CFP units
2013 Arrears/
receivables CFP units
2013 (Received
in advance) CFP units
2012 Arrears/
receivables CFP units
2012 (Received in
advance) CFP units
American Samoa - - - - 21,659 21,659 - - (2,863)
Federated States of Micronesia - - - - (17,458) - (17,458) - (1,714)
Fiji - - - - (17,362) - (17,362) - -
Guam - - - - 34,851 34,851 - 65,783 -
Kiribati - - - - (20) - (20) 2,013 -
Marshall Islands - - - - 373 373 - - (7,671)
Nauru 68,475 22,131 22,131 54,931 55,999 223,667 - 221,730 -
Niue - - - - - - - - (6,600)
Northern Mariana Islands 234,067 31,737 31,737 31,737 58,600 387,878 - 329,278 -
Palau 81,435 27,145 33,745 33,745 52,000 228,070 - 176,070 -
Papua New Guinea - - - - 3,585 3,585 - 280,345 -
Solomon Islands - - - - - - - 18,735 -
Tokelau - - - - - - - - (889)
Vanuatu - - - - 85,004 85,004 - 81,435 -
383,977 81,013 87,613 120,413 277,231 985,087 (34,840) 1,175,389 (19,737)
Allowance for doubtful debts (400,000) (400,000)
TOTALS 383,977 81,013 87,613 120,413 277,231 585,087 (34,840) 775,389 (19,737)
Notes to the financial statements

ANNUAL REPORT 2013 16
6. P
RO
PERT
Y, P
LAN
T &
EQU
IPM
ENT
DES
CR
IPTI
ON
LAN
DBU
ILD
ING
STO
TAL
PRO
PERT
YG
ENER
AL
EQU
IPM
ENT
CO
MPU
TER
EQ
UIP
MEN
TFU
RN
ITU
RE
HO
USI
NG
MO
TOR
VE
HIC
LES
INTA
NG
IBLE
STO
TAL
CFP
U
NIT
S
CO
ST O
R V
ALU
ATIO
N
At 3
1 D
ecem
ber
2012
6,42
9,70
228
,974
,674
35,4
04,3
764,
800,
769
8,21
0,15
41,
587,
798
325,
341
1,43
3,49
750
3,85
852
,265
,793
Exch
ange
adj
ustm
ent S
uva
- (2
30,4
58)
(230
,458
)(2
33,5
13)
(348
,526
)(4
9,67
2)(9
,894
)(1
00,5
12)
(44,
307)
(1,0
16,8
82)
Add
addi
tions
377,
475
884,
734
1,26
2,20
952
7,67
974
3,89
860
,558
14,4
4019
9,11
315
,997
2,82
3,89
4
Adju
stm
ents
- (3
,283
)(3
,283
)(1
,514
)1,
017
- -
497
- (3
,283
)
Less
dis
posa
ls -
- -
(167
,486
)(4
41,1
27)
(17,
071)
(8,7
09)
(73,
553)
- (7
07,9
46)
AT 3
1 D
ECEM
BER
2013
6,80
7,17
729
,625
,667
36,4
32,8
444,
925,
935
8,16
5,41
61,
581,
613
321,
178
1,45
9,04
247
5,54
853
,361
,576
DEP
REC
IATI
ON
At 3
1 D
ecem
ber
2012
- (6
,814
,360
)(6
,814
,360
)(3
,821
,171
)(7
,063
,468
)(1
,385
,627
)(2
73,2
96)
(1,0
08,5
64)
(332
,620
)(2
0,69
9,10
6)
Exch
ange
adj
ustm
ents
Suv
a -
54,2
2954
,229
153,
984
296,
106
33,0
746,
226
69,6
4329
,249
642,
511
Add
depr
ecia
tion
- (4
70,0
32)
(470
,032
)(3
17,9
88)
(762
,718
)(8
6,88
2)(2
1,98
5)(1
19,8
14)
(66,
285)
(1,8
45,7
04)
Adju
stm
ents
- -
- -
(127
)64
- -
63 -
Less
dep
reci
atio
n on
dis
posa
ls -
- -
166,
185
432,
025
17,0
718,
623
73,5
53 -
697,
457
AT 3
1 D
ECEM
BER
2013
-(7
,230
,163
)(7
,230
,163
)(3
,818
,990
)(7
,098
,182
)(1
,422
,300
)(2
80,4
32)
(985
,182
)(3
69,5
93)
(21,
204,
842)
WR
ITTE
N D
OW
N V
ALU
E
AT 3
1 D
ECEM
BER
2013
6,80
7,17
722
,395
,504
29,2
02,6
811,
106,
945
1,06
7,23
415
9,31
340
,746
473,
860
105,
955
32,1
56,7
34
WR
ITTE
N D
OW
N V
ALU
E
AT 3
1 D
ECEM
BER
2012
6,42
9,70
222
,160
,314
28,5
90,0
1697
9,59
81,
146,
686
202,
171
52,0
4542
4,93
317
1,23
831
,566
,687
Notes to the financial statements

ANNUAL REPORT 2013 17
7. D
EFER
RED
INC
OM
E
DES
CR
IPTI
ON
31.1
2.12
C
FP U
NIT
SEX
CH
ANG
E AD
JUST
MEN
TSAD
JUST
ED
BALA
NC
E20
13
GR
ANTS
2013
W
RIT
EBAC
K31
.12.
13
CFP
UN
ITS
Prop
erty
25,
029,
965
(176
,229
) 2
4,85
3,73
6 10
3,36
0 (4
70,0
32)
24,
487,
064
Gen
eral
equ
ipm
ent
989
,054
(7
9,52
9)90
9,52
5 35
8,67
9 (1
51,8
03)
1,1
16,4
01
Com
pute
r equ
ipm
ent
1,1
37,2
29
(52,
420)
1,08
4,80
9 30
3,78
8 (3
30,8
20)
1,0
57,7
77
Furn
iture
202
,170
(1
6,59
8)18
5,57
2 43
,487
(6
9,74
7) 1
59,3
11
Hou
sing
52,
043
(3,6
68)
48,3
75
5,73
1 (1
3,36
2) 4
0,74
4
Mot
or v
ehic
les
424
,932
(3
0,86
9)39
4,06
3 12
6,05
7 (4
6,26
1) 4
73,8
58
Inta
ngib
les
171
,238
(1
5,05
8) 1
56,1
80
15,9
97 (6
6,22
2) 1
05,9
55
28,0
06,6
31
(374
,371
)27
,632
,260
95
7,09
9 (1
,148
,247
)27
,441
,110
GR
ANTS
FO
R T
HE
YEAR
& F
UN
DED
BY:
957,
099
Ad
ditio
ns (N
ote
6)2,
823,
894
Lo
ans
(Not
e 9)
(1,1
55,5
66)
Ad
just
men
ts (3
,283
)
D
ispo
sals
(707
,946
)
957,
099
WR
ITEB
ACK
FOR
TH
E YE
AR:
(1,1
48,2
47)
F
und
depr
ecia
tion
char
ge (N
ote
6) (1
,845
,704
)
D
ispo
sal o
f fixe
d as
sets
697
,457
(1,1
48,2
47)
Notes to the financial statements

ANNUAL REPORT 2013 18
8. RECONCILIATION OF NET CASH PROVIDED BY OPERATING ACTIVITIES TO OPERATING SURPLUS
2013 CFP units
2012 CFP units
Surplus/(deficit) general funds (81,256) 508,828
Surplus/(deficit) special funds 98,176 92,543
Transfer to/(from) specific funds (1,034,116) 1,358,584
OPERATING SURPLUS (1,017,196) 1,959,955
Depreciation 1,845,704 1,976,088
Loss (gain) on disposal of property, plant & equipment 13,772 1,855
(Increase)/decrease in accounts receivable 213,217 1,913,321
(Increase)/decrease in inventories (92,694) (57,498)
Increase/(decrease) in extra-budgetary funds unexpended 4,151,963 12,893,637
Increase/(decrease) in assessed contributions in advance 205,405 89,953
Increase/(decrease) in creditors & accruals (2,642,287) 1,120,414
Increase/(decrease) in deferred revenue (565,521) 473,517
Increase/(decrease) in loans 1,155,566 (739,493)
Exchange adjustment 374,371 33,361
NET CASH PROVIDED BY OPERATING ACTIVITIES 3,642,300 19,665,110
9. LOANS
2013 CFP units
2012 CFP units
MOVEMENT IN THE LOANS
Opening balance as at 1 January 3,560,258 4,299,751
Add new loans 1,865,750 -
Less capital repayment of loans (710,184) (739,493)
BALANCE AS AT 31 DECEMBER 4,715,824 3,560,258
CLASSIFIED AS:
Current 291,045 662,421
Non-current 4,424,779 2,897,837
4,715,824 3,560,258
10. GENERAL RESERVE
2013 CFP units
2012 CFP units
MOVEMENTS IN THE GENERAL RESERVE
Opening balance as at 1 January 3,695,753 3,186,925
Surplus / (deficit) arising during the year 50,316 1,219,413
Suva exchange adjustment (131,572) 29,286
Transfer to specific funds - (739,871)
BALANCE AS AT 31 DECEMBER 3,614,497 3,695,753
Notes to the financial statements

ANNUAL REPORT 2013 19
11. SPECIFIC FUNDS
DESCRIPTION 31.12.12 EXCHANGEADJUSTMENT
INCOME/TRANSFERS IN
APPLIED/TRANSFERS OUT 31.12.13
Emergency evacuation reserve 30,000 - - - 30,000
Plant & equipment replacement fund 400,000 (11,140) - - 388,860
Minor works fund 200,000 - - - 200,000
Foreign exchange fluctuation reserve 1,434,758 (4,403) - (1,018,572) 411,783
2,064,758 (15,543) - (1,018,572) 1,030,643
TRANSFERRED & (APPLIED) (1,018,572)
Transfer from core funds -
Applied (1,018,572)
TOTAL (1,018,572)
12. SPECIAL FUNDS
DESCRIPTION 31.12.12 INCOME/TRANSFERS IN
APPLIED/TRANSFERS OUT 31.12.13
Housing 232,058 2,164,048 (2,038,464) 357,642
Canteen 117,819 776,649 (804,056) 90,412
349,877 2,940,697 (2,842,520) 448,054
TRANSFERRED & APPLIED 98,177
Housing rental income 2,178,226
Housing other income 2,616
Canteen income 776,648
Applied - capital repayment of loan (710,185)
- interest repayment of loan (101,183)
- housing operating costs (1,243,889)
- canteen trading & operating costs (804,056)
TOTAL 98,177
Notes to the financial statements

ANNUAL REPORT 2013 20
13. ASSESSED GOVERNMENT CONTRIBUTIONS
2013CFP units
2012CFP units
American Samoa 58,600 31,737
Australia 3,178,335 3,178,335
Cook Islands 52,000 33,745
Federated States of Micronesia 69,000 47,537
Fiji 186,989 140,842
France 2,300,000 1,620,920
French Polynesia 131,000 85,254
Guam 69,000 47,537
Kiribati 69,000 51,045
Marshall Islands 52,000 33,745
Nauru 56,000 41,831
New Caledonia 185,464 139,721
New Zealand 2,044,447 2,044,447
Niue 43,000 28,731
Northern Mariana Islands 58,600 31,737
Palau 52,000 33,745
Papua New Guinea 131,000 85,254
Pitcairn Islands 43,600 22,131
Samoa 85,000 66,545
Solomon Islands 85,000 66,545
Tokelau 56,600 35,231
Tonga 85,000 66,545
Tuvalu 56,000 41,831
United States of America 1,417,665 1,417,665
Vanuatu 85,000 66,545
Wallis and Futuna 43,600 22,131
10,693,900 9,481,332
Notes to the financial statements

ANNUAL REPORT 2013 21
14.
STAT
EMEN
T O
F C
ON
SOLI
DAT
ED IN
CO
ME
AND
EXP
END
ITU
RE
FOR
TH
E YE
AR E
ND
ED 3
1 D
ECEM
BER
201
3
2013
CO
REFU
ND
S
2012
CO
REFU
ND
S
2013
EXTR
A-BU
DG
ETAR
Y
2012
EXTR
A-BU
DG
ETAR
Y
2013
SPEC
IFIC
FUN
DS
2012
SPEC
IFIC
FUN
DS
2013
SPEC
IAL
FUN
DS
2012
SPEC
IAL
FUN
DS
2013
TOTA
L FU
ND
S
2012
TOTA
L FU
ND
S
Inco
me
M
embe
r cou
ntrie
s co
ntrib
utio
ns 2
1,30
7,80
0 9
,821
,332
2
9,01
4,65
0 3
7,70
5,19
7 -
- -
- 5
0,32
2,45
0 4
7,52
6,52
9 N
on-m
embe
rs c
ontri
butio
ns -
- 5
1,01
2,36
4 5
6,48
3,85
1 -
- -
- 5
1,01
2,36
4 5
6,48
3,85
1 Sa
les
- can
teen
- -
- -
- -
776
,649
8
15,4
89
776
,649
8
15,4
89
Rent
al -
hous
ing
- -
- -
- -
2,1
64,0
48
2,1
11,7
49
2,1
64,0
48
2,1
11,7
49
Prog
ram
me
man
agem
ent f
ees
3,2
65,2
00
3,7
86,2
97
- -
- -
- -
3,2
65,2
00
3,7
86,2
97
Oth
er 5
56,8
19
2,0
39,0
40
- -
- 1
,359
,302
-
- 5
56,8
19
3,3
98,3
42
TOTA
L IN
CO
ME
25,
129,
819
15,
646,
669
80,
027,
014
94,
189,
048
- 1
,359
,302
2
,940
,697
2
,927
,238
1
08,0
97,5
30
114
,122
,257
Ex
pend
iture
Adm
inis
tratio
n
O
ffice
of t
he D
irect
or-G
ener
al (2
,455
,500
) (1
,995
,913
) (4
,828
,968
) (3
,677
,823
) -
- -
- (7
,284
,468
) (5
,673
,736
)O
pera
tions
and
Man
agem
ent
(10,
729,
357)
(8,6
06,6
57)
(2,7
84,9
38)
(9,4
86,3
65)
(13,
514,
295)
(18,
093,
022)
Tota
l - A
dmin
istra
tion
(13,
184,
857)
(10,
602,
570)
(7,6
13,9
06)
(13,
164,
188)
- -
- -
(20,
798,
763)
(23,
766,
758)
Prog
ram
mes
Appl
ied
Geo
scie
nce
& Te
chno
logy
(2,0
13,5
00)
(345
,099
) (1
0,16
6,31
9) (1
3,73
3,87
1) -
- -
- (1
2,17
9,81
9) (1
4,07
8,97
0)Ec
onom
ic D
evel
opm
ent
(536
,500
) (1
31,8
03)
(7,4
36,4
65)
(6,1
36,6
09)
- -
- -
(7,9
72,9
65)
(6,2
68,4
12)
Educ
atio
n, T
rain
ing
& H
uman
Dev
elop
men
t (2
,501
,400
) (1
,908
,588
) (5
,276
,484
) (5
,295
,021
) -
- -
- (7
,777
,884
) (7
,203
,609
)Fi
sher
ies,
Aqu
acul
ture
& M
arin
e Ec
osys
tem
s (2
,911
,100
) (6
14,3
00)
(10,
970,
260)
(12,
328,
657)
- -
- -
(13,
881,
360)
(12,
942,
957)
Land
Res
ourc
es (1
,642
,000
) (2
12,5
11)
(7,5
12,1
78)
(7,3
79,3
58)
- -
- -
(9,1
54,1
78)
(7,5
91,8
69)
Publ
ic H
ealth
(1,2
26,1
00)
(411
,434
) (2
2,27
1,05
2) (1
9,44
7,15
1) -
- -
- (2
3,49
7,15
2) (1
9,85
8,58
5)St
atis
tics
for D
evel
opm
ent
(1,0
63,1
00)
(200
,500
) (2
,589
,184
) (3
,653
,098
) -
- -
- (3
,652
,284
) (3
,853
,598
)To
tal -
Pro
gram
mes
(11,
893,
700)
(3,8
24,2
35)
(66,
221,
942)
(67,
973,
765)
- -
- -
(78,
115,
642)
(71,
798,
000)
Oth
er
(946
) (4
51)
- -
- -
(2,8
42,5
20)
(2,8
34,6
95)
(2,8
43,4
66)
(2,8
35,1
46)
TOTA
L EX
PEN
DIT
UR
E (2
5,07
9,50
3) (1
4,42
7,25
6) (7
3,83
5,84
8) (8
1,13
7,95
3) -
- (2
,842
,520
) (2
,834
,695
) (1
01,7
57,8
71)
(98,
399,
904)
Net
sur
plus
/ (d
efici
t) fo
r the
yea
r 5
0,31
6 1
,219
,413
6
,191
,166
1
3,05
1,09
5 -
1,3
59,3
02
98,
177
92,
543
6,3
39,6
59
15,
722,
353
Add
brou
ght f
orw
ard
bala
nces
3,6
95,7
53
3,1
86,9
25
45,
392,
543
32,
498,
906
2,0
64,7
58
706
,174
34
9,87
7 2
57,3
34
51,
502,
932
36,
649,
339
Suva
exc
hang
e ad
just
men
t (1
31,5
72)
29,
286
(2,0
39,2
07)
(157
,458
) (1
5,54
3) (7
18)
- -
(2,1
86,3
22)
(128
,890
)
3,6
14,4
97
4,4
35,6
24
49,
544,
502
45,
392,
543
2,0
49,2
15
2,0
64,7
58
448
,054
3
49,8
77
55,
656,
269
52,
242,
802
Tran
sfer
s (to
) / fr
om:
Min
or w
orks
- (1
52,3
08)
- -
- -
- -
- (1
52,3
08)
Plan
t & e
quip
men
t -
(92,
563)
- -
- -
- -
- (9
2,56
3)Ex
chan
ge fl
unct
uatio
n -
(495
,000
) -
- -
- -
- -
(495
,000
)Su
ppor
t to
prog
ram
me
activ
ities
- -
- -
(1,0
18,5
72)
- -
- (1
,018
,572
) -
CLO
SIN
G B
ALAN
CES
3,6
14,4
97
3,6
95,7
53
49,
544,
502
45,
392,
543
1,0
30,6
43
2,0
64,7
58
448
,054
3
49,8
77
54,
637,
696
51,
502,
931
N
ote
10
Not
e 10
N
ote
15
N
ote
15
Not
e 11
N
ote
11
Not
e 12
N
ote
12
Notes to the financial statements

ANNUAL REPORT 2013 22
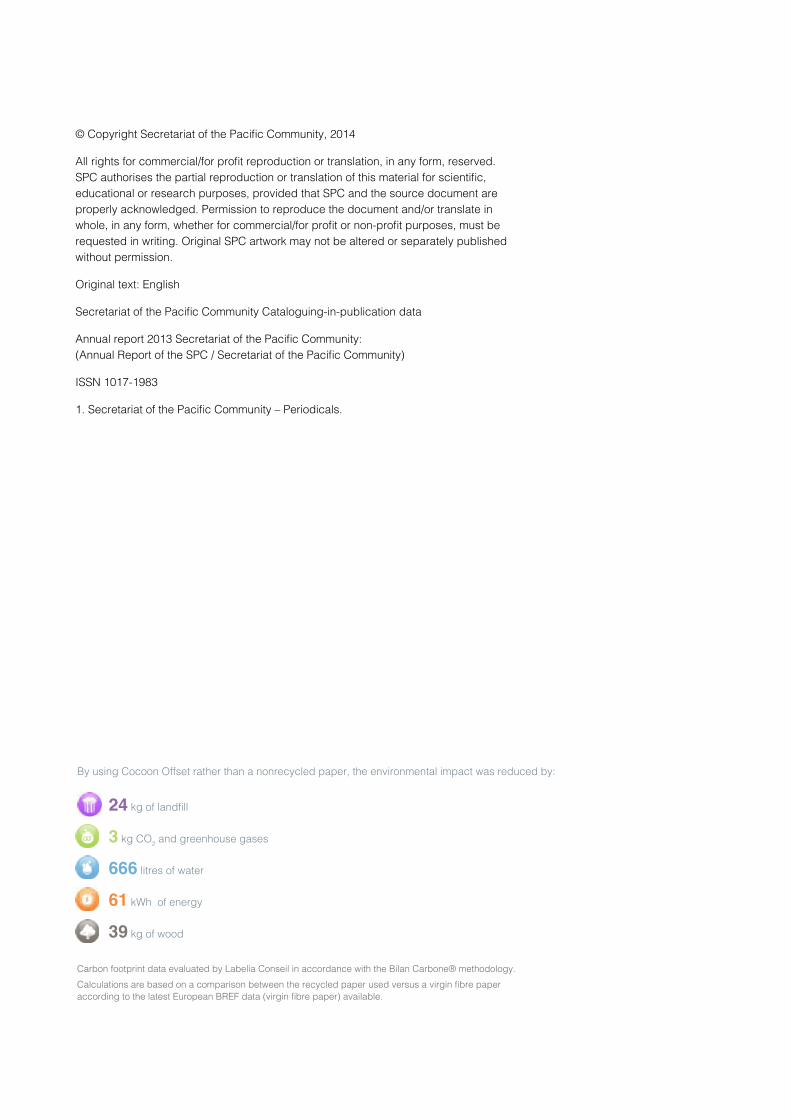
15. S
UM
MAR
Y O
F M
OVE
MEN
TS IN
EXT
RA-
BUD
GET
ARY
FUN
DS
FOR
TH
E PE
RIO
D 0
1 JA
NU
ARY
TO 3
1 D
ECEM
BER
201
3
DES
CR
IPTI
ON
31.1
2.12
EXC
H. V
AR
OPE
NIN
G B
AL
REC
EIVE
D
FRO
M
DO
NO
RS
TOTA
L
INC
OM
EEX
PEN
DIT
UR
E E
XCH
. VAR
C
LOSI
NG
BAL
31
.12.
13 F
UN
DS
HEL
D
ON
BEH
ALF
OF
DO
NO
RS
FUN
DS
OW
ED
BY D
ON
OR
S
Adm
inis
tratio
n 5
,840
,369
61
,450
11,
606,
694
17,
508,
513
(7,6
13,9
06)
(415
,134
) 9
,479
,473
9
,767
,700
(2
88,2
27)
Appl
ied
Geo
scie
nce
& Te
chno
logy
2,5
90,2
68
39,2
3817
,683
,484
20,
312,
990
(10,
166,
319)
(627
,049
) 9
,519
,622
1
1,54
1,47
4 (2
,021
,852
)
Land
Res
ourc
es 7
,766
,905
12
9,29
26,
461,
219
14,
357,
416
(7,5
12,1
78)
(760
,167
) 6
,085
,071
6
,249
,783
(1
64,7
12)
FAM
E 5
,124
,677
(1
,677
)12
,321
,618
17,
444,
618
(10,
970,
260)
7,45
8 6
,481
,816
6
,874
,697
(3
92,8
80)
ETH
D 2
,811
,269
36
,613
4,15
5,47
6 7
,003
,358
(5
,276
,484
)(2
16,2
07)
1,5
10,6
67
1,9
93,2
37
(482
,570
)
Publ
ic H
ealth
1
3,27
5,29
2 (5
0,95
0)15
,833
,246
29,
057,
588
(22,
271,
052)
385,
043
7,1
71,5
79
7,6
29,3
00
(457
,721
)
Econ
omic
Dev
elop
men
t 6
,388
,752
10
5,73
68,
819,
930
15,
314,
418
(7,4
36,4
65)
(732
,881
) 7
,145
,072
7
,146
,825
(1
,753
)
Stat
istic
s fo
r Dev
elop
men
t 1
,595
,011
(1
2)3,
145,
350
4,7
40,3
49
(2,5
89,1
84)
40 2
,151
,205
2
,362
,157
(2
10,9
52)
GR
AND
TO
TALS
45,3
92,5
4331
9,69
080
,027
,017
125,
739,
250
(73,
835,
848)
(2,3
58,8
97)
49,
544,
505
53,
565,
173
(4,0
20,6
67)
Fund
s he
ld o
n be
half
of d
onor
s53
,565
,173
-
Fund
s ow
ed b
y do
nors
- (4
,020
,667
)
Plus
pro
visi
on fo
r XB
writ
e-of
f -
5,00
0
NET
AM
OU
NT
HEL
D O
N B
EHAL
F O
F D
ON
ORS
49,5
49,5
06
Notes to the financial statements

ANNUAL REPORT 2013 23
PRO
JEC
T C
OD
ED
ESC
RIP
TIO
N31
.12.
2012
EXC
H.
VAR
IATI
ON
O
PEN
ING
BAL
REC
EIVE
D
FRO
M
DO
NO
RS
TOTA
L
INC
OM
E E
XPEN
DIT
UR
EEX
CH
. VA
RIA
TIO
N
CLO
SIN
G B
AL31
.12.
2013
FUN
DS
HEL
D
ON
BEH
ALF
OF
DO
NO
RS
FUN
DS
OW
ED
BY D
ON
OR
S
ADM
INIS
TRAT
ION
5
,840
,369
6
1,45
0 1
1,60
6,69
4 1
7,50
8,51
3 -7
,613
,906
-4
15,1
34
9,4
79,4
73
9,7
67,7
00
-288
,227
Al
l Ope
ratio
ns &
Man
agem
ent
Div
isio
n - N
oum
ea 1
,721
,713
-
2,3
56,7
33
4,0
78,4
46
-1,4
48,4
27
- 2
,630
,019
2
,665
,346
-3
5,32
7 Fi
nanc
e Se
ctio
n 8
32,7
90
- 1
,069
,505
1
,902
,295
-2
36,6
64
- 1
,665
,631
1
,665
,631
-
CZF
Z03X
NPF
Allo
catio
n Ac
coun
t 2
15,3
24
- 7
92,3
64
1,0
07,6
88
-215
,324
-
792
,364
7
92,3
64
- C
ZFZ0
2XN
2011
PF
Allo
catio
n N
oum
ea 3
53,4
24
- -
353
,424
-3
53,4
24
- -
- -
CZF
Z07X
N20
11 P
F Al
loca
tion
Suva
-321
,046
-
- -3
21,0
46
321
,046
-
- -
- C
ZFZ0
4XN
Som
met
Fra
nce
/ Océ
anie
-13,
455
- 1
4,46
8 1
,013
-1
,013
-
- -
- C
ZFZ0
6XN
Budg
et D
evel
opm
ent -
New
form
at A
usAI
D 9
0,00
0 -
- 9
0,00
0 -
- 9
0,00
0 9
0,00
0 -
CZF
Z08X
NEs
tabl
ishm
ent o
f Int
erna
l Aud
it Fu
nctio
n Au
sAID
67,
772
- -
67,
772
- -
67,
772
67,
772
- C
ZFZ0
9XN
Revi
ew o
f SPC
Fin
ance
Reg
ulat
ions
Aus
AID
20,
000
- -
20,
000
- -
20,
000
20,
000
- C
ZFZ1
0XN
Revi
sion
of t
he F
inan
ce P
olic
ies
& Pr
oced
, Aus
AID
40,
000
- -
40,
000
- -
40,
000
40,
000
- C
ZAZ0
1XP
Pohn
pei A
dmin
istra
tion
-123
,326
-
- -1
23,3
26
123
,326
-
- -
- C
ZFZ1
1XN
Fina
nce
tem
p st
aff f
or p
roj i
mpl
emen
tatio
n Au
sAID
165
,000
-
- 1
65,0
00
-28,
015
- 1
36,9
85
136
,985
-
CZF
Z14P
NPF
Cum
ulat
ed F
inal
Bal
ance
s 20
12 8
76
- -
876
-8
76
- -
- -
CZF
Z15X
N20
12 P
F Al
loca
tion
2012
- Su
va 8
2,38
4 -
- 8
2,38
4 -8
2,38
4 -
- -
- C
ZFZ1
2XN
AusA
ID C
orp
Gra
nt 2
011
Allo
catio
n Ac
coun
t 2
55,8
37
- -
255
,837
-
- 2
55,8
37
255
,837
-
CZF
Z14X
NFI
S Im
prov
emen
ts -
- 2
62,6
73
262
,673
-
- 2
62,6
73
262
,673
-
Adm
inis
tratio
n 3
88,8
59
- 9
43,8
95
1,3
32,7
54
-603
,685
-
729
,069
7
31,8
65
-2,7
96
CZA
Z02X
NH
R &
Adm
inis
tratio
n Pr
ojec
ts (A
usAI
D)
83,
496
- -
83,
496
-57,
376
- 2
6,12
0 2
6,12
0 -
CZA
Z05X
NAr
chiv
es, S
ecur
ity a
nd B
rand
ing
AusA
ID 2
2,99
3 -
- 2
2,99
3 -2
5,78
9 -
-2,7
96
- -2
,796
Al
l oth
er H
RH
R Sy
stem
s, P
olic
ies
& M
anag
emen
t 2
82,3
70
- 2
18,8
95
501
,265
-3
67,3
13
- 1
33,9
52
133
,952
-
CZM
Z06X
NH
.Q. M
aint
enan
ce -
New
Cal
edon
ia -
- 7
25,0
00
725
,000
-1
53,2
07
- 5
71,7
93
571
,793
-
Info
rmat
ion
& C
omm
unic
atio
n Te
chno
logy
434
,552
-
287
,082
7
21,6
34
-582
,666
-
138
,968
1
71,4
99
-32,
531
PSIC
01XN
Com
mun
icat
ion
Cos
ts 2
32,6
53
- -
232
,653
-7
9,89
0 -
152
,763
1
52,7
63
- PS
IC04
XNSP
IN -
Sout
h Pa
cific
Info
rmat
ion
Net
wor
k-1
2,32
4 -
- -1
2,32
4 1
2,32
4 -
- -
- PS
ID02
XNN
avis
ion
-33,
937
- -7
07
-34,
644
34,
644
- -
- -
PSID
04XN
Tran
sl. I
nter
p. G
ear
- Fre
nch
Pac.
Fun
ds 7
36
- -
736
-7
36
- -
- -
PSID
05XN
SPC
AD
B IC
T Pr
ojec
t 5
0,11
5 -
- 5
0,11
5 -5
0,11
5 -
- -
- PS
ID06
XNC
omm
onw
ealth
Sec
Fun
ding
E-H
ealth
Pro
ject
445
-
- 4
45
-445
-
- -
- PS
IG01
XND
S / C
hina
VSS
AT P
ositi
on 8
8,72
9 -
- 8
8,72
9 -8
8,72
9 -
- -
- PS
IG02
XNSo
lom
on Is
land
s Pa
cRIC
S-1
79,5
20
- -
-179
,520
1
79,5
20
- -
- -
PSIZ
02XN
ICT
Mis
cella
neou
s 1
,152
-
-1,1
52
- -
- -
- -
PSIZ
03XN
CIS
Impr
ovem
ents
(Aus
Aid)
71,
674
- -
71,
674
-71,
674
- -
- -
PSIZ
07XN
CIS
Impr
ovem
ents
Rou
nd 2
- Au
sAID
172
,463
-
- 1
72,4
63
-172
,463
-
- -
- PS
IZ08
XNPA
BX Im
prov
emen
ts &
Ext
ensi
on A
usAI
D 4
2,36
6 -
- 4
2,36
6 -4
2,36
6 -
- -
- PS
IZ09
XNSy
tem
s D
evel
opm
ent I
RIS
- -
- -
-32,
531
- -3
2,53
1 -
-32,
531
PSIZ
10XN
ICT
Syst
ems
& Su
ppor
t -
288
,941
2
88,9
41
-270
,205
-
18,
736
18,
736
-
Notes to the financial statements

ANNUAL REPORT 2013 24
PRO
JEC
T C
OD
ED
ESC
RIP
TIO
N31
.12.
2012
EXC
H.
VAR
IATI
ON
O
PEN
ING
BAL
REC
EIVE
D
FRO
M
DO
NO
RS
TOTA
L
INC
OM
E E
XPEN
DIT
UR
EEX
CH
. VA
RIA
TIO
N
CLO
SIN
G B
AL31
.12.
2013
FUN
DS
HEL
D
ON
BEH
ALF
OF
DO
NO
RS
FUN
DS
OW
ED
BY D
ON
OR
S
Libr
ary
-1
,860
-
16,
860
15,
000
- -
15,
000
15,
000
- PS
LZ01
XNLi
brar
y Ar
chiv
ing
Proj
ect
-1,8
60
- 1
,860
-
- -
- -
- PS
LZ02
XN40
th A
nnua
l IAM
SLIC
con
fere
nce
- -
15,
000
15,
000
- -
15,
000
15,
000
-
Tran
slat
ion
& In
terp
reta
tion
55,
787
- 3
9,39
1 9
5,17
8 -1
3,82
7 -
81,
351
81,
351
- PS
TZ02
XNTr
ansl
atio
n In
terp
reta
tion
Mis
c 5
5,78
7 -
39,
391
95,
178
-13,
827
- 8
1,35
1 8
1,35
1 -
PF -
Prog
ram
mes
Sup
port
11,
585
- -
11,
585
-11,
585
- -
- -
PSTZ
01PN
PF -
INTE
RPRE
T. &
TRA
NSL
ATIO
N-4
,868
-
- -4
,868
4
,868
-
- -
- PS
IZ02
PNPF
-ICT
Sect
ion
(Nou
mea
) 1
6,45
3 -
- 1
6,45
3 -1
6,45
3 -
- -
-
All O
pera
tions
& M
anag
emen
t D
ivis
ion
- Suv
a 2
,415
,938
4
0,21
6 4
32,0
83
2,8
88,2
37
-1,3
36,5
11
-207
,814
1
,343
,912
1
,368
,480
-2
4,56
8 Su
va -
Adm
inis
tratio
n-3
41,4
15
-5,6
83
172
,947
-1
74,1
51
193
,893
1
7,51
4 3
7,25
6 3
7,25
6 -
CZA
Z01X
SH
RIS
Syst
em (A
usAI
D)
-218
,941
-3
,645
-
-222
,586
2
10,1
08
12,
478
- -
- C
ZAZ0
2XS
PABX
-Tel
epho
ne S
yste
m-5
8,62
6 -9
76
- -5
9,60
2 5
6,26
1 3
,341
-
- -
CZA
Z03X
SAd
min
- Pr
ocur
emen
t, Ri
sk, T
rave
l - A
usAI
D-1
8,77
0 -3
12
- -1
9,08
2 1
8,01
2 1
,070
-
- -
CZA
Z04X
SRe
furb
ishm
ent o
f Offi
ce -
FIN
/HR/
RMC
201
2-2
4,98
9 -4
16
133
,747
1
08,3
42
-109
,766
1
,424
-
- -
CZA
Z05X
SAd
min
- Ar
chiv
es, s
ecur
ity a
nd b
rand
ing
-20,
089
-334
-
-20,
423
19,
278
1,1
45
- -
- C
ZZZ0
1XS
SPC
Alte
rnat
e Fi
ji O
ffice
Pro
ject
- -
39,
200
39,
200
- -1
,944
3
7,25
6 3
7,25
6 -
Suva
- Fi
nanc
e Se
ctio
n 2
44,8
52
4,0
76
76,
187
325
,115
-1
,627
-2
9,30
5 2
94,1
83
294
,183
-
CZF
Z02X
SSu
va F
inan
ce S
ervi
ces
- XB
178
,962
2
,979
7
6,18
7 2
58,1
28
6,8
34
-22,
834
242
,128
2
42,1
28
- C
ZFZ0
3XS
Suva
Fin
ance
Sta
ffing
45,
954
765
-
46,
719
- -4
,806
4
1,91
3 4
1,91
3 -
CZF
Z04X
SFi
nanc
e M
isce
llane
ous
11,
120
185
-
11,
305
- -1
,163
1
0,14
2 1
0,14
2 -
CZF
Z05X
SEm
ploy
ee P
rovi
sion
s 8
,816
1
47
- 8
,963
-8
,461
-5
02
- -
-
Suva
- Ap
plie
d G
eosc
ienc
e an
d Te
chno
logy
Div
isio
n 2
,805
,806
4
6,70
8 1
25,8
65
2,9
78,3
79
-1,8
38,3
16
-208
,516
9
31,5
47
931
,547
-
CG
FZ01
XSFi
nanc
e Se
rvic
es S
OPA
C-X
B 1
,214
,758
2
0,22
2 1
19,7
61
1,3
54,7
41
-309
,352
-1
17,6
41
927
,748
9
27,7
48
- C
GFZ
05XS
Fina
nce
Serv
ices
Mis
c SO
PAC
1,5
90,2
98
26,
474
- 1
,616
,772
-1
,526
,138
-9
0,63
4 -
- -
CG
ZZ02
XSC
omm
on S
ervi
ces
SOPA
C -
Mis
c XB
750
1
2 6
,104
6
,866
-2
,826
-2
41
3,7
99
3,7
99
-
Suva
- Pr
oper
ty
68,
854
1,1
46
- 7
0,00
0 -4
0,59
6 -5
,188
2
4,21
6 2
4,21
6 -
CZP
Z02X
SEx
tens
ion/
New
Bui
ldin
gs 4
2,30
3 7
04
- 4
3,00
7 -4
0,59
6 -2
,411
-
- -
CZP
Z04X
SM
aint
enan
ce 2
6,55
1 4
42
- 2
6,99
3 -
-2,7
77
24,
216
24,
216
-
Suva
- In
form
atio
n an
d C
omm
unic
atio
n Te
chno
logy
Sec
tion
-443
,606
-7
,386
7
,373
-4
43,6
19
392
,488
2
6,56
3 -2
4,56
8 -
-24,
568
PSIS
99XS
IT S
alar
ies
& St
aff C
ost S
OPA
C -
- 7
,373
7
,373
-1
8,77
2 5
65
-10,
834
- -1
0,83
4 PS
IZ02
XSIC
T Eq
uipm
ent H
ire-1
5,05
8 -2
51
- -1
5,30
9 -
1,5
75
-13,
734
- -1
3,73
4 PS
IZ03
XSC
IS Im
prov
men
ts (A
usAi
d)-9
8,87
6 -1
,646
-
-100
,522
9
4,88
7 5
,635
-
- -
PSIZ
07XS
CIS
Impr
ovem
ents
Rou
nd 2
- Aus
AID
-205
,175
-3
,416
-
-208
,591
1
96,8
98
11,
693
- -
- PS
IZ08
XSPA
BX Im
prov
emen
ts &
Ext
n - A
usAI
D-1
24,4
97
-2,0
73
- -1
26,5
70
119
,475
7
,095
-
- -
Notes to the financial statements

ANNUAL REPORT 2013 25
PRO
JEC
T C
OD
ED
ESC
RIP
TIO
N31
.12.
2012
EXC
H.
VAR
IATI
ON
O
PEN
ING
BAL
REC
EIVE
D
FRO
M
DO
NO
RS
TOTA
L
INC
OM
E E
XPEN
DIT
UR
EEX
CH
. VA
RIA
TIO
N
CLO
SIN
G B
AL31
.12.
2013
FUN
DS
HEL
D
ON
BEH
ALF
OF
DO
NO
RS
FUN
DS
OW
ED
BY D
ON
OR
S
Suva
- Re
gion
al M
edia
Cen
tre 5
7,52
9 9
57
49,
699
108
,185
-3
1,19
9 -6
,933
7
0,05
3 7
0,05
3 -
PSM
F01X
SM
edia
Roo
m &
Equ
ipm
ent H
ire 1
,109
1
8 4
,930
6
,057
-5
,994
-6
3 -
- -
PSM
G01
XSG
raph
ic D
esig
n an
d Pu
blic
atio
ns 8
,130
1
35
2,6
05
10,
870
-10,
407
-463
-
- -
PSM
R02X
SRa
dio
Broa
dcas
ting
Uni
t - X
B 1
,687
2
8 3
,528
5
,243
-5
,147
-9
6 -
- -
PSM
T03X
SM
edia
Tra
inin
g U
nit
-19,
122
-318
8
,747
-1
0,69
3 9
,603
1
,090
-
- -
PSM
V02X
SVi
deo/
TV/P
acifi
c W
ay 4
,928
8
2 2
2,54
1 2
7,55
1 -2
2,07
4 -5
39
4,9
38
4,9
38
- PS
MV0
4XS
Clim
ate
Cha
nge
Doc
umen
tarie
s 3
1,76
6 5
29
- 3
2,29
5 -9
38
-3,2
76
28,
081
28,
081
- PS
MV0
5XS
Med
ia S
peci
al P
roje
cts
15,
319
255
4
62
16,
036
14,
547
-2,3
46
28,
237
28,
237
- PS
MV0
6XS
Nor
th R
EP V
ideo
Doc
umen
tary
11,
008
183
-
11,
191
-1,3
08
-1,0
86
8,7
97
8,7
97
- PS
MZ0
2XS
Med
ia M
isc
Sale
s 1
,811
3
0 6
,886
8
,727
-8
,624
-1
03
- -
- PS
MZ0
4XS
Fest
ival
of A
rts 8
93
15
- 9
08
-857
-5
1 -
- -
Suva
- Pu
blic
atio
ns 1
5,97
3 2
66
12
16,
251
-6,5
42
-1,3
47
8,3
62
8,3
62
- PS
PP99
XSSO
PAC
Com
pend
ium
Pro
ject
15,
973
266
1
2 1
6,25
1 -6
,542
-1
,347
8
,362
8
,362
-
Suva
- TV
ET
7,9
45
132
-
8,0
77
-4,6
12
-602
2
,863
2
,863
-
PSVZ
02XS
TVET
Res
earc
h O
ffice
r-6
,969
-1
16
- -7
,085
6
,688
3
97
- -
- PS
VZ03
XSTV
ET In
form
atio
n C
olla
brat
ion
- Pha
se 2
11,
303
188
-
11,
491
-10,
847
-644
-
- -
PSVZ
04XS
TVET
-web
site
dev
elop
men
t/mai
nt 3
,235
5
4 -
3,2
89
-92
-334
2
,863
2
,863
-
PSVZ
05XS
TVET
Ope
ratio
nal C
ost
376
6
-
382
-3
61
-21
- -
-
Dire
ctor
-Gen
eral
’s O
ffice
1,7
02,7
18
21,
234
8,8
17,8
78
10,
541,
830
-4,8
28,9
68
-207
,320
5
,505
,542
5
,733
,874
-2
28,3
32
Dire
ctor
-Gen
eral
- N
oum
ea 1
36,3
81
- 3
,727
,536
3
,863
,917
-1
,149
,512
-
2,7
14,4
05
2,7
14,4
05
- EZ
DP0
1XN
INTE
GRE
Pro
ject
- -
2,9
83,2
94
2,9
83,2
94
-390
,219
-
2,5
93,0
75
2,5
93,0
75
- EZ
EZ01
XNC
RGA
Subc
omm
ittee
Fin
anci
ng (A
usAI
D)
163
-
- 1
63
-163
-
- -
- EZ
EZ08
XN20
12 R
evie
w o
f SPC
Ser
vice
s 1
42,9
09
- -
142
,909
-1
42,9
09
- -
- -
EZEZ
09XN
DG
- O
rgan
isat
iona
l Sup
port
60,
000
- -
60,
000
-60,
000
- -
- -
EZEZ
05PN
PF -
Org
anis
atio
nal S
uppo
rt 2
3,09
5 -
- 2
3,09
5 -2
3,09
5 -
- -
- ZZ
ZS01
XNSP
C’s
60t
h An
nive
rsar
y-Fr
ance
2,1
63
- -
2,1
63
- -
2,1
63
2,1
63
- EZ
EZ10
XNEx
ecut
ive
recr
uitm
ents
-91,
707
- 5
25,3
47
433
,640
-4
33,6
40
- -
- -
EZEZ
11XN
IER
Revi
ew -
Con
sulta
ncy
Cos
ts-2
42
- -
-242
2
42
- -
- -
EZEZ
12XN
Man
agem
ent A
dvis
ory
Gro
up, A
udit
& Ri
sk C
om -
87,
558
87,
558
-684
-
86,
874
86,
874
- EZ
EZ13
XND
G’s
Offi
ce-C
ontin
genc
y Al
loca
tion
- 1
31,3
37
131
,337
-9
9,04
4 -
32,
293
32,
293
-
Dire
ctor
-Gen
eral
- Su
va-1
61,2
48
-2,6
85
162
,712
-1
,221
-6
26
8,8
25
6,9
78
6,9
78
- EZ
EM01
XSC
RGA
Mee
tings
-53,
384
-889
4
8,29
6 -5
,977
2
,935
3
,042
-
- -
EZEZ
01XS
CRG
A su
bcom
mitt
ee F
inan
cing
Aus
AID
-107
,864
-1
,796
1
07,0
74
-2,5
86
-3,5
61
6,1
47
- -
- EZ
EZ02
XSD
G F
arew
ell J
anua
ry 2
014,
Suv
a -
- 7
,342
7
,342
-
-364
6
,978
6
,978
-
Notes to the financial statements

ANNUAL REPORT 2013 26
PRO
JEC
T C
OD
ED
ESC
RIP
TIO
N31
.12.
2012
EXC
H.
VAR
IATI
ON
O
PEN
ING
BAL
REC
EIVE
D
FRO
M
DO
NO
RS
TOTA
L
INC
OM
E E
XPEN
DIT
UR
EEX
CH
. VA
RIA
TIO
N
CLO
SIN
G B
AL31
.12.
2013
FUN
DS
HEL
D
ON
BEH
ALF
OF
DO
NO
RS
FUN
DS
OW
ED
BY D
ON
OR
S
Dep
uty
Dire
ctor
-Gen
eral
- Su
va 3
5,74
4 5
95
169
,265
2
05,6
04
-47,
911
-9,7
57
147
,936
1
47,9
36
- PM
DZ0
4XS
DD
G T
echn
ical
Ass
ista
nce
28,
369
472
3
,358
3
2,19
9 -2
7,86
6 -1
,751
2
,582
2
,582
-
PMD
Z07X
SD
DG
Mis
c Fu
nds
30,
290
504
6
,716
3
7,51
0 -2
0,04
5 -2
,507
1
4,95
8 1
4,95
8 -
PMD
Z12X
SLo
tus
Build
ing
Mid
dle
Floo
r-2
2,91
5 -3
81
21,
991
-1,3
05
- 1
,305
-
- -
PMG
Z01X
SG
eosc
ienc
e D
irect
orat
e -
Mis
c XB
- -
137
,200
1
37,2
00
- -6
,804
1
30,3
96
130
,396
-
Stra
tegi
c En
gage
men
t, Po
licy
and
Plan
ning
Fac
ility
- Nou
mea
290
,769
-
497
,759
7
88,5
28
-577
,367
-
211
,161
3
42,9
51
-131
,790
PM
DM
01XN
SPC
Ope
n D
ay-1
6,09
1 -
- -1
6,09
1 1
6,09
1 -
- -
- PM
DZ0
9XN
PF -
2007
Sun
Los
t PF
Com
nts
Prov
isio
n 8
6,87
1 -
-40,
000
46,
871
-16,
092
- 3
0,77
9 3
0,77
9 -
PMPZ
01XN
SEPP
F-M
onito
ring
and
Eval
uatio
n-2
2,65
3 -
47,
946
25,
293
-25,
293
- -
- -
PMPZ
02XN
Plan
ning
Mis
cella
neou
s-9
3,77
7 -
16,
341
-77,
436
77,
436
- -
- -
PMPZ
03XN
Dire
ctor
SEP
PF (A
usAI
D)
67,
818
- -
67,
818
-60,
837
- 6
,981
6
,981
-
PMPZ
04XN
Clim
ate
impa
ct o
n C
.F. /
O.F
.-4
0,99
3 -
- -4
0,99
3 4
0,99
5 -
2
2
- PM
PZ06
XNC
limat
e C
hang
e M
ains
tream
ing
343
,878
-
21,
586
365
,464
-2
95,8
11
- 6
9,65
3 6
9,65
3 -
PMPZ
08XN
PAC
E-N
ET-9
,555
-
8,7
96
-759
-7
,061
-
-7,8
20
- -7
,820
PM
PZ09
XNPu
blic
atio
n of
Clim
ate
Book
-50,
181
- -
-50,
181
-30
- -5
0,21
1 -
-50,
211
PMPZ
11XN
Food
Sec
urity
and
Clim
ate
Cha
nge
17,
120
- -
17,
120
-17,
120
- -
- -
PMPZ
12XN
Clim
ate
chan
ge- F
onds
Pac
ifiqu
e -P
êche
& A
quac
ult.
-10,
670
- -
-10,
670
10,
670
- -
- -
PMPZ
14XN
GC
CA
SIS
Proj
ect
-2,1
12
- -
-2,1
12
2,0
99
- -1
3 -
-13
PMPZ
15XN
Prog
ram
me
d’ét
ude
et d
’app
ui à
fina
ncer
le F
RP 1
83,2
88
- 1
3,17
1 1
96,4
59
-152
,645
-
43,
814
43,
814
- PM
PZ19
XNC
limat
e C
hang
e M
ains
tream
ing
- Pha
se 2
-162
,174
-
176
,925
1
4,75
1 -7
4,78
2 -
-60,
031
- -6
0,03
1 PM
PZ20
XNM
&E IR
IS -
133
,662
1
33,6
62
-49,
732
- 8
3,93
0 8
3,93
0 -
PMPZ
22XN
RESC
CU
E Pr
ojec
t -
- -
-11,
551
- -1
1,55
1 -
-11,
551
PMPZ
23XN
Pilo
t Pro
gram
for C
limat
e Re
silie
nce
- -
- -2
,164
-
-2,1
64
- -2
,164
PM
PZ24
XNPA
CE
NET
+ -
119
,332
1
19,3
32
-11,
540
- 1
07,7
92
107
,792
-
Stra
tegi
c En
gage
men
t, Po
licy
and
Plan
ning
Fac
ility
- Suv
a 1
,401
,072
2
3,32
4 4
,260
,606
5
,685
,002
-3
,053
,552
-2
06,3
88
2,4
25,0
62
2,5
21,6
04
-96,
542
PMPZ
02XS
x-Pl
anni
ng U
nit O
pera
tions
- -
7,8
33
7,8
33
-4,3
72
-172
3
,289
3
,289
-
PMPZ
04XS
DRA
O-D
eput
y Re
gion
al A
utho
risin
g O
ffice
-ED
F-2
7,98
1 -4
66
76,
988
48,
541
-18,
878
45
29,
708
29,
708
- PM
PZ06
XSPl
anni
ng U
nit -
Clim
ate
Cha
nge
- -
- -
4,4
22
-219
4
,203
4
,203
-
PMPZ
07XS
GC
CA
SIS
Proj
ect -
EU
678
,455
1
1,29
4 2
,766
,304
3
,456
,053
-2
,353
,132
-9
1,44
5 1
,011
,476
1
,011
,476
-
PMPZ
08XS
CC
-Veg
etat
n M
appi
ng/im
prov
ing
Food
Sec
urity
-USA
ID 4
03,8
92
6,7
24
130
,437
5
41,0
53
-371
,284
-3
0,29
6 1
39,4
73
139
,473
-
PMPZ
09XS
PASA
P - D
CC
EE/M
ultic
ount
ry 1
79,6
19
2,9
90
- 1
82,6
09
-112
,371
-1
3,21
2 5
7,02
6 5
7,02
6 -
PMPZ
10XS
M&E
Offi
ce -
Suva
151
,906
2
,529
-
154
,435
-1
1,70
0 -1
5,30
7 1
27,4
28
127
,428
-
PMPZ
11XS
Clim
ate
Cha
nge
Mai
nstre
amin
g G
IZ 1
7,40
8 2
90
-70,
195
-52,
497
-48,
090
4,0
45
-96,
542
- -9
6,54
2 PM
PZ12
XSPl
anni
ng U
nit -
Mis
c pr
ojec
ts-2
,227
-3
7 1
7,18
7 1
4,92
3 3
,575
-7
97
17,
701
17,
701
- PM
PY01
XSRe
gion
al F
ram
ewor
k on
You
th D
evel
opm
ent
- -
40,
511
40,
511
-38,
043
-122
2
,346
2
,346
-
PMPZ
13XS
SPBE
A Re
view
- -
88,
480
88,
480
-73,
490
-743
1
4,24
7 1
4,24
7 -
PMPZ
18XS
SEPP
F - C
omm
s O
ffice
- -
37,
768
37,
768
-28,
572
-456
8
,740
8
,740
-
PMPZ
20XS
M&E
IRIS
- -
42,
454
42,
454
-1,5
83
-2,0
27
38,
844
38,
844
- PM
PZ25
XSM
icro
Pro
ject
Pro
gram
- -
1,1
22,8
39
1,1
22,8
39
-34
-55,
682
1,0
67,1
23
1,0
67,1
23
-
Notes to the financial statements

ANNUAL REPORT 2013 27
PRO
JEC
T C
OD
ED
ESC
RIP
TIO
N31
.12.
2012
EXC
H.
VAR
IATI
ON
O
PEN
ING
BAL
REC
EIVE
D
FRO
M
DO
NO
RS
TOTA
L
INC
OM
E E
XPEN
DIT
UR
EEX
CH
. VA
RIA
TIO
N
CLO
SIN
G B
AL31
.12.
2013
FUN
DS
HEL
D
ON
BEH
ALF
OF
DO
NO
RS
FUN
DS
OW
ED
BY D
ON
OR
S
APPL
IED
GEO
SCIE
NC
E &
TEC
HN
OLO
GY
DIV
ISIO
N 2
,590
,268
3
9,23
8 1
7,68
3,48
4 2
0,31
2,99
0 -1
0,16
6,31
9 -6
27,0
49
9,5
19,6
22
11,
541,
474
-2,0
21,8
52
All G
eosc
ienc
e - N
oum
ea 2
33,0
52
- 1
,647
,128
1
,880
,180
-1
,803
,023
-
77,
157
200
,204
-1
23,0
47
All G
eosc
ienc
e - N
oum
ea 2
33,0
52
- 1
,647
,128
1
,880
,180
-1
,803
,023
-
77,
157
200
,204
-1
23,0
47
GD
CC
01XN
Redu
cing
Vul
nera
bilit
y - E
DF9
C E
nvel
ope
Proj
ect
337
,432
-
1,6
48,1
16
1,9
85,5
48
-1,7
85,3
44
- 2
00,2
04
200
,204
-
GD
TZ01
XNTr
aini
ng C
apac
ity B
uild
ing
- FPF
4,8
67
- -4
,867
-
- -
- -
- G
DM
A02X
ND
RP P
late
form
Mee
ting
-58,
542
- -
-58,
542
-900
-
-59,
442
- -5
9,44
2 G
DTZ
02XN
Trai
ning
Cap
acity
Bui
ldin
g 20
12 -
FPF
-4,9
31
- 3
,879
-1
,052
1
,052
-
- -
- G
WPF
01XN
Wat
er &
San
itatio
n Pr
og./
Fren
ch P
ac. F
unds
-45,
774
- -
-45,
774
-17,
831
- -6
3,60
5 -
-63,
605
Dis
aste
r Red
uctio
n Pr
ogra
mm
e - S
uva
-1,2
63,6
42
-21,
036
8,7
20,5
33
7,4
35,8
55
-2,5
93,8
76
-171
,679
4
,670
,300
6
,123
,841
-1
,453
,541
Suva
- B
Enve
lope
-1
,116
,316
-1
8,58
3 1
,761
,387
6
26,4
88
-1,3
64,3
85
97,
059
-640
,838
-
-640
,838
G
DBB
01XS
Redu
ce V
ulne
rabi
lity
- B E
nvel
. Mul
ticou
ntry
Pro
j.-1
,116
,316
-1
8,58
3 1
,761
,387
6
26,4
88
-1,3
64,3
85
97,
059
-640
,838
-
-640
,838
Suva
- C
Env
elop
e -5
94,5
50
-9,8
98
148
,763
-4
55,6
85
-189
,030
6
4,17
7 -5
80,5
38
- -5
80,5
38
GD
CC
01XS
Redu
cing
Vul
nera
bilit
y - E
DF9
C E
nvel
ope
Proj
ect
-594
,550
-9
,898
1
48,7
63
-455
,685
-1
89,0
30
64,
177
-580
,538
-
-580
,538
Suva
- In
form
atio
n M
anag
emen
t / P
acifi
c D
isas
ter N
etw
ork
473
8
8
0,56
8 8
1,04
9 -9
6,02
3 7
17
-14,
257
31,
481
-45,
738
GD
IG01
XSG
IZ P
DN
Pro
ject
- -
24,
868
24,
868
-10,
808
-697
1
3,36
3 1
3,36
3 -
GD
IR01
XSAD
B D
RR P
orta
l-2
3,29
7 -3
88
- -2
3,68
5 -2
5,76
7 3
,714
-4
5,73
8 -
-45,
738
GD
IU02
XSRe
gion
al D
isas
ter P
roje
ct -
UN
ISD
R 2
3,77
0 3
96
55,
700
79,
866
-59,
448
-2,3
00
18,
118
18,
118
-
Suva
- Pr
ogra
mm
e M
anag
emen
t 2
35,3
21
3,9
17
342
,377
5
81,6
15
-557
,232
-1
3,95
6 1
0,42
7 1
0,42
7 -
GD
MA0
1XS
Prog
ram
me
Man
agem
ent -
Aus
AID
/ N
ZAID
car
ry o
ver
76,
234
1,2
69
96,
339
173
,842
-1
65,4
07
-4,5
48
3,8
87
3,8
87
- G
DM
A02X
SD
RP P
latfo
rm M
eetin
g 1
59,0
87
2,6
48
246
,038
4
07,7
73
-391
,825
-9
,408
6
,540
6
,540
-
Suva
- D
RM P
olic
y &
Plan
ning
141
,044
2
,348
6
,209
,904
6
,353
,296
-1
62,8
60
-314
,636
5
,875
,800
5
,993
,972
-1
18,1
72
GD
PE01
XSEU
Bui
ldin
g Sa
fety
& R
esilie
nce
in th
e Pa
cific
- -
6,1
55,1
64
6,1
55,1
64
-25,
812
-303
,966
5
,825
,386
5
,825
,386
-
GD
PF01
XSAu
sAID
NAP
Fac
ility
14,
227
237
3
8,78
0 5
3,24
4 -9
,536
-2
,938
4
0,77
0 4
0,77
0 -
GD
PM01
XSU
N In
tern
atio
nal S
trate
gy D
isas
ter R
educ
tion
/ MO
U 1
21,6
26
2,0
25
- 1
23,6
51
- -1
2,72
0 1
10,9
31
110
,931
-
GD
PN01
XSEU
- N
atur
al D
isas
ter F
acilit
y-4
56,6
85
-7,6
02
41,
239
-423
,048
2
72,6
83
32,
193
-118
,172
-
-118
,172
G
DPT
01XS
TAF
Asia
Fou
nda.
-OFD
A O
f. U
S Fo
r. D
isas
ter A
ssis
t. 4
58,9
95
7,6
41
-25,
279
441
,357
-3
98,2
83
-26,
998
16,
076
16,
076
- G
DPA
01XS
Road
map
impl
emen
tatio
n fo
r Reg
iona
l DRM
& C
CA&
M 2
,852
4
7 -
2,8
99
-1,8
85
-205
8
09
809
-
GD
PZ01
PSD
RP -
DRM
Pol
icy
PF -
2012
29
- -
29
-27
-2
- -
-
Suva
- Ri
sk R
educ
tion
-44,
898
-747
1
87,2
23
141
,578
-1
46,7
31
2,6
87
-2,4
66
65,
789
-68,
255
GD
RA01
XSAs
ian
Dis
aste
r Pre
pare
dnes
s C
entre
Pro
ject
-76,
064
-1,2
66
39,
951
-37,
379
-8,6
05
6,4
00
-39,
584
- -3
9,58
4 G
DRR
01XS
ADB
Risk
Dat
abas
e In
itiat
ive
12,
150
202
-
12,
352
-25,
935
16
-13,
567
- -1
3,56
7 G
DRW
01XS
Risk
Red
uctio
n - W
orld
Ban
k Fu
ndin
g-1
4,83
1 -2
47
- -1
5,07
8 -1
,659
1
,633
-1
5,10
4 -
-15,
104
Notes to the financial statements

ANNUAL REPORT 2013 28
PRO
JEC
T C
OD
ED
ESC
RIP
TIO
N31
.12.
2012
EXC
H.
VAR
IATI
ON
O
PEN
ING
BAL
REC
EIVE
D
FRO
M
DO
NO
RS
TOTA
L
INC
OM
E E
XPEN
DIT
UR
EEX
CH
. VA
RIA
TIO
N
CLO
SIN
G B
AL31
.12.
2013
FUN
DS
HEL
D
ON
BEH
ALF
OF
DO
NO
RS
FUN
DS
OW
ED
BY D
ON
OR
S
GD
RW02
XSN
adi I
nteg
rate
d Fl
ood
Man
agem
ent P
roje
ct-W
orld
Bnk
31,
763
529
1
47,2
72
179
,564
-1
10,4
84
-5,1
46
63,
934
63,
934
- G
DRW
03XS
Pac
Cat
astro
phe
Risk
Ass
ess
& Fi
n In
itia-
PCRA
FI 2
98
5
- 3
03
-48
-29
226
2
26
- G
DRW
04XS
DRP
Wor
ld B
ank
proj
ect f
undi
ng 1
,786
3
0 -
1,8
16
- -1
87
1,6
29
1,6
29
-
Suva
- Tr
aini
ng &
Cap
acity
Bui
ldin
g 1
1,72
1 1
95
8,4
18
20,
334
-14,
879
-905
4
,550
4
,550
-
GD
TU01
XSU
NES
CO
SPT
WS
Trai
ning
and
Cap
acity
Bui
ldin
g 7
,896
1
31
8,4
18
16,
445
-11,
208
-687
4
,550
4
,550
-
GD
TZ01
PSD
RP -
Trai
ning
& C
apac
ity P
F - 2
012
3,8
25
64
- 3
,889
-3
,671
-2
18
- -
-
Suva
- O
ther
1
03,5
63
1,7
24
-18,
107
87,
180
-62,
736
-6,8
22
17,
622
17,
622
- G
DZZ
01XS
Mis
c. D
isas
ter R
isk
Man
agem
ent P
roje
cts/
Activ
ities
102
,472
1
,706
-1
8,10
7 8
6,07
1 -6
1,68
9 -6
,760
1
7,62
2 1
7,62
2 -
GD
ZZ01
PSD
RP -
Oth
er D
RP P
F - 2
012
1,0
91
18
- 1
,109
-1
,047
-6
2 -
- -
Oce
an &
Isla
nds
Prog
ram
me
- Suv
a 2
,346
,926
3
9,06
8 2
,960
,365
5
,346
,359
-3
,258
,005
-2
30,6
89
1,8
57,6
65
1,8
62,2
23
-4,5
58
Suva
- Re
gion
al M
ariti
me
Boun
darie
s Se
ctor
561
,090
9
,340
2
10,0
33
780
,463
-3
50,6
68
-51,
706
378
,089
3
78,0
89
- G
OBB
01XS
Regi
onal
Mar
itim
e Bo
unda
ries
Activ
ities
299
,406
4
,984
3
0,64
8 3
35,0
38
-167
,024
-2
4,55
0 1
43,4
64
143
,464
-
GO
BE01
XSEx
tend
ed C
ontin
enta
l She
lf Ac
tiviti
es 1
37
2
- 1
39
-131
-8
-
- -
GO
BE02
XSEx
tend
ed C
ontin
enta
l She
lf Ac
tiviti
es P
PSLP
-Aus
AID
261
,547
4
,354
1
79,3
85
445
,286
-1
83,5
13
-27,
148
234
,625
2
34,6
25
-
Suva
- D
ata
& In
form
atio
n M
anag
emen
t 3
6,83
9 6
13
89
37,
541
-926
-3
,812
3
2,80
3 3
2,80
3 -
GO
DG
01XS
Dat
a Aw
aren
ess
- Geo
-net
wor
k - A
PN 3
2,74
6 5
45
- 3
3,29
1 -9
26
-3,3
79
28,
986
28,
986
- G
OD
T01X
SD
ata
Awar
enes
s - T
aipe
i, C
hina
Fun
ds 4
,093
6
8 8
9 4
,250
-
-433
3
,817
3
,817
-
Suva
- G
eolo
gy, M
iner
als
& H
ydro
carb
ons
1,1
46,1
31
19,
079
198
,765
1
,363
,975
-1
,180
,149
-7
1,19
7 1
12,6
29
112
,629
-
GO
GD
01XS
Regi
onal
Dee
p Se
a M
iner
als
Proj
ect
1,1
56,9
74
19,
260
198
,765
1
,374
,999
-1
,194
,600
-7
1,61
4 1
08,7
85
108
,785
-
GO
GD
02XS
ISA
Wor
ksho
p fu
nds,
201
1 SP
C-1
5,05
8 -2
51
- -1
5,30
9 1
4,45
1 8
58
- -
- G
OG
I01X
SIn
ter S
eabe
d Au
th. W
/Sho
p - I
SA F
unds
4,2
15
70
- 4
,285
-
-441
3
,844
3
,844
-
Suva
- M
arin
e &
Coa
stal
Sur
vey
Sect
or 3
79,9
03
6,3
24
2,1
13,5
67
2,4
99,7
94
-1,4
29,9
10
-73,
635
996
,249
9
96,2
49
- G
OM
A01X
SPA
CC
SAP
BIVA
Pro
ject
- -
419
,313
4
19,3
13
-389
,716
-1
,468
2
8,12
9 2
8,12
9 -
GO
MC
01XS
Coa
stal
Sur
vey
Saip
an 2
8,75
0 4
79
- 2
9,22
9 -1
,514
-2
,932
2
4,78
3 2
4,78
3 -
GO
ME0
1XS
Envi
ronm
enta
lly S
afe
Aggr
egat
es T
araw
a - E
U K
I 05
228
,285
3
,800
3
28,5
66
560
,651
-1
81,6
54
-31,
160
347
,837
3
47,8
37
- G
OM
F01X
SC
oast
al S
urve
y Fi
ji 2
4,15
4 4
02
2,9
00
27,
456
-98
-2,6
65
24,
693
24,
693
- G
OM
F02X
SSe
awal
l Site
Insp
ectio
n W
orks
, FSM
4,6
19
77
- 4
,696
-1
,741
-3
97
2,5
58
2,5
58
- G
OM
F03X
SPW
D F
iji, J
etty
Sur
veys
- Va
nua
Levu
Pro
ject
8,3
24
139
-
8,4
63
- -8
71
7,5
92
7,5
92
- G
OM
F04X
SPA
CC
NIW
A, N
avua
- Re
wa
Surv
ey 4
8,43
0 8
06
- 4
9,23
6 -4
81
-5,0
41
43,
714
43,
714
- G
OM
K01X
SC
ook
Isla
nds
Mar
ine
/ Coa
stal
Sur
vey
67,
577
1,1
25
3,2
78
71,
980
-17
-7,2
29
64,
734
64,
734
- G
OM
O01
XSN
Z Pr
ojec
t fun
ding
- O
IP-4
63,3
29
-7,7
13
1,1
54,5
77
683
,535
-5
63,9
06
19,
164
138
,793
1
38,7
93
- G
OM
P01X
SPN
G H
ydro
elec
tric
Dam
Sur
vey
- -
44,
701
44,
701
-30,
844
-687
1
3,17
0 1
3,17
0 -
GO
MP0
3XS
Pear
l Pro
ject
in
Fiji
and
Ton
ga -
PARD
I-1
1,76
4 -1
96
68,
700
56,
740
-27,
933
-791
2
8,01
6 2
8,01
6 -
Notes to the financial statements

ANNUAL REPORT 2013 29
PRO
JEC
T C
OD
ED
ESC
RIP
TIO
N31
.12.
2012
EXC
H.
VAR
IATI
ON
O
PEN
ING
BAL
REC
EIVE
D
FRO
M
DO
NO
RS
TOTA
L
INC
OM
E E
XPEN
DIT
UR
EEX
CH
. VA
RIA
TIO
N
CLO
SIN
G B
AL31
.12.
2013
FUN
DS
HEL
D
ON
BEH
ALF
OF
DO
NO
RS
FUN
DS
OW
ED
BY D
ON
OR
S
GO
MP0
4XS
Pac
Aust
CC
Sci
ence
and
Ada
ptat
ion
Plan
ning
Pro
g 4
9,07
9 8
17
- 4
9,89
6 -1
,051
-5
,081
4
3,76
4 4
3,76
4 -
GO
MP0
5XS
WAC
OP
Proj
ect (
Cha
ngin
g W
aves
and
Coa
sts
in th
e Pa
255
,502
4
,253
-
259
,755
-1
62,5
27
-18,
661
78,
567
78,
567
- G
OM
R01X
STu
valu
Ree
f Cha
nnel
pro
ject
/ Sh
orel
ine
Mon
itorin
g 1
20,8
54
2,0
12
58,
624
181
,490
-6
3,97
0 -1
2,37
4 1
05,1
46
105
,146
-
GO
MT0
1XS
Tsun
ami P
hase
III -
PPS
LP T
onga
(Aus
AID
) 1
9,42
2 3
23
32,
908
52,
653
-4,4
58
-3,4
42
44,
753
44,
753
-
Suva
- So
uth
Paci
fic S
ea L
evel
Clim
ate
Mon
itorin
g 1
88,6
39
3,1
40
437
,911
6
29,6
90
-278
,866
-2
7,61
6 3
23,2
08
327
,766
-4
,558
G
OSS
01XS
Sout
h Pa
c. S
ea L
evel
Clim
ate
Mon
itorin
g (S
PSLC
MP)
173
,201
2
,883
4
37,9
11
613
,995
-2
59,2
55
-26,
974
327
,766
3
27,7
66
- G
OSS
02XS
SPSL
CM
P O
NU
P Pr
ojec
t 1
5,43
8 2
57
- 1
5,69
5 -1
9,61
1 -6
42
-4,5
58
- -4
,558
Suva
- Te
chni
cal W
orks
hop
2,5
60
43
- 2
,603
-1
,170
-2
10
1,2
23
1,2
23
- G
OTT
01XS
Tech
nica
l Wor
ksho
p Pr
ojec
t, Ta
ipei
, Chi
na fu
nded
2,5
60
43
- 2
,603
-1
,170
-2
10
1,2
23
1,2
23
- -
Suva
- O
ther
3
1,76
4 5
29
- 3
2,29
3 -1
6,31
6 -2
,513
1
3,46
4 1
3,46
4 -
GO
ZZ01
XSM
isce
llane
ous
Oce
an a
nd Is
land
s Ac
tiviti
es 3
1,76
4 5
29
- 3
2,29
3 -1
6,31
6 -2
,513
1
3,46
4 1
3,46
4 -
Tech
nica
l Sup
port
Prog
ram
me
- Suv
a-1
44,1
08
-2,4
00
473
,035
3
26,5
27
-292
,145
6
,100
4
0,48
2 4
0,48
2 -
Suva
- N
atur
al R
esou
rces
Eco
nom
ics
29,
911
497
-
30,
408
153
-3
,136
2
7,42
5 2
7,42
5 -
GTN
I01X
SN
atur
al R
esou
rces
Gov
erna
nce
- IU
CN
PAS
AP 7
,538
1
25
- 7
,663
1
53
-796
7
,020
7
,020
-
GTN
W01
XSAn
alys
is o
f im
prov
ed W
eath
er &
Clim
ate
Ser
22,
373
372
-
22,
745
- -2
,340
2
0,40
5 2
0,40
5 -
Suva
- Re
mot
e Se
nsin
g &
GIS
-174
,019
-2
,897
4
73,0
35
296
,119
-2
92,2
98
9,2
36
13,
057
13,
057
- G
TSA0
1XS
Rem
ote
Sens
ing
and
GIS
- Au
sAID
/ N
ZAID
Ann
ual G
ra 4
4,00
7 7
33
42,
468
87,
208
-84,
700
-2,5
08
- -
- G
TSU
01XS
GIS
USA
ID, I
mag
e D
ata
for S
ol. I
slan
ds P
roje
ct-2
30,7
91
-3,8
42
418
,165
1
83,5
32
-195
,820
1
3,11
0 8
22
822
-
GTS
T01X
SRe
mot
e Se
nsin
g &
GIS
, Tai
pei,
Chi
na fu
nds
- -
5,7
35
5,7
35
-5,7
35
- -
- -
GTS
Z01X
SG
IS-G
ener
al 1
2,76
5 2
12
6,6
67
19,
644
-6,0
43
-1,3
66
12,
235
12,
235
-
Wat
er &
San
itatio
n Pr
ogra
mm
e - S
uva
1,4
18,0
42
23,
606
3,8
82,4
23
5,3
24,0
71
-2,2
19,2
70
-230
,781
2
,874
,020
3
,314
,726
-4
40,7
06
Suva
- W
ater
Gov
erna
nce
956
,792
1
5,92
7 9
85,9
20
1,9
58,6
39
-421
,820
-1
28,0
38
1,4
08,7
81
1,4
66,9
18
-58,
137
GW
GA0
1XS
Paci
fic R
egio
nal A
ctio
n Pl
an 1
6,00
0 2
66
- 1
6,26
6 -1
3,52
0 -1
,003
1
,743
1
,743
-
GW
GA0
2XS
AusA
ID /
SPC
MC
CC
A Pr
ogra
mm
e fo
r Fiji,
Tok
elau
To
nga
825
,563
1
3,74
3 -
839
,306
-2
06,2
03
-76,
114
556
,989
5
56,9
89
-
GW
GA0
3XS
AusA
ID /
SPC
MC
CC
A Pr
ogra
me
for T
uval
u -
- 8
56,9
43
856
,943
-
-42,
497
814
,446
8
14,4
46
- G
WG
F01X
S4t
h W
orld
Wat
er F
orum
164
3
1
3,60
8 1
3,77
5 -
-692
1
3,08
3 1
3,08
3 -
GW
GI0
1XS
Paci
fic IW
RM &
WU
E St
rate
gies
96,
655
1,6
09
54,
153
152
,417
-7
8,78
3 -8
,887
6
4,74
7 6
4,74
7 -
GW
GI0
3XS
WSP
- W
ater
Gov
erna
nce
Advi
ce &
Sup
port
- -
61,
216
61,
216
-122
,387
3
,034
-5
8,13
7 -
-58,
137
GW
GS0
1XS
SOPA
C W
ater
Sec
tor S
trate
gy (2
005-
2009
) 1
8,41
0 3
06
- 1
8,71
6 -9
27
-1,8
79
15,
910
15,
910
-
Notes to the financial statements

ANNUAL REPORT 2013 30
PRO
JEC
T C
OD
ED
ESC
RIP
TIO
N31
.12.
2012
EXC
H.
VAR
IATI
ON
O
PEN
ING
BAL
REC
EIVE
D
FRO
M
DO
NO
RS
TOTA
L
INC
OM
E E
XPEN
DIT
UR
EEX
CH
. VA
RIA
TIO
N
CLO
SIN
G B
AL31
.12.
2013
FUN
DS
HEL
D
ON
BEH
ALF
OF
DO
NO
RS
FUN
DS
OW
ED
BY D
ON
OR
S
Suva
- Pr
ogra
mm
e M
anag
emen
t 8
8,21
1 1
,468
1
,037
,089
1
,126
,768
-2
0,81
9 -5
9,62
4 1
,046
,325
1
,046
,325
-
GW
PE01
XSIm
prov
ed D
rinki
ng W
ater
Sup
ply
for K
irim
ati I
slan
d -
- 1
,037
,089
1
,037
,089
-1
1,47
0 -5
0,86
2 9
74,7
57
974
,757
-
GW
PF01
XSW
ater
& S
anita
tion
Prog
. / F
renc
h Pa
c. F
unds
88,
211
1,4
68
- 8
9,67
9 -9
,349
-8
,762
7
1,56
8 7
1,56
8 -
Suva
- W
ater
Res
ourc
es M
anag
emen
t-1
07,6
20
-1,7
91
1,8
32,4
28
1,7
23,0
17
-1,5
39,1
66
-3,2
88
180
,563
5
63,1
32
-382
,569
G
WRH
01XS
Hyd
rolo
gy fo
r Life
Env
ironm
ent a
nd P
olic
y (H
ELP)
6,4
96
108
-
6,6
04
- -6
79
5,9
25
5,9
25
- G
WRI
01XS
Impl
emet
ing
Sust
aina
ble
Wat
er R
esou
rce
UN
DP
342
,032
5
,694
7
23,6
18
1,0
71,3
44
-770
,557
-3
3,44
3 2
67,3
44
267
,344
-
GW
RI02
XSIm
plem
etin
g Su
stai
nabl
e W
ater
Res
ourc
e U
NEP
-593
,026
-9
,872
6
52,2
25
49,
327
-310
,675
4
5,08
2 -2
16,2
66
- -2
16,2
66
GW
RI03
XSIm
pact
on
Fres
hwat
er L
ens
in A
toll
envi
ronm
ents
166
,344
2
,769
-
169
,113
-1
9,46
3 -1
6,43
2 1
33,2
18
133
,218
-
GW
RT01
XSTe
stin
g th
e in
tegr
atio
n of
Wat
er, L
and,
For
est &
C -
- -
- -6
7,91
3 3
,368
-6
4,54
5 -
-64,
545
GW
RU01
XSU
NIC
EF K
IRW
ATSA
N P
roje
ct-1
01,9
49
-1,6
97
295
,258
1
91,6
12
-304
,490
1
1,12
0 -1
01,7
58
- -1
01,7
58
GW
RW01
XSPa
cific
Wat
er a
nd C
limat
e Re
sour
ce C
entre
- -
30,
215
30,
215
- -1
,498
2
8,71
7 2
8,71
7 -
GW
RY01
XSPa
cific
Hyd
rolo
gica
l Cyc
le O
bser
ving
Sys
tem
- EU
72,
483
1,2
07
131
,112
2
04,8
02
-66,
068
-10,
806
127
,928
1
27,9
28
-
Suva
- W
ater
Ser
vice
s 3
44,0
73
5,7
28
14,
736
364
,537
-9
8,12
4 -3
1,84
9 2
34,5
64
234
,564
-
GW
SC01
XSC
omm
unity
Par
ticip
atio
n G
ende
r Wat
er S
anita
tion
841
1
4 -
855
-5
48
-61
246
2
46
- G
WSD
01XS
Regi
onal
Wat
er D
eman
d M
anag
emen
t Pro
gram
me
185
,141
3
,082
-
188
,223
-1
4,23
2 -1
8,65
7 1
55,3
34
155
,334
-
GW
SQ01
XSRe
gion
al W
ater
Qua
lity
Mon
itorin
g Pr
ogra
mm
e 8
4,22
6 1
,402
-
85,
628
-71,
262
-5,2
75
9,0
91
9,0
91
- G
WSS
01XS
Regi
onal
Wat
er S
afet
y Pr
ogra
mm
e 5
1,30
1 8
54
- 5
2,15
5 -9
,755
-4
,881
3
7,51
9 3
7,51
9 -
GW
ST01
XSW
aste
wat
er M
anag
emen
t -
- 1
4,73
6 1
4,73
6 -3
43
-714
1
3,67
9 1
3,67
9 -
GW
SW01
XSW
orld
Wat
er D
ay 2
2,56
4 3
76
- 2
2,94
0 -1
,984
-2
,261
1
8,69
5 1
8,69
5 -
Suva
- O
ther
1
36,5
86
2,2
74
12,
250
151
,110
-1
39,3
41
-7,9
82
3,7
87
3,7
87
- G
WZZ
01XS
Mis
c. W
ater
& S
anita
tion
Proj
ects
/ Ac
tiviti
es 1
36,5
86
2,2
74
12,
250
151
,110
-1
39,3
41
-7,9
82
3,7
87
3,7
87
-
LAN
D R
ESO
URC
ES 7
,766
,905
1
29,2
92
6,4
61,2
19
14,
357,
416
-7,5
12,1
78
-760
,167
6
,085
,071
6
,249
,783
-1
64,7
12
Agric
ultu
re &
For
estry
- Su
va 7
,766
,905
1
29,2
92
6,4
61,2
19
14,
357,
416
-7,5
12,1
78
-760
,167
6
,085
,071
6
,249
,783
-1
64,7
12
Suva
- An
imal
Hea
lth &
Pro
duct
ion
-13,
971
-232
4
77,1
16
462
,913
-3
04,1
71
-7,1
16
151
,626
1
51,6
26
- LA
AM01
XSx-
FAO
Ani
mal
Gen
etic
W/s
4,9
14
82
26,
840
31,
836
- -1
,845
2
9,99
1 2
9,99
1 -
LAAZ
07XS
AHP
Mis
cella
neou
s 6
4,20
0 1
,069
1
43,8
88
209
,157
-1
69,4
38
-5,4
47
34,
272
34,
272
- LA
AZ08
XSAn
imal
Was
te M
anag
emen
t pro
ject
s 2
,521
4
2 -
2,5
63
-2,4
19
-144
-
- -
LAAZ
09XS
NZ
Aid
- AH
P-8
5,60
6 -1
,425
2
50,3
61
163
,330
-1
19,1
75
2,4
47
46,
602
46,
602
- LA
AZ10
XSAu
stra
lian
Com
mon
wea
lth A
ssoc
iatio
n C
onfe
renc
e -
- 2
6,62
7 2
6,62
7 -1
3,13
9 -6
69
12,
819
12,
819
- LA
AZ11
XSPa
rave
t Tra
inin
g -
- 2
9,40
0 2
9,40
0 -
-1,4
58
27,
942
27,
942
-
Suva
- Bi
osec
urity
Tra
de 7
38,0
82
12,
286
431
,274
1
,181
,642
-8
10,9
79
-58,
361
312
,302
3
20,5
88
-8,2
86
LABZ
05XS
Cle
an P
acifi
c H
ortic
ultu
ral E
xpor
ts 1
22,5
07
2,0
39
152
,748
2
77,2
94
-90,
303
-15,
909
171
,082
1
71,0
82
- LA
BZ06
XSPa
c H
ortic
ultu
re &
Agr
i Mkt
Acc
ess
(PH
AMA)
610
,992
1
0,17
1 2
64,5
23
885
,686
-6
93,5
57
-42,
623
149
,506
1
49,5
06
- LA
BZ07
XSC
apac
ity B
uild
ing
& in
form
atio
n Tr
ansb
ound
ary
pest
4,5
83
76
14,
003
18,
662
-27,
119
171
-8
,286
-
-8,2
86
Notes to the financial statements

ANNUAL REPORT 2013 31
PRO
JEC
T C
OD
ED
ESC
RIP
TIO
N31
.12.
2012
EXC
H.
VAR
IATI
ON
O
PEN
ING
BAL
REC
EIVE
D
FRO
M
DO
NO
RS
TOTA
L
INC
OM
E E
XPEN
DIT
UR
EEX
CH
. VA
RIA
TIO
N
CLO
SIN
G B
AL31
.12.
2013
FUN
DS
HEL
D
ON
BEH
ALF
OF
DO
NO
RS
FUN
DS
OW
ED
BY D
ON
OR
S
Suva
- C
rop
Prod
uctio
n 1
,355
,865
2
2,57
1 9
54,7
51
2,3
33,1
87
-1,1
90,2
58
-130
,122
1
,012
,807
1
,020
,116
-7
,309
LA
CD
03XS
DSA
P2-E
U-4
60
-8
- -4
68
442
2
6 -
- -
LAC
P01X
SPA
RDI -
Pac
Agr
ibus
ines
s Re
sear
ch fo
r Dev
el In
iti 7
23,9
77
12,
052
168
,551
9
04,5
80
-370
,127
-6
5,71
9 4
68,7
34
468
,734
-
LAC
P02X
SRe
habi
litat
ing
Coc
oa in
Pac
ific
78,
034
1,2
99
187
,238
2
66,5
71
-123
,521
-1
1,32
1 1
31,7
29
131
,729
-
LAC
P03X
SD
evel
opin
g C
apac
ity a
cces
s co
coa
in P
acifi
c 4
2,29
0 7
04
- 4
2,99
4 -2
8,51
7 -3
,009
1
1,46
8 1
1,46
8 -
LAC
P04X
SD
evel
opin
g C
omm
erci
al F
ruit
- Ton
ga 7
4,24
6 1
,236
-
75,
482
-27,
630
-6,3
95
41,
457
41,
457
- LA
CP0
5XS
CTA
Stre
ngth
enin
g D
isse
min
atio
n of
Val
ue C
hain
81,
681
1,3
60
5,8
36
88,
877
-91,
912
-4,2
74
-7,3
09
- -7
,309
LA
CP0
6XS
Und
erst
andi
ng th
e re
spon
se o
f tar
o an
d ca
ssav
a 1
3,51
0 2
25
23,
384
37,
119
-6,5
36
-2,2
48
28,
335
28,
335
- LA
CS0
1XS
Soil
Hea
lth M
anag
emen
t 3
61,0
98
6,0
11
259
,452
6
26,5
61
-249
,931
-3
8,23
7 3
38,3
93
338
,393
-
LAC
Z01X
SVe
geta
tion
and
Land
Cov
er M
appi
ng a
nd Im
prov
ing
Fo-1
8,51
1 -3
08
310
,290
2
91,4
71
-292
,526
1
,055
-
- -
Suva
- D
iver
sity
of A
gric
ultu
re/F
ores
t 3
,109
,632
5
1,76
6 5
99,1
30
3,7
60,5
28
-2,6
89,9
64
-221
,526
8
49,0
38
967
,249
-1
18,2
11
LAD
Z04X
SSP
C/N
FPF
Partn
ersh
ip P
rogr
amm
e 4
4,05
0 7
33
- 4
4,78
3 -
-4,6
07
40,
176
40,
176
- LA
DZ0
5XS
ITTO
Con
sulta
ncy
Fund
s 5
,465
9
1 -
5,5
56
- -5
72
4,9
84
4,9
84
- LA
DZ0
6XS
ANU
Pac
ific
Proj
ects
22,
098
368
-
22,
466
- -2
,311
2
0,15
5 2
0,15
5 -
LAD
Z07X
SFo
rest
Hea
lthSu
rvei
llanc
e 4
2,61
7 7
09
- 4
3,32
6 -
-4,4
57
38,
869
38,
869
- LA
DZ0
8XS
Fore
stry
Aw
ards
33,
551
559
-
34,
110
- -3
,509
3
0,60
1 3
0,60
1 -
LAD
Z09X
SIm
prov
ed U
se o
f Tre
e Re
sour
c 1
46,6
38
2,4
41
46,
408
195
,487
-6
5,28
3 -1
4,40
0 1
15,8
04
115
,804
-
LAD
Z11X
SIm
prov
ing
Valu
e&M
arke
t-AC
IAR
46,
116
768
4
3,31
5 9
0,19
9 -2
5,71
3 -5
,696
5
8,79
0 5
8,79
0 -
LAD
Z14X
SFA
CT-
Faci
litat
ing
Agric
ultu
ral C
omm
odity
Tra
de-1
35,1
51
-2,2
50
- -1
37,4
01
5,3
19
13,
871
-118
,211
-
-118
,211
LA
DZ1
5XS
Fore
stry
-FAO
83,
401
1,3
88
147
,676
2
32,4
65
-141
,649
-9
,021
8
1,79
5 8
1,79
5 -
LAD
Z16X
SIA
CT
- Inc
reas
ing
Agric
ultu
ral C
omm
odity
Tra
de 2
,807
,331
4
6,73
4 4
7 2
,854
,112
-2
,143
,741
-1
87,2
89
523
,082
5
23,0
82
- LA
DZ1
7XS
GIZ
/SPC
- Ja
lesi
- -
41,
650
41,
650
-35,
913
-284
5
,453
5
,453
-
LAD
Z18X
SSP
C/U
ND
P D
raw
a Pr
ojec
t -
- -
- 3
,272
-1
62
3,1
10
3,1
10
- LA
DZ1
9XS
ACIA
R C
ocon
ut R
&D S
trate
gy 1
0,05
6 1
67
- 1
0,22
3 -3
,403
-8
83
5,9
37
5,9
37
-
LAD
Z20X
SSP
C/F
ORE
NET
/PN
GFR
I/FIJ
I BIO
MAS
S SA
MPL
ING
PR
OJE
CT
3,4
60
58
- 3
,518
1
66
-370
3
,314
3
,314
-
LAD
Z21X
SIs
land
Org
anic
/Eth
ical
Tra
de In
itiat
ives
- -
266
,728
2
66,7
28
-231
,165
-1
,764
3
3,79
9 3
3,79
9 -
LAD
Z22X
SBu
ildin
g C
apac
ity o
f You
th in
Org
anic
Agr
icul
ture
- -
53,
306
53,
306
-51,
854
-72
1,3
80
1,3
80
-
Suva
- G
enet
ic R
esou
rces
556
,961
9
,271
1
,308
,814
1
,875
,046
-1
,111
,314
-6
8,04
3 6
95,6
89
695
,689
-
LAG
Z40X
SSw
eetP
otat
o (A
CIA
R) -
- 2
,694
2
,694
-2
,694
-
- -
- LA
GZ0
5XS
LRD
/RG
C T
echn
ical
Ass
ista
nce
78,
433
1,3
06
75,
585
155
,324
-9
2,67
5 -7
,355
5
5,29
4 5
5,29
4 -
LAG
Z22X
SG
erm
plas
m -
FAO
33,
103
551
-
33,
654
-1,6
78
-3,3
79
28,
597
28,
597
- LA
GZ2
5XS
Con
serv
ing
Bana
na D
iver
sity
(Bio
vers
ity)
24,
135
402
-
24,
537
-7,1
68
-2,1
69
15,
200
15,
200
- LA
GZ2
7XS
ACIA
R To
nga
Frui
t Pro
ject
17,
102
285
-
17,
387
- -1
,789
1
5,59
8 1
5,59
8 -
LAG
Z29X
SFA
O G
PA Im
plem
enta
tion
Surv
ey 1
6,71
5 2
78
- 1
6,99
3 -6
,955
-1
,403
8
,635
8
,635
-
LAG
Z31X
SG
loba
l Tru
st R
egen
erat
ion
& Sa
fety
Dup
licat
ion
4,0
36
67
32,
782
36,
885
-842
-2
,006
3
4,03
7 3
4,03
7 -
LAG
Z35X
STr
ust L
ong-
Term
CeP
aCT
Fund
96,
073
1,5
99
63,
125
160
,797
-3
7,37
9 -1
1,32
4 1
12,0
94
112
,094
-
LAG
Z36X
SC
limat
e C
hang
e (A
usAI
D)
11,
617
193
-
11,
810
- -1
,215
1
0,59
5 1
0,59
5 -
Notes to the financial statements

ANNUAL REPORT 2013 32
PRO
JEC
T C
OD
ED
ESC
RIP
TIO
N31
.12.
2012
EXC
H.
VAR
IATI
ON
O
PEN
ING
BAL
REC
EIVE
D
FRO
M
DO
NO
RS
TOTA
L
INC
OM
E E
XPEN
DIT
UR
EEX
CH
. VA
RIA
TIO
N
CLO
SIN
G B
AL31
.12.
2013
FUN
DS
HEL
D
ON
BEH
ALF
OF
DO
NO
RS
FUN
DS
OW
ED
BY D
ON
OR
S
LAG
Z38X
SAd
aptin
g C
lona
lly p
ropa
gate
d C
rops
Clim
atic
cha
nge
-47,
701
-794
6
50,2
97
601
,802
-5
01,4
02
-2,3
95
98,
005
98,
005
- LA
GZ3
9XS
AusA
ID P
hase
II C
limat
e C
hang
e 3
05,1
59
5,0
80
317
,584
6
27,8
23
-333
,961
-3
1,10
2 2
62,7
60
262
,760
-
LAG
Z41X
SIn
dige
nous
veg
etab
le C
ontri
butio
n to
dev
elop
men
t 1
8,28
9 3
04
- 1
8,59
3 -1
2,15
8 -1
,310
5
,125
5
,125
-
LAG
Z42X
SN
Z AI
D -
GR
- -
166
,747
1
66,7
47
-114
,402
-2
,596
4
9,74
9 4
9,74
9 -
Suva
- Ex
tens
ion,
Info
rmat
ion-
Com
mun
icat
ion
Supp
ort
1,7
49
28
2,6
17
4,3
94
2,1
57
-420
6
,131
6
,131
-
LAIZ
01XS
x-SP
C/IF
AD O
rgan
ic P
roje
ct 5
11
8
- 5
19
- -5
3 4
66
466
-
LAIZ
04XS
ICE
Mis
cella
neou
s 2
04
3
- 2
07
-195
-1
2 -
- -
LAIZ
05XS
ICE
Mis
cella
neou
s 1
,034
1
7 2
,617
3
,668
2
,352
-3
55
5,6
65
5,6
65
-
Suva
- Ag
ricul
ture
& F
ores
try S
uppo
rt 1
,145
,411
1
9,06
9 -6
1
,164
,474
-6
71,4
08
-86,
493
406
,573
4
15,4
08
-8,8
35
LALZ
01XS
PRAg
ri &
Fore
stPo
licyN
etw
ork
- -
- -
-9,2
96
461
-8
,835
-
-8,8
35
LALZ
04XS
Reha
b D
egra
ded
Land
s &
Dro
ught
Miti
gatio
n 1
4,81
4 2
47
- 1
5,06
1 -1
,453
-1
,477
1
2,13
1 1
2,13
1 -
LALZ
06XS
Impr
ovem
ent K
ey S
ervi
ces
to A
gric
ultu
re-F
airtr
ade
1,1
30,6
84
18,
823
- 1
,149
,507
-6
60,7
48
-85,
482
403
,277
4
03,2
77
- LA
LZ07
XSIN
TRA
- AC
P Ag
ricul
ture
Pol
icy
Prog
ram
me
-87
-1
-6
-94
89
5
- -
-
Suva
- Pl
ant H
ealth
444
,224
7
,393
4
13,6
36
865
,253
-5
90,3
92
-37,
691
237
,170
2
59,2
41
-22,
071
LAPA
01XS
Taro
Bee
tle M
gmt (
PMP)
306
5
-
311
-2
94
-17
- -
- LA
PA05
XSIP
M S
Prod
Sys
t Bra
ssic
a C
rops
12,
400
206
1
6,79
2 2
9,39
8 -2
,569
-2
,002
2
4,82
7 2
4,82
7 -
LAPZ
07XS
Plan
t Pro
tn M
icro
nesi
a (P
alau
) 3
,745
6
2 -
3,8
07
-1,1
11
-337
2
,359
2
,359
-
LAPZ
08XS
PPM
SPC
-FSM
Mat
chin
g 1
41,7
56
2,3
60
- 1
44,1
16
- -1
4,82
5 1
29,2
91
129
,291
-
LAPZ
09XS
PPM
FSM
Mat
chin
g Fu
nds
22,
520
375
-
22,
895
- -2
,355
2
0,54
0 2
0,54
0 -
LAPZ
10XS
Pac
Ant P
reve
ntio
n Pr
ogra
mm
e 1
0,50
2 1
75
- 1
0,67
7 -
-1,0
98
9,5
79
9,5
79
- LA
PZ13
XSFi
ji Fl
ood
Agric
ultu
re S
ecto
r Reh
abilit
atio
n Pr
og 5
6,29
5 9
37
- 5
7,23
2 -6
,296
-5
,575
4
5,36
1 4
5,36
1 -
LAPZ
15XS
Fiji
papa
ya In
dust
ry A
CIA
R-2
0,39
7 -3
40
164
,620
1
43,8
83
-135
,620
6
95
8,9
58
8,9
58
- LA
PZ16
XSSm
all &
Mic
ro N
urse
ry E
nter
pris
e D
evlp
mt P
roje
ct 3
2,62
5 5
43
- 3
3,16
8 -2
3,22
5 -2
,260
7
,683
7
,683
-
LAPZ
17XS
Cap
acity
bui
ldin
g fo
r the
impl
emen
tatio
n of
MEA
s-1
8,23
9 -3
04
46,
283
27,
740
-52,
002
2,1
91
-22,
071
- -2
2,07
1 LA
PZ18
XSIn
tegr
ated
Cro
p 2
10,4
47
3,5
03
140
,792
3
54,7
42
-332
,154
-1
2,51
9 1
0,06
9 1
0,06
9 -
LAPZ
19XS
NZ
AID
- Pl
ant H
ealth
-7,7
36
-129
4
5,14
9 3
7,28
4 -3
7,12
1 4
11
574
5
74
-
Suva
- O
ffice
of L
RD D
irect
or 4
28,9
52
7,1
40
2,2
73,8
87
2,7
09,9
79
-145
,849
-1
50,3
95
2,4
13,7
35
2,4
13,7
35
- LA
SP01
XSIN
TRA
- AC
P Ag
ricul
ture
Pol
icy
Prog
ram
me
- -
2,1
48,2
77
2,1
48,2
77
-50,
374
-104
,039
1
,993
,864
1
,993
,864
-
LASZ
05XS
LRD
Tec
hnic
al A
ssis
tanc
e Fu
nds
202
,689
3
,374
2
0,86
9 2
26,9
32
-9,1
85
-21,
777
195
,970
1
95,9
70
- LA
SZ06
XSx-
LRD
Tec
h As
sist
ance
Poo
l2 1
02,1
92
1,7
01
- 1
03,8
93
- -1
0,68
8 9
3,20
5 9
3,20
5 -
LASZ
07XS
IFAD
Mis
cella
neou
s 1
3,30
2 2
21
- 1
3,52
3 -
-1,3
91
12,
132
12,
132
- LA
SZ08
XSFA
O M
isce
llane
ous
32,
966
549
-
33,
515
-38
-3,4
46
30,
031
30,
031
- LA
SZ09
XSLR
D A
dmin
istra
tion
91,
234
1,5
19
7,6
59
100
,412
-5
,532
-9
,647
8
5,23
3 8
5,23
3 -
LASZ
11XS
ACIA
R 5
-
22,
816
22,
821
-19,
348
-173
3
,300
3
,300
-
LASZ
12XS
Clim
ate
Cha
nge
Mai
nstre
amin
g-1
3,43
6 -2
24
74,
266
60,
606
-61,
372
766
-
- -
Notes to the financial statements

ANNUAL REPORT 2013 33
PRO
JEC
T C
OD
ED
ESC
RIP
TIO
N31
.12.
2012
EXC
H.
VAR
IATI
ON
O
PEN
ING
BAL
REC
EIVE
D
FRO
M
DO
NO
RS
TOTA
L
INC
OM
E E
XPEN
DIT
UR
EEX
CH
. VA
RIA
TIO
N
CLO
SIN
G B
AL31
.12.
2013
FUN
DS
HEL
D
ON
BEH
ALF
OF
DO
NO
RS
FUN
DS
OW
ED
BY D
ON
OR
S
FISH
ERIE
S, A
QU
ACU
LTU
RE &
MAR
INE
ECO
SYST
EMS
5,1
24,6
77
-1,6
77
12,
321,
618
17,
444,
618
-10,
970,
260
7,4
58
6,4
81,8
16
6,8
74,6
97
-392
,880
C
oast
al F
ishe
ries
Prog
ram
me
- Nou
mea
1,4
83,6
66
- 2
,170
,487
3
,654
,153
-2
,169
,721
-
1,4
84,4
32
1,6
25,7
91
-141
,359
C
oast
al F
ishe
ries
Prog
ram
me
- Nou
mea
1,4
82,0
28
- 2
,170
,487
3
,652
,515
-2
,168
,083
-
1,4
84,4
32
1,6
25,7
91
-141
,359
M
CAZ
01XN
Taip
ei, C
hina
Aqu
a M
arke
t & F
in 1
0,12
2 -
- 1
0,12
2 -2
,642
-
7,4
80
7,4
80
- M
CAZ
04XN
ACIA
R - M
ini-p
roje
cts
69,
450
- 6
0,59
0 1
30,0
40
-30,
339
- 9
9,70
1 9
9,70
1 -
MC
AZ08
XNAq
uacu
lture
Gen
eral
-5
- -
-5
5
- -
- -
MC
AZ09
XNAu
sAID
Mar
icul
ture
46,
152
- 2
69,1
45
315
,297
-2
61,3
14
- 5
3,98
3 5
3,98
3 -
MC
AZ10
XNAu
sAID
Aqu
acul
ture
Fre
shw
ater
32,
849
- 3
28,9
13
361
,762
-3
32,9
12
- 2
8,85
0 2
8,85
0 -
MC
AZ11
XNAC
IAR
FIS
/ 201
0 / 0
57 5
50
- -
550
-3
,399
-
-2,8
49
- -2
,849
M
CAZ
12XN
ACIA
R FI
S / 2
012
/ 076
- -
158
,475
1
58,4
75
-10,
386
- 1
48,0
89
148
,089
-
MC
FM01
XNC
oast
.Fis
herie
s M
gt M
eetg
6,1
35
- -
6,1
35
- -
6,1
35
6,1
35
- M
CFZ
01XN
Reg.
Stra
t Pla
n /C
oast
Fis
h 5
,131
-
- 5
,131
-
- 5
,131
5
,131
-
MC
FZ02
XND
evel
opin
g Ki
ribat
i Eco
syst
em F
ishe
ries
Mgm
t Pro
g 4
,257
-
- 4
,257
-
- 4
,257
4
,257
-
MC
IZ05
XNFi
sher
ies
awar
enes
s m
ater
ial p
rodu
ctio
n 2
,614
-
- 2
,614
-
- 2
,614
2
,614
-
MC
MM
02XN
Hea
ds o
f Fis
herie
s M
eetin
g 6
8,73
0 -
- 6
8,73
0 -4
2,53
9 -
26,
191
26,
191
- M
CM
Z07X
NSP
C-G
IZ C
limat
e C
hang
e C
oast
al 1
4,74
4 -
93,
916
108
,660
-1
18,1
07
- -9
,447
-
-9,4
47
MC
MZ0
8XN
CBF
M fo
r Kiri
bati
- -
24,
028
24,
028
-580
-
23,
448
23,
448
- M
CM
Z09X
NC
BFM
for V
anua
tu -
- -
- -5
80
- -5
80
- -5
80
MC
NP0
2XN
Byca
tch
Mat
eria
ls-P
rodu
ctn
-2,8
81
- -
-2,8
81
2,8
81
- -
- -
MC
NP0
5XN
Reso
urce
s M
ater
ials
8,7
60
- 8
73
9,6
33
-2,2
96
- 7
,337
7
,337
-
MC
NR0
1XN
FAD
Res
earc
h 7
,422
-
32,
370
39,
792
-38,
191
- 1
,601
1
,601
-
MC
NR0
3XN
Fish
SIL
AGE
10,
931
- -
10,
931
-4,7
07
- 6
,224
6
,224
-
MC
NR0
4XN
Spor
t Fis
hing
Dev
elop
men
t 1
4,50
8 -
- 1
4,50
8 -7
,309
-
7,1
99
7,1
99
- M
CN
T01X
NFi
sher
ies
Trai
ning
(NZ)
- -
175
,674
1
75,6
74
-90,
470
- 8
5,20
4 8
5,20
4 -
MC
NT0
8XN
Seaf
ood
qual
ity &
val
ue-a
d 7
,780
-
- 7
,780
-
- 7
,780
7
,780
-
MC
NT0
9XN
Sea
Safe
ty P
roje
cts
9,1
98
- -
9,1
98
- -
9,1
98
9,1
98
- M
CN
T10X
NFi
sher
ies
Offi
cer T
rain
ing
81,
691
- 8
,589
9
0,28
0 -5
2,38
6 -
37,
894
37,
894
- M
CN
Z01X
NAu
sAID
Exp
orts
145
,971
-
300
,687
4
46,6
58
-252
,134
-
194
,524
1
94,5
24
- M
CPZ
02XN
Proc
fish
- Coa
stal
- Ac
p-1
16,2
87
- -
-116
,287
1
16,2
87
- -
- -
MC
PZ03
XNPr
ocfis
h - C
oast
al (P
tom
) 6
3,67
9 -
- 6
3,67
9 -6
3,67
9 -
- -
- M
CPZ
04XN
Pr C
oast
al F
ish
Dvt
Prg
35,
204
- -
35,
204
-35,
204
- -
- -
MC
PZ05
XND
evfis
h-5
,867
-
- -5
,867
5
,867
-
- -
- M
CRZ
06XN
Live
reef
fish
297
,458
-
240
,923
5
38,3
81
-268
,137
-
270
,244
2
70,2
44
- M
CRZ
09XN
Live
Ree
f Fis
h Tr
ade:
Nau
ru &
RM
I - T
aipe
i, C
hina
3,1
69
- -
3,1
69
-3,1
69
- -
- -
MC
ZZ03
XNC
FP G
ener
al P
roje
cts
52,
573
- 5
02
53,
075
10,
196
- 6
3,27
1 6
3,27
1 -
MC
ZZ04
XNC
oast
al C
limat
e C
hang
e Au
sAid
622
-
- 6
22
26,
752
- 2
7,37
4 2
7,37
4 -
MC
NZ1
2XN
Eval
uatio
n of
Eco
Mea
sure
s fo
r Sea
Cuc
umbe
r Fis
h 6
6,33
8 -
45,
431
111
,769
-1
11,7
69
- -
- -
MC
ZZ05
XNBl
dg C
lim R
esilie
nce
& C
oast
Res
Gov
Cap
acity
Fiji
430
,286
-
- 4
30,2
86
-43,
004
- 3
87,2
82
387
,282
-
MC
ZZ06
XNBl
dg C
apac
ity o
f Tok
elau
Coa
st F
ish
Man
ager
s 6
9,10
8 -
- 6
9,10
8 -3
1,00
2 -
38,
106
38,
106
- M
CZZ
07XN
CFP
NZA
ID 2
012
Allo
catio
n 4
1,63
6 -
- 4
1,63
6 -4
1,63
6 -
- -
-
Notes to the financial statements

ANNUAL REPORT 2013 34
PRO
JEC
T C
OD
ED
ESC
RIP
TIO
N31
.12.
2012
EXC
H.
VAR
IATI
ON
O
PEN
ING
BAL
REC
EIVE
D
FRO
M
DO
NO
RS
TOTA
L
INC
OM
E E
XPEN
DIT
UR
EEX
CH
. VA
RIA
TIO
N
CLO
SIN
G B
AL31
.12.
2013
FUN
DS
HEL
D
ON
BEH
ALF
OF
DO
NO
RS
FUN
DS
OW
ED
BY D
ON
OR
S
MC
ZZ08
XNSP
C-IR
D D
eplo
ymen
t of T
empe
ratu
re L
ogge
rs -C
C -
- 1
2,17
2 1
2,17
2 -2
5 -
12,
147
12,
147
- M
CZZ
09XN
CFP
NZA
ID 2
013
Allo
catio
n -
- 2
38,0
18
238
,018
-1
73,4
91
- 6
4,52
7 6
4,52
7 -
MC
ZZ10
XNAu
sAID
Coa
stal
Clim
ate
Cha
nge
Mon
itorin
g Ph
ase
II -
- 1
80,1
81
180
,181
-3
08,6
64
- -1
28,4
83
- -1
28,4
83
PF -
Coa
stal
Fis
herie
s Pr
ogra
mm
e 1
,638
-
- 1
,638
-1
,638
-
- -
- M
CAZ
03PN
PF-A
quac
ultu
re 8
,633
-
- 8
,633
-8
,633
-
- -
- M
CN
Z01P
NPF
-Fis
herie
s D
evel
opm
ent
-160
,274
-
- -1
60,2
74
160
,274
-
- -
- M
CIZ
01PN
PF-F
ishe
ries
Info
rmat
ion
154
,581
-
- 1
54,5
81
-154
,581
-
- -
- M
CM
Z05P
NPF
-Fis
herie
s M
anag
emen
t 6
80
- -
680
-6
80
- -
- -
MC
ZZ03
PNPF
CFP
Gen
eral
-1,9
82
- -
-1,9
82
1,9
82
- -
- -
Coa
stal
Fis
herie
s Pr
ogra
mm
e - S
uva
-100
,762
-1
,677
3
05,4
31
202
,992
-2
43,3
26
7,4
58
-32,
876
- -3
2,87
6 Su
va -
Coa
stal
Fis
herie
s Pr
ogra
mm
e-1
00,7
62
-1,6
77
305
,431
2
02,9
92
-243
,326
7
,458
-3
2,87
6 -
-32,
876
MC
AZ04
XSAq
uacu
lture
Pro
ject
-37,
684
-627
1
05,5
57
67,
246
-82,
925
2,8
19
-12,
860
- -1
2,86
0 M
CAZ
06XS
Nab
ua A
quac
ultu
re M
isce
llane
ous
-63,
078
-1,0
50
199
,874
1
35,7
46
-156
,463
4
,444
-1
6,27
3 -
-16,
273
MC
NZ0
1XS
x-Sa
fety
At S
ea C
on (T
0300
412)
- -
- -
-3,9
38
195
-3
,743
-
-3,7
43
Oce
anic
Fis
herie
s Pr
ogra
mm
e 1
,782
,889
-
6,0
30,0
60
7,8
12,9
49
-5,0
80,7
69
- 2
,732
,180
2
,835
,037
-1
02,8
56
Oce
anic
Fis
herie
s Pr
ogra
mm
e 1
,721
,308
-
6,0
30,0
60
7,7
51,3
68
-5,0
19,1
88
- 2
,732
,180
2
,835
,037
-1
02,8
56
MO
ZZ01
XNO
FP G
ener
al -
Y2K
109
,611
-
11,
763
121
,374
1
1,46
6 -
132
,840
1
32,8
40
- M
OZZ
04XN
Pac.
Fish
.Rec
h.Pr
ogr-0
1-U
oh 1
56,1
68
- 6
0,57
9 2
16,7
47
-11,
458
- 2
05,2
89
205
,289
-
MO
ZZ06
XNRe
gion
al T
aggi
ng P
roje
ct 1
47,5
77
- 5
23,6
70
671
,247
-4
17,3
54
- 2
53,8
93
253
,893
-
MO
ZZ07
XNW
CPF
C 7
9,60
3 -
1,2
13,4
17
1,2
93,0
20
-1,0
09,8
14
- 2
83,2
06
283
,206
-
MO
ZZ09
XNJa
pan
Trus
t Fun
d 1
45,2
00
- 1
72,4
63
317
,663
-8
4,92
9 -
232
,734
2
32,7
34
- M
OZZ
12XN
WC
PFC
RO
P D
ata
Man
agem
ent
141
,592
-
518
,748
6
60,3
40
-469
,447
-
190
,893
1
90,8
93
- M
OZZ
14XN
AusA
ID F
FA A
dvic
e 9
0,40
2 -
250
,883
3
41,2
85
-180
,453
-
160
,832
1
60,8
32
- M
OZZ
17XN
NZA
ID O
bser
ver P
rogr
amm
e 7
05,2
16
- -
705
,216
-5
38,4
27
- 1
66,7
89
166
,789
-
MO
ZZ18
XND
eep
Sea
Snap
per F
PF 2
2,46
8 -
- 2
2,46
8 -2
2,46
8 -
- 1
-
MO
ZZ19
XNAu
sAID
Tun
a M
onito
ring
proj
ect
57,
796
- 5
96,1
44
653
,940
-4
30,9
73
- 2
22,9
67
222
,967
-
MO
ZZ20
XNAu
sAID
Sna
pper
pro
ject
9,1
56
- 3
41,3
02
350
,458
-4
15,5
23
- -6
5,06
5 -
-65,
065
MO
ZZ21
XNSP
C-G
IZ C
limat
e C
hang
e O
cean
ic 1
5,06
8 -
252
,338
2
67,4
06
-261
,200
-
6,2
06
6,2
06
- M
OEZ
01XN
OFP
- SC
IFIS
H -A
CP
-16,
579
- 1
6,57
9 -
- -
- -
- M
OEZ
02XN
OFP
- SC
IFIS
H -O
CT
8,4
80
- -8
,480
-
- -
- -
- M
OZZ
22XN
Con
nais
sanc
e de
l’es
pace
Mar
itim
e de
la N
C 1
,320
-
68,
213
69,
533
-80,
288
- -1
0,75
5 -
-10,
755
MO
ZZ23
XNPr
ogra
mm
e O
bser
vate
ur P
olyn
ésie
Fra
nçai
se-8
2,66
2 -
276
,727
1
94,0
65
-199
,649
-
-5,5
84
- -5
,584
M
OZZ
25XN
PNA
Scie
ntifi
c Su
ppor
t - P
EW 1
42,1
31
- 3
71,5
02
513
,633
-3
97,8
32
- 1
15,8
01
115
,801
-
MO
ZZ26
XNBM
IS D
evel
opm
ent (
ISF/
WW
F fu
ndin
g)-6
8 -
17,
652
17,
584
-19,
832
- -2
,248
-
-2,2
48
MO
ZZ27
XNAA
MP
Cha
ract
eriz
atio
n of
NC
Pel
agic
Eco
syst
ems
-11,
171
- 2
8,64
0 1
7,46
9 -3
6,67
3 -
-19,
204
- -1
9,20
4 M
OZZ
28XN
OFP
NZA
ID S
ervi
ces
2013
- -
330
,154
3
30,1
54
-220
,844
-
109
,310
1
09,3
10
- M
OZZ
29XN
NZ
Tuna
Sci
ence
& In
form
atio
n Se
rvic
es 2
013-
2015
- -
683
,061
6
83,0
61
-199
,647
-
483
,414
4
83,4
14
-
Notes to the financial statements

ANNUAL REPORT 2013 35
PRO
JEC
T C
OD
ED
ESC
RIP
TIO
N31
.12.
2012
EXC
H.
VAR
IATI
ON
O
PEN
ING
BAL
REC
EIVE
D
FRO
M
DO
NO
RS
TOTA
L
INC
OM
E E
XPEN
DIT
UR
EEX
CH
. VA
RIA
TIO
N
CLO
SIN
G B
AL31
.12.
2013
FUN
DS
HEL
D
ON
BEH
ALF
OF
DO
NO
RS
FUN
DS
OW
ED
BY D
ON
OR
S
MO
ZZ30
XNM
arie
Cur
ie A
dvan
ces
Mod
els
4 Fi
sher
ies
(AM
FISA
LS)
- -
214
,926
2
14,9
26
-28,
124
- 1
86,8
02
186
,802
-
MO
ZZ31
XNFP
F Bi
oeco
nom
ic m
odel
ling
- -
46,
539
46,
539
- -
46,
539
46,
539
- M
OZZ
32XN
ISSF
Ele
ctro
nic
Mon
itorin
g Tr
ials
- -
43,
240
43,
240
-5,7
19
- 3
7,52
1 3
7,52
1 -
PF -
Oce
anic
Fis
herie
s Pr
ogra
mm
e 6
1,58
1 -
- 6
1,58
1 -6
1,58
1 -
- -
- M
OZZ
08PN
PF-O
cean
ic F
ishe
ries
61,
581
- -
61,
581
-61,
581
- -
- -
Mar
ine
Reso
urce
s Ex
tern
al P
roje
ct 1
49,8
31
- -
149
,831
-1
7,82
6 -
132
,005
1
78,3
79
-46,
374
MXC
Z01X
NC
RISP
- Fo
nds
Paci
fique
-44,
371
- -
-44,
371
-68
- -4
4,43
9 -
-44,
439
MXC
Z02X
NC
RISP
Fra
nce
9,8
76
- -
9,8
76
-179
-
9,6
97
9,6
97
- M
XCZ0
3XN
FFEM
_PC
C 2
11,5
61
- -
211
,561
-4
2,87
9 -
168
,682
1
68,6
82
- M
XCZ0
4XN
CRI
SP E
xtra
-1,9
35
- -
-1,9
35
- -
-1,9
35
- -1
,935
M
XWZ1
1XN
Wor
ldFi
sh C
lose
dow
n-2
5,30
0 -
- -2
5,30
0 2
5,30
0 -
- -
-
All M
arin
e Re
sour
ces
1,8
09,0
53
- 3
,815
,640
5
,624
,693
-3
,458
,618
-
2,1
66,0
75
2,2
35,4
90
-69,
415
MZZ
Z01P
NO
ffice
of t
he D
irect
or o
f Fam
e 8
17
- -
817
-8
17
- -
- -
MZZ
Z01X
NAu
sAID
Mar
ine
Reso
urce
s Pr
ojec
t 2
1,83
0 -
- 2
1,83
0 -7
2,71
2 -
-50,
882
- -5
0,88
2 M
ZZZ0
2XN
SciC
OFi
sh P
roje
ct -
Coa
stal
& O
cean
ic Y
EAR
1-2
,230
-
- -2
,230
-4
2 -
-2,2
72
- -2
,272
M
ZZZ0
3XN
Dev
Fish
Pha
se II
557
,499
-
784
,644
1
,342
,143
-5
91,6
32
- 7
50,5
11
750
,511
-
MZZ
Z04X
NSc
iCO
Fish
Pro
ject
- C
oast
al &
Oce
anic
YEA
R 2
-16,
304
- -
-16,
304
43
- -1
6,26
1 -
-16,
261
MZZ
Z06X
NSc
iCO
Fish
Pro
ject
- C
oast
al &
Oce
anic
YEA
R 3
1,0
06,5
51
- 2
93,1
01
1,2
99,6
52
-1,2
07,4
96
- 9
2,15
6 9
2,15
6 -
MZZ
Z05X
NAu
sAID
CC
Sup
port
- Fis
herie
s 1
98,1
79
- 3
43,8
06
541
,985
-5
28,1
75
- 1
3,81
0 1
3,81
0 -
MZZ
Z07X
NFP
F - O
CT
Parti
cipa
tion
in F
ishe
ries
42,
711
- 3
8,18
6 8
0,89
7 -3
8,24
4 -
42,
653
42,
653
- M
ZZZ0
8XN
SciC
OFi
sh P
roje
ct -
Coa
stal
& O
cean
ic Y
EAR
4 -
- 2
,355
,903
2
,355
,903
-1
,019
,543
-
1,3
36,3
60
1,3
36,3
60
-
EDU
CAT
ION
, TRA
ININ
G &
HU
MAN
DEV
ELO
PMEN
T 2
,811
,269
3
6,61
3 4
,155
,476
7
,003
,358
-5
,276
,484
-2
16,2
07
1,5
10,6
67
1,9
93,2
37
-482
,570
H
uman
Dev
elop
men
t Pro
gram
me
596
,518
-2
58
396
,356
9
92,6
16
-1,2
34,5
23
1,3
92
-240
,515
8
8,78
8 -3
29,3
03
Hum
an D
evel
opm
ent P
rogr
amm
e 5
18,3
39
- 7
9,00
0 5
97,3
39
-828
,055
-
-230
,716
4
6,05
5 -2
76,7
71
SDC
R01X
NC
ultu
ral S
trate
gy-6
-
- -6
6
-
- -
- SD
CZ0
2XN
Affa
ires
Cul
ture
lles
- NC
60,
000
- -
60,
000
-60,
000
- -
- -
SDC
Z04X
NC
ultu
ral D
evel
opm
ent
18,
755
- -
18,
755
-12,
531
- 6
,224
6
,224
-
SDC
Z05X
NSu
ppor
ting
the
Cul
t Sec
tor f
or S
usta
in E
co &
HD
P 3
7,69
0 -
- 3
7,69
0 -3
1,50
1 -
6,1
89
6,1
89
- SD
WZ0
2XN
Fren
ch P
acifi
c Fu
nds
19,
864
- -
19,
864
-8,0
33
- 1
1,83
1 1
1,83
1 -
SDW
Z03X
NPr
ojet
Uni
on d
es F
emm
es F
ranc
opho
nes
d’O
utre
Mer
46,
594
- 5
6,08
5 1
02,6
79
-86,
536
- 1
6,14
3 1
6,14
3 -
SDYZ
01XN
P.Y.
R.B.
- N
ew C
aled
onia
19,
265
- -
19,
265
-19,
265
- -
- -
SDYZ
07XN
PYB
Mis
cella
neou
s 5
21
- -
521
-5
21
- -
- -
SDZZ
01XN
Soci
o Ec
o Sh
ared
-7,0
73
- 7
,073
-
- -
- -
- SD
ZZ03
XN10
th F
estiv
al o
f Pac
ific
Arts
-1,0
48
- 1
,048
-
- -
- -
- SD
ZZ04
XNSP
C-U
NES
CO
Eva
luat
ion
of th
e Fe
stiv
al o
f Arts
619
-
-619
-
- -
- -
- SD
ZZ05
XNSP
C -U
NIF
EM G
ende
r Cap
acity
Sto
ckta
ke-5
57
- 5
57
- -
- -
- -
Notes to the financial statements

ANNUAL REPORT 2013 36
PRO
JEC
T C
OD
ED
ESC
RIP
TIO
N31
.12.
2012
EXC
H.
VAR
IATI
ON
O
PEN
ING
BAL
REC
EIVE
D
FRO
M
DO
NO
RS
TOTA
L
INC
OM
E E
XPEN
DIT
UR
EEX
CH
. VA
RIA
TIO
N
CLO
SIN
G B
AL31
.12.
2013
FUN
DS
HEL
D
ON
BEH
ALF
OF
DO
NO
RS
FUN
DS
OW
ED
BY D
ON
OR
S
SDZZ
08XN
HD
P Be
ijing
+ 15
Rev
iew
Rep
ort
-7
- 7
-
- -
- -
- SD
ZZ09
XNH
DP
Mis
cella
neou
s 6
98
- -8
,192
-7
,494
7
,494
-
- -
- SD
ZZ11
XNLi
fuka
Isla
nd C
limat
e C
hang
e 3
30,2
20
- 1
,726
3
31,9
46
-326
,278
-
5,6
68
5,6
68
- SD
ZZ13
XNRe
gion
al fr
amew
ork
on Y
outh
Dev
elop
men
t in
Paci
fic-7
,196
-
21,
315
14,
119
-14,
119
- -
- -
SDZZ
14XN
Prog
ress
ing
Gen
der E
qual
ity in
PIC
Ts -
- -
- -2
76,7
71
- -2
76,7
71
- -2
76,7
71
PF -
Hum
an D
evel
opm
ent P
rogr
amm
e 9
3,62
0 -
- 9
3,62
0 -9
3,62
0 -
- -
- SD
ZZ01
PNH
uman
Dev
elop
men
t Pro
gram
me
93,
620
- -
93,
620
-93,
620
- -
- -
Suva
- C
ultu
re D
evel
opm
ent
-73,
854
-1,2
30
235
,210
1
60,1
26
-212
,969
6
,621
-4
6,22
2 6
50
-46,
872
SDC
Z01X
SC
ultu
ral D
evel
opm
ent
8,1
94
136
4
,649
1
2,97
9 -6
1,83
0 1
,979
-4
6,87
2 -
-46,
872
SDC
Z02X
SH
DP
Mis
cella
neou
s-4
4,71
2 -7
44
43,
592
-1,8
64
- 2
,514
6
50
650
-
SDZZ
11XS
Asse
ssin
g Vu
lner
abilit
y an
d Ad
apta
tion
-37,
336
-622
1
86,9
69
149
,011
-1
51,1
39
2,1
28
- -
-
Suva
- Yo
uth
Dev
elop
men
t Bur
eau
58,
413
972
8
2,14
6 1
41,5
31
-99,
879
-5,2
29
36,
423
42,
083
-5,6
60
SDYZ
06XS
HD
P Pa
cific
You
th C
ounc
il 5
0,22
8 8
36
30,
757
81,
821
-35,
152
-5,0
35
41,
634
41,
634
- SD
YZ07
XSPL
P - A
usAI
D P
acifi
c Le
ader
ship
Pro
gram
me
7,6
93
128
5
1,38
9 5
9,21
0 -6
4,72
7 -1
43
-5,6
60
- -5
,660
SD
YZ08
XSH
DP/
Yout
h 4
92
8
- 5
00
- -5
1 4
49
449
-
Com
mun
ity E
duca
tion
Trai
ning
Cen
tre 3
09,3
92
5,1
52
141
,561
4
56,1
05
-134
,195
-3
2,72
3 2
89,1
87
289
,187
-
SDTT
04XS
Proj
ect M
anag
emen
t Tra
inin
g 1
3,89
4 2
31
- 1
4,12
5 -7
,219
-1
,095
5
,811
5
,811
-
SDTZ
03XS
Gra
duat
e Pr
ojec
t Fun
d 2
8,46
1 4
74
3,0
16
31,
951
-30,
329
-1,6
22
- -
- SD
TZ04
XSBu
ildin
g Im
prov
emen
t & M
aint
15,
539
259
-
15,
798
- -1
,625
1
4,17
3 1
4,17
3 -
SDTZ
07XS
Nor
ther
n Pa
cific
Tra
inin
g TR
OC
6,9
75
116
-
7,0
91
-1,4
70
-657
4
,964
4
,964
-
SDTZ
08XS
Com
mun
ity E
d Tr
aini
ng M
isc
183
,914
3
,062
8
7,70
4 2
74,6
80
-20,
535
-22,
565
231
,580
2
31,5
80
- SD
TZ09
XSM
SME
Cap
acity
Bui
ldin
g-5
,966
-9
9 8
,374
2
,309
-2
,390
3
27
246
2
46
- SD
TZ11
XSN
atio
nal L
evel
Act
iviti
es 2
3,35
1 3
89
- 2
3,74
0 -2
2,40
9 -1
,331
-
- -
SDTZ
12XS
Busi
ness
Adv
isor
y 2
,935
4
9 -
2,9
84
- -3
07
2,6
77
2,6
77
- SD
TZ13
XSIn
form
atio
n N
etw
ork
- -
- -
564
-2
8 5
36
536
-
SDTZ
14XS
Hea
lthy
Life
styl
e Pr
ojec
t 1
1,32
6 1
89
- 1
1,51
5 -1
,652
-1
,103
8
,760
8
,760
-
SDTZ
15XS
Com
mun
ity E
duca
tion
Trai
ning
- O
pera
tiona
l 2
8,96
3 4
82
42,
467
71,
912
-48,
755
-2,7
17
20,
440
20,
440
-
Regi
onal
Rig
hts
Reso
urce
Tea
m 1
,209
,551
2
0,13
6 1
,463
,618
2
,693
,305
-2
,246
,692
-8
7,66
4 3
58,9
49
398
,416
-3
9,46
7 SR
RZ01
XSRR
RT-S
mal
l Gra
nts
31,
834
530
9
29
33,
293
-7,7
20
-2,9
93
22,
580
22,
580
- SR
RZ02
XSRR
RT-N
Z AI
D-2
,884
-4
8 -
-2,9
32
2,7
68
164
-
- -
SRRZ
03XS
RRRT
-Aus
AID
891
,175
1
4,83
5 9
67,1
23
1,8
73,1
33
-1,7
22,4
33
-55,
744
94,
956
94,
956
- SR
RZ05
XSRR
RT-U
N T
rust
Fun
d 4
,342
7
2 -
4,4
14
-4,1
67
-247
-
- -
SRRZ
06XS
RRRT
-Pac
Isla
nd H
IV a
nd S
TI R
espo
nse
Fund
69,
132
1,1
51
33,
810
104
,093
-4
2,65
5 -6
,791
5
4,64
7 5
4,64
7 -
SRRZ
07XS
RRRT
-Uni
vers
al P
erio
dic
Revi
ew-9
71
-16
- -9
87
932
5
5 -
- -
SRRZ
08XS
EU/E
RT/R
RRT/
Solo
mon
Isla
nds
Pro
ject
-4,1
10
-68
- -4
,178
-3
7,58
3 2
,294
-3
9,46
7 -
-39,
467
Notes to the financial statements

ANNUAL REPORT 2013 37
PRO
JEC
T C
OD
ED
ESC
RIP
TIO
N31
.12.
2012
EXC
H.
VAR
IATI
ON
O
PEN
ING
BAL
REC
EIVE
D
FRO
M
DO
NO
RS
TOTA
L
INC
OM
E E
XPEN
DIT
UR
EEX
CH
. VA
RIA
TIO
N
CLO
SIN
G B
AL31
.12.
2013
FUN
DS
HEL
D
ON
BEH
ALF
OF
DO
NO
RS
FUN
DS
OW
ED
BY D
ON
OR
S
SRRZ
09XS
PLP-
Lob
byin
g57
685
960
140
809
199
454
-169
689
-4 6
0125
164
25
164
-SR
RZ10
XSPL
P - C
urric
ulum
118
,198
1
,968
-6
3,24
5 5
6,92
1 -5
0,18
5 -6
,736
-
- -
SRRZ
11XS
PLP
- Cur
ricul
um 4
5,15
0 7
52
12,
265
58,
167
-54,
062
-2,6
49
1,4
56
1,4
56
- SR
RZ12
XSPa
cific
Fun
d to
End
Vio
lenc
e Ag
ains
t Wom
en -
- 1
36,7
27
136
,727
-9
9,53
2 -1
,845
3
5,35
0 3
5,35
0 -
SRRZ
13XS
Paci
fic Is
ratifi
catio
n-hu
man
righ
ts tr
eatie
s -P
IFS
- -
235
,200
2
35,2
00
-62,
366
-8,5
71
164
,263
1
64,2
63
-
Suva
- So
uth
Paci
fic B
oard
for E
duca
tiona
l Ass
essm
ent
695
,806
1
1,58
3 2
,153
,941
2
,861
,330
-1
,661
,074
-9
7,21
2 1
,103
,044
1
,216
,844
-1
13,8
00
HEA
C01
XSPr
ojec
ts 1
83,6
54
3,0
57
53,
988
240
,699
-4
5,72
6 -1
9,61
7 1
75,3
56
175
,356
-
HEB
R01X
SPa
cific
Ben
chm
arki
ng fo
r Edu
catio
n Re
sults
416
,497
6
,933
4
93,2
60
916
,690
-6
94,3
25
-33,
587
188
,778
1
88,7
78
- H
ELN
01XS
Lite
racy
and
Num
erac
y-2
7,36
2 -4
55
1,3
64,5
46
1,3
36,7
29
-557
,971
-3
7,13
8 7
41,6
20
741
,620
-
HEP
M01
XSSP
C S
PBEA
Mer
ger
11,
986
200
-
12,
186
- -1
,254
1
0,93
2 1
0,93
2 -
HEQ
R01X
SPa
cific
Qua
lifica
tion
Regi
ster
46,
729
778
1
28,6
03
176
,110
-2
93,1
85
3,2
75
-113
,800
-
-113
,800
H
ERM
01XS
Rese
arch
, Mon
itorin
g &
Eval
uatio
n - L
ANA(
MO
E-Fi
ji) 9
,696
1
61
- 9
,857
-
-1,0
14
8,8
43
8,8
43
- H
ESS0
1XS
Scho
lars
hip
54,
606
909
1
13,5
44
169
,059
-6
9,86
7 -7
,877
9
1,31
5 9
1,31
5 -
PUBL
IC H
EALT
H D
IVIS
ION
13,
275,
292
-50,
950
15,
833,
246
29,
057,
588
-22,
271,
052
385
,043
7
,171
,579
7
,629
,300
-4
57,7
21
Publ
ic H
ealth
Div
isio
n 7
,457
,090
-5
0,21
1 7
,284
,652
1
4,69
1,53
1 -1
2,01
2,75
6 3
91,1
14
3,0
69,8
89
3,1
80,2
51
-110
,362
Pu
blic
Hea
lth D
ivis
ion
7,2
80,6
80
-50,
211
7,2
84,6
52
14,
515,
121
-11,
836,
346
391
,114
3
,069
,889
3
,180
,251
-1
10,3
62
ALL
SHAF
Resp
onse
Fun
d 5
,606
,698
-5
0,21
1 4
,046
,842
9
,603
,329
-8
,369
,549
3
91,1
14
1,6
24,8
94
1,6
24,8
94
- SH
AZ03
XNAI
DS
- Joi
nt P
roj.-
Fra
nce
439
-
- 4
39
- -
439
4
39
- SH
AZ05
XNG
F-Fu
nded
HIV
Act
iviti
es
-56,
397
- 2
15,0
52
158
,655
-1
31,9
72
- 2
6,68
3 2
6,68
3 -
SHAZ
06XN
HIV
/ AI
DS
ADB
37,
048
- -
37,
048
- -
37,
048
37,
048
- SH
GZ0
1XN
Glo
bal F
und
Hea
lth P
roje
ct
8,9
23
- 1
,005
,196
1
,014
,119
-1
,080
,703
-
-66,
584
- -6
6,58
4 SH
HZ0
8XN
AusA
ID /
NZA
id P
acifi
c N
CD
Pro
ject
8
81,6
65
- -
881
,665
-4
74,7
44
- 4
06,9
21
406
,921
-
SHH
Z10X
NC
omm
onw
ealth
Sec
reta
riat D
iabe
tes
Wor
ksho
p -
- -
- 4
1,07
6 -
41,
076
41,
076
- SH
MS0
1XN
Join
t Sec
reta
riat
- -
202
,139
2
02,1
39
-145
,648
-
56,
491
56,
491
- SH
MZ0
3XN
PHP
Man
agem
ent M
isce
llane
ous
22,
420
- -
22,
420
-420
-
22,
000
22,
000
- SH
SI01
XNIN
FLU
ENZA
SU
RVEI
LL. -
CD
C
-21
- -
-21
21
- -
- -
SHSI
03XN
Vect
or S
urve
illanc
e &
Con
trol
-3,8
41
- -
-3,8
41
- -
-3,8
41
- -3
,841
SH
SI04
XNIn
fluen
za S
urve
illanc
e N
etw
orks
5
,243
-
362
,877
3
68,1
20
-184
,675
-
183
,445
1
83,4
45
- SH
SL01
XNLa
b Sh
ippi
ng C
osts
7
,034
-
- 7
,034
-3
49
- 6
,685
6
,685
-
SHSP
01XN
PPH
S- P
RIPP
P - A
US
/ NZ
59,
973
- -
59,
973
-59,
973
- -
- -
SHSP
03XN
PPH
S - P
RIPP
P - A
US/
NZ
FIJ
I CO
STS
-208
,033
-
- -2
08,0
33
208
,033
-
- -
- SH
SZ08
XNIn
crea
sed
Und
erst
dg th
e H
ealth
Impl
icat
of C
lim C
h 1
71,3
88
- 1
73,5
46
344
,934
-3
21,6
12
- 2
3,32
2 2
3,32
2 -
SHSZ
09XN
DU
SO
R - R
OSS
P PP
HSN
+ 3
6,00
1 -
184
,964
2
20,9
65
-95,
541
- 1
25,4
24
125
,424
-
SHSZ
10XN
SOR
PPH
S N
etw
ork
of S
ervi
ces
18
- 3
83,9
00
383
,918
-3
49,4
97
- 3
4,42
1 3
4,42
1 -
SHSZ
11XN
Impr
ovin
g Pu
blic
Hea
lth D
ata
Cap
acity
in th
e PI
- -
85,
974
85,
974
-16
- 8
5,95
8 8
5,95
8 -
SHSZ
12XN
Emer
genc
y as
sist
ance
to F
P - Z
ika
- -
35,
000
35,
000
-6,2
53
- 2
8,74
7 2
8,74
7 -
SHTZ
01XN
Tube
rcul
osis
Con
trol-F
ranc
e 1
0,42
1 -
- 1
0,42
1 -6
,790
-
3,6
31
3,6
31
- SH
TZ02
XNTB
- G
loba
l Fun
d -1
67,0
29
- 4
75,3
09
308
,280
-1
52,8
75
- 1
55,4
05
155
,405
-
SHTZ
05XN
TB K
iriba
ti (A
usAI
D)
-43,
667
- -2
,654
-4
6,32
1 4
5,31
8 -
-1,0
03
- -1
,003
Notes to the financial statements

ANNUAL REPORT 2013 38
PRO
JEC
T C
OD
ED
ESC
RIP
TIO
N31
.12.
2012
EXC
H.
VAR
IATI
ON
O
PEN
ING
BAL
REC
EIVE
D
FRO
M
DO
NO
RS
TOTA
L
INC
OM
E E
XPEN
DIT
UR
EEX
CH
. VA
RIA
TIO
N
CLO
SIN
G B
AL31
.12.
2013
FUN
DS
HEL
D
ON
BEH
ALF
OF
DO
NO
RS
FUN
DS
OW
ED
BY D
ON
OR
S
SHTZ
08XN
TB -
Dia
bete
s Jo
int S
tudy
Kiri
bati
11,
105
- 9
32
12,
037
-10,
608
- 1
,429
1
,429
-
SHTZ
09XN
Tow
ards
TB
Elim
inat
ion
in K
iriba
ti 7
01,8
23
- -2
,491
6
99,3
32
-440
,546
-
258
,786
2
58,7
86
- SH
TZ10
XNPa
cific
Ope
ratio
nal R
esea
rch
Cou
rse
-20,
531
- 7
8,06
6 5
7,53
5 -9
6,46
9 -
-38,
934
- -3
8,93
4 SH
ZZ02
XN20
12 P
ostp
oned
Act
iviti
es 2
20,0
00
- -
220
,000
-2
02,5
54
- 1
7,44
6 1
7,44
6 -
SHZZ
04XN
GM
U -
Com
mitm
ents
- -
40,
000
40,
000
- -
40,
000
40,
000
-
PF -
Publ
ic H
ealth
Div
isio
n 1
76,4
10
- -
176
,410
-1
76,4
10
- -
- -
SHH
Z05P
NPF
-Hea
lth A
dvan
cem
ent N
CD
9,9
80
- -
9,9
80
-9,9
80
- -
- -
SHM
Z01P
NH
ealth
Man
agem
ent
9,8
18
- -
9,8
18
-9,8
18
- -
- -
SHAZ
08PN
PF H
IV /
AID
S -1
80
- -
-180
1
80
- -
- -
SHSZ
05PN
PF-P
ublic
Hea
lth S
urve
ill’
212
,654
-
- 2
12,6
54
-212
,654
-
- -
- SH
TZ06
PNPF
-Tub
ercu
losi
s -5
5,86
2 -
- -5
5,86
2 5
5,86
2 -
- -
-
Publ
ic H
ealth
Div
isio
n - S
uva
-44,
301
-739
1
,513
,262
1
,468
,222
-1
,297
,421
-6
,071
1
64,7
30
512
,089
-3
47,3
59
Suva
- H
IV /
AID
S Se
ctio
n 6
6,37
7 1
,104
8
51,4
94
918
,975
-6
39,6
00
-17,
451
261
,924
3
59,5
86
-97,
662
SHAR
08XN
HIV
SG
S Su
rv R
OC
1 - M
I-9
32
-16
- -9
48
- 9
7 -8
51
- -8
51
SHAZ
02XS
HIV
AID
S- N
ZAID
117
,094
1
,949
-
119
,043
-2
2,58
5 -1
1,12
6 8
5,33
2 8
5,33
2 -
SHAZ
03XS
HIV
-Glo
bal F
und
8,2
47
137
6
85,9
58
694
,342
-4
05,3
07
-14,
781
274
,254
2
74,2
54
- SH
AZ06
XSRF
Tre
atm
ent &
Car
e G
rant
640
1
1 1
13,6
46
114
,297
-1
15,6
04
30
-1,2
77
- -1
,277
SH
AZ07
XSH
IV G
ener
al M
anag
emen
t-5
8,67
2 -9
77
51,
890
-7,7
59
-96,
104
8,3
29
-95,
534
- -9
5,53
4
Suva
- G
loba
l Fun
d Pr
ojec
t-4
8,03
0 -8
00
79,
668
30,
838
-177
,182
9
,859
-1
36,4
85
13,
437
-149
,922
SH
GM
02XS
x-G
loba
l Fun
d M
eetin
g PI
RCC
mee
t2-6
1,48
9 -1
,024
7
9,66
8 1
7,15
5 -1
78,4
04
11,
327
-149
,922
-
-149
,922
SH
GM
03XS
x-PP
RSH
N C
INET
Wor
ksho
p 1
4,73
3 2
45
- 1
4,97
8 -
-1,5
41
13,
437
13,
437
- SH
GZ0
1XN
Glo
bal F
und
Hea
lth P
roje
ct-1
,274
-2
1 -
-1,2
95
1,2
22
73
- -
-
Suva
- H
ealth
Man
agem
ent
-215
,987
-3
,596
5
60,1
95
340
,612
-4
57,9
03
17,
516
-99,
775
- -9
9,77
5 SH
MS0
1XS
Join
t Sec
reta
riat
-215
,987
-3
,596
5
60,1
95
340
,612
-4
57,9
03
17,
516
-99,
775
- -9
9,77
5
Suva
- H
ealth
Pro
mot
ions
65,
246
1,0
86
21,
905
88,
237
- -7
,910
8
0,32
7 8
0,32
7 -
SHPZ
01PS
Hea
lth P
rom
otio
ns -
- -
- -
SHPZ
01XS
Bloo
mbe
rg T
FK T
obac
co P
roje
ct 6
5,24
6 1
,086
2
1,90
5 8
8,23
7 -
-7,9
10
80,
327
80,
327
-
Suva
- Ad
oles
cent
Hea
lth D
evel
opm
ent
26,
303
438
-
26,
741
-25,
242
-1,4
99
- -
- SH
RZ11
XSAH
D-P
ac R
egio
nal S
trate
gic
Impl
emen
tatio
n pl
an II
26,
303
438
-
26,
741
-25,
242
-1,4
99
- -
-
Suva
- Pu
blic
Hea
lth S
urve
illanc
e 6
1,79
0 1
,029
-
62,
819
2,5
06
-6,5
86
58,
739
58,
739
- SH
SI01
XSIN
FLU
ENZA
SU
RVEI
LL. -
CD
C 6
1,79
0 1
,029
-
62,
819
2,5
06
-6,5
86
58,
739
58,
739
-
Notes to the financial statements
ANNUAL REPORT 2013 39
PRO
JEC
T C
OD
ED
ESC
RIP
TIO
N31
.12.
2012
EXC
H.
VAR
IATI
ON
O
PEN
ING
BAL
REC
EIVE
D
FRO
M
DO
NO
RS
TOTA
L
INC
OM
E E
XPEN
DIT
UR
EEX
CH
. VA
RIA
TIO
N
CLO
SIN
G B
AL31
.12.
2013
FUN
DS
HEL
D
ON
BEH
ALF
OF
DO
NO
RS
FUN
DS
OW
ED
BY D
ON
OR
S
Glo
bal F
und
5
,862
,503
-
7,0
35,3
32
12,
897,
835
-8,9
60,8
75
- 3
,936
,960
3
,936
,960
-
Glo
bal F
und
5,8
62,5
03
- 7
,035
,332
1
2,89
7,83
5 -8
,960
,875
-
3,9
36,9
60
3,9
36,9
60
-
ECO
NO
MIC
DEV
ELO
PMEN
T D
IVIS
ION
6,3
88,7
52
105
,736
8
,819
,930
1
5,31
4,41
8 -7
,436
,465
-7
32,8
81
7,1
45,0
72
7,1
46,8
25
-1,7
53
All N
oum
ea
37,
155
- -
37,
155
-146
-
37,
009
38,
762
-1,7
53
All N
oum
ea
37,
155
- -
37,
155
-146
-
37,
009
38,
762
-1,7
53
TEFZ
02XN
Ener
gy G
ener
al -
- -
- -1
46
- -1
46
- -1
46
TERZ
01XN
Rene
wab
le E
nerg
y Ef
ficie
ncy
Proj
ect (
Nor
th R
ep)
-1,6
07
- -
-1,6
07
- -
-1,6
07
- -1
,607
TE
RZ02
XNTe
pver
tes
Mee
ting
38,
762
- -
38,
762
- -
38,
762
38,
762
-
Paci
fic D
igita
l Stra
tegy
-48,
068
-800
7
1,65
3 2
2,78
5 -2
5,52
5 2
,740
-
- -
Suva
- IC
T Ac
cess
-7
9,46
2 -1
,323
7
1,65
3 -9
,132
4
,603
4
,529
-
- -
TDAZ
01XS
ICT
Gen
eral
21,
849
364
9
,480
3
1,69
3 -3
0,44
8 -1
,245
-
- -
TDAZ
03XS
ICT
Acce
ss fo
r the
Poo
r - E
U-1
01,3
11
-1,6
87
62,
173
-40,
825
35,
051
5,7
74
- -
-
Con
nect
ivity
3
1,39
4 5
23
- 3
1,91
7 -3
0,12
8 -1
,789
-
- -
TDC
Z01X
SVS
AT s
atel
lite
term
inal
s di
strib
utio
n 3
1,39
4 5
23
- 3
1,91
7 -3
0,12
8 -1
,789
-
- -
Ener
gy
4,1
42,3
07
68,
958
7,0
42,2
98
11,
253,
563
-6,1
29,0
54
-478
,501
4
,646
,008
4
,646
,008
-
Suva
- Pe
trole
um &
Liq
uid
Fuel
s 8
12,2
50
13,
522
768
,662
1
,594
,434
-5
16,1
49
-97,
470
980
,815
9
80,8
15
- TE
FZ01
XSEn
ergy
Gen
eral
240
,284
4
,000
5
2,65
9 2
96,9
43
-88,
483
-23,
353
185
,107
1
85,1
07
- TE
EZ01
XSPa
cific
App
lianc
e La
bellin
g a
nd S
tand
ards
571
,966
9
,522
7
16,0
03
1,2
97,4
91
-427
,666
-7
4,11
7 7
95,7
08
795
,708
-
Suva
- Pa
cific
Ene
rgy
& G
ende
r 1
1,34
7 1
89
79,
082
90,
618
-84,
535
-916
5
,167
5
,167
-
TEN
Z01X
SIn
tegr
atio
n of
Gen
der t
o C
limat
e C
hang
e Ad
apat
ion
11,
347
189
7
9,08
2 9
0,61
8 -8
4,53
5 -9
16
5,1
67
5,1
67
-
Suva
- Po
licy
& Pl
anni
ng 7
38,3
84
12,
292
780
,938
1
,531
,614
-4
03,3
53
-95,
947
1,0
32,3
14
1,0
32,3
14
- TE
PZ01
XSRe
gion
al E
nerg
y C
onsu
ltativ
e M
eetin
g - A
usAI
D 7
1,05
7 1
,183
-
72,
240
-49,
000
-5,0
01
18,
239
18,
239
- TE
PZ02
XSEn
ergy
Min
iste
rial M
eetin
g -
- -
- 4
9,00
0 -2
,430
4
6,57
0 4
6,57
0 -
TEPZ
03XS
Ener
gy S
ecur
ity in
Pac
ific
- -
45,
938
45,
938
-7,5
87
-1,9
02
36,
449
36,
449
- TE
PZ04
XSEn
ergy
Aus
AID
Gra
nt 2
012
667
,327
1
1,10
9 7
35,0
00
1,4
13,4
36
-395
,766
-8
6,61
4 9
31,0
56
931
,056
-
Suva
- Re
new
able
s 2
,580
,326
4
2,95
5 5
,413
,616
8
,036
,897
-5
,125
,017
-2
84,1
68
2,6
27,7
12
2,6
27,7
12
- TE
RZ01
XSRe
new
able
Ene
rgy
Nth
Rep
Pro
ject
(FSM
) 8
91,1
51
14,
835
- 9
05,9
86
651
,505
-1
25,5
08
1,4
31,9
83
1,4
31,9
83
- TE
RZ02
XSRe
new
able
Ene
rgy
Nth
Rep
Pro
ject
(RM
I) 1
,079
,281
1
7,96
7 -
1,0
97,2
48
-692
,230
-7
8,54
5 3
26,4
73
326
,473
-
TERZ
03XS
Rene
wab
le E
nerg
y N
th R
ep P
roje
ct (P
alau
) 5
7,24
9 9
53
- 5
8,20
2 -3
8,39
0 -4
,083
1
5,72
9 1
5,72
9 -
TERZ
04XS
Rene
wab
le E
nerg
y N
th R
ep (G
ener
al)
552
,645
9
,200
5
,364
,361
5
,926
,206
-5
,036
,360
-7
4,06
3 8
15,7
83
815
,783
-
TERZ
05XS
IREN
A In
itiat
ive
Pac
Is. D
eve.
Sta
tes
- -
49,
255
49,
255
-9,5
42
-1,9
69
37,
744
37,
744
-
Notes to the financial statements

ANNUAL REPORT 2013 40
PRO
JEC
T C
OD
ED
ESC
RIP
TIO
N31
.12.
2012
EXC
H.
VAR
IATI
ON
O
PEN
ING
BAL
REC
EIVE
D
FRO
M
DO
NO
RS
TOTA
L
INC
OM
E E
XPEN
DIT
UR
EEX
CH
. VA
RIA
TIO
N
CLO
SIN
G B
AL31
.12.
2013
FUN
DS
HEL
D
ON
BEH
ALF
OF
DO
NO
RS
FUN
DS
OW
ED
BY D
ON
OR
S
Tran
spor
t
2,2
57,3
56
37,
578
1,7
05,9
79
4,0
00,9
13
-1,2
81,7
40
-257
,120
2
,462
,053
2
,462
,053
-
Suva
- Al
l Avi
atio
n Pr
ojec
ts 1
25,6
43
2,0
91
56,
010
183
,744
-1
09,6
65
-10,
479
63,
600
63,
600
- TT
AZ01
XSAv
iatio
n G
ener
al 1
3,82
5 2
30
53,
478
67,
533
-66,
271
-811
4
51
451
-
TTAZ
02XS
Avia
tion
Tech
nica
l, Po
licy
& Se
curit
y (P
IFS)
111
,818
1
,861
2
,532
1
16,2
11
-43,
394
-9,6
68
63,
149
63,
149
-
Suva
- Al
l Mar
itim
e Pr
ojec
ts 2
,131
,713
3
5,48
7 1
,649
,969
3
,817
,169
-1
,172
,075
-2
46,6
41
2,3
98,4
53
2,3
98,4
53
- TT
MS0
1XS
X- S
mal
l Is.
Sta
tes
(SIS
)- Fo
rSec
8,5
58
142
-
8,7
00
-477
-8
71
7,3
52
7,3
52
- TT
MS0
2XS
Mar
itim
e Se
curit
y PI
CT
AusA
ID 6
64,6
86
11,
065
- 6
75,7
51
-16,
057
-68,
719
590
,975
5
90,9
75
- TT
MS0
3XS
Port
Inte
gret
ion
- C
hina
21,
593
359
-
21,
952
-3,4
98
-2,0
85
16,
369
16,
369
- TT
MT0
3XS
Seaf
arer
s Tr
aini
ng -
Mul
ti 2
52,7
59
4,2
08
3,0
37
260
,004
-9
8,00
0 -2
1,72
5 1
40,2
79
140
,279
-
TTM
T04X
SIM
O-In
tern
atio
nal M
ariti
me
Org
anis
atio
n-4
4,73
4 -7
45
234
,099
1
88,6
20
-120
,480
-9
56
67,
184
67,
184
- TT
MT0
5XS
Dom
estic
Shi
p Sa
fety
- Pilo
t Aud
its 1
23,0
97
2,0
49
- 1
25,1
46
-75,
791
-9,1
15
40,
240
40,
240
- TT
MT0
6XS
Inte
rnal
Aud
itors
Tra
inin
g C
ours
es-A
usAi
d 2
71
5
103
,116
1
03,3
92
-48,
677
-2,7
28
51,
987
51,
987
- TT
MT0
7XS
Tran
spor
t Min
iste
rial M
eetin
g -
- -
- 9
3,54
1 -4
,639
8
8,90
2 8
8,90
2 -
TTM
T08X
STr
ansp
ort G
ener
al 5
,031
8
4 2
,857
7
,972
-4
,376
-4
51
3,1
45
3,1
45
- TZ
SD01
XSED
D -
Aus
AID
Gra
nt 2
011
1,0
99,4
56
18,
303
1,3
06,7
62
2,4
24,5
21
-898
,039
-1
35,2
54
1,3
91,2
28
1,3
91,2
28
- TZ
SD02
XSED
D -
Info
rmat
ion
and
Publ
icat
ion
996
1
7 9
8 1
,111
-2
21
-98
792
7
92
-
STAT
ISTI
CS
FOR
DEV
ELO
PMEN
T 1
,595
,011
-1
2 3
,145
,350
4
,740
,349
-2
,589
,184
4
0 2
,151
,205
2
,362
,157
-2
10,9
52
All N
oum
ea
1,5
95,0
11
-12
3,1
45,3
50
4,7
40,3
49
-2,5
89,1
84
40
2,1
51,2
05
2,3
62,1
57
-210
,952
Al
l Nou
mea
1
,595
,011
-1
2 3
,145
,350
4
,740
,349
-2
,589
,184
4
0 2
,151
,205
2
,362
,157
-2
10,9
52
SSSM
03XN
Hea
ds O
f Sta
tistic
s M
tg -
- 1
80,0
00
180
,000
-9
7,89
3 -
82,
107
82,
107
- SS
SZ02
XNSt
ats
Inco
me-
Mis
cella
neou
s 5
9,92
4 -
1,3
00
61,
224
2,2
66
- 6
3,49
0 6
3,49
0 -
SSSZ
10XN
ADB
/ RET
A 64
14-2
38,3
74
- -
-238
,374
3
69,9
53
- 1
31,5
79
131
,579
-
SSSZ
11XN
TFSC
B Su
ppor
t (hy
brid
sur
vey)
- W
orld
Ban
k 1
6,04
0 -
-14,
716
1,3
24
-1,3
24
- -
- -
SSSZ
12XN
AusA
ID -
2009
Cen
sus
245
,436
-
- 2
45,4
36
- -
245
,436
2
45,4
36
- SS
SZ15
XNPo
hnpe
i Offi
ce-1
,838
-
- -1
,838
3
,349
-
1,5
11
1,5
11
- SS
SZ16
XNAu
sAID
Stre
ngth
enin
g St
atis
tical
Ser
vice
201
0-20
14 1
41,9
28
- 2
,144
,853
2
,286
,781
-1
,973
,551
-
313
,230
3
13,2
30
- SS
SZ16
XSIm
plem
enta
tion
Pilo
t Van
uatu
Hyb
rid S
urve
y M
11/5
8-6
96
-12
- -7
08
668
4
0 -
- -
SSSZ
17XN
Impl
emen
tatio
n Pi
lot V
anua
tu H
ybrid
Sur
vey
M11
/58
5,7
44
- 2
7,00
9 3
2,75
3 -3
2,69
9 -
54
54
- SS
SZ18
XNAu
sAID
Stre
ngth
enin
g St
at. S
ervi
ce 2
010-
2014
(B)
1,2
28,2
13
- -
1,2
28,2
13
94,
027
- 1
,322
,240
1
,322
,240
-
SSSZ
19XN
2012
Act
iviti
es fu
nded
from
201
1 9
5,72
4 -
- 9
5,72
4 -5
,131
-
90,
593
90,
593
- SS
SZ21
XNSt
atis
tics
NZA
ID 2
012
Allo
catio
n 1
2,40
4 -
230
,340
2
42,7
44
-242
,943
-
-199
-
-199
SS
SZ22
XNAD
B-TA
-780
0 -
- 4
53,4
61
453
,461
-6
45,5
69
- -1
92,1
08
- -1
92,1
08
SSSZ
23XN
AFD
/ IM
DN
Pro
ject
- -
54,
893
54,
893
-11,
550
- 4
3,34
3 4
3,34
3 -
SZZZ
01XN
PPAP
D -
UN
FPA
-18,
420
- -
-18,
420
- -
-18,
420
- -1
8,42
0 SZ
ZZ02
XNRR
RT -
EU S
olom
ons
Proj
ect
515
-
68,
210
68,
725
-151
-
68,
574
68,
574
- SZ
ZZ03
XNRR
RT -
EU S
olom
ons
Proj
ect P
hase
2-2
25
- -
-225
-
- -2
25
- -2
25
SSSZ
09PN
PF-S
tatis
tics
48,
636
- -
48,
636
-48,
636
- -
- -
TO
TALS
45,
392,
543
319
,690
8
0,02
7,01
7 1
25,7
39,2
50
-73,
835,
848
-2,3
58,8
97
49,
544,
505
53,
565,
173
-4,0
20,6
67
Notes to the financial statements

ANNUAL REPORT 2013 41

ANNUAL REPORT 2013 42
STATEMENT OF ACCOUNTING POLICIES
1. Principal activity
The principal activity of the Secretariat of the Pacific Community is to undertake research and provide technical assistance and training in support of the economic and social development of its 22 Pacific Island member countries and territories.
2. Summary of significant accounting policies
The principal accounting policies applied in the preparation of the financial statements of the Secretariat are set out below. These policies have been consistently applied to all the years presented, unless otherwise stated.
2.1 Basis of preparationThe financial statements of the SPC have been prepared in accordance with the Secretariat’s financial regulations.
The financial statements have been prepared under the historical cost convention, except as disclosed in the accounting policies below.
Management is required to exercise its judgement in determining certain critical accounting estimates and the application of the organisation’s accounting policies. Areas involving a higher degree of judgement or complexity, or areas where assumptions and estimates are significant to the financial statements, are disclosed in Note 2.14.
All amounts shown in the financial statements are expressed in units of Pacific Francs (CFP) (1 unit = 100 Pacific Francs).
2.2 Fund accountingThe Secretariat utilises a fund accounting system, given that a considerable part of its annual income comprises individual grants and donor funds for specified projects.
Individual funds are separately maintained throughout the accounting system, thus providing the control necessary to ensure that each fund is used only for the purpose for which it is received.
A separate fund is established to record the amount received, expenditure incurred and the net balance of the funds available to be carried forward into the next financial period. Although the general rule is the accrual basis of
accounting, when funds are committed, accounting for individual projects has to comply with donors’ requirements. Some donors require that expenditures are recognised only on a cash basis.
Although the various funds are available only for the specific purpose for which they have been given, and they are accounted for separately, it is considered appropriate for reporting purposes in these financial statements to aggregate income and expenditure under summary headings.
2.3 Foreign currencyFunctional and presentation currency
Items included in the financial statements of the organisation are measured using the currency of the primary economic environment in which the organisation operates (‘the functional currency’). The functional currency for operations in Fiji is the Fijian dollar; for operations in New Caledonia it is the Pacific Franc. The financial statements are presented in units of Pacific Francs, which is the Secretariat of the Pacific Community’s presentation currency.
Transactions and balances
Foreign currency transactions are translated into the functional currency of each branch using the exchange rates prevailing at the date of the transactions. Foreign exchange gains and losses resulting from the settlement of such transactions and from the translation at year end exchange rates of monetary assets and liabilities denominated in foreign currencies are recognised in the income statement.
Suva branch accounts are consolidated at balance date by converting income and expenditure at the year’s average bank buying rate and net assets at the bank buying rate as at balance date.
Average rate used: FJD 1 = CFP 49.00 (2012: FJD 1 = CFP 51.91)
Balance date bank buying rate was FJD 1 = CFP 46.57 (2012: FJD 1 = CFP 51.06)

ANNUAL REPORT 2013 43
2.4 Revenue recognitionAssessed contributions
Contributions from member countries are recognised on an accrual basis and made from reference to assessed computations approved at annual conferences. Contributions to be allocated to the financing of capital expenditures are transferred to deferred income and brought to the income statement over the useful life of the assets.
Extra-budgetary funds
Funds received from governments and aid agencies under extra-budgetary work programmes are usually for specified purposes. These funds are separately identified in the accounting system and expenditure recorded against each fund. Revenue is generally recognised at the time of receipt of funds to comply with the fund reporting required by the donor.
Project management fees
Revenue received for the management of funds is based on an agreed percentage of the fund disbursements. This is recognised as expenditure on the project is recognised.
Interest revenue
Interest revenue is recognised on a straight line basis.
Sale of goods
Revenue from the sale of goods is recognised when the Secretariat has transferred to the buyer the significant risks and rewards of ownership of the goods.
2.5 Income taxThe Secretariat is exempt from income tax.
2.6 LeasesAll leases of property, plant and equipment under which the risks and benefits of ownership are effectively retained by the lessor are classified as operating leases. Obligations incurred under operating leases are charged to the income statement on a cash basis over the period of the lease.
2.7 Research and development costsResearch and development costs are recognised as an expense in the period in which they are incurred.
2.8 Property, plant and equipmentProperty, plant and equipment are stated at historical cost less depreciation. Historical cost includes expenditure that is directly attributable to the acquisition of the items. Land is not depreciated.
Subsequent costs are included in the asset’s carrying amount or recognised as a separate asset, as appropriate, only when it is probable that future economic benefits associated with the item will flow to the group and the cost of the item can be measured reliably. All other repairs and maintenance are charged to the income statement during the financial period in which they are incurred.
Depreciation on assets is calculated using the straight-line method to allocate their cost to their residual values over their estimated useful lives. Depreciation of an item of property, plant and equipment begins when it is available for use and ceases at the earlier of either the date that it is classified as held for sale or the date it is derecognised upon disposal.
The following estimated useful lives are used in the calculation of depreciation:
■ Motor vehicles, equipment, furniture 5 years and fittings
■ Computer equipment 3 years
■ Buildings 66.6 years
The depreciation charge for the year is matched by a corresponding transfer from the deferred income account. The assets’ residual values and useful lives are reviewed, and adjusted if appropriate, at each balance sheet date.
An asset’s carrying amount is written down immediately to its recoverable amount if the asset’s carrying amount is greater than its estimated recoverable amount. Gains and losses on disposals are determined by comparing proceeds with carrying amounts. These are included in the income statement.
2.9 InventoryInventories are stated at the lower of cost and net realisable value. Cost is calculated on a first-in, first-out (FIFO) basis. Net realisable value is the estimated selling price in the ordinary course of business, less applicable variable selling expenses.

ANNUAL REPORT 2013 44
2.10 Financial instrumentsFinancial assets and liabilities are recognised on the organisation’s balance sheet when it becomes a party to the contractual provisions of the instrument.
Financial assets
(i) Loans and receivables
Loans and receivables are non-derivative financial assets with fixed or determinable payments that are not quoted in an active market. They arise when the organisation provides money, goods or services directly to a debtor with no intention of trading the receivable.
They are included in current assets, except for maturities greater than 12 months after the balance sheet date, which are classified as non-current assets. Loans and receivables are included in trade and other receivables in the balance sheet.
Trade receivables are recognised initially at fair value and subsequently measured at amortised cost less provision for impairment. A provision for impairment of trade receivables is established when there is objective evidence that the organisation will not be able to collect all amounts due according to the original terms of receivables. The amount of the impairment is the difference between the asset’s carrying amount and the present value of estimated future cash flows. Significant financial difficulties of the debtor, probability that the debtor will enter bankruptcy or financial reorganisation, default or delinquency in payments are considered indicators that the trade receivables are impaired. The amount of the impairment is recognised in the income statement.
(ii) Cash and cash equivalents
Cash and cash equivalents are carried in the balance sheet at cost. Cash and cash equivalents comprise cash on hand, deposits held at call with banks and other short-term liquid investments that are readily convertible to a known amount of cash and are subject to an insignificant risk of change in value, net of bank overdrafts. In the balance sheet, bank overdrafts are included in borrowings in current liabilities.
Financial liabilities
Financial liabilities are initially measured at fair value, and are subsequently measured at amortised cost.
Offset
Where a legally enforceable right of offset exists for recognised financial assets and financial liabilities, and there is an intention to settle the liability and realise the asset simultaneously or to settle on a net basis, all related financial effects are offset.
2.11 ProvisionsProvisions are recognised when the organisation has a present legal or constructive obligation as a result of past events, when it is probable that an outflow of resources embodying economic benefits will be required to settle the obligation, and when a reliable estimate of the amount of the obligation can be made.
Where there are a number of similar obligations, the likelihood that an outflow will be required in settlement is determined by considering the class of obligations as a whole. A provision is recognised even if the likelihood of an outflow with respect to any one item included in the same class of obligations may be small.
Provisions are measured at the present value of the expenditures expected to be required to settle the obligation using a rate that reflects current market assessments of the time value of money and the risks specific to the obligation. The increase in the provision due to passage of time is recognised as interest expense.
2.12 Retirement benefitsThe organisation operates a defined contribution plan, the assets of which are held in a separate trustee-administered fund. The defined contribution plan is funded by payments from the organisation. A defined contribution plan is a pension plan under which the group pays fixed contributions into a separate entity. The organisation has no legal or constructive obligation to pay further contributions if the fund does not hold sufficient assets to pay all employees the benefits relating to employee service in the current and prior periods. Contributions to the defined contribution plan are charged to the income statement in the year to which they relate. The organisation has no further payment obligations once the contributions have been paid. The defined contribution plan is governed by the Provident Fund Rules of the Secretariat of the Pacific Community.
2.13 Non-current liabilities – Housing loansBorrowings
Borrowings relating to the loans on staff housing are initially recognised at fair value plus transaction costs incurred. Borrowings are subsequently measured at amortised cost. Any difference between the proceeds and the redemption amount is recognised in the income statement over the period of the borrowings on a straight line basis. Borrowings are classified as current liabilities unless the organisation has an unconditional right to defer settlement of the liability for at least 12 months after the reporting date.

ANNUAL REPORT 2013 45
Borrowing costs
Borrowing costs directly attributable to buildings are expensed in the period they are incurred.
2.14 Critical accounting estimates and judgementsEstimates and judgements are continually evaluated and are based on historical experience and other factors, including expectations of future events that are believed to be reasonable under the circumstances.
The organisation makes estimates and assumptions concerning the future. The resulting accounting estimates will, by definition, seldom equal the related actual results. Estimates and assumptions that have a significant risk of causing a material adjustment to the carrying amounts of assets and liabilities within the next financial year are discussed below.
a) Employee benefits
Liabilities for salaries and annual leave which are expected to be settled within 12 months of the reporting date are recognised in creditors, accruals and provisions in respect of employees’ services up to the reporting date and are measured at the amounts expected to be paid when the liabilities are settled.
The liability for expatriate repatriation has been based on the estimated airfares, removal cost and removal allowance. No discount rate has been applied.
The provision for expatriate home leave has been based on a 3 year cycle with an estimate of the average family size and estimated airfares.
2.15 ReservesThe following categories of Reserves are held in accordance with the reserve policy of the entity:
a) General Reserve represents the sum total of the accumulated results arising from core activities not assigned to a specific fund reserve.
b) Specific Funds Reserve comprises funds earmarked for specific purposes and generally not available for uses other than those specified.
c) Special Funds represent the accumulated results of self-funded activities, i.e. housing and canteen activities. Revenues and costs incurred for these activities are not presented under the statement of income and expenditure for core activities.
2.16 Statement of cash flowsThe statement of cash flows forms part of the Financial Statements to provide information on the movements in cash and cash equivalents of the organisation. The terms used in the statement of cash flows are defined as follows:
■ Operating activities include all transactions and other events that are not investing or financing activities.
■ Investing activities are those relating to the acquisition, holding and disposal of property, plant and equipment and of investments. Investments can include securities not falling within the definition of cash.
■ Cash and cash equivalents comprise cash on hand, cash in banks and term deposits held with banks.
3. Financial risk management
Financial risk factors
The organisation is exposed to a variety of financial risks: market risk (such as currency risk), credit risk and liquidity risk. The organisation’s overall risk management programme focuses on the unpredictability of financial markets and seeks to minimise potential adverse effects on the organisation’s financial performance.
CRGA provides principles for overall risk management, as well as policies covering specific areas.
a) Market risk
Foreign exchange risk
The organisation is exposed to foreign exchange risk arising from currency exposure, primarily with respect to
the United States, Australian and New Zealand dollars. In particular, foreign exchange risk arises from donations and transactions, and recognised assets and liabilities.
To manage the foreign exchange risk, the organisation has opened bank accounts in different currencies to obtain the most favourable outcome and to settle foreign currency liabilities in the currency received from donors.
In addition, a foreign exchange fluctuation reserve (within the Specific Funds) has been set up to cover adverse fluctuation events that may occur in future years.
b) Credit risk
Management has a credit policy in place and exposure to credit risk is monitored on an ongoing basis.

ANNUAL REPORT 2013 46
Credit risk with respect to trade receivables is limited due to the sovereign debt status of the Assessed Contributions owed by member countries. At balance sheet date, there were no significant concentrations of credit risk.
c) Liquidity risk
Prudent liquidity risk management implies maintaining sufficient cash and the availability of funding through an adequate amount of cash and committed credit facilities.
d) Cash flow and fair value interest rate risk
As the organisation has minimal interest-bearing liabilities, the organisation’s expenditure and operating cash flows are substantially independent of changes in market interest rates.
The group’s interest rate risk arises from interest-bearing assets (classified as cash and cash equivalents). Variable rates expose the group to cash flow interest rate risk.
Cash investments are limited to financial institutions with high credit quality.
4. Contingent liabilitiesThe Secretariat has no contingent liabilities as at 31 December 2013.
5. CommitmentsCapital commitments
The Secretariat has no capital commitments as at 31 December 2013.
6. InsuranceThe Secretariat has taken out insurance to cover its assets equivalent to the replacement value of its fixed assets.
7. Events occurring after balance dateNo other matter or circumstance, other than that referred to in the financial statements or notes thereto, has arisen since the end of the financial year that has significantly affected, or may significantly affect, the operations of the Secretariat, the results of those operations, or the state of affairs of the Secretariat in future financial years.

ANNUAL REPORT 2013 47
SPC MEMBERS Core Non-core Total % of total income Equivalent in USD*
METROPOLITAN MEMBERS
Australia 12,018,235 22,335,118 34,353,353 33.90% 39,941,115
France 2,864,000 347,696 3,211,696 3.17% 3,734,096
New Zealand 2,044,447 3,635,710 5,680,157 5.61% 6,604,066
United States of America 1,417,665 939,802 2,357,467 2.33% 2,740,922
ISLAND MEMBERS
American Samoa 58,600 - 58,600 0.06% 68,132
Cook Islands 52,000 889 52,889 0.05% 61,492
Federated States of Micronesia 69,000 - 69,000 0.07% 80,223
Fiji 186,989 12,962 199,951 0.20% 232,474
French Polynesia 131,000 276,727 407,727 0.40% 474,046
Guam 69,000 - 69,000 0.07% 80,223
Kiribati 69,000 - 69,000 0.07% 80,223
Marshall Islands 52,000 - 52,000 0.05% 60,458
Nauru 56,000 879 56,879 0.06% 66,131
New Caledonia 1,395,464 1,407,906 2,803,370 2.77% 3,259,354
Niue 43,000 - 43,000 0.04% 49,994
Northern Mariana Islands 58,600 - 58,600 0.06% 68,132
Palau 52,000 - 52,000 0.05% 60,458
Papua New Guinea 131,000 44,701 175,701 0.17% 204,280
Pitcairn Islands 43,600 - 43,600 0.04% 50,692
Samoa 85,000 - 85,000 0.08% 98,826
Solomon Islands 85,000 - 85,000 0.08% 98,826
Tokelau 56,600 - 56,600 0.06% 65,806
Tonga 85,000 - 85,000 0.08% 98,826
Tuvalu 56,000 11,320 67,320 0.07% 78,270
Vanuatu 85,000 - 85,000 0.08% 98,826
Wallis and Futuna 43,600 940 44,540 0.04% 51,785
TOTAL MEMBERS 21,307,800 29,014,650 50,322,450 58,507,676
Supplementary information2013 Income by source

ANNUAL REPORT 2013 48
NON-MEMBERS
Core Non-Core Total % of total income Equivalent in USD*
ACIAR - 1,111,006 1,111,006 1.10% 1,291,717
ADB - 513,639 513,639 0.51% 597,185
AFD - 100,444 100,444 0.10% 116,782
Bureau of Meterology Aust - 437,911 437,911 0.43% 509,140
Canada - 32,370 32,370 0.03% 37,635
Centers for Disease Control US - 362,877 362,877 0.36% 421,901
Commonwealth Fund - 123,629 123,629 0.12% 143,738
CTA - 52,691 52,691 0.05% 61,261
EU - 30,214,631 30,214,631 29.82% 35,129,207
FAO - 295,537 295,537 0.29% 343,608
FFA - 175,674 175,674 0.17% 204,248
Forum Secretariat (PIFS) - 296,231 296,231 0.29% 344,415
GF - 9,475,790 9,475,790 9.35% 11,017,079
GIZ - 501,499 501,499 0.49% 583,071
Heinz Australia - 85,068 85,068 0.08% 98,905
IFAD - 294,575 294,575 0.29% 342,489
IMO - 234,099 234,099 0.23% 272,176
ICLARM - 24,028 24,028 0.02% 27,936
ISSF - 43,240 43,240 0.04% 50,273
IRD Noumea - 146,268 146,268 0.14% 170,059
James Cook University - 39,589 39,589 0.04% 46,028
Japan - 110,308 110,308 0.11% 128,250
Korea - 163,742 163,742 0.16% 190,376
National Fisheries Authority PNG - 274,860 274,860 0.27% 319,567
Other partners - 1,470,572 1,470,572 1.45% 1,709,769
SPREP - 51,338 51,338 0.05% 59,688
UN other - 898,949 898,949 0.89% 1,045,168
UNDP - 929,277 929,277 0.92% 1,080,429
UNESCO - 16,381 16,381 0.02% 19,045
UNICEF - 332,205 332,205 0.33% 386,240
University of Hawaii - 60,579 60,579 0.06% 70,433
WCPFC - 1,669,365 1,669,365 1.65% 1,940,896
World Bank - 461,427 461,427 0.46% 536,481
World Diabetes Foundation - 12,565 12,565 0.01% 14,609
NON-MEMBERS - 51,012,364 51,012,364 59,309,804
Other income - - - -
TOTAL INCOME 21,307,800 80,027,014 101,334,814 117,817,480
2013 Income by source continued

ANNUAL REPORT 2013 49
2007 2008 2009 2010 2011 2012 2013
1 STAFF PROFILE
A GENDER
Female 175 197 200 239 273 289 311
Male 178 197 196 212 279 294 293
Total staff 353 394 396 451 552 583 604
% female 50% 50% 51% 53% 49% 50% 51%
% male 50% 50% 49% 47% 51% 50% 49%
WITHIN INTERNATIONALLY RECRUITED CATEGORY
Female 60 78 71 110 93 106 112
Male 116 128 120 162 167 178 183
Total 176 206 191 272 260 284 295
% female 34% 38% 37% 40% 36% 37% 38%
% male 66% 62% 63% 60% 64% 63% 62%
B NATIONALITY / CATEGORY OF STAFF
Pacific Islanders 80 93 89 152 139 160 145
Other 96 113 102 120 121 124 150
Total internationally recruited 176 206 191 272 260 284 295
% Pacific Islanders 45% 45% 47% 56% 53% 56% 49%
% Other 55% 55% 53% 44% 47% 44% 51%
Total locally recruited 177 188 205 179 292 299 309
Total 353 394 396 451 552 583 604
% Internationally recruited staff 50% 52% 48% 60% 47% 49% 49%
% Locally recruited staff 50% 48% 52% 40% 53% 51% 51%
C DIVISION
Director-General’s Office 2 2 4 2 46 43 40
Corporate Services 49 53 67 70 89 0
Programme Management & Support 43 46 46 61 57 0
Operations & Management 145 167
Social Resources 43 59 62 60 - - 0
FAME 72 76 74 66 82 85 88
Land Resources 90 95 71 72 59 69 83
Public Health 54 63 72 64 54 57 45
Economic Development 29 28 31 31
Applied Geoscience & Technology 0 68 64 77
Education,Training & Human Dev 27 69 70 55
Statistics for Development 19 18
Total 353 394 396 451 552 583 604
Statistical information

ANNUAL REPORT 2013 50
Program CFP Units Office of DG 7,284,467
Operations & Management 13,515,240
FAME 13,881,360
Land Resources 9,154,180
Public Health 23,497,152
Economic Development 7,972,965
Applied Geoscience & Technology 12,179,821
Education, Training & Human Dev 7,777,885
Statistics for Development 3,652,284
98,915,354
Activity CFP UnitsStaff costs 36,167,557
Operating & communications 32,103,989
Capital costs 2,354,366
Transport & travel costs 14,300,311
Training & workshop costs 3,010,859
Field work costs 10,364,584
Publications 613,688
98,915,354
Statistical information continued
2 FUNDING PROFILE 2007 2008 2009 2010 2011 2012 2013
Actual Actual Actual Actual Actual Actual Actual
A CATEGORY OF INCOME (CFP UNITS)
Core income:
Asessed contributions 8,221,832 8,221,832 8,221,832 8,714,673 9,427,370 9,481,332 10,693,900
Bank interest 521,097 460,041 175,938 310,393 419,215 595,492 481,100
Project management fees 942,301 1,522,068 2,022,113 2,383,690 2,919,799 3,786,297 3,265,200
Miscellaneous / tranfers 420,988 1,798,568 1,468,596 2,695,911 2,374,622 1,783,548 10,689,619
Total Core Income 10,106,218 12,002,509 11,888,479 14,104,667 15,141,006 15,646,669 25,129,819
Non-core 31,565,075 46,098,743 62,834,627 70,041,870 75,366,611 98,475,588 82,967,711
Total income 41,671,293 58,101,252 74,723,106 84,146,537 90,507,617 114,122,257 108,097,530
% Core to total income 24% 21% 16% 17% 17% 14% 23%
% Assessed contributions 20% 14% 11% 10% 10% 8% 10%
O�ce of DG 7%
Operations & Management 14%
FAME 14%
Land Resources 9%
Public Health 24%
Economic Development 8%
Geoscience 12%
Education, Training & Human Dev 8%
Statistics for Development 4%
Sta� costs 37%
Publications 1%
Field work costs 11%
Training & workshop costs 3%
Transport & travel costs 14%
Capital costs 2%
Operating & communications 32%
PROVIDENT FUND
FINANCIAL STATEMENTS AND AUDIT REPORTS FOR YEAR ENDING DECEMBER 2013

ANNUAL REPORT 2013 51
PROVIDENT FUND
FINANCIAL STATEMENTS AND AUDIT REPORTS FOR YEAR ENDING DECEMBER 2013

ANNUAL REPORT 2013 52

ANNUAL REPORT 2013 53

ANNUAL REPORT 2013 54
Secretariat of the Pacific CommunityProvident fund
Dr Colin Tukuitonga John Yee ChiefDIRECTOR-GENERAL ACTING DIRECTOR FINANCE
BALANCE SHEET AS AT 31 DECEMBER 2013
2013CFP units
2012CFP units
ASSETS
Investments
Term deposits - Noumea 4,800,000 3,200,000
Term deposits - Suva 2,885,761 2,685,866
Loans to members - Noumea 106,915 101,085
Loans to members - Suva 151,268 112,094
Loans to SPC Noumea 247,122 279,478
Cash at banks
Noumea 280,608 1,723,662
Suva 131,982 98,461
Interest receivable & other
Noumea 2,644 10,924
Suva 24,512 13,151
TOTAL ASSETS 8,630,812 8,224,721
DEDUCT LIABILITIES
Unearned interest - Noumea (920) (1,350)
Unearned interest - Suva (201,720) (6,738)
Other - (1,019)
NET ASSETS OF THE FUND 8,428,172 8,215,614
REPRESENTED BY:
Members’ capital accounts - Noumea 5,234,649 5,312,780
Members’ capital accounts - Suva 3,193,523 2,902,834
TOTAL MEMBERS’ CAPITAL 8,428,172 8,215,614

ANNUAL REPORT 2013 55
STATEMENT OF INCOME & EXPENDITURE FOR THE YEAR ENDED 31 DECEMBER 2013
2013CFP units
2012CFP units
INCOME
Interest received - Noumea 70,523 94,991
Interest received - Suva 98,462 100,981
TOTAL INTEREST RECEIVED 168,985 195,972
DEDUCT EXPENDITURE
Bank charges - Noumea (1,278) (245)
Bank charges - Suva (277) (471)
(1,555) (716)
NET INCOME TRANSFERRED TO APPROPRIATION ACCOUNT 167,430 195,256
APPROPRIATION ACCOUNT FOR THE YEAR ENDED 31 DECEMBER 2013
NET INTEREST RECEIVED FROM STATEMENT OF INCOME & EXPENDITURE
Noumea 69,245 94,746
Suva 98,185 100,510
167,430 195,256
INTEREST DISTRIBUTED TO MEMBERS
Interest credited to members accounts
6 months ended 30 June - Noumea (53,943) (45,232)
6 months ended 30 June - Suva (49,093) (50,255)
6 months ended 31 December - Noumea (15,302) (49,514)
6 months ended 31 December - Suva (49,092) (50,255)
(167,430) (195,256)
Secretariat of the Pacific CommunityProvident fund

ANNUAL REPORT 2013 56
MEMBERS’ ACCOUNTS MOVEMENTS FOR THE YEAR ENDED 31 DECEMBER 2013
2013CFP units
2012CFP units
OPENING BALANCE 1 JANUARY
Members’ contributions and interest 5,312,778 3,632,224
SPC contributions 2,902,834 3,507,657
8,215,612 7,139,881
ADDITIONS
Members’ contributions - Noumea 790,280 665,689
Members’ contributions - Suva 861,515 892,229
SPC contributions - Noumea 618,491 645,890
SPC contributions - Suva 678,315 680,879
2,948,601 2,884,687
Interest credited members - Noumea 69,245 94,746
Interest credited members - Suva 110,032 94,712
179,277 189,458
Exchange adjustment - Suva (283,739) (30,655)
TOTAL MEMBERS BALANCES BEFORE INVESTMENTS PAID OUT 11,059,751 10,183,371
DEDUCTIONS
Provident Fund investments retired during the year
Noumea (1,191,853) (551,063)
Suva (1,075,423) (953,830)
Noumea withdrawals during the year (364,303) (462,866)
TOTAL DEDUCTIONS (2,631,579) (1,967,759)
CLOSING BALANCE 31 DECEMBER 8,428,172 8,215,612
BALANCE OF MEMBERS’ ACCOUNTS
Members’ contributions and interest - Noumea 2,679,780 2,637,575
Members’ contributions and interest - Suva 1,713,371 1,570,280
SPC contributions - Noumea 2,554,869 2,675,203
SPC contributions - Suva 1,508,641 1,344,246
Exchange adjustment - Suva (28,489) (11,692)
CLOSING BALANCE 31 DECEMBER 8,428,172 8,215,612
Secretariat of the Pacific CommunityProvident fund

ANNUAL REPORT 2013 57
Statement of accounting policies
General
The Provident Fund of the Secretariat of the Pacific Community (hereinafter called ‘the Fund’) was established on January 1, 1953, for its officers and employees for the purpose of discharging the liability and/or responsibility (if any) of the Secretariat to the members in respect of provision for superannuation.
In accordance with the Rules of the Provident Fund (hereinafter called ‘the Rules’), the Fund is vested in and administered by the Secretariat on the trusts declared therein.
Subject to these Rules, and to any direction by the Secretariat in accordance therewith, the Director-General shall have and may exercise the powers and functions of the Secretariat under the Rules, with the exception of Rule 26, which covers amendments.
Any member may appeal to the Joint Appeals Board against any decision of the Director-General, as provided for in Chapter XIII of the Staff Rules.
Significant accounting policies and notes to the Provident Fund accounts
1. Accounting period
The accounting period used in the preparation of these accounts is the calendar year 1 January 2013 to 31 December 2013.
2. Currency used
The Provident Fund of all Noumea members, comprising both members’ and employer’s contributions, is invested in Noumea in CFP francs, while the Provident Fund of all Suva members is invested in Suva in Fiji dollars.
3. Exchange rate policy
For the purpose of consolidating the Suva Provident Fund investment with the Noumea Provident Fund investment at year end, the Suva Provident Fund interest and investment have been converted to CFP francs at the bank buying rate as at 31 December 2013 of FJD 1.00 = CFP46.57.
4. Loans to members
Loans to members consist of short-term loans borrowed against their holdings in the Provident Fund. In accordance with the Secretariat’s policy, a member can borrow an amount up to 90% of the member’s holdings in the Fund, provided that arrangements are made to repay the loan over a period of no longer than 12 months. The interest rate charged for such borrowings is a compound rate of 5% (which is 2% higher than the weighted average rate of interest earned on Provident Fund investments) as at 31 December 2013.
5. Loan to Secretariat of the Pacific Community
The Secretariat of the Pacific Community has borrowed money from the Fund to purchase accommodation for its staff in New Caledonia. This loan less capital repayments received is recognised as an asset by the Fund. Interest income is recognised on a straight line basis over the period of the loan.

ANNUAL REPORT 2013 58
Pacific Community members
American Samoa, Australia, Cook Islands, Federated States of Micronesia, Fiji, France, French Polynesia, Guam, Kiribati, Marshall Islands, Nauru, New Caledonia, New Zealand, Niue, Northern Mariana Islands, Palau, Papua New Guinea, Pitcairn
Islands, Samoa, Solomon Islands, Tokelau, Tonga, Tuvalu, United States of America, Vanuatu, and Wallis and Futuna.