Embed Size (px)
Citation preview

Spatio-temporal patterns of protozoan communities in a meso-eutrophic
reservoir (Esch-sur-Sure, Luxembourg)
Veronique Jacquet1, Nicole Lair2, Lucien Hoffmann1 & Henry-Michel Cauchie1,*1CRP-Gabriel Lippmann, CREBS, 41, rue du Brill, L-4422, Belvaux, Luxembourg2University Blaise Pascal, UMR 6042 CNRS, 4 rue Ledru, F-63057, Clermont-Ferrand Cedex, France
(*Author for correspondence: Tel.: +352-470261420; Fax: +352-470264; E-mail: [email protected])
Key words: protozoa, nanoflagellates, ciliates, meso-eutrophic reservoir, spatio-temporal dynamics, microbial foodweb
Abstract
The spatio-temporal distribution of the heterotrophic nanoflagellates (HNF) and ciliates was monitored inthe reservoir of Esch-sur-Sure during the year 1999. Three main periods of protozoan development wereobserved, in early April, early May, and in July. On the basis of the seasonal dynamics, it appeared that theearly spring development of protozoa was probably not controlled by resources or predators. The secondprotozoan development was progressively controlled by the increase of metazooplankton density that led tothe clear water phase characterised by very low protozoan densities and biomasses. A summer developmentof protozoa was possible thanks to the development of bacteria and moderate metazooplankton densitiesdue to the appearance of non-edible algae. Prorodontida, Halteriida and Strombidiida were the dominantciliates in the upper part of the water column. A development of Tintinnida was moreover observed inspring whereas Philasterida and Sessilida developed in winter and summer. Ciliates occupied the entirewater column in spring and were concentrated in the epilimnion and the metalimnion during the summerperiod where they fed on bacteria and algae.
Introduction
Planktonic protozoa play a significant role in theenergy transfer and nutrient remineralization inaquatic environments (Sanders & Porter, 1986;Muller, 1989; Sanders & Wickham, 1993; Weisse &Muller, 1998;Cleven&Weisse, 2001), at least duringparts of the annual cycle. Although the seasonaldevelopment of heterotrophic nanoflagellates andciliates in relation to physical, chemical and biolo-gical variables of the ecosystems has beeninvestigated to some extent for lakes (Pace, 1982;Muller et al., 1991b; Laybourn-Parry, 1992, 1994;Weisse & Muller, 1998), their vertical distributionhas rarelybeenconsidered (Pace, 1982;Muller et al.,1991b; Gasol et al., 1995; Zimmermann, 1996). Inboth freshwater (Pace, 1982; Macek et al., 1996;Carrias et al., 1996; Ventela et al., 1998; Thouvenotet al., 1999) and marine ecosystems (Artolozaga
et al., 2000; Bojanic, 2001), significant vertical gra-dients of protozoa diversity however exist and theyappear to be influenced by the distribution of theirprey and physical and chemical variables such asdissolved oxygen concentration.
The aim of the present study is to describethe spatio-temporal dynamics of protozoa inthe meso-eutrophic reservoir of Esch-sur-Sure(Luxembourg) and to relate the observed patternsto major abiotic and biotic characteristics of theecosystem.
Materials and methods
Study site
The Esch-sur-Sure reservoir (Grand-Duchy ofLuxembourg) is a riverine reservoir used for
Hydrobiologia (2005) 551:49–60 � Springer 2005J.N. Beisel, L. Hoffmann, L. Triest & P. Usseglio-Polatera (eds), Ecology and Disturbances of Aquatic SystemsDOI 10.1007/s10750-005-4449-y
drinking water production and recreational activi-ties. With a surface of 3.2 km2 and a volume of55 · 106 m3, this reservoir is the main drinkingwater stock of Luxembourg, covering 45% of thepopulation needs. The watershed covers an area ofabout 430 km2. The trophic status of the reservoiris meso-eutrophic according to the OECD criteria(Vollenweider & Kerekes, 1982). Soluble reactivephosphorus ranges from 0.01 to 0.03 mg P l)1
during the water mixing period and drops to con-centrations lower than 0.005 mg P l)1 at the endof the thermal stratification period. Nitratedecreases during the course of the year from about5–6 mg N l)1 during the water mixing period toabout 3 mg N l)1 at the end of the thermalstratification period.
Sampling procedure and in situ measurements
The sampling site is located on a floating foot-bridge that crosses the reservoir. Maximal depth atthis site reaches 30 m. In 1999 the vertical distri-bution of heterotrophic nanoflagellates (HNF)and ciliates was monitored throughout the yearacross the entire water column. Water temperatureand dissolved oxygen concentration were mea-sured using a Hydrolab multi-parameter probe.Water transparency was monitored using a Secchidisc. Water samples were collected between 10:00and 12:00, on a weekly basis from March to Sep-tember (spring–summer), then at a biweekly ormonthly frequency in autumn and winter, with a2.2-l closing vertical Ruttner bottle. Subsamplesfor bacteria, HNF and ciliate enumerations werefixed with 2% formaldehyde (final concentration)(Porter & Feig, 1980), glutaraldehyde (1% finalconcentration) (Bloem et al., 1986) and mercuricchloride (2.5% final concentration) (Sime-Ngando& Groliere, 1991), respectively. Metazooplanktonwas collected using a 50 lm mesh size verticalplankton net and was preserved in a 4% formalinsolution (final concentration) added with sucrose(0.6%, final concentration) (Prepas, 1978). Sam-pling depths varied according to seasons. Sampleswere collected at seven different depths (0.5, 2.5,5.0, 7.5, 10.0, 15.0, 20.0 m) during the mixingperiod and every meter over the whole water col-umn during thermal stratification.
Measurement of chlorophyll a concentrationand enumeration of organisms
Chlorophyll a content was measured by HPLCafter acetone 90% extraction according to themethod by UNESCO (1966). Fixed HNF werestained with primuline, filtered onto black poly-carbonate membranes (porosity 0.8 lm) andcounted at ·100 magnification under UV andblue excitations using an epifluorescence micro-scope (Leica, DMRB) (Caron, 1983; Bloemet al., 1986). A minimum of 300 cells wasobserved on each filter and were differentiatedaccording to their size. Three size classes wereconsidered: sizes lower than 5 lm, sizes between5 and 10 lm and sizes between 10 and 20 lm.The biovolume of these cells was estimated andconverted into biomass using a conversion factorof 220 fg C lm)3 (Borsheim & Bradback, 1987).Fixed ciliates were counted, without staining,with an inverted microscope (Leitz Axiovert),according to the method of Utermohl (1958).Taxonomic determinations were carried outusing identification keys by De Puytorac et al.(1987), Foissner et al. (1991, 1992, 1994, 1995)and Patterson (1996). The classification systemproposed by Lynn and Small (1997) was fol-lowed. Ciliates were differentiated in five sizeclasses: sizes lower than 20 lm, sizes between 20and 35 lm, sizes between 35 and 50 lm, sizesbetween 50 and 100 lm and sizes larger than100 lm. The carbon biomass of naked ciliateswas estimated by using the conversion factor of190 fg C lm)3 (Putt & Stoecker, 1989). Theformula Ct = 444.5 + 0.053 V (Ct: the cellularcarbon content in pg C; V = the volume of thelorica in lm3), proposed by Verity & Langdon(1984), was used for loricated ciliates (Tintinni-da). The dominant phytoplankton species weredetermined using the same method as for ciliates.Bacteria were stained with acridine orange(Hobbie et al., 1977), filtered onto black poly-carbonate membranes (porosity 0.2 lm)and enumerated at ·1000 magnification by epi-fluorescence microscopy. Metazooplankton wasenumerated under an inverted microscope (LeitzAxiovert). At least 200 individual zooplankterswere counted in a sedimentation chamber ineach sample.
50

Results
Abiotic variables
In winter, the water column was homogeneous andthe average temperature was 4.5 �C. Thermalstratification started in the beginning of May andlasted until the end of September (Fig. 1). Maxi-mum temperature in the surface water reached23 �C in July. The metalimnion generally extendedfrom 6 to 12 m of depth. The highest dissolvedoxygen concentrations (>12 mg O2 l
)1) wereobserved at the end of March in the upper layer,during the first phytoplanktonic development. Inthe epilimnion low oxygen concentrations wereobserved concurrently with high temperatures(>22 �C). Important oxygen depletion occurred inthe metalimnion during summer. The lowest
concentrations (<0.2 mg O2 l)1) were recorded at
the end of September, in the hypolimnion.
Phytoplankton, bacterioplankton andmetazooplankton
Diatoms (Cyclotella, Stephanodiscus, Asterionella)dominated the spring phytoplankton commu-nity. The maximum chlorophyll a concentration(27.1 lg chla l)1) was measured at the end of April,in the surface layer. A clear water phase wasobserved fromMay to June. During this period, thechlorophyll a concentration reached on average4.9 lg chla l)1 and the planktonic community wasdominated by Cryptophytes. In summer, a morediverse phytoplankton community developedincluding diatoms (Fragilaria), Chlorophytes(Eutetramorus), and Chrysophytes (Mallomonas).
246810121416182022
0
5
10
15
20
25
30temperature
dept
h (m
)
˚C
246810121416182022
246810121416182022
0
5
10
15
20
25
30temperature
0
5
10
15
20
25
30temperature
dept
h (m
)
˚C
J F M A M J J A S O N DJ F M A M J J A S O N D
thermal stratification thermal stratification
10
15
20
25
30
5
0
0
5
10
15
20
25
µg c
hla
l-1
chla
dept
h (m
) 10
15
20
25
30
5
0
10
15
20
25
30
5
0
0
5
10
15
20
25
0
5
10
15
20
25
µg c
hla
l-1
chlachla
dept
h (m
)
109
cell.
l-1
0
0.5
1.0
1.5
2.0
2.5
3.0
3.5
4.0
4.5
10
15
20
25
30
5
0
bacteria
dept
h (m
)
109
cell.
l-1
0
0.5
1.0
1.5
2.0
2.5
3.0
3.5
4.0
4.5
10
15
20
25
30
5
0
bacteria
dept
h (m
)
0
0.5
1.0
1.5
2.0
2.5
3.0
3.5
4.0
4.5
0
0.5
1.0
1.5
2.0
2.5
3.0
3.5
4.0
4.5
10
15
20
25
30
5
0
bacteria
10
15
20
25
30
5
0
bacteria
dept
h (m
)
0
50
100
150
200
250
300
350
400
0
50
100
150
200
250
300
350
400
10
15
20
25
30
5
0
metazooplankton
ind.
l-1
dept
h (m
) 10
15
20
25
30
5
0
10
15
20
25
30
5
0
metazooplanktonmetazooplankton
ind.
l-1
dept
h (m
)
J F M A M J J A S O N DJ F M A M J J A S O N D
10
15
20
25
30 0123456789101112
O2
0
5
dept
h (m
)
mg
O2
l-110
15
20
25
30 0123456789101112
0123456789101112
O2
0
5
O2
0
5
dept
h (m
)
mg
O2
l-1
dept
h (m
)
012345678910
012345678910
0
5
10
15
20
25
30
106
cell.
l-1
HNF5
1 2
3
4
5
6 7 8
Figure 1. Spatio-temporal patterns of water temperature, dissolved oxygen concentration (O2), chlorophyll a (chl a), bacterial,
heterotrophic nanoflagellates (HNF) and metazooplankton density during 1999. Dominant taxonomic groups: (1) Diatoms (Cyclotella
sp., Stephanodiscus sp., Asterionella sp.); (2) diatoms (Cyclotella, Stephanodiscus, Asterionella) and Cryptophytes (Rhodomonas,
Cryptomonas); (3) diatoms (Fragilaria), Chlorophytes (Eutetramorus), Chrysophytes (Mallomonas); (4) Cyanophytes (Anabaena,
Aphanizomenon, Planktothrix, Limnothrix, Woronichinia); (5) rotifers (Synchaeta) and copepod nauplii; (6) rotifers (Conochilus,
Keratella, Synchaeta), cladocerans (Bosmina) and cyclopoid copepodites; (7) rotifers (Conochilus, Keratella, Polyarthra), cladocerans
(Daphnia) and cyclopoid copepodites; (8) rotifers (Brachionus, Conochilus, Keratella, Polyarthra), cladocerans (Bosmina, Diaphano-
soma), cyclopoid and calanoid copepodites.
51

A second maximum (22.2 lg chla l)1) was ob-served in July. Cyanophytes (Anabaena, Aphani-zomenon, Planktothrix, Limnothrix, Woronichinia)developed in late August.
The highest bacterial densities were recordedin spring (Fig. 1), in the epilimnion (maximum= 4.3 · 109 cell. l)1) and in June, in the meta-limnion (synchronous with the algal development).At the end of the year, bacterial density becamehomogeneous over the whole water column, withless than 1.0 · 109 bact. l)1. As far as metazoo-plankton density is concerned, rotifers (Synchaeta,Keratella, Conochilus) dominated the metazoo-plankton community. They proliferated in theupper layer in early spring, followed by thedevelopment of the micro-crustaceans (Daphnia)(maximum density = 542 ind. l)1 in May)(Fig. 1). At the end of the spring bloom, the totaldensity of metazooplankton decreased during theclear water phase to less than 10.0 ind. l)1 inearly-June, in the epilimnion. In summer, themetazooplankton community presented a second,although less important development in June inthe epilimnion (maximum = 298 ind. l)1) and themetalimnion (maximum = 82.7 ind. l)1). Meta-zooplankton decreased then until the end of Sep-tember.
Protozoa
Heterotrophic nanoflagellates (HNF) were con-centrated in the surface and the intermediate layers
during all the year. HNF abundance increased inspring was low during the clear water phase andreached maximum values in summer (maxi-mum density in metalimnion = 11.4 · 106 cell. l)1)(Fig. 1). In autumn, the community remained ata relatively high density, before the winterdecline. The HNF community was mainly com-posed of spherical cells with a size lower than5 lm (Table 1). The proportion of cells with alarger size (10–20 lm) increased with the depth(Table 1).
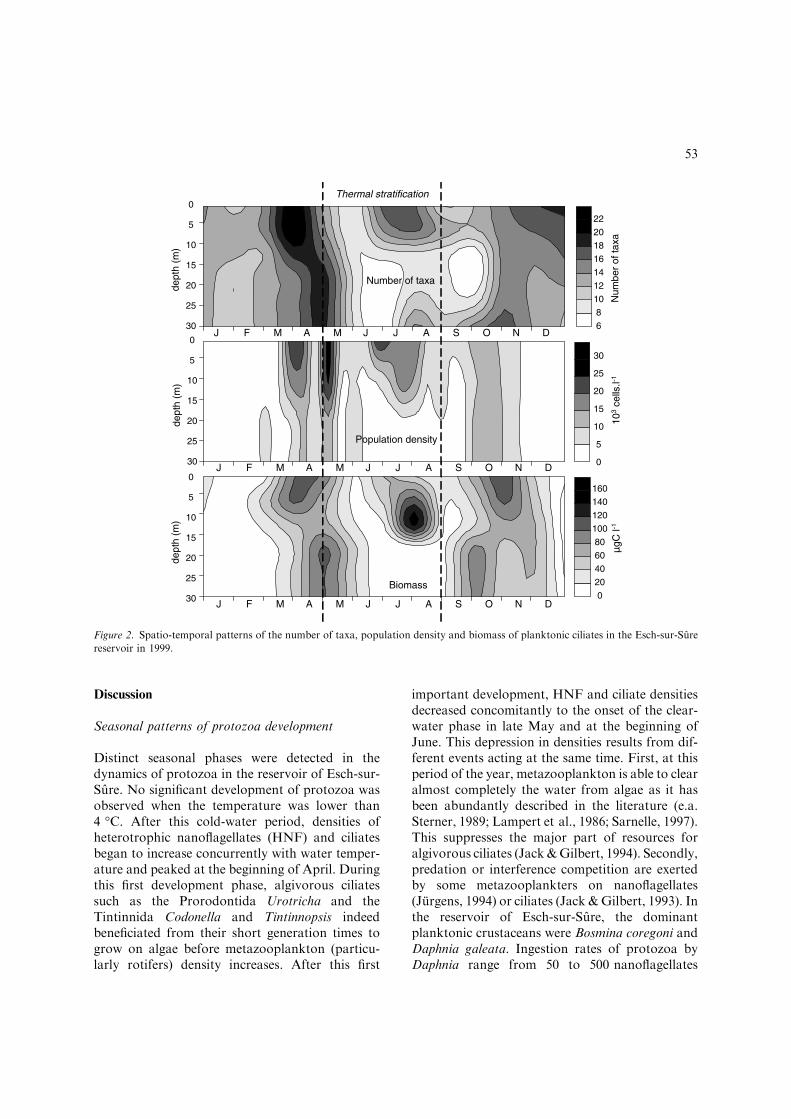
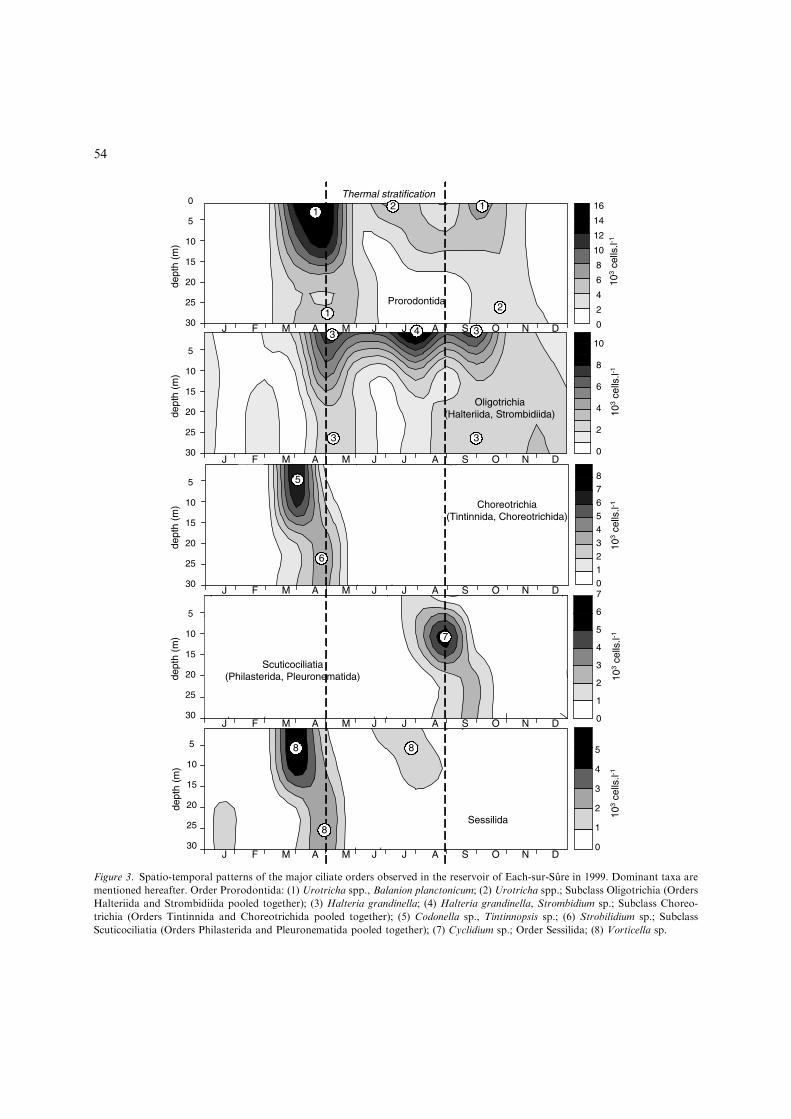
Three main periods of ciliate developmentwere globally observed during 1999: in earlyApril, in early May and in July. The abundanceand biomass of ciliates was low in winter,whatever the depths considered (Fig. 2). Themaximal abundance (41.6 · 103 cell. l)1) wasobserved in spring, concurrently with the devel-opment of Tintinnida (Fig. 3). During the clearwater phase, the density of ciliates dropped inthe epilimnion and the metalimnion beforeincreasing in July. When water mixing began, thedensity and biomass of the community decreasedand became homogeneous over the whole watercolumn.
The ciliates community was composed of 27identified taxa belonging to 17 orders (Table 2).The maximum diversity was observed duringthe spring development (Fig. 2). Halteriida andStrombidiida dominated in the upper layer all theyear, whereas Prorodontida, Choreotrichida andSessilida were located in both the epi- and meta-limnion (Fig. 3). Pleuronematida (Cyclidium) weretemporarily abundant in September in the meta-limnion.
The ciliate community was characterised by thepredominance of small cells. Taxa with sizes lowerthan 20 lm and sizes between 20 and 35 lm occu-pied the water column in similar proportions duringmost of the year (Table 1). These cells with a sizelower than 35 lm represented nearly 80% of theabundance of the community whatever the depths.The cells with a size between 35 and 50 lm wererelatively poorly represented. The intermediatelayer differed from the overlying stratum by a lowerdensity and the presence of cells with a size between50 and 100 lm. The relative importance of taxawith a size larger than 100 lm was low and theywere homogeneously distributed over the wholewater column.
Table 1. Relative importance of different size classes of het-
erotrophic nanoflagellates (HNF) and ciliates, expressed as a
percentage of abundance
Size classes Relative abundance (%)
Surface layer Intermediate layer Deep layer
HNF
<5 lm 93.4 96.6 91.0
5–10 lm 6.5 5.9 6.1
10–20 lm 0.1 0.5 2.9
Ciliates
<20 lm 36.9 44.4 45.0
20–35 lm 37.6 32.7 34.5
35–50 lm 11.2 6.2 4.4
50–100 lm 11.6 14.2 13.6
>100 lm 2.7 2.5 2.5
52
Discussion
Seasonal patterns of protozoa development
Distinct seasonal phases were detected in thedynamics of protozoa in the reservoir of Esch-sur-Sure. No significant development of protozoa wasobserved when the temperature was lower than4 �C. After this cold-water period, densities ofheterotrophic nanoflagellates (HNF) and ciliatesbegan to increase concurrently with water temper-ature and peaked at the beginning of April. Duringthis first development phase, algivorous ciliatessuch as the Prorodontida Urotricha and theTintinnida Codonella and Tintinnopsis indeedbeneficiated from their short generation times togrow on algae before metazooplankton (particu-larly rotifers) density increases. After this first
important development, HNF and ciliate densitiesdecreased concomitantly to the onset of the clear-water phase in late May and at the beginning ofJune. This depression in densities results from dif-ferent events acting at the same time. First, at thisperiod of the year, metazooplankton is able to clearalmost completely the water from algae as it hasbeen abundantly described in the literature (e.a.Sterner, 1989; Lampert et al., 1986; Sarnelle, 1997).This suppresses the major part of resources foralgivorous ciliates (Jack&Gilbert, 1994). Secondly,predation or interference competition are exertedby some metazooplankters on nanoflagellates(Jurgens, 1994) or ciliates (Jack &Gilbert, 1993). Inthe reservoir of Esch-sur-Sure, the dominantplanktonic crustaceans were Bosmina coregoni andDaphnia galeata. Ingestion rates of protozoa byDaphnia range from 50 to 500 nanoflagellates
6 . 0 0
8 . 0 0
1 0 . 0 0
1 2 . 0 0
1 4 . 0 0
1 6 . 0 0
1 8 . 0 0
2 0 . 0 0
2 2 . 0 0
0 . 0 0
5 . 0 0
1 0 . 0 0
1 5 . 0 0
2 0 . 0 0
2 5 . 0 0
3 0 . 0 0
0 . 0 0
2 0 . 0 0
4 0 . 0 0
6 0 . 0 0
8 0 . 0 0
1 0 0 . 0 0
1 2 0 . 0 0
1 4 0 . 0 0
1 6 0 . 0 0
Number of taxa
Population density
Biomass
J F M A M J J A S O N D
J F M A M J J A S O N D
J F M A M J J A S O N D
0
5
10
15
20
25
30
dept
h(m
)
0
5
10
15
20
25
30
dept
h(m
)
0
5
10
15
20
25
30
dept
h(m
)
2220
18
16
14
12
10
8
6
Num
ber
ofta
xa
30
25
20
15
10
5
0
103
cells
.l-1
160
140
120
100
80
60
40
20
0
µgC
l-1
Thermal stratification
Figure 2. Spatio-temporal patterns of the number of taxa, population density and biomass of planktonic ciliates in the Esch-sur-Sure
reservoir in 1999.
53
0 . 0 0
2 . 0 0
4 . 0 0
6 . 0 0
8 . 0 0
1 0 . 0 0
1 2 . 0 0
1 4 . 0 0
16
14
12
10
8
6
4
2
0
Prorodontida
0
5
10
15
20
25
30
dept
h(m
)
0 . 0 0
1 . 0 0
2 . 0 0
3 . 0 0
4 . 0 0
5 . 0 0
6 . 0 0
7 . 0 0
8 . 0 0
9 . 0 0
1 0 . 0 010
8
6
4
2
0
J F M A M J J A S O N D
5
10
15
20
25
30
dept
h(m
)
Oligotrichia(Halteriida, Strombidiida)
J F M A M J J A S O N D
0 . 0 0
1 . 0 0
2 . 0 0
3 . 0 0
4 . 0 0
5 . 0 0
6 . 0 0
7 . 0 0
8 . 0 05
10
15
20
25
30
dept
h(m
) Choreotrichia(Tintinnida, Choreotrichida)
0 . 0 0
1 . 0 0
2 . 0 0
3 . 0 0
4 . 0 0
5 . 0 0
6 . 0 0
J F M A M J J A S O N D
Scuticociliatia(Philasterida, Pleuronematida)
5
10
15
20
25
30
dept
h(m
)
7
6
5
4
3
2
1
0
8
7
6
5
4
3
2
1
0
J F M A M J J A S O N D
0 . 0 0
0 . 5 0
1 . 0 0
1 . 5 0
2 . 0 0
2 . 5 0
J F M A M J J A S O N D
5
10
15
20
25
30
dept
h(m
)
Sessilida
5
4
3
2
1
0
103
cells
.l-110
3ce
lls.l-1
103
cells
.l-110
3ce
lls.l-1
103
cells
.l-1
1
3 34
5
8
3 3
2 1
2
8
Thermal stratification
8
7
1
6
Figure 3. Spatio-temporal patterns of the major ciliate orders observed in the reservoir of Each-sur-Sure in 1999. Dominant taxa are
mentioned hereafter. Order Prorodontida: (1) Urotricha spp., Balanion planctonicum; (2) Urotricha spp.; Subclass Oligotrichia (Orders
Halteriida and Strombidiida pooled together); (3) Halteria grandinella; (4) Halteria grandinella, Strombidium sp.; Subclass Choreo-
trichia (Orders Tintinnida and Choreotrichida pooled together); (5) Codonella sp., Tintinnopsis sp.; (6) Strobilidium sp.; Subclass
Scuticociliatia (Orders Philasterida and Pleuronematida pooled together); (7) Cyclidium sp.; Order Sessilida; (8) Vorticella sp.
54
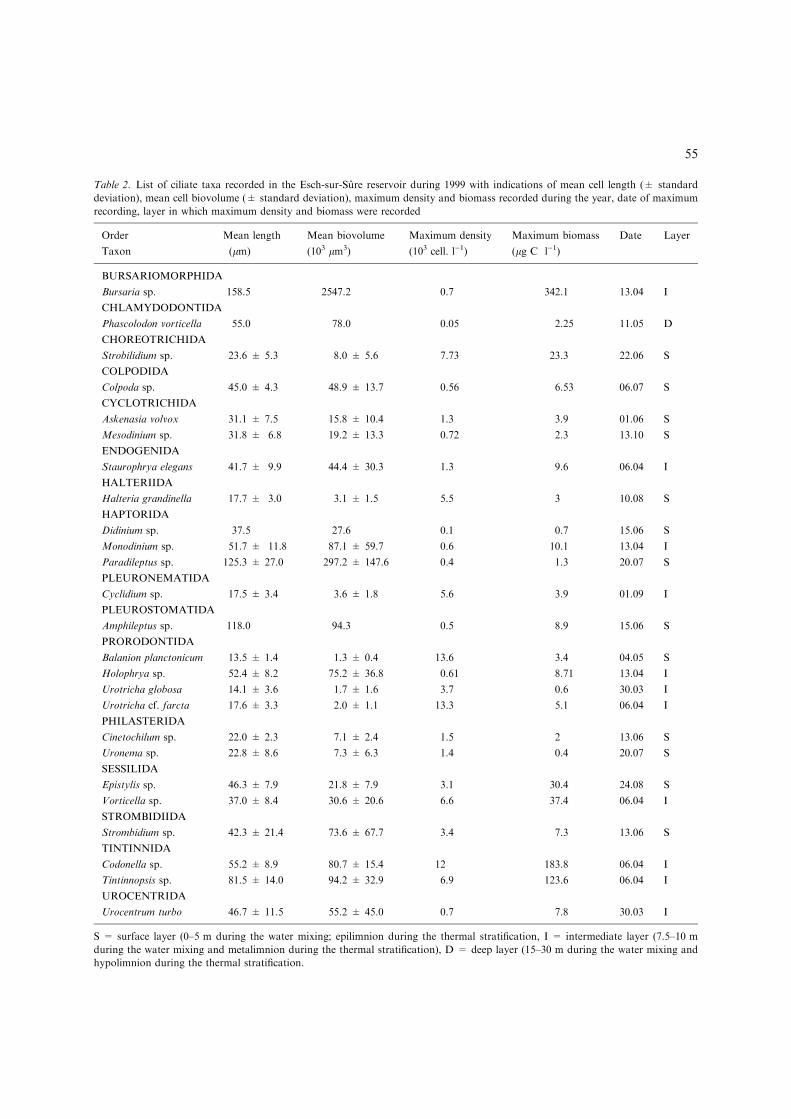
Table 2. List of ciliate taxa recorded in the Esch-sur-Sure reservoir during 1999 with indications of mean cell length (± standard
deviation), mean cell biovolume (± standard deviation), maximum density and biomass recorded during the year, date of maximum
recording, layer in which maximum density and biomass were recorded
Order Mean length Mean biovolume Maximum density Maximum biomass Date Layer
Taxon (lm) (103 lm3) (103 cell. l)1) (lg C l)1)
BURSARIOMORPHIDA
Bursaria sp. 158.5 2547.2 0.7 342.1 13.04 I
CHLAMYDODONTIDA
Phascolodon vorticella 55.0 78.0 0.05 2.25 11.05 D
CHOREOTRICHIDA
Strobilidium sp. 23.6 ± 5.3 8.0 ± 5.6 7.73 23.3 22.06 S
COLPODIDA
Colpoda sp. 45.0 ± 4.3 48.9 ± 13.7 0.56 6.53 06.07 S
CYCLOTRICHIDA
Askenasia volvox 31.1 ± 7.5 15.8 ± 10.4 1.3 3.9 01.06 S
Mesodinium sp. 31.8 ± 6.8 19.2 ± 13.3 0.72 2.3 13.10 S
ENDOGENIDA
Staurophrya elegans 41.7 ± 9.9 44.4 ± 30.3 1.3 9.6 06.04 I
HALTERIIDA
Halteria grandinella 17.7 ± 3.0 3.1 ± 1.5 5.5 3 10.08 S
HAPTORIDA
Didinium sp. 37.5 27.6 0.1 0.7 15.06 S
Monodinium sp. 51.7 ± 11.8 87.1 ± 59.7 0.6 10.1 13.04 I
Paradileptus sp. 125.3 ± 27.0 297.2 ± 147.6 0.4 1.3 20.07 S
PLEURONEMATIDA
Cyclidium sp. 17.5 ± 3.4 3.6 ± 1.8 5.6 3.9 01.09 I
PLEUROSTOMATIDA
Amphileptus sp. 118.0 94.3 0.5 8.9 15.06 S
PRORODONTIDA
Balanion planctonicum 13.5 ± 1.4 1.3 ± 0.4 13.6 3.4 04.05 S
Holophrya sp. 52.4 ± 8.2 75.2 ± 36.8 0.61 8.71 13.04 I
Urotricha globosa 14.1 ± 3.6 1.7 ± 1.6 3.7 0.6 30.03 I
Urotricha cf. farcta 17.6 ± 3.3 2.0 ± 1.1 13.3 5.1 06.04 I
PHILASTERIDA
Cinetochilum sp. 22.0 ± 2.3 7.1 ± 2.4 1.5 2 13.06 S
Uronema sp. 22.8 ± 8.6 7.3 ± 6.3 1.4 0.4 20.07 S
SESSILIDA
Epistylis sp. 46.3 ± 7.9 21.8 ± 7.9 3.1 30.4 24.08 S
Vorticella sp. 37.0 ± 8.4 30.6 ± 20.6 6.6 37.4 06.04 I
STROMBIDIIDA
Strombidium sp. 42.3 ± 21.4 73.6 ± 67.7 3.4 7.3 13.06 S
TINTINNIDA
Codonella sp. 55.2 ± 8.9 80.7 ± 15.4 12 183.8 06.04 I
Tintinnopsis sp. 81.5 ± 14.0 94.2 ± 32.9 6.9 123.6 06.04 I
UROCENTRIDA
Urocentrum turbo 46.7 ± 11.5 55.2 ± 45.0 0.7 7.8 30.03 I
S = surface layer (0–5 m during the water mixing; epilimnion during the thermal stratification, I = intermediate layer (7.5–10 m
during the water mixing and metalimnion during the thermal stratification), D = deep layer (15–30 m during the water mixing and
hypolimnion during the thermal stratification.
55

Daphnia)1 h)1 (Sanders et al.,1994) and from 720to ca. 10,000 ciliates Daphnia)1 h)1 (Sanders &Wickham, 1993). A strong top-down control onprotozoa is therefore expected to exist during theclear-water phase.
A third phase extended from mid-June tomid-August when a second major developmentof protozoa was observed after the clear waterphase. During the two first weeks of this period,metazooplankton density was high and thecommunity was mainly composed of Daphniagaleata, cyclopoid copepodites and Eudiaptomusgracilis. These organisms are known to causesignificant mortalities to nanoflagellates andciliates. Despite Eudiaptomus gracilis is oftenpresented as a herbivorous species, its clearancerates on protozoa are similar to those of clado-cerans such as Bosmina longirostris or Daphniahyalina (Jurgens et al., 1996; Jack & Gilbert,1997). Contrary to what has happened in May,metazooplankton is not able to control protozoaand phytoplankton because it is itself controlledby juvenile fishes that move out into the pelagiczone at this time (Thys & Hoffmann, 2005).Reduced grazing pressure also beneficiated tophytoplankton whose biomass reached maximumvalues in mid-July.
A fourth phase took place from mid-August tothe end of the stratification in late September.During this period, ciliates did not significantlydevelop. Algae had depleted soluble reactivephosphorus and silica to low concentrations.Therefore phytoplankton and bacteria are presentat low densities. Moreover, nitrogen depletion thattook place during the thermally stratified periodfavoured the development of inedible and toxiccyanobacteria (Anabaena, Aphanizomenon, Plank-tothrix, Limnothrix, Woronichinia). Metazoo-plankton did not significantly develop due to thelow density of nutrient-limited algae and the pre-sence of cyanobacteria (De Stasio et al., 1995;Reinikainen et al., 1999). Ciliates thus sufferedessentially from a bottom-up control during thisperiod.
At the beginning of October, themixing of wateroccurred due to the decrease in water temperature.Mixing replenished dissolved nutrient and algaewere able to grow. This last development washowever quite limited by temperature that waslower than 15 �C.
On the basis of the above considerations, thefollowing summary of hypotheses on controllingfactors acting on protozoa can be given. Thesehypotheses have been tested using still unpublishedin situ experiments. The seasonal dynamics ofprotozoa in the reservoir of Esch-sur-Sure is thusto be temperature-limited from November toMarch, not significantly limited during the earlyspring phytoplankton bloom and controlled bytop-down (metazooplankton predation or compe-tition) and bottom-up (algal resource depletion bymetazooplankton) factors at the onset of thethermal stratification. After the clear-water phase,top-down and bottom-up controls on ciliates werecertainly moderate as demonstrated by theirdevelopment at this period. In late summer, beforewater mixes again, ciliates were likely to becomefood-limited and declined. After water mixedagain, ciliates were not significantly biologicallycontrolled but certainly suffered increasingly fromwater temperature decrease.
Diversity and vertical distribution of protozoa
The distribution of the ciliated protozoa in thewater column seemed to be strongly governed bythe distribution of their nutritive resources (bac-terioplankton, phytoplankton, autotrophic andheterotrophic nanoflagellates). Algivorous ciliates(Prorodontida, Halteriida, Strombidiida) pre-vailed in the epilimnion (Fig. 3). The bacterivor-ous ciliates (Philasterida, Sessilida) were moreabundant in the intermediate and the deep layers,in relation to the bacterial densities in themetalimnion, and probably also to their toleranceto low oxygen concentrations (especially forPhilasterida, Simek et al., 1998). This vertical dis-tribution of the algivorous and bacterivorous cili-ates was similar to that observed by Muller et al.(1991a) in Lake Constance. The low densities ofciliates observed at the end of summer in thehypolimnion coincided with the lowest dissolvedoxygen concentrations. Thus, Prorodontida andTintinnida significantly and positively correlatedwith dissolved oxygen concentration in the deepzone, indicating that they do not tolerate oxygendepletion. Nevertheless, some genera of ciliates(Strobilidium, Colpoda, Vorticella) are less sensitiveto dissolved oxygen and were recorded over theentire water column.
56
Prorodontida (Urotricha, Balanion) are abun-dant and often dominate the community of fresh-water planktonic ciliates (Muller et al., 1991b;Weisse et al., 2001). They are primarily algivorous(Foissner & Berger, 1996) and their spatio-tem-poral distribution in the reservoir of Esch-sur-Surewas very similar to that of Cryptophytes. A com-parable phenomenon was observed in lake Pavin(Carrias et al., 1998). Jakobsen & Hansen (1997)experimentally demonstrated that Rhodomonassalinae with cell sizes around 8 lm was a highlysuitable food for Balanion. It is therefore very likelythat the population growth of Prorodontida wassupported by Cryptophytes during spring.
Halteriida and Strombidiida were mainly ob-served in the upper layer where they represented onaverage 39% of the total abundance of the ciliates.These organisms can feed on algae and bacteria andtheir maximum densities were observed duringperiods of high phyto- and bacterioplankton abun-dance. It can therefore be assumed that Halteriidaand Strombidiida were not food-limited inearly May, late July and late September whenthey abundantly developed. Jurgens et al. (1996)showed that ciliates could ingest significantquantities of HNF, with clearance rates similar tocopepods and cladocerans. Concomitant develop-ments of HNF and Oligotrichia (Halteriida andStrombidiida) in early May however indicated thatOligotrichia were not able to severely control HNFin the reservoir of Esch-sur-Sure.
In the Esch-sur-Sure reservoir, the developmentof Tintinnida essentially occurred in spring, beforethe thermal stratification and coincided with thebeginning of the diatom development. During thisperiod of the year, Tintinnida constituted thehighest contribution to the total abundance of theciliates community. Well-oxygenated and coldwater is indeed favourable to the growth of thisgroup of ciliates (Laybourn-Parry, 1992), as sug-gested notably by the presence of Tintinnida in thecold and oxygen-rich lower layer in April. This isin good agreement with the results of Pace (1982),who observed in the monomictic lake Oglethorpe asignificant development of Tintinnida during theperiod of water mixing. Zimmermann (1996) alsoobserved their development during the springphytoplankton development in a lake in northernGermany. The abundance of the Tintinnida in theintermediate layer during late March and at the
beginning of April, as well as in July, is probablyrelated to sedimenting diatoms. Indeed, diatomswith a size ranging from 6 to 30 lm represent animportant part of their food (Godhantaraman &Krishnamurthy, 1997; Kamiyama & Arima, 2001;Strom et al., 2001). Moreover, Tintinnopsis pro-duce its lorica using mineral concretions such asthe diatom frustules (Laybourn-Parry, 1992).
The small Scuticociliatia (Cyclidium, Uronema,Cinetochilum) are frequently observed in produc-tive systems (Pace, 1982; Simek et al., 1998; Carriaset al., 1998; Hart et al., 2000). This group of ciliatespresents an opportunistic bacterivorous behaviour(Laybourn-Parry, 1992; Foissner & Berger, 1996).They develop indeed when the nutritive resources(bacteria) are abundant, i.e. during the periods ofstrong phytoplanktonic production or importantsupplies of allochtonous matter (Pace, 1982; Mayeret al., 1997). In the Esch-sur-Sure reservoir, at thebeginning of 1999, high densities of Philasterida inthe surface and intermediate zones were observedconcurrently with high allochtonous input thatmost probably supported high bacterial growthrates. On the other hand, in July, the high con-centrations of chlorophyll a and the high bacterialdensities observed in the metalimnion constitutedprobably an important food source and wereprobably the determining factors of the presenceand the abundance of Philasterida. The higherrelative proportion of Philasterida in the hypo-limnion compared to the overlying layers suggeststhat these organisms benefit from a lower preda-tion by metazoans and by predatory ciliates, whichare less abundant in depth, as well as from a lowercompetition with the bacterivorous flagellates.
Sessilida (Vorticella, Epistylis) are commonlyobserved in the plankton of the mesotrophic andeutrophic lakes (Pace, 1982; Muller et al., 1991b;Arndt et al., 1993; Carrias et al., 1998), where theymainly feed on bacteria and find fixation sites onlarge algae. Colonial diatoms (e.g. Asterionella,Fragilaria) and filamentous cyanobacteria (e.g.,Anabaena) constitute their favourite supports(Laybourn-Parry, 1992). In the Esch-sur-Sure res-ervoir, as in the majority of mesotrophic lakes(Carrias et al., 1996; Krivtsov et al., 2000), thesealgae were abundant at the beginning of spring andin summer and an increase in Vorticella (fixed onAsterionella formosa) was observed during thisperiod of high bacterial abundance. This strategy
57

enables them to escape effectively from the meta-zooplankton predation, since the supports onwhich they are fixed are too large to be ingested.Moreover, these filter-feeding fixed ciliates havehigher ingestion rates on the picoplankton than onfree-living protists (Carrias et al., 1996).
Acknowledgements
We gratefully acknowledge Dr I. Thys for themetazooplankton data and Prof. J. P. Descy(FUNP, Namur) for the analyses of chlorophyll a.The work was supported by a fellowship from the‘‘Ministere de la Culture, de l�Enseignementsuperieur et de la Recherche’’ of the Grand-Duchyof Luxembourg (BFR98 016/LB) to V. J.
References
Arndt, H., M. Krocker, B. Nixdorf & A. Kohler, 1993.
Long-term annual and seasonal changes of meta- and
protozooplankton in lake Mugelsee (Berlin): effect of
eutrophication, grazing activities, and the impact of pre-
dation. Internationale Revue der Gesamten Hydrobiologie
78: 379–402.
Artolozaga, I., B. Ayo, A. Latatu, I. Azua, M. Unanue & J.
Irriberri, 2000. Spatial distribution of protists in the presence
of macroaggregates in a marine system. FEMS Microbial
Ecology 33: 191–196.
Bloem, J., M. J. B. Bar-Gilissen & T. E. Cappenberg, 1986.
Fixation, counting, and manipulation of heterotrophic
nanoflagellates. Applied and Environmental Microbiology
52: 1266–1272.
Bojanic, N., 2001. Seasonal distribution of the ciliated protozoa
in Kastela Bay. Journal of the Marine Biological Association
of the United Kingdom 81: 383–390.
Borsheim, K. Y. & G. Bradback, 1987. Cell volume to cell
carbon conversion factors for a bacterivorous Monas sp.
enriched from seawater. Marine Ecology Progress Series 36:
171–175.
Caron, D. A., 1983. Technique for enumeration of heterotro-
phic and phototrophic nanoplankton, using epifluorescence
microscopy, and comparison with other procedures. Applied
and Environmental Microbiology 46: 491–498.
Carrias, J. F., C. Amblard & G. Bourdier, 1996. Protistan bac-
terivory in an oligomesotrophic lake: importance of attached
ciliates and flagellates. Microbial Ecology 31: 249–268.
Carrias, J. F., C. Amblard & G. Bourdier, 1998. Seasonal
dynamics and vertical distribution of planktonic ciliates
and their relationship to microbial food resources in the
oligomesotrophic lake Pavin. Archiv fur Hydrobiologie 143:
227–255.
Cleven, E. J. & T. Weisse, 2001. Seasonal succession and taxon-
specific bacterial grazing rates of heterotrophic nanoflagellates
in Lake Constance. Aquatic Microbial Ecology 23: 147–161.
Foissner, W. & H. Berger, 1996. A user-friendly guide to the
ciliates (Protozoa, Ciliophora) commonly used by hydrobi-
ologists as bioindicators in rivers, lakes, and waste waters,
with notes on their ecology. Freshwater Biology 35: 375–482.
Foissner, W., H. Berger & F. Kohmann, 1992. Taxonomische
und okologische Revision der Ciliaten des Saprobiensys-
tems – Band II: Peritrichia, Heterotrichia, Odontostomat-
ida. Informationsberichte des Bayerischen Landesamt fur
Wasserwirtschaft, Munchen, Heft 5/92, 502 pp.
Foissner, W., H. Berger & F. Kohmann, 1994. Taxonomische
und okologische Revision der Ciliaten des Saprobiensys-
tems – Band III: Hymenostomata, Prostomatida, Nassulida.
Informationsberichte des Bayerischen Landesamt fur
Wasserwirtschaft, Munchen, Heft 1/94, 548 pp.
Foissner, W., H. Blatterer, H. Berger & F. Kohmann, 1991.
Taxonomische und okologische Revision der Ciliaten des
Saprobiensystems – Band I: Cyrtophorida, Oligotrichida,
Hypotrichia, Colodea. Informationsberichte des Bayerischen
Landesamt fur Wasserwirtschaft, Munchen, Heft 1/91,
478 pp.
Foissner, W, H. Blatterer, H. Berger & F. Kohmann, 1995.
Taxonomische und okologische Revision der Ciliaten des
Saprobiensystems – Band IV: Gymnostomatea, Loxodes,
Suctoria. Informationsberichte des Bayer. Landesamt fur
Wasserwirtchaft, Munchen, Heft 1/95, 540 pp.
Gasol, J. M., A. M. Simons & J. Kalff, 1995. Patterns in the
top-down versus bottom-up regulation of heterotrophic
nanoflagellates in temperate lakes. Journal of Plankton
Research 17: 1879–1903.
Godhantaraman, N. & K. Krishnamurthy, 1997. Experimental
studies on food habits of tropical microzooplankton: prey-
predator interrelationship. Indian Journal of Marine
Sciences 26: 345–349.
Hart, D. R., L. Stone & T. Berman, 2000. Seasonal dynamics of
the lake Kinneret food web: the importance of the microbial
loop. Limnology and Oceanography 45: 350–361.
Hobbie, J. E., R. J. Daley & S. Jasper, 1977. Use of Nu-
cleopore filters for counting bacteria by fluorescence
microscopy. Applied and Environmental Microbiology 33:
1225–1228.
Jack, J. D. & J. Gilbert, 1993. Susceptibilities of different-sized
ciliates to direct suppression by small and large cladocerans.
Freshwater Biology 29: 19–29.
Jack, J. D. & J. Gilbert, 1994. Effects of Daphnia on micro-
zooplankton communities. Journal of Plankton Research 16:
1499–1512.
Jack, J. D. & J. Gilbert, 1997. Effects of metazoan predators on
ciliates in freshwater plankton communities. Journal of
Eukaryotic Microbiology 44: 194–199.
Jakobsen, H. & P. J. Hansen, 1997. Prey size selection, grazing
and growth response of the small heterotrophic dinofla-
gellate Gymnodinium sp. and the ciliate Balanion comatum-
a comparative study. Marine Ecology Progress Series 158:
75–86.
58
Jurgens, K., 1994. Impact of Daphnia on planktonic microbial
food webs - A review. Marine Microbial Food Webs 8:
295–324.
Jurgens, K., S. A. Wickham, K. O. Rothhaupt & B. Santer,
1996. Feeding rates of macro- and microzooplankton on
heterotrophic nanoflagellates. Limnology and Oceanogra-
phy 41: 1833–1839.
Kamiyama, T. & S. Arima, 2001. Feeding characteristics of two
tintinnid ciliate species on phytoplankton including harmful
species: effects of prey size on ingestion rates and selectivity.
Journal of Experimental Marine Biology and Ecology 257:
281–296.
Krivtsov, V., E. G. Bellinger & D. C. Sigee, 2000. Changes in
the elemental composition of Asterionella formosa during the
diatom spring bloom. Journal of Plankton Research 22:
169–184.
Lampert, W., W. Fleckner, H. Rai & B. E. Taylor, 1986.
Phytoplankton control by grazing zooplankton: a study on
the spring clear-water phase. Limnology and Oceanography
31: 478–490.
Laybourn-Parry, J, 1992. Protozoan Plankton Ecology Chap-
man & Hall New York, 248 pp.
Laybourn-Parry, J., 1994. Seasonal succession of protozoo-
plankton in freshwater ecosystems of different latitudes.
Marine Microbial Food Webs 8: 145–162.
Lynn, D. H. & E. B. Small, 1997. A revised classification of the
Phylum Ciliophora Dolfein, 1901. Revista de la Sociedad
Mexicana de Historia Natural 47: 65–78.
Macek, M., K. Simek, J. Pernthaler, V. Vyhnalek & R. Psenner,
1996. Growth rates of dominant planktonic ciliates in two
freshwater bodies of different trophic degree. Journal of
Plankton Research 18: 463–481.
Mayer, J., M. Dokulil, M. Salbrechter, M. Berger, T. Posh, G.
Pfister, A.K.Kirschner, B. Velimirov,A. Steitz&T.Ulbricht,
1997. Seasonal successions and trophic relations between
phytoplankton, zooplankton, ciliate and bacteria in a hyper-
trophic shallow lake in Vienna, Austria. Hydrobiologia 342/
343: 165–174.
Muller, H., 1989. The relative importance of different ciliate
taxa in the pelagic food web of Lake Constance. Microbial
Ecology 18: 261–273.
Muller, H., W. Geller & A. Schone, 1991a. Pelagic ciliates in
lake Constance: comparison of epilimnion and hypolimnion.
Verhandlungen Internationale Vereinigung fur Limnologie
24: 846–849.
Muller, H., A. Schone, R. M. Pinto-Coelho, A. Schweizer & T.
Weisse, 1991b. Seasonal succession of ciliates in lake Con-
stance. Microbial Ecology 21: 119–138.
Pace, M., 1982. Planktonic ciliates: their distribution, abun-
dance, and relationship to microbial resources in a mono-
mictic lake. Canadian Journal of Fisheries and Aquatic
Sciences 39: 1106–1116.
Patterson, D. J., 1996. Free-Living Freshwater Protozoa – A
Colour Guide. John Wiley & Sons Inc, New York, 223 pp.
Porter, K. G. & Y. S. Feig, 1980. The use of DAPI for identi-
fying and counting aquatic microflora. Limnology and
Oceanography 25: 943–948.
Prepas, E., 1978. Sugar-frosted Daphnia: an improved fixation
technique for Cladocera. Limnology and Oceanography 23:
557–559.
Putt, M. & D. K. Stoecker, 1989. An experimentally determined
carbon: volume ratio for marine ‘‘oligotrichous’’ ciliates
from estuarine and coastal waters. Limnology and Ocean-
ography 34: 1097–1103.
Puytorac, P. & J. P. Grain Mignot, 1987. Precis de Protistolo-
gie. Ed. Boubee, Paris, 581 pp.
Reinikainen, M., J. Hietala & M. Walls, 1999. Reproductive
allocation in Daphnia exposed to toxic cyanobacteria. Jour-
nal of Plankton Research 21: 1553–1564.
Sanders, R. W., D. A. Leeper, C. H. King & K. G. Porter, 1994.
Grazing by rotifers and crustaceans zooplankton on nano-
planktonic protists. Hydrobiologia 288: 167–181.
Sanders, R. W. & K. G. Porter, 1986. Use of metabolic inhib-
itors to estimate protozooplankton grazing and bacterial
production in a monomictic eutrophic lake with an anaero-
bic hypolimnion. Applied and Environmental Microbiology
52: 101–107.
Sanders, R. W. & S. A. Wickham, 1993. Planktonic protozoa
and metazoa: predation, food quality and population con-
trol. Marine Microbial Food Webs 7: 197–223.
Sarnelle, O., 1997. Daphnia effects on microzooplankton:
comparisons of enclosure and whole-lake responses. Ecology
78: 913–928.
Simek, K., D. Babenzien, T. Bittl, R. Koschel, M. Macek, J.
Nedoma & J. Vrba, 1998. Microbial food webs in an artifi-
cially divided acidic bog lake. International Review of
Hydrobiology 83: 3–18.
Sime-Ngando, T. & C. A. Groliere, 1991. Effets quantitatifs des
fixateurs sur la conservation des cilies planctoniques d�eaudouce. Archiv fur Protistenkunde 140: 109–120.
Stasio, B., L. Rudstam, A. Haning, P. Soranno & Y. Allen,
1995. An in situ test of the effects of food quality on Daphnia
population growth. Hydrobiologia 307: 221–230.
Sterner, R. W., 1989. The role of grazers in phytoplankton
succession. In Sommer, U (ed.) Plankton Ecology, Succession
in Plankton Communities. Springer-Verlag, Berlin, 107–170.
Strom, S. L., M. A. Brainard, J. L. Holmes & M. B. Olson,
2001. Phytoplankton blooms are strongly impacted by mi-
crozooplankton grazing in coastal North Pacific waters.
Marine Biology 138: 355–368.
Thouvenot, A., M. Richardot, D. Debroas & J. Devaux, 1999.
Bacterivory of metazooplankton, ciliates and flagellates in a
newly flooded reservoir. Journal of Plankton Research 21:
1659–1679.
Thys, I. & L. Hoffmann, 2005. Diverse responses of planktonic
crustaceans to fish predation by shifts in depth selection and
size at maturity. Hydrobiologia 551: 87–98.
UNESCO, 1966. Determination of photosynthetic pigments in
seawater. Report of SCOR-UNESCO Working group 17,
Paris.
Utermohl, H., 1958. Zur Vervollkommnung der quantitativen
Phytoplankton-Methodik. Mitteilungen der Internationalen
Vereinigung fur theoretische und angewandte Limnologie 9:
1–38.
59
Ventela, A.M., V. Saarikari &K. Vuorio, 1998. Vertical and sea-
sonal distribution of micro-organisms, zooplankton and phy-
toplankton in a eutrophic lake.Hydrobiologia 363: 229–240.
Verity, P. G. & C. Langdon, 1984. Relationships between
lorica volume, carbon, nitrogen, and ATP content of tin-
tinnids in Narraganset Bay. Journal of Plankton Research
6: 859–868.
Vollenweider, R. A. & J. Kerekes, 1982. Eutrophication of
Waters. Monitoring, Assessment and Control. Organization
for Economic Co-Operation and Development (OECD),
Paris, 156.
Weisse, T., N. Karstens, V. C. L. Meyer, L. Janke, S. Lettner &
S. X. Teichgraber, 2001. Niche separation in common
Prostome freshwater ciliates: the effect of food and temper-
ature. Aquatic Microbial Ecology 26: 167–179.
Weisse, T. & H. Muller, 1998. Planktonic protozoa and the
microbial food web in Lake Constance. Archiv fur Hydro-
biologie Special issues Advances in Limnology 53: 223–254.
Zimmermann, H., 1996. Interactions between planktonic pro-
tozoans and metazoans after the spring bloom of phyto-
plankton in a eutrophic lake, the Belauer See, in the
Bornhoveder Seenkette, North Germany. Acta Protozoo-
logica 35: 215–221.
60