Embed Size (px)
Citation preview

arX
iv:a
stro
-ph/
0403
287v
2 2
1 M
ay 2
004
Accepted for the publication in the Astrophysical Journal
Spatial Variation of the X-ray spectrum of the Crab Nebula
Koji Mori and David N. Burrows
Department of Astronomy and Astrophysics, Pennsylvania State University, 525 Davey
Laboratory, University Park, PA. 16802, USA
J. Jeff Hester
Department of Physics and Astronomy, Box 871504, Arizona State University, Tyler Mall,
Tempa, AZ. 85287-1504, USA
George G. Pavlov
Department of Astronomy and Astrophysics, Pennsylvania State University, 525 Davey
Laboratory, University Park, PA. 16802, USA
Shinpei Shibata
Department of Physics, Yamagata University, Yamagata 990-8560, Japan
and
Hiroshi Tsunemi
Department of Earth and Space Science, Graduate School of Science, Osaka University, 1-1
Machikaneyama, Toyonaka, Osaka 560-0043, Japan
ABSTRACT
We present spectral analysis of the Crab Nebula obtained with the Chandra
X-ray observatory. The X-ray spectrum is characterized by a power-law whose
index varies across the nebula. The variation can be discussed in terms of the
particle injection from the pulsar in two different directions: the equatorial plane
containing the torus and the symmetry axis along the jet. In the equatorial
plane, spectra within the torus are the hardest, with photon index α ≈ 1.9, and
are almost independent of the surface brightness. At the periphery of the torus,

– 2 –
the spectrum gradually softens in the outer, lower surface brightness regions, up
to α ≈ 3.0. This indicates that synchrotron losses become significant to X-ray
emitting particles at the outer boundary of the torus. We discuss the nature
of the torus, incorporating information from observations at other wavelengths.
Spectral variations are also seen within the southern jet. The core of the jet is
the hardest with α ≈ 2.0, and the outer sheath surrounding the core becomes
softer with α up to 2.5 at the outermost part. Based on the similarity between
the spectra of the jet core and the torus, we suggest that the electron spectra
of the particles injected from the pulsar are also similar in these two different
directions. The brightness ratio between the near and far sides of the torus can be
explained by Doppler boosting and relativistic aberration; however, the observed
ratio cannot be derived from the standard weakly magnetized pulsar wind model.
We also found a site where an optical filament comprised of supernova ejecta is
absorbing the soft X-ray emission (< 2 keV).
Subject headings: ISM: individual (Crab Nebula) — supernova remnants — X-
rays: ISM
1. INTRODUCTION
The observed pulsating radiation is only a small fraction of a pulsar’s spin-down energy.
The bulk of this energy is carried off in the form of a magnetized, relativistic pulsar wind.
This pulsar wind is randomized by a shock where its pressure balances that of the ambient
material (Rees & Gunn 1974; Kennel & Coroniti 1984). Diffuse synchrotron radiation is
expected to arise from the randomized pulsar wind, forming a pulsar wind nebula (PWN).
Although this general idea is widely accepted, details of the formation are still controversial.
For example, it is a long-standing problem that the ratio of the Poynting flux to the particle
kinetic flux just upstream of the shock, σ, is much smaller than 10−2, in spite of expectations
that the ratio at the light cylinder is larger than unity (e.g., Arons 2002). Additionally, the
formation of the torus and the collimation of the pulsar wind to form a jet along the rotational
axis are quite curious but unresolved problems.
An X-ray observation is a powerful probe to peer into the inner PWN, whose spectral
and morphological properties provide essential information to answer such questions. Recent
Chandra and XMM-Newton observations increased the number of objects where spatially
resolved X-ray spectroscopy within the PWN can be performed. In a number of PWNe, the
spectrum of the outer edges of the PWN is observed to be softer than the spectrum of the
center (e.g., G21.5−0.9, Slane et al. 2000, Safi-Harb et al. 2001; 3C 58, Bocchino et al. 2001;
– 3 –
G0.9+0.1, Porquet et al. 2003; G54.1+0.3, Lu et al. 2002; Vela, Kargaltsev & Pavlov 2004).
Since the synchrotron energy losses are proportional to the square of the particle energy,
the higher energy particles have shorter life times and the spectrum becomes softer as they
move down the post-shock flow, which is in general agreement with these observations. Such
spatial variation of the spectrum can be used to verify theoretical models and to provide
new diagnostics for the study of PWNe.
The Crab Nebula has been one of the best examples for investigating a PWN. Its X-ray
brightness and large apparent structure including the torus (Aschenbach & Brinkmann 1975)
and jets (Brinkmann, Aschenbach, & Langmeier 1985) make it an ideal target for spatially
resolved X-ray spectroscopy. Previous Chandra and XMM-Newton observations have also
shown spectral softening of the Crab (Weisskopf et al. 2000; Willingale et al. 2001). Here,
we present spectral analysis results from multiple observations of the Crab Nebula with the
Advanced CCD Imaging Spectrometer (ACIS) on board Chandra, which are derived from
the monitoring program described by Hester et al. (2002).
2. OBSERVATION AND ANALYSIS
Owing to the X-ray brilliance of the Crab Nebula, observations with the Chandra ACIS
instrument are technically challenging. The high count rate generally causes two problems in
the data acquisition: telemetry saturation and event pile-up (caused by more than one photon
depositing charge in a given pixel during a CCD exposure, thereby compromising our ability
to measure the energy of each individual photon). Although telemetry saturation results in
loss of observing efficiency, it does not lead to biased estimates of physical parameters (e.g.,
count rate) because events are discarded in a unit of frames, not event by event. On the
other hand, pile-up makes interpretation of spectral results problematic, since it converts
two photons into a single “event” which has apparent energy equal to the sum of the photon
energies. This results in underestimated count rate and hardens the detected spectrum, as
discussed in Weisskopf et al. (2000).
We observed the Crab Nebula eight times (Table 1), using an instrumental mode of
ACIS-S different from that of Weisskopf et al. (2000) in order to reduce pile-up. We adopted
a frame time of 0.2 sec instead of the standard frame time of 3.2 seconds, but we did not
utilize the grating to reduce count rate. This reduced the counts pixel−1 frame−1 by a
factor of 2.3 with respect to the data of Weisskopf et al. (2000), while improving statistics
by increasing the total number of counts by one order of magnitude for a similar effective
exposure time. Since the Crab Nebula is a diffuse source, the event pile-up was suppressed
by more than a factor of 2.3. The observational parameters (e.g., telemetry format of graded
– 4 –
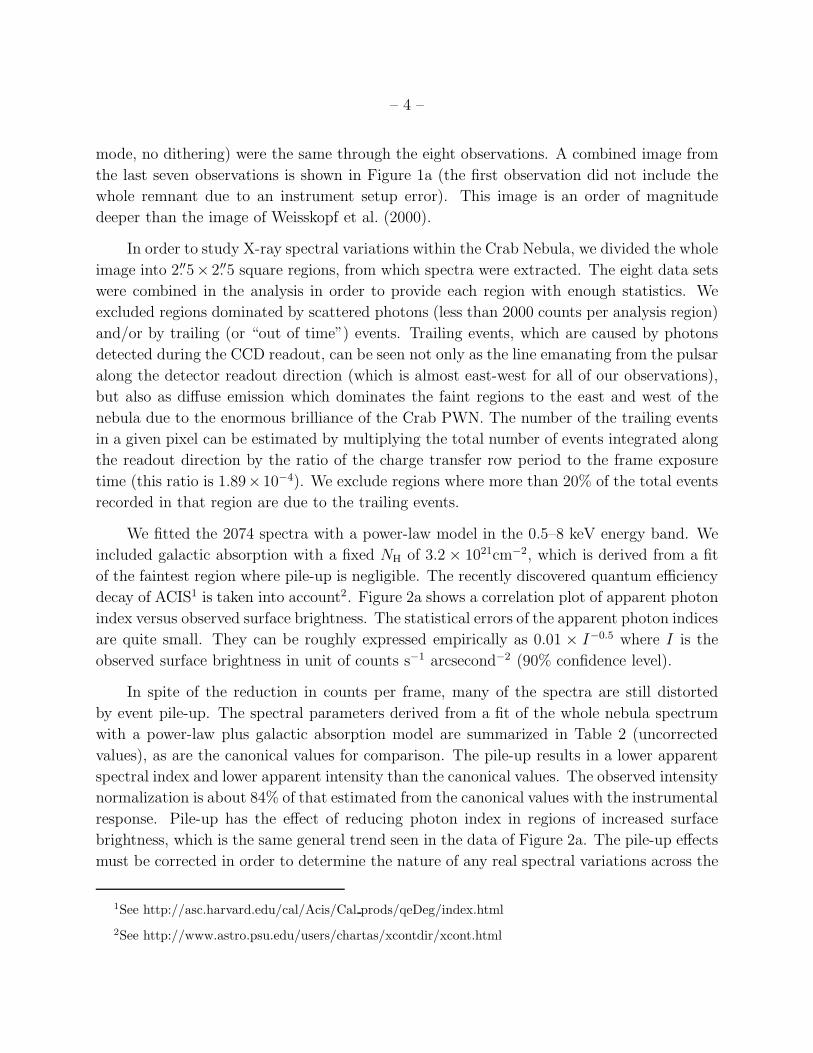
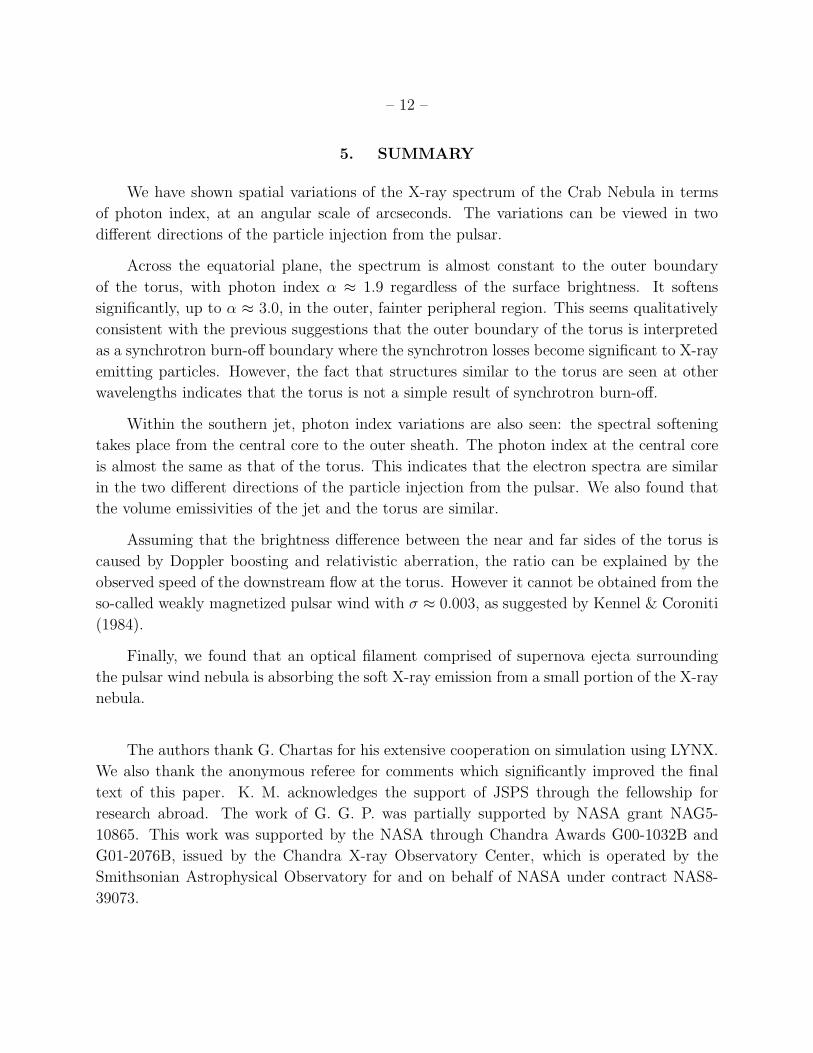
mode, no dithering) were the same through the eight observations. A combined image from
the last seven observations is shown in Figure 1a (the first observation did not include the
whole remnant due to an instrument setup error). This image is an order of magnitude
deeper than the image of Weisskopf et al. (2000).
In order to study X-ray spectral variations within the Crab Nebula, we divided the whole
image into 2.′′5× 2.′′5 square regions, from which spectra were extracted. The eight data sets
were combined in the analysis in order to provide each region with enough statistics. We
excluded regions dominated by scattered photons (less than 2000 counts per analysis region)
and/or by trailing (or “out of time”) events. Trailing events, which are caused by photons
detected during the CCD readout, can be seen not only as the line emanating from the pulsar
along the detector readout direction (which is almost east-west for all of our observations),
but also as diffuse emission which dominates the faint regions to the east and west of the
nebula due to the enormous brilliance of the Crab PWN. The number of the trailing events
in a given pixel can be estimated by multiplying the total number of events integrated along
the readout direction by the ratio of the charge transfer row period to the frame exposure
time (this ratio is 1.89×10⁻⁴). We exclude regions where more than 20% of the total events
recorded in that region are due to the trailing events.
We fitted the 2074 spectra with a power-law model in the 0.5–8 keV energy band. We
included galactic absorption with a fixed NH of 3.2 × 1021cm−2, which is derived from a fit
of the faintest region where pile-up is negligible. The recently discovered quantum efficiency
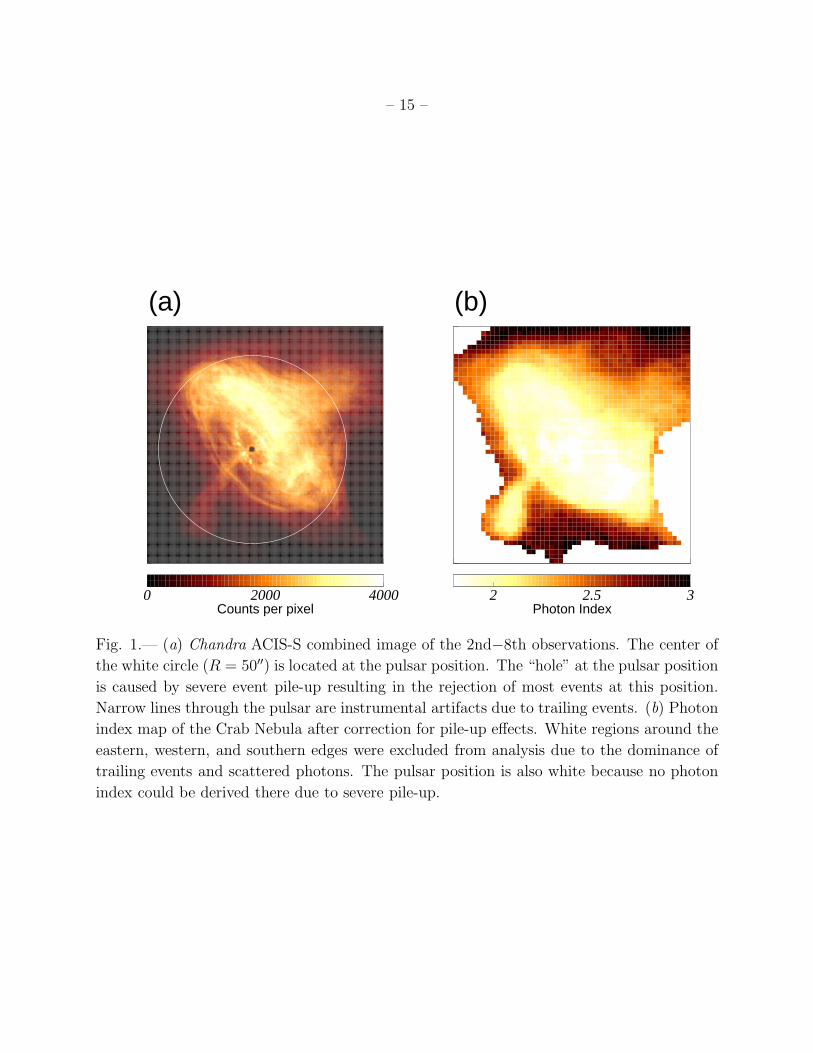
decay of ACIS1 is taken into account2. Figure 2a shows a correlation plot of apparent photon
index versus observed surface brightness. The statistical errors of the apparent photon indices
are quite small. They can be roughly expressed empirically as 0.01 × I−0.5 where I is the
observed surface brightness in unit of counts s−1 arcsecond−2 (90% confidence level).
In spite of the reduction in counts per frame, many of the spectra are still distorted
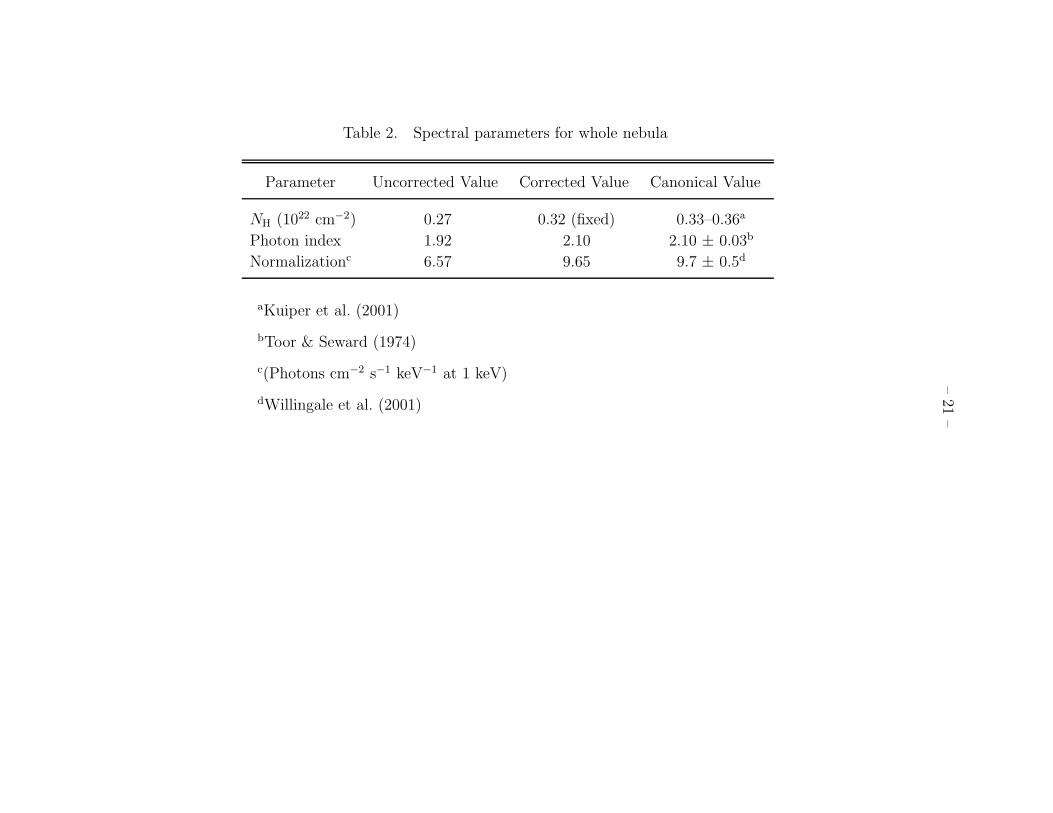
by event pile-up. The spectral parameters derived from a fit of the whole nebula spectrum
with a power-law plus galactic absorption model are summarized in Table 2 (uncorrected
values), as are the canonical values for comparison. The pile-up results in a lower apparent
spectral index and lower apparent intensity than the canonical values. The observed intensity
normalization is about 84% of that estimated from the canonical values with the instrumental
response. Pile-up has the effect of reducing photon index in regions of increased surface
brightness, which is the same general trend seen in the data of Figure 2a. The pile-up effects
must be corrected in order to determine the nature of any real spectral variations across the
1See http://asc.harvard.edu/cal/Acis/Cal prods/qeDeg/index.html
2See http://www.astro.psu.edu/users/chartas/xcontdir/xcont.html

– 5 –
Crab nebula.
In order to estimate how pile-up distorts the incident spectrum, we utilized the spectral
simulator tool LYNX (Chartas et al. 2000). LYNX traces the propagation of individual
photons through the mirror and ACIS via the raytrace tool MARX (Wise et al. 1997) and
the PSU ACIS Monte Carlo CCD simulator (Townsley et al. 2001), respectively. Since
LYNX takes into account the possible overlap of the resulting charge clouds within each
CCD exposure frame, spectra affected by pile-up can be simulated for both point sources
and diffuse sources. We simulated the observed Crab spectrum for several different values
of true surface brightness and for true photon indices of 1.5, 2.0, and 2.5. The results are
superposed on the data in Figure 2a. The expected reduction of apparent photon index in
higher surface brightness regions is evident. However, it is also clear that the variations in
observed photon indices greatly exceed those expected from pile-up, and there are certainly
real spectral variations across the Crab Nebula, as described by Weisskopf et al. (2000).
We used the LYNX simulation results to correct the data points in Figure 2a for the
photon index and surface brightness errors induced by the pile-up effects. For each data
point, we interpolated the simulated data points to the observed surface brightness and
photon index and calculated the corresponding true surface brightness and photon index.
Figure 2b presents a correlation plot of the corrected data points. This simulation was
intended to give corrections on the data points in Figure 2a and was not adjusted to correct
the whole nebula spectrum in order to match to the canonical spectral parameters. However,
we used the corrected photon indices and surface brightnesses of each data point in Figure 2b
to calculate a corrected spectrum for the whole nebula and we present the results in Table 2
(corrected values). The photon index and the normalization factor of the corrected spectrum
agree well with the canonical values within the errors, which strongly supports the success of
our pile-up corrections. Hereafter, we use the terms “photon index” and “surface brightness”
to mean these corrected values.
We should note a limitation of our simulation. Our corrections are based on modeling of
a uniform diffuse source. We apply them to each 2.′′5×2.′′5 square region under the reasonable
assumption that the surface brightness within each region is uniform. Therefore, application
of this technique to small complicated structures like the inner ring or the relativistically
expanding wisps requires more complex modeling which is beyond the scope of this work.
The systematic errors of the photon index mainly come from this assumption. Judging from
the results of the simulation shown in Figure 2a and typical surface brightness fluctuations
of ∼ 10% within an analysis region, the systematic errors in photon index are ∼ 0.05 and
dominate the statistical errors.
Figure 1b shows a map of the photon index. The structure in the torus is more sym-

– 6 –
metrical about the pulsar in the photon index map than in the broad-band image (Fig. 1a).
While Doppler boosting and relativistic aberration brighten the northwestern portion of the
torus (Pelling et al. 1987) in the Figure 1a image, by contrast there is relatively little variation
of the photon index within the torus. The hardest structures in the nebula, with photons
indices as low as 1.8, are the inner ring and portions of the torus, including the circular
structures seen at each extremity of the torus discovered in the first Chandra observation
(Weisskopf et al. 2000). However, these regions contain small complex structures and the
hardest photon index should be re-examined using data set free from pile-up. The entire
torus is quite hard (α ≈ 1.9) compared with the outer portions of the nebula. The southern
jet is also relatively hard (α ≈ 2.0), whereas the northern counter jet is significantly softer
(α ≈ 2.25). The bright region around the counter jet to the northwest of the torus, here-
after called the “umbrella” because of its shape, has even softer emission (α ≈ 2.5). Photon
indices as large as 3.0 are found in the outer peripheral portions of the nebula.
3. RESULTS
We studied the spatial variation of the photon index over the nebula. As a first step,
we divided the nebula into four prominent regions: the torus, the umbrella, the jet, and the
peripheral region. We took the torus region as an ellipse bounding the far side of the torus.
We also added two circles at each extremity of the ellipse to include the circular structures
in the torus region. The rest of the bright nebula was taken as the umbrella region. The
jet region covers only the southern jet. The peripheral region includes the faint emission
surrounding the torus and umbrella regions except for the jet. Figure 3 shows that those
four regions occupy separate regions in the plot of photon index against surface brightness,
with the umbrella region significantly overlapping the torus and periphery. The color coding
is shown in the inset figure.
The data points of the region within the torus (red) form a band with nearly constant
photon index of ≈ 1.9 over a wide range of surface brightness (more than a factor of 4).
Although the spectral index increases slightly for surface brightness below 0.4 counts s−1
arcsecond−2, this result shows that our spectral corrections were successful in removing the
spectral distortion due to pile-up.
The data points of the peripheral region (green) dominate the low surface brightness
/ high photon index region. The photon indices at the periphery of the bright nebula are
strongly anticorrelated to the surface brightness, even after correcting for pile-up effects.
This makes a marked contrast to the constancy of the photon index in the torus, especially
considering that the variation of the surface brightness in the periphery is 1/3 of that in the
– 7 –
torus.
The photon indices of the jet (blue) are generally small compared to those of the periph-
eral regions although their surface brightnesses are comparable. The jet also shows a strong
anticorrelation between surface brightness and photon index, again suggesting softening of
the underlying electron spectrum at the boundaries of the jet.
The remaining population corresponds to the umbrella region (yellow). Although dis-
tributed over a similar wide range of surface brightness, the photon indices in the umbrella
are generally greater than those of the torus region. In fact, the umbrella and torus merge
both spatially and spectrally. The umbrella is seen only at the northern part of the nebula
and has no counterpart with similar brightness in the south, where the jet is much more
distinct.
4. DISCUSSION
4.1. Photon Index Variation
We found photon index variations across the nebula on arcsecond scales which are similar
to those reported by Weisskopf et al. (2000) and Willingale et al. (2001) on larger angular
scales. The photon index variations should be discussed along the two different directions of
particle injection from the pulsar: the direction in the equatorial plane containing the torus,
and the direction of the jet along the symmetry axis. We first consider the equatorial plane.
Although the standard model of the Crab Nebula given by Kennel and Coroniti (1984)
assumes a spherical symmetry, it can be adapted to regions of limited solid angle in the
equatorial plane. Across the equatorial plane, the spectrum is almost constant to the outer
boundary of the torus, but softens significantly beyond this boundary. In the standard pic-
ture, the outer boundary of the torus is interpreted as a synchrotron burn-off boundary where
the synchrotron losses become significant to the X-ray emitting particles. Until the outward
post-shock flow reaches the torus, the synchrotron critical energy, Ec, must be greater than
10 keV and falls outside the Chandra X-ray band (0.5–8 keV). Here, the synchrotron critical
energy is defined as the energy at which a spectral break occurs in the power-law spectrum.
Due to the shorter synchrotron life time of higher energy particles, the value of Ec
for a given flow element decreases with time, hence with distance from the shock. Kennel
and Coroniti (1984) gave Ec as a function of radius from the pulsar and explained the
energy dependence of the overall nebular extent from optical to hard X-ray (∼ 60keV). In
this picture, if the outer boundary of the X-ray torus is where the synchrotron burn-off

– 8 –
takes place in the X-ray band, then, in the same manner, larger tori are expected in the
optical and radio bands. However, it is remarkable that the size of the torus does not change
significantly over a wide bandpass. Optical images clearly show the torus and related circular
structures with the same size as the X-ray images, albeit with less contrast (Hester et al.
2002). Temporal variations between two radio images taken 2 months apart also revealed a
torus-like elliptical structure of the same size (Bietenholz et al. 2001). In hard X-ray images
(22–43keV and 43–64keV; Pelling et al. 1987), again the nebular extent is similar to that of
the torus seen in the soft X-ray band, in contradiction to an expectation that they should
be smaller. Additionally, Shibata et al. (2003) showed that the observed surface brightness
decreases as a function of distance beyond the torus much faster than expected from the
Kennel & Coroniti model. Therefore, we suggest that the torus seen from radio to hard X-
rays is not a simple result of synchrotron burn-off in a radial post-shock flow. The standard
Kennel & Coroniti flow solution should be modified to include the torus structure observed
in common over the wide bandpass. Detailed small-scale comparison of the synchrotron
burn-off boundary between the X-ray and optical bands will reveal the true nature of the
torus, which is the subject of a subsequent paper.
Figure 4 shows a close-up view of the photon index map around the southern jet. It
shows that the spectral softening occurs from the central core of the jet, with ≈ α of 2.0, to
the outer fainter sheath regions, with ≈ α of 2.5. Considering the cylindrical structure of the
jet, the observed spectrum of the jet core is integrated through this structure and includes
contributions from the softer outer sheath regions. The true photon index of the jet core is
therefore even harder than 2.0, and must be close to that seen within the torus. Willingale
et al. (2001), using XMM-Newton, reported that the jet has a spectrum steeper than the
torus by 0.3, implying that the corresponding electron spectra differ by 0.6. However, this
conclusion is based on the spectrum integrated all over the jet. The similarity of the jet core
spectrum to that of the torus indicates that the electron spectra are actually rather similar
in the two different directions of particle injection from the pulsar. This may give a strong
constraint on theoretical models of magnetic collimation.
We estimate the fraction of the X-ray luminosity that comes from the jets as ∼ 4%,
with ∼3% from the southern jet and ∼1% from the counter jet. The bright umbrella makes
it difficult to estimate the luminosity from the counter jet and results in a relatively large
uncertainty in its luminosity, although the discussion here is little affected. The jet luminosity
fraction is close to the ratio of the volumes of the jets and the torus,
2∫ Rj
0
∫ θj
0
∫
2π
0r2 sin θ dr dθ dφ
∫ Rt
0
∫π2+θt
π2−θt
∫ 2π
0r2 sin θ dr dθ dφ
=1 − cos θj
sin θt
(
Rj
Rt
)3
, (1)
– 9 –
where Rt, Rj, θt and θj are the radii and semi-opening angles of the torus and the jet.
From Figure 1a, we see that Rt ≈ Rj and that θt and θj are 12◦ and 8◦, respectively. Then,
Equation (1) gives a ratio of about 5% for these volumes. Considering the uncertainties in
the opening angles and model assumptions, the fraction of the total X-ray luminosity in the
jet is comparable to its volume fraction, indicating that the volume emissivities of the jet and
the torus are similar, even though they represent orthogonally different directions of particle
injection from the pulsar. Taking Rt = Rj = 50 arcseconds (≃ 0.5 pc assuming the distance
of 2 kpc to the Crab Nebula) in the above equation (see Fig. 1a) and an X-ray luminosity
in the 0.5–8 keV band of 1.3 ×1037 erg s−1, which is estimated from the canonical spectral
parameters, we obtain an average volume emissivity of ∼ 4 ×10⁻¹⁸ erg s−1 cm−3.
4.2. Surface Brightness Ratio between Near and Far Sides of the Torus
The north-western (NW) part of the torus, which is the near side, is much brighter than
the south-eastern (SE) part. The post-shock flows in the NW and SE parts are relativis-
tically approaching and receding from us, respectively. Therefore, those apparent surface
brightnesses are subject to Doppler boosting and relativistic aberration. Considering these
effects, the surface brightness ratio of the NW part to the SE part should be given by
(
1 + β cos θ
1 − β cos θ
)α+2
, (2)
where θ is the angle measured in the observer’s frame between the direction of the flow and
the line of sight, α is the photon index, and β is the flow speed at the torus normalized to
the speed of light (Rybicki & Lightman 1979).
Hester et al. (2002) showed that the inner ring, which is inside the torus, is highly
variable and that wisps moving at about 0.5c are emerging from the inner ring. This provides
strong evidence that the inner ring represents the pulsar wind termination shock, whereas
the torus is a downstream structure. Since the post-shock flow is sub-sonic, the flow speed
decreases as a function of distance. Hester et al. (2002) and Mori (2002) showed that the
projected speed of the far side of the torus is 0.03c–0.1c, measured directly east of the
pulsar. The relatively large uncertainty is due to the small angular displacement of the
far side of the torus. Considering relativistic effects and the geometry of the torus, where
the rotational-symmetry axis lies about 58◦ west of north and about 25◦ out of the celestial
plane, these speeds correspond to true speeds of 0.07c–0.25c (0.15c). The value in parentheses
is calculated for the central value of the projected speed range, 0.065c. With α = 1.9, these
values should result in a surface brightness ratio of 1.6–6.3 (2.9). The observed surface

– 10 –
brightness ratio in Figure 1a is about 3.4, which agrees with the speed range inferred from
above discussion.
Kennel & Coroniti (1984) deduced the post-shock flow speed as a function of z, the
distance from the pulsar normalized to the shock radius, for different values of the magneti-
zation parameter σ, the ratio of the Poynting flux to the particle kinetic flux upstream of the
shock. From Figure 1a, z is about 2.7 at the distance where we measured the speed of the
torus. Kennel & Coroniti suggested that σ is about 0.003 based on theoretical arguments,
which would correspond to a velocity of about 0.05c at the torus (from Fig. 3 of Kennel &
Coroniti), far below our measured value. Shibata et al. (2003) constructed a two-dimensional
model image of the Crab Nebula in the framework of the Kennel & Coroniti model, and found
that the model surface brightness ratio between the near and far sides of the torus is about
1.3 for σ = 0.003, also much lower than the observed value. By contrast, our measured
speed of 0.07c–0.25c (0.15c), which predicts the correct surface brightness ratio, corresponds
to σ = 0.01–0.13 (0.05). The theoretical speed and brightness ratio values can be reconciled
with the measured ones if we assume a σ of about 0.05.
It is worth noting that departures from spherical symmetry and proper treatment of
radiative losses in the flow can both affect this result. It is likely that the flow is confined
to a narrow range of latitudes around the equatorial plane upstream of the shock (the inner
ring). After the shock the flow diverges out of the plane more rapidly than a radial flow
to form the broad torus. This should result in more rapid deceleration than in a spherical
model. Any radiative losses of particle pressure may also lead to greater compression and
hence more rapid deceleration. In both cases, however, we might expect flow velocities slower
than those predicted by Kennel & Coroniti, for a given σ. As a result, either of these effects
could require an even greater σ to account for the observations.
4.3. Correlation between Column Density and Ejecta
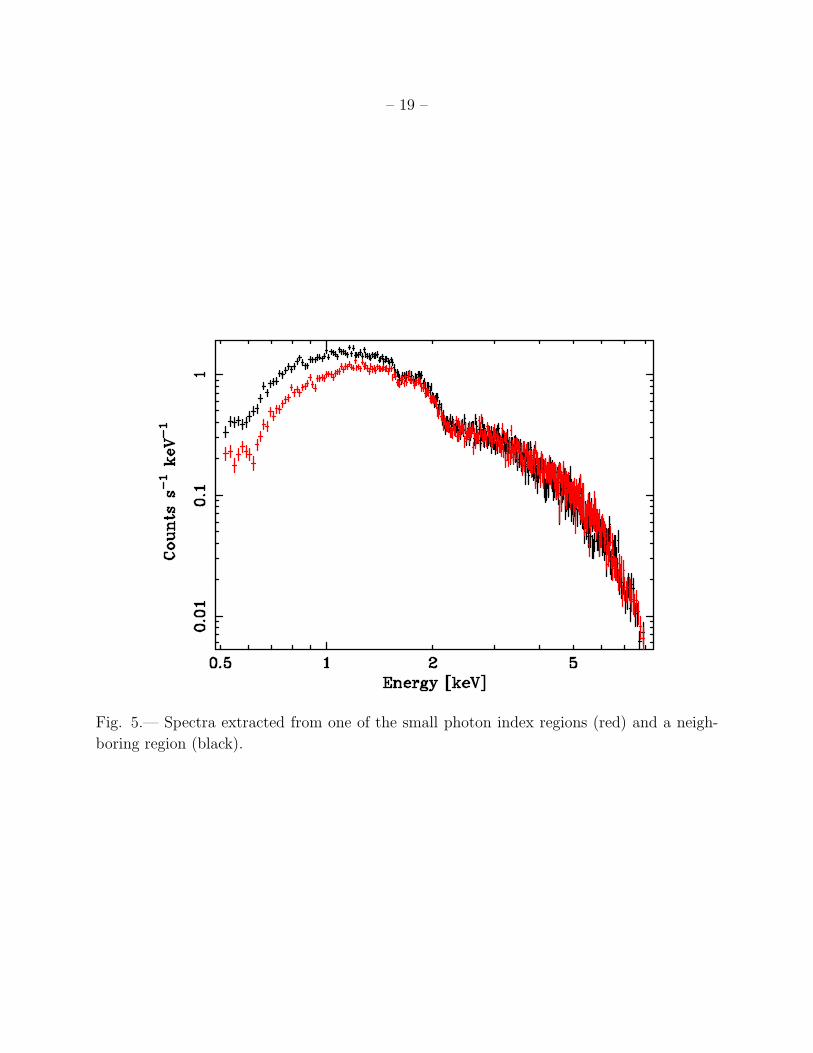
There are some regions exhibiting unusually small photon index in Figure 3, which are
enclosed by the red dashed circle. The corresponding positions in the nebula are shown
in black in the inset, also enclosed by a red dashed circle. Figure 5 presents two spectra
extracted from one of the small photon index regions and its neighboring region. The spectra
are identical above about 2 keV, and the comparison of the spectra clearly reveals that the
small apparent photon index is actually caused by a deficit of soft emission due to increased
absorption in this region. Refitting the spectra from those regions with NH treated as a
free parameter, we obtained a similar photon index and a higher NH, by ∼ 7 × 1020 cm−2,
compared to the neighboring region.
– 11 –
The Crab Nebula appears to contain a number of embedded filaments in optical narrow-
band emission-line images (e.g., Sankrit & Hester 1997). The optical filaments are thought
to be the result of a Rayleigh-Taylor instability between the light pulsar wind nebula and
the dense ejecta of the supernova explosion (Hester et al. 1996). The J2000 position of the
region showing higher NH, α = 05h34m29.s6, δ = +22◦00′30.′′4, coincides with knotty structure
in the most prominent optical filament, which is often referred to as part of the “High-
Helium Band” (MacAlpine et al. 1989). The emission lines from the High-Helium Band
are blueshifted, indicating that this filament is located between the synchrotron nebula and
us. In an optical continuum image, the knotty structure is visible as a “shadow” because it
consists of dense dust which absorbs the optical synchrotron continuum from the PWN (e.g.,
Blair et al. 1997). Similarly, the higher NH we find is likely due to absorption of soft X-rays
by the dust and gas in this knotty structure. Assuming that the thickness of this filament
is 5′′ based on the optical emission line images (Blair et al. 1997), which corresponds to
∼ 1.5×1017 cm, the density of this filament corresponding to the observed X-ray absorption
column density is ∼ 5×103 cm−3. The excess absorption can be seen only around the knotty
structures all through this filament.
We searched for other examples of X-ray absorption from the “shadow” features in the
optical continuum image (Hester et al. in preparation), from which we can pick up only dense
dust core in filaments on the near side of the nebula. There are only a few such shadows
within the X-ray nebula. The number of corresponding analysis regions is about 10 out of
2074 (in addition to the regions discussed above). The second noticeable shadows are located
to the east of the pulsar, overlapping the edge of the torus. Excess absorption was again
observed, but the amount was ∼ 3 × 1020 cm−2. The excess absorption related to other
shadows is similar or less. Therefore, our results are little affected by soft X-ray absorption
due to the filaments.
It is conceivable that our results are affected by intrinsic column density variation due to
not only the optical filaments but also arcsecond scale variation of galactic absorption. We
assessed this effect as follows. In Figure 3, the photon indices of the data points of the torus
(red) having surface brightness higher than 0.5 counts s−1 arcsec−2 are distributed around
the mean of 1.91 with the root mean square of 0.07. The statistical errors are small, so the
observed scatter is dominated by systematic errors and by real variations in the power law
index. We can obtain an upper limit on possible absorption variations across the nebula if
we assume that this scatter is produced by variations in NH, leading to an estimate of the
variation in NH of 2 × 1020 cm−2.
– 12 –
5. SUMMARY
We have shown spatial variations of the X-ray spectrum of the Crab Nebula in terms
of photon index, at an angular scale of arcseconds. The variations can be viewed in two
different directions of the particle injection from the pulsar.
Across the equatorial plane, the spectrum is almost constant to the outer boundary
of the torus, with photon index α ≈ 1.9 regardless of the surface brightness. It softens
significantly, up to α ≈ 3.0, in the outer, fainter peripheral region. This seems qualitatively
consistent with the previous suggestions that the outer boundary of the torus is interpreted
as a synchrotron burn-off boundary where the synchrotron losses become significant to X-ray
emitting particles. However, the fact that structures similar to the torus are seen at other
wavelengths indicates that the torus is not a simple result of synchrotron burn-off.
Within the southern jet, photon index variations are also seen: the spectral softening
takes place from the central core to the outer sheath. The photon index at the central core
is almost the same as that of the torus. This indicates that the electron spectra are similar
in the two different directions of the particle injection from the pulsar. We also found that
the volume emissivities of the jet and the torus are similar.
Assuming that the brightness difference between the near and far sides of the torus is
caused by Doppler boosting and relativistic aberration, the ratio can be explained by the
observed speed of the downstream flow at the torus. However it cannot be obtained from the
so-called weakly magnetized pulsar wind with σ ≈ 0.003, as suggested by Kennel & Coroniti
(1984).
Finally, we found that an optical filament comprised of supernova ejecta surrounding
the pulsar wind nebula is absorbing the soft X-ray emission from a small portion of the X-ray
nebula.
The authors thank G. Chartas for his extensive cooperation on simulation using LYNX.
We also thank the anonymous referee for comments which significantly improved the final
text of this paper. K. M. acknowledges the support of JSPS through the fellowship for
research abroad. The work of G. G. P. was partially supported by NASA grant NAG5-
10865. This work was supported by the NASA through Chandra Awards G00-1032B and
G01-2076B, issued by the Chandra X-ray Observatory Center, which is operated by the
Smithsonian Astrophysical Observatory for and on behalf of NASA under contract NAS8-
39073.

– 13 –
REFERENCES
Aschenbach, B., & Brinkmann, W. 1975, A&A, 41, 147
Arons, J. 2002, in Neutron Stars in Supernova Remnants, ed. P. O. Slane & B. M. Gaensler,
(San Francisco: ASP), 71
Blair, W. P., Davidson, K., Fesen, R. A., Uomoto, A., MacAlpine, G. M., & Henry, R. B. C.
1997, ApJS, 109, 473
Brinkmann, W., Aschenbach, B., & Langmeier, A. 1985, Nature, 313, 662
Chartas, G., Worrall, D. M., Birkinshaw, M., et al. 2000, ApJ, 542, 655
Bietenholz, M. F., Frail, D. A., & Hester, J. J. 2001, ApJ, 560, 254
Bocchino, F., Warwick, R. S., Marty, P., Lumb, D., Becker, W., & Pigot, C. 2001, A&A,
369, 1078
Hester, J. J., Stone, J. M., Scowen, P. A., et al. 1996, ApJ, 456, 225
Hester, J. J., Mori, K., Burrows, D. N. et al. 2002, ApJ, 577, L49
Kargaltsev, O. & Pavlov, G. G. 2004, in Young Neutron Stars and Their Environments, IAU
Symposium 218, ASP Conference Proceedings, eds F. Camilo and B. M. Gaensler, in
press (astro-ph/0310767)
Kennel, C. F., & Coroniti, F. V. 1984, ApJ, 283, 694
Kuiper, L., Hermsen, W., Cusumano, G., Diehl, R., Schnfelder, V., Strong, A., Bennett, K.,
McConnell, M. L. 2001, A&A, 378, 918
Lu, F. J., Wang, Q. D., Aschenbach, B., Durouchoux, P., & Song, L. M. 2002, ApJ, 568,
L49
MacAlpine, G. M., McGaugh, S. S., Mazzarella, J. M., & Uomoto, A. 1989, ApJ, 342, 364
Mori, K. 2002, PhD thesis, Osaka University
Pelling, R. M., Paciesas, W. S., Peterson, L. E., Makishima, K., Oda, M., Ogawara, Y., &
Miyamoto, S. 1987, ApJ, 319, 416
Porquet, D., Decourchelle, A., & Warwick, R. S. 2003, A&A, 401, 197
Rees, M. J., & Gunn, J. E. 1974, MNRAS, 167, 1

– 14 –
Rybicki, G. B., & Lightman, A. P. 1979, Radiative Process in Astrophysics (New York:
Wiley-Interscience)
Safi-Harb, S., Harrus, I. M., Petre, R., Pavlov, G. G., Koptsevich, A. B., & Sanwal, D. 2001,
ApJ, 561, 308
Sankrit, R., & Hester, J. J. 1997, ApJ, 491, 796
Shibata, S., Tomatsuri, H., Shimanuki, M., Saito, K., Nakamura, Y. & Mori, K. 2003,
MNRAS, 346, 841
Slane, P., Chen, Y., Schulz, N. S., Seward, F. D., Hughes, J. P., & Gaensler, B. M. 2000,
ApJ, 533, L29
Toor, A., & Seward, F. D. 1974, AJ, 79, 995
Townsley, L. K., Broos, P. S., Chartas, G., Moskalenko, E., Nousek, J. A., & Pavlov, G. G.
2002, Nuclear Instruments & Methods in Physics Research Section A, 486, 716
Weisskopf, M. C., Hester, J. J., Tennant, A. F., et al. 2000, ApJ, 536, L81
Willingale, R., Aschenbach, B., Griffiths, R. G., Sembay, S., Warwick, R. S., Becker, W.,
Abbey, A. F., & Bonnet-Bidaud, J.-M. 2001, A&A, 365, 212
Wise, M. W., Davis, J. E., Huenemoerder, Houck, J. C., Dewey, D., Flanagan, K. A., and
Baluta, C. 1997, The MARX 2.0 User Guide, CXC Internal Document
This preprint was prepared with the AAS LATEX macros v5.2.
– 15 –
0 2000 4000Counts per pixel
2 2.5 3Photon Index
(b)(a)
Fig. 1.— (a) Chandra ACIS-S combined image of the 2nd−8th observations. The center of
the white circle (R = 50′′) is located at the pulsar position. The “hole” at the pulsar position
is caused by severe event pile-up resulting in the rejection of most events at this position.
Narrow lines through the pulsar are instrumental artifacts due to trailing events. (b) Photon
index map of the Crab Nebula after correction for pile-up effects. White regions around the
eastern, western, and southern edges were excluded from analysis due to the dominance of
trailing events and scattered photons. The pulsar position is also white because no photon
index could be derived there due to severe pile-up.
– 16 –
1.5
2
2.5
3
0 0.2 0.4 0.6
App
aren
t Pho
ton
Inde
x
Observed Surface Brightness [ Cnts s-1 arcsec-2 ]
1.5
2
2.5
3
0 0.25 0.5 0.75 1
Cor
rect
ed P
hoto
n In
dex
Corrected Surface Brightness [ Cnts s-1 arcsec-2 ]
(a) (b)
Fig. 2.— (a) Plot of apparent photon index against observed surface brightness derived from
2.′′5 × 2.′′5 square regions. Results of pile-up simulations for incident photon index of 1.5,
2.0, and 2.5 are superimposed (red lines), which shows that pile-up results in smaller photon
index in higher surface brightness. (b) Same as (a) but corrected for pile-up effects.

– 17 –
1.5
2
2.5
3
0 0.25 0.5 0.75 1
Pho
ton
Inde
x
Surface Brightness [ Cnts s-1 arcsec-2 ]
Fig. 3.— Plot of photon index against surface brightness, same as Figure 2b. The data
points of the torus, the jet, the umbrella-shaped northwest region, and the faint peripheral
region are color-coded as red, blue, yellow, and green, respectively. The inset shows the
definitions of the four regions. The black contours represent surface brightness. The red
dashed circle encloses data points with unusually small photon index compared to others
(see §4.3). The corresponding positions in the nebula are shown in black in the inset, also
enclosed by a red dashed circle.

– 18 –
2 2.2 2.4Photon Index
Fig. 4.— Close-up view of photon index map around the southern jet. Note that the range
of photon index is different from that in Figure 1a to show fine variation. The green contours
represent surface brightness.
– 19 –
Fig. 5.— Spectra extracted from one of the small photon index regions (red) and a neigh-
boring region (black).

– 20 –
Table 1. Observational log of the Crab Nebula
ObsID Date Coord.(J2000)a Exposure (sec)
1994 3 November 2000 83.637, 22.024 3241.8
1996 25 November 2000 83.632, 22.014 2926.8
1998 18 December 2000 83.631, 22.016 2703.8
1999 9 January 2001 83.631, 22.017 2663.4
2001 30 January 2001 83.631, 22.017 2553.0
1995 21 February 2001 83.631, 22.017 2648.0
1997 14 March 2001 83.631, 22.017 2568.6
2000 6 April 2001 83.631, 22.016 2643.0
acoordinates of the center of the subarray
–21
–
Table 2. Spectral parameters for whole nebula
Parameter Uncorrected Value Corrected Value Canonical Value
NH (1022 cm−2) 0.27 0.32 (fixed) 0.33–0.36a
Photon index 1.92 2.10 2.10 ± 0.03b
Normalizationc 6.57 9.65 9.7 ± 0.5d
aKuiper et al. (2001)
bToor & Seward (1974)
c(Photons cm−2 s−1 keV−1 at 1 keV)
dWillingale et al. (2001)