Embed Size (px)
Citation preview
Research Journal of Agriculture and Environmental Management Vol. 5(6), pp. 187-196, July, 2016 Available online at http://www.apexjournal.org
ISSN 2315-8719© 2016 Apex Journal International
Full Length Research
Spatial variation of reference evapotranspiration and its influence on the hydrology of Luvuvhu River
Catchment
Singo, L.R.*, Kundu, P.M. and Mathivha, F.I
University of Venda, Department of Hydrology and Water Resources, Private Bag, X5050, Thohoyandou, 0950, South Africa.
Accepted 30 June, 2016; Published 30 July, 2016
This study estimated spatial variation of reference evapotranspiration (ETo) and its influence on the hydrology of Luvuvhu River Catchment.The ETo plays a key role in irrigation systems design, water resource management under irrigated and rainfed production.Simulation of ETo was performed using the Penman-Monteith method in CROPWAT 8.0 software. Results showed the spatial and temporal distribution of ETo with peaks in summer months. Areas with higher ETo values were near rivers and streams, which generally have more abundant vegetation. Areas with low ETo values were relatively dry, where pasture and grasslands dominated the landscape. Correlation results showed that no relationship exists between streamflow and ETo (r = 0.36) in the study area, hence, a significant relationship exists between rainfall and ETo (r = 0.86). The study recommends the use ofCROPWATmodel for computing ETo under arid and semi-arid climatic conditions for water resource management and planning. Key words: Catchment, CROPWAT, Penman-Monteith, reference evapotranspiration, simulation.
INTRODUCTION In cultivated semi-arid regions such as the Luvuvhu River Catchment where rainfall occurs on limited basis, estimation of evapotranspiration (ET) is crucial for management of water resources.As a result of spatial variability of landscape characteristics such as topography, soils, land use/cover, and vegetation, ET may likely exhibits a spatial variation in the catchment (Güntner and Bronstert, 2004). Evaporation pan coefficients from Symon’s pan and Class-A pan are usedby theDepartment Water Affairs and Sanitation (DWAS) and South African Weather Services (SAWS), respectively, to estimate total annual evaporation losses in the catchment.These methods are often not reliable for estimating the seasonal variation in evaporation losses due to heat storage in deep lakes. The highest evaporation (about 60%) occurs during rainfall season while lowest evaporation occurs in dry season (DWA, *Corresponding author. Email: [email protected]
2003). This high evaporation significantly reduces effective rainfall, runoff, soil infiltration, groundwater recharge and causes water loss from water bodies leading to an increase in the concentration of sediments.
This study estimated spatial variation of reference evapotranspiration (ETo) and its influence on the hydrology of Luvuvhu River Catchment using a physically based model. The ETo plays a key role in irrigation systems design, water management under irrigated and rainfed production (FAO, 2004). Its values can be considered equal to evaporation from a large body of water, such as a pond or lake. However, for smaller, shallower bodies of water this relationship does not apply. Thus, the ETo expresses the evaporating power of the atmosphere at a specific location and time of the year and does not consider the crop characteristics and soil factors.The ETo component takes a time series input of meteorological data that include radiation, temperature, vapour pressure deficit, and the rate of increase of saturation vapour pressure with temperature. The site specific water requirement can be estimated, if climatic
188 Res. J. Agric. Environ. Manage data recorded at weather station are available in different sites of a region.
With improvements in computer technology and simulation techniques, mathematical models are widely used to predict the variations in ETo, given meteorological data describing variations in the climate, and land use data describing variations in the vegetation cover. The ETo estimate is frequently obtained using the Food and Agricultural Organization (FAO) based Penman Monteith method (Monteith, 1965; Mcglinchey and Inman-Bamber, 2002). In the LRC, estimation of ETo with simulation techniques has been rare. The study’s ability to use a physically based model in CROPWAT 8.0 (Allen et al., 1998) to estimate ETo offered the opportunity to understand how ETovaries across space and time in the catchment. Hence, the ETo forms the basis of ET estimation in this study.
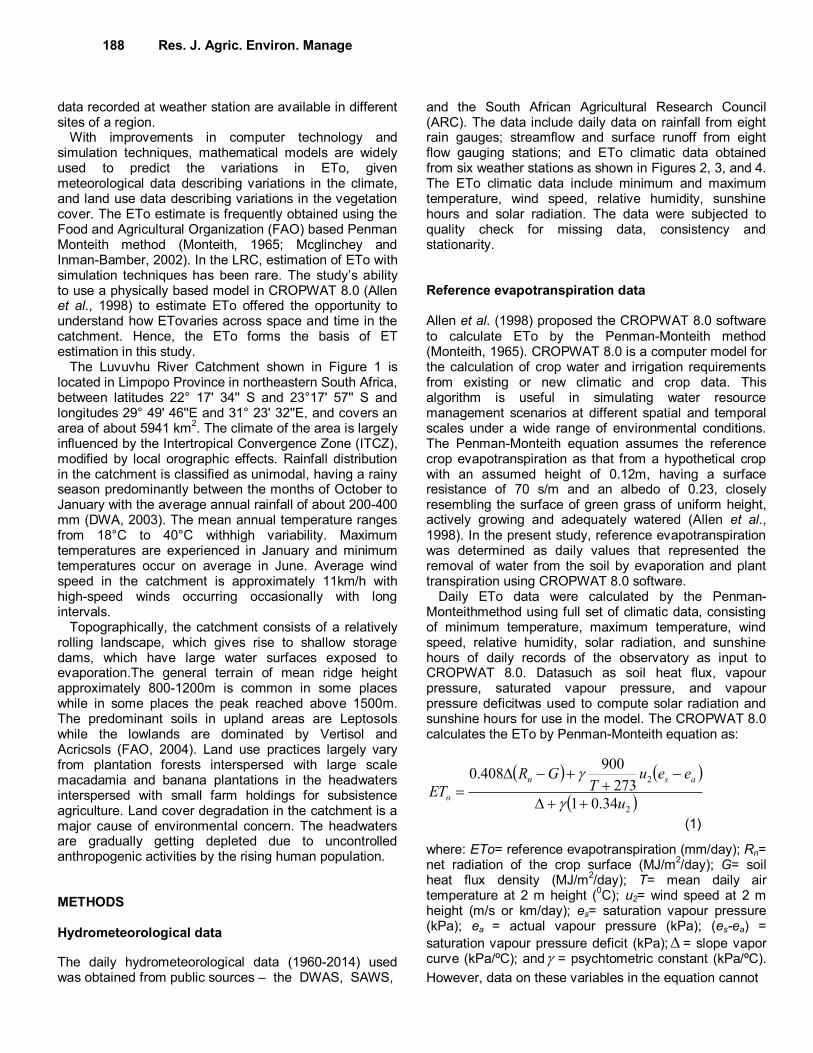
The Luvuvhu River Catchment shown in Figure 1 is located in Limpopo Province in northeastern South Africa, between latitudes 22° 17' 34'' S and 23°17' 57'' S and longitudes 29° 49' 46''E and 31° 23' 32''E, and covers an area of about 5941 km
2. The climate of the area is largely
influenced by the Intertropical Convergence Zone (ITCZ), modified by local orographic effects. Rainfall distribution in the catchment is classified as unimodal, having a rainy season predominantly between the months of October to January with the average annual rainfall of about 200-400 mm (DWA, 2003). The mean annual temperature ranges from 18°C to 40°C withhigh variability. Maximum temperatures are experienced in January and minimum temperatures occur on average in June. Average wind speed in the catchment is approximately 11km/h with high-speed winds occurring occasionally with long intervals.
Topographically, the catchment consists of a relatively rolling landscape, which gives rise to shallow storage dams, which have large water surfaces exposed to evaporation.The general terrain of mean ridge height approximately 800-1200m is common in some places while in some places the peak reached above 1500m. The predominant soils in upland areas are Leptosols while the lowlands are dominated by Vertisol and Acricsols (FAO, 2004). Land use practices largely vary from plantation forests interspersed with large scale macadamia and banana plantations in the headwaters interspersed with small farm holdings for subsistence agriculture. Land cover degradation in the catchment is a major cause of environmental concern. The headwaters are gradually getting depleted due to uncontrolled anthropogenic activities by the rising human population. METHODS Hydrometeorological data
The daily hydrometeorological data (1960-2014) used was obtained from public sources – the DWAS, SAWS,
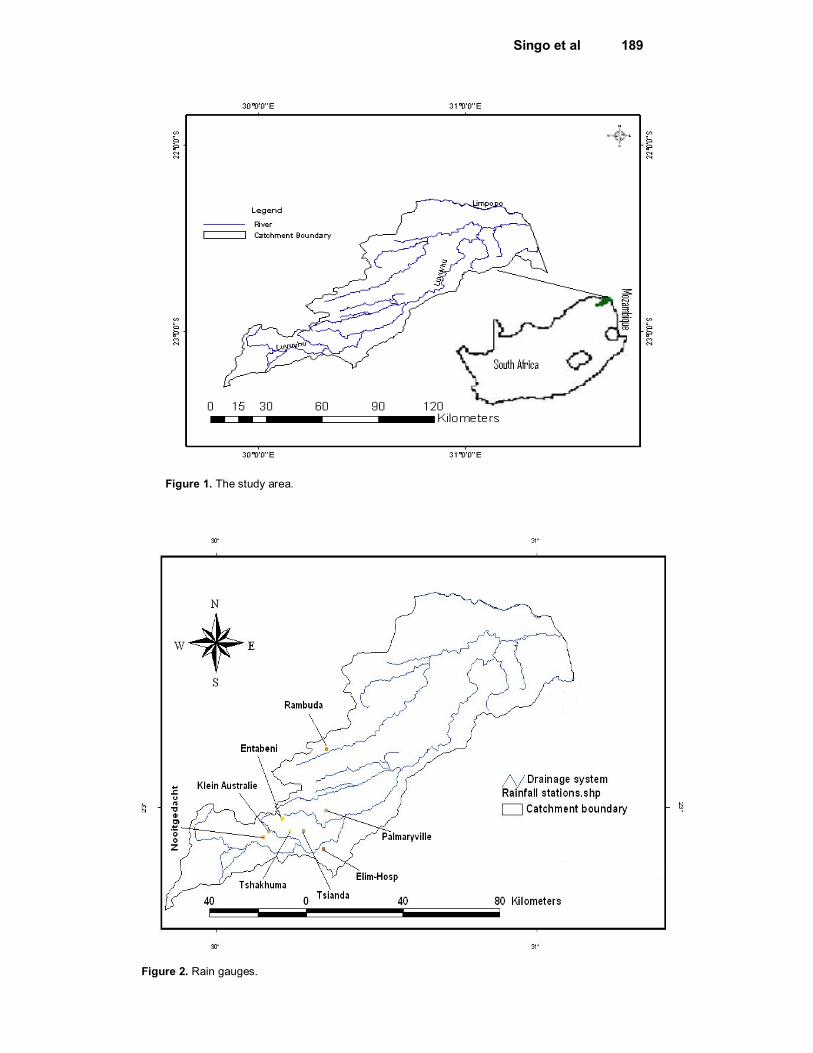
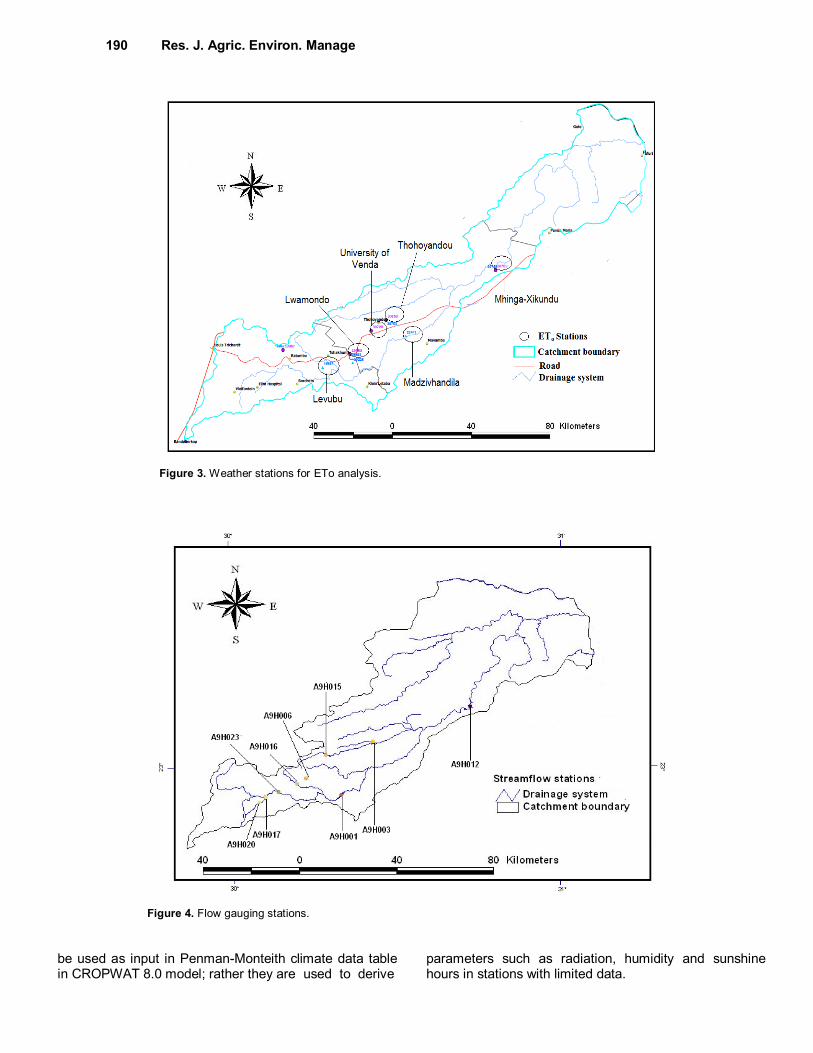
and the South African Agricultural Research Council (ARC). The data include daily data on rainfall from eight rain gauges; streamflow and surface runoff from eight flow gauging stations; and ETo climatic data obtained from six weather stations as shown in Figures 2, 3, and 4. The ETo climatic data include minimum and maximum temperature, wind speed, relative humidity, sunshine hours and solar radiation. The data were subjected to quality check for missing data, consistency and stationarity. Reference evapotranspiration data Allen et al. (1998) proposed the CROPWAT 8.0 software to calculate ETo by the Penman-Monteith method (Monteith, 1965). CROPWAT 8.0 is a computer model for the calculation of crop water and irrigation requirements from existing or new climatic and crop data. This algorithm is useful in simulating water resource management scenarios at different spatial and temporal scales under a wide range of environmental conditions. The Penman-Monteith equation assumes the reference crop evapotranspiration as that from a hypothetical crop with an assumed height of 0.12m, having a surface resistance of 70 s/m and an albedo of 0.23, closely resembling the surface of green grass of uniform height, actively growing and adequately watered (Allen et al., 1998). In the present study, reference evapotranspiration was determined as daily values that represented the removal of water from the soil by evaporation and plant transpiration using CROPWAT 8.0 software.
Daily ETo data were calculated by the Penman-Monteithmethod using full set of climatic data, consisting of minimum temperature, maximum temperature, wind speed, relative humidity, solar radiation, and sunshine hours of daily records of the observatory as input to CROPWAT 8.0. Datasuch as soil heat flux, vapour pressure, saturated vapour pressure, and vapour pressure deficitwas used to compute solar radiation and sunshine hours for use in the model. The CROPWAT 8.0 calculates the ETo by Penman-Monteith equation as:
2
2
34.01
273
900408.0
u
eeuT
GR
ETasn
o
(1)
where: ETo= reference evapotranspiration (mm/day); Rn= net radiation of the crop surface (MJ/m
2/day); G= soil
heat flux density (MJ/m2/day); T= mean daily air
temperature at 2 m height (0C); u2= wind speed at 2 m
height (m/s or km/day); es= saturation vapour pressure (kPa); ea = actual vapour pressure (kPa); (es-ea) =
saturation vapour pressure deficit (kPa); = slope vapor curve (kPa/ºC); and = psychtometric constant (kPa/ºC).
However, data on these variables in the equation cannot
Singo et al 189
Figure 1. The study area.
Figure 2. Rain gauges.
190 Res. J. Agric. Environ. Manage
Figure 3. Weather stations for ETo analysis.
Figure 4. Flow gauging stations.
be used as input in Penman-Monteith climate data table in CROPWAT 8.0 model; rather they are used to derive
parameters such as radiation, humidity and sunshine hours in stations with limited data.

Singo et al 191
Figure 5. Average monthly rainfall for the study area.
Statistical methods The temporal variation in ETo and hydrological variables were assessed using time series analysis based on linear regression functions. The spatial variation between ETo and hydrological variables was assessed using the coefficient of determination (r
2) of regression functions
and linear correlation coefficient (r). All these statistical indicators were used to compare the relationship and variation between ETo and the observed hydrological variables, and to test for statistical significance. The coefficient of determination was computed as the value of squared correlation coefficient that gives the proportion of the variance (fluctuation) of one variable that is predictable from the other variable.A linear correlation coefficient measured the strength of the relationship. RESULTS Hydrometeorological analysis Meteorological data for the study area was analysed to provide an indication of the variation in hydro-climatic condition in the catchment. The variation of monthly average rainfall at each station is illustrated in Figure 5. The Figure shows that the study area experienced a unimodal rainfall season that extends from October to April with peaks either in January or February. Rain gauge at Entabeni-Bos had the highest rainfall values in the study area ranging from 32.8 mm during the dry season to 354.7 mm during the rainy season. The station is located along the Entabeni Forest, an Afro-temperate
Mist-belt Forest that makes for an interesting combination of Afromontane and tropical vegetation elements.
Streamflow patterns in the catchment showed spatial and temporal variations as shown in Figure 6. Both gauging stations revealed unimodal peaks centred on February and March while decreasing trends with lesser amounts were experienced during the dry season from May to September. Station A9H001, which has a history of being seriously impacted by the construction of Albisini Dam during the early 1950s and subsequent irrigation abstractions, had relatively high streamflows. South African rivers experience high water recharge during the summer rainfall season, resulting in abnormal streamflows (Davies and Day,1998). However, much of the summer rainfall recharges the groundwater reservoir and is not lost to the system but feeds the rivers during the winter period of water deficit.
For each of the meteorological records used, standard equations were used to derive daily values for solar radiation and sunshine hours following Allen et al. (1998). These values were then used in the Penman-Monteith equation to compute ETo. Figures 7 and 8 show the computed solar radiation and sunshine hours data used for ETo analysis. The data showed greater variability during the rainy season from October to March while lesser amounts were experienced in dry months.The annual averages of sunshine hours ranged from 1.6 hours/day to 6.8 hours/day whereas solar radiation ranged from 11.8 MJ/m
2/d to 22.9 MJ/m
2/d. It should be
noted that not all available energy is used to vaporize water as part of the solar energy is used to heat up the atmosphere and the soil profile.
Values for relative humidity, wind speed, as well as

192 Res. J. Agric. Environ. Manage
Figure 6. Average monthly streamflow for the study area.
Figure 7. Average monthly solar radiation.
minimum and maximum temperatures obtained from meteorological stations were also made available and used as input in the Penman-Monteith method. The study area experienced maximum wind velocities of 129 km/day (1.5 m/s) and a minimum of 80 km/day (0.96 m/s). High winds tend to increase the rate of evapotranspiration as the rate of evaporation increases with the moving air. Such wind will also clear the air of
any humidity produced by the plants’ transpiration thereby increasing the rate of evapotranspiration. During the rainy season, average relative humidity was above 60%. Evaporation and transpiration rates tended to drop to low levels when the air around the plants was too humid. Average minimum temperature ranged from 7.5 °C to 20.3 °C with maximum range of 23.5 °C to 32.6 °C. There appears to be a relationship between the increase

Singo et al 193
Figure 8. Average monthly sunshine hours.
in temperatures during the rainy reason and the increase in evapotranspiration rates in the study area. This could be due to the fact that high amount of energy was available during the summer months when temperatures were high. Reference evapotranspiration analysis Figure 9 shows the distribution of EToin the study area. The onset of the rainy season in October at each climate station started with relatively high ETo values which then increased gradually until January. Thereafter, ETo values declined gradually from February and reached minimum in June. It then rose again from July towards the early rainfall season in October. The peak ETo months were recorded in summer months of January, February and March, throughout for different climatic stations. During the rainy season, Levubu, Lwamondo, Thohoyandou, and Venda University (Univen) observed the high ETo values of more than 4.0 mm/day. These areas are situated at the middle section of the catchment surrounded by many rivers and dams. The lowest ETo values were observed during the dry months at Mhinga and Madzivhandila as shown in Figure 9. The Mhinga and Madzivhandila areas are located at the lower section of the catchment and are surrounded by natural veld for grazing camps. Statistical analysis The influence of evapotranspiration on the hydrology of LRC was assessed through regression and linear
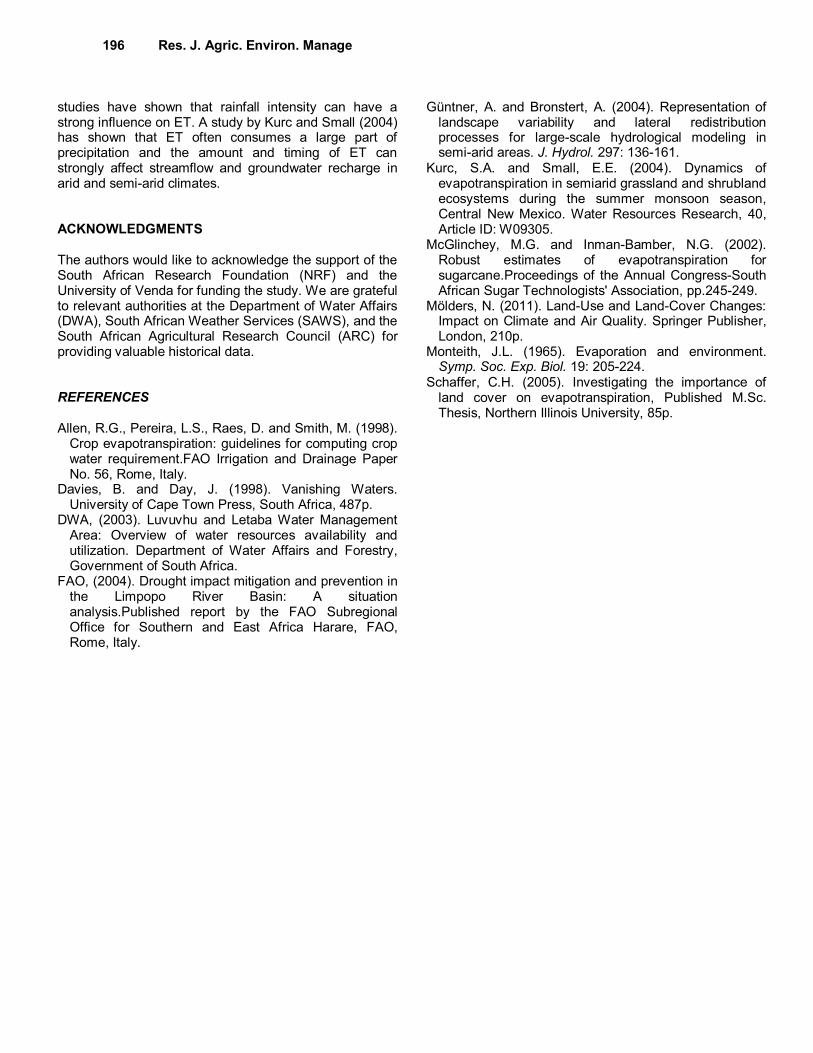
correlation analysis between ETo, rainfall, and streamflow data. For each parameter, the data for all selected stations were combined to produce a single data to represent the study area. Figures 10 and 11 show the regression analysis between the three parameters. Both parameters revealed decreasing trends during the study period. The r
2 whichexplained how much of the variability
in the data revealed r2 values of rainfall, ETo, and
streamflow; each having variances of 0.438, 0.572 and 0.0046 respectively. It can be assumed that a 44% decrease in annual rainfall may have led to a 0.05% decrease in streamflow, but only a 57% increase in ETo.
Results of correlation analysis detected a weak relationship between ETo and streamflow (r = 0.360), and a significant correlation between ETo and rainfall (r = 0.857). Rainfall and ETo are regarded as the two hydrological variables reflected by climate change, water use efficiency, and effective irrigation. DISCUSSION The influence of EToon the hydrology of Luvuvhu River Catchment was quantified using a number of statistical methods. The variations in the ETowere estimated through the Penman-Monteith method while trends between ETo and hydrological variables were investigated using regression analysis. The characteristics of ETo in the catchment were addressed, and its relationship between the two hydrological variables, rainfall and streamflow, was explained.
Results showed spatial variation of ETo in the catchment. Highest ETo values occurred in summer while

194 Res. J. Agric. Environ. Manage
Figure 9:Average monthly ETofor the study area
Figure 9. Average monthly ETo for the study area.
lowest ETo values were observed inwinter. Schaffer (2005) showed that high evapotranspiration occurs when
high available energy interacts with high soil moisture and robust plant health. Areas with the lowest ETo rates
Singo et al 195
Figure 10. Statistical analysis between rainfall and ETo.
Figure 11. Statistical analysis between streamflow and ETo.
were relatively dry areas, where pasture and grasslands dominate the landscape. Conversely, areas with higher ETo rates were near rivers and streams, which generally have more abundant vegetation. Mölders (2011) showed that evapotranspiration was low in deforested areas due to reduced surface roughness length and it significantly decreased net radiation. Such low ETo subsequently modifies the water and energy cycles within the deforested area. In areas that are characterized by low rainfall, the rate of evapotranspiration is low as some
water will be lost due to percolation and surface runoff.The estimates of ETo can therefore be used in the planning process for irrigation schemes to be developed in the catchmentas well as to manage water distribution in existing schemes.
Results of correlation analysis detected a weak relationship between ETo and streamflow and a significant correlation between ETo and rainfall.Results showed that a decrease in annual rainfall may have led to a decrease in streamflow and an increase in ETo. Past
196 Res. J. Agric. Environ. Manage studies have shown that rainfall intensity can have a strong influence on ET. A study by Kurc and Small (2004) has shown that ET often consumes a large part of precipitation and the amount and timing of ET can strongly affect streamflow and groundwater recharge in arid and semi-arid climates. ACKNOWLEDGMENTS The authors would like to acknowledge the support of the South African Research Foundation (NRF) and the University of Venda for funding the study. We are grateful to relevant authorities at the Department of Water Affairs (DWA), South African Weather Services (SAWS), and the South African Agricultural Research Council (ARC) for providing valuable historical data. REFERENCES Allen, R.G., Pereira, L.S., Raes, D. and Smith, M. (1998).
Crop evapotranspiration: guidelines for computing crop water requirement.FAO Irrigation and Drainage Paper No. 56, Rome, Italy.
Davies, B. and Day, J. (1998). Vanishing Waters. University of Cape Town Press, South Africa, 487p.
DWA, (2003). Luvuvhu and Letaba Water Management Area: Overview of water resources availability and utilization. Department of Water Affairs and Forestry, Government of South Africa.
FAO, (2004). Drought impact mitigation and prevention in the Limpopo River Basin: A situation analysis.Published report by the FAO Subregional Office for Southern and East Africa Harare, FAO, Rome, Italy.
Güntner, A. and Bronstert, A. (2004). Representation of
landscape variability and lateral redistribution processes for large-scale hydrological modeling in semi-arid areas. J. Hydrol. 297: 136-161.
Kurc, S.A. and Small, E.E. (2004). Dynamics of evapotranspiration in semiarid grassland and shrubland ecosystems during the summer monsoon season, Central New Mexico. Water Resources Research, 40, Article ID: W09305.
McGlinchey, M.G. and Inman-Bamber, N.G. (2002). Robust estimates of evapotranspiration for sugarcane.Proceedings of the Annual Congress-South African Sugar Technologists' Association, pp.245-249.
Mölders, N. (2011). Land-Use and Land-Cover Changes: Impact on Climate and Air Quality. Springer Publisher, London, 210p.
Monteith, J.L. (1965). Evaporation and environment. Symp. Soc. Exp. Biol. 19: 205-224.
Schaffer, C.H. (2005). Investigating the importance of land cover on evapotranspiration, Published M.Sc. Thesis, Northern Illinois University, 85p.