Embed Size (px)
Citation preview

Spatial Var;alion in Near-SIJr/ace Hydrologic Behavior at
Los AlamDs National Laboralory Technical Area 54, Material Disposal Area G
Authors: Brent Newman, EES-2 Marvin Gard, EES-2 Dale Counce, EES-6 Emily Kluk, EES-6 Leo Martinez, EES-2 Dennis Newell, University of New Mexico (formerly SWO) Johnny Salazar, EES-2
Submitted to: U.S. Department of Energy
30935
'"'''' 1111111'" "'" "'" """"

Spatial Variation in Near-Surface Hydrologic Behavior at LANL TA-54, Material Disposal Area G 09-05
i
Table of Contents________________________________________________
List of Figures ................................................................................................................................................. i List of Tables ..................................................................................................................................................ii Acronyms and Abbreviations ......................................................................................................................... iii Acknowledgements........................................................................................................................................iv 1.0 Introduction ........................................................................................................................................ 1 2.0 Methods ............................................................................................................................................. 3
2.1 Borehole Drilling ...................................................................................................................... 3 2.2 Chloride and Nitrate Analyses ................................................................................................. 7 2.3 Chloride Mass Balance Approach ........................................................................................... 7 2.4 Stable Isotope Analyses .......................................................................................................... 9 2.5 Pressure Head Analyses ....................................................................................................... 10 2.6 Statistical Analyses................................................................................................................ 10
3.0 Results............................................................................................................................................. 11 3.1 Water Content ....................................................................................................................... 11 3.2 Chloride Profiles and Flux Estimates..................................................................................... 11 3.3 Stable Isotopes...................................................................................................................... 20 3.4 Pressure Head ...................................................................................................................... 30 3.5 Statistical Analyses................................................................................................................ 30
4.0 Discussion ....................................................................................................................................... 42 4.1 Comparative Hydrology of Pit Covers and Adjacent Unexcavated Areas.............................. 42 4.2 Comparative Hydrology of Paved and Unpaved Areas ......................................................... 44 4.3 Comparative Hydrology of Active Area and Zone 4............................................................... 47
5.0 References ...................................................................................................................................... 51
List of Figures __________________________________________________
Figure 1 Location of 1999 and 2002 Boreholes in Active Part of Material Disposal Area G................ 5 Figure 2 Location of 2002 Boreholes within Zone 4 at Material Disposal Area G ............................... 6 Figure 3 Water Content and Chloride Profiles of 1999 Boreholes Drilled into Pit Covers ................. 12 Figure 4 Water Content and Chloride Profiles of 1999 Boreholes Drilled Adjacent to Pits................ 13 Figure 5 Water Content and Chloride Profiles of 1999 Boreholes Drilled through Asphalt Pads....... 14 Figure 6 Water Content and Chloride Profiles of 2002 Boreholes Drilled through Asphalt Pads....... 15 Figure 7 Water Content and Chloride Profiles of 2002 Boreholes Drilled in Unpaved Areas ............ 16 Figure 8 Water Content and Chloride Profiles of 2002 Boreholes Drilled in Piñon Canopy
Locations within Zone 4 ...................................................................................................... 17 Figure 9 Water Content and Chloride Profiles of 2002 Boreholes Drilled in Juniper Canopy
Locations within Zone 4 ...................................................................................................... 18 Figure 10 Water Content and Chloride Profiles of 2002 Boreholes Drilled in Intercanopy Locations
within Zone 4 ...................................................................................................................... 19 Figure 11 Stable Isotope Ratios in Pore Water of 1999 Boreholes Drilled Into Pit Covers.................. 22 Figure 12 Stable Isotope Ratios in Pore Water of 1999 Boreholes Drilled Adjacent to Pits ................ 23

Spatial Variation in Near-Surface Hydrologic Behavior at LANL TA-54, Material Disposal Area G 09-05
ii
Figure 13 Stable Isotope Ratios in Pore Water of 2002 Boreholes Drilled in Unpaved Areas............. 24 Figure 14 Stable Isotope Ratios in Pore Water of 2002 Boreholes Drilled in Piñon Canopy
Locations within Zone 4 ...................................................................................................... 25 Figure 15 Stable Isotope Ratios in Pore Water of 2002 Boreholes Drilled in Juniper Canopy
Locations within Zone 4 ...................................................................................................... 26 Figure 16 Stable Isotope Ratios in Pore Water of 2002 Boreholes Drilled in Intercanopy Locations
within Zone 4 ...................................................................................................................... 27 Figure 17 Stable Isotope Ratios in Pore Water of 1999 Boreholes Drilled through Asphalt Pads....... 28 Figure 18 Stable Isotope Ratios in Pore Water of 2002 Boreholes Drilled through Asphalt Pads....... 29 Figure 19 Comparison of Isotopic Ratios in 1999 Boreholes Drilled in Paved and Unpaved Areas .... 31 Figure 20 Pressure Head Measurements for 1999 Boreholes Drilled into Pit Covers ......................... 32 Figure 21 Pressure Head Measurements for 1999 Boreholes Drilled Adjacent to Pits ....................... 33 Figure 22 Pressure Head Measurements for 1999 Boreholes Drilled through Asphalt Pads .............. 34 Figure 23 Comparison of Downward Flux in 1999 Boreholes Drilled into Pit Covers and Areas
Adjacent to Pits................................................................................................................... 43 Figure 24 Comparison of Average Water Content in Boreholes Drilled in Paved and Unpaved
Areas .................................................................................................................................. 45 Figure 25 Comparison of Maximum Delta Deuterium Values in Boreholes Drilled in Paved and
Unpaved Areas ................................................................................................................... 46 Figure 26 Comparison of Downward Flux in Unpaved Parts of Active Area and Zone 4 .................... 48 Figure 27 Comparison of Maximum Delta Deuterium Values in Canopy and Intercanopy
Locations within Zone 4 ...................................................................................................... 50
List of Tables ___________________________________________________
Table 1 Shallow Boreholes Drilled within Material Disposal Area G .................................................. 4 Table 2 Chloride-Based Flux Estimates........................................................................................... 21 Table 3 Comparison of T-Test Results for Pit Covers and Unexcavated Locations
Adjacent to Pits................................................................................................................... 35 Table 4 Comparison of T-Test Results for Paved and Unpaved Locations...................................... 36 Table 5 Comparison of T-Test Results for Unpaved Portions of Active Disposal Area
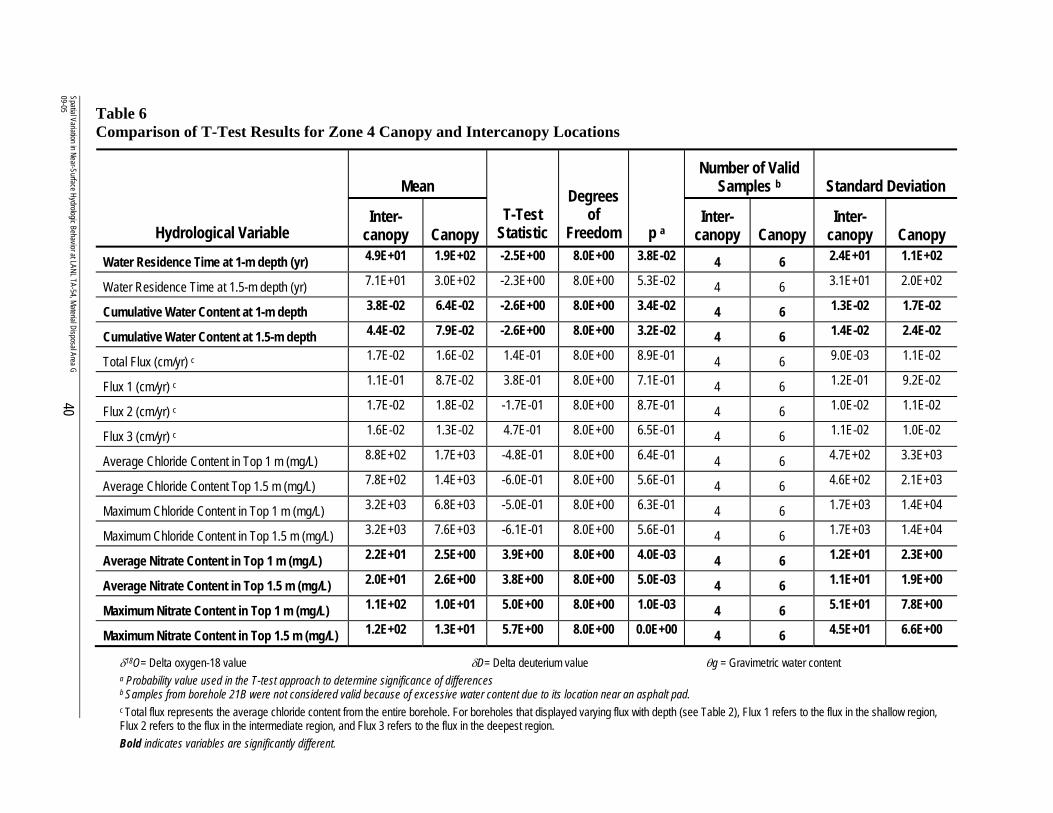
and Zone 4.......................................................................................................................... 38 Table 6 Comparison of T-Test Results for Zone 4 Canopy and Intercanopy Locations ................... 40
Attachments ____________________________________________________
Attachment 1 Hydrographic Properties of Shallow Boreholes at Material Disposal Area G

Spatial Variation in Near-Surface Hydrologic Behavior at LANL TA-54, Material Disposal Area G 09-05
iii
Acronyms and Abbreviations ______________________________________
δ18O Delta value (ratio) of oxygen-18 (heavy oxygen) δD Delta value (ratio) of deuterium θg Water content Laboratory Los Alamos National Laboratory LANL Los Alamos National Laboratory MDA Material Disposal Area TA Technical Area

Spatial Variation in Near-Surface Hydrologic Behavior at LANL TA-54, Material Disposal Area G 09-05
iv
Acknowledgements
Support for this study was provided through the Material Disposal Area G performance assessment maintenance project. The contributions of Andrew Campbell, Richard Cardellino, Sean French, Mel Garcia, Phil Fresquez, Eli Ludwig, Stephanie Maez, Rob Shuman, Tracy Schofield, and Mark Vaneeckhout are appreciated.

Spatial Variation in Near-Surface Hydrologic Behavior at LANL TA-54, Material Disposal Area G 09-05
1
1.0 Introduction
This report describes two studies undertaken in 1999 and 2002 as part of the Los Alamos National Laboratory Low-Level Radioactive Waste Disposal Performance Assessment Maintenance Program. The studies were completed to reduce uncertainties relative to near-surface hydrologic conditions at Los Alamos National Laboratory (LANL or the Laboratory) Material Disposal Area (MDA) G, a low-level radioactive waste disposal site. Both studies analyzed data (i.e., water content, pore water chloride, and stable isotopes) from shallow (< 2 m [6.6 ft]) cores collected at MDA G. The specific objectives of the studies were to (1) determine the appropriateness of using a uniform horizontal near-surface flux boundary condition for hydrological modeling of the groundwater pathway, (2) assess potential impacts of asphalt paving on site performance, and (3) evaluate potential effects of post-institutional control changes in site vegetation on near-surface hydrology. Each of these objectives is described in more detail below.
One of the assumptions of the 1997 MDA G performance assessment (Hollis et al., 1997) was that the MDA G site, located on Mesita del Buey, had a crushed tuff cover that was assumed to have uniform hydrologic properties. This assumption allowed the use of a uniform-flux near-surface boundary condition for modeling the groundwater pathway. The 1999 near-surface hydrologic behavior study was undertaken to test this assumption. Specifically, near-surface hydrologic behavior was examined to compare similarities and differences between pit covers and adjacent areas that still retained part or all of the in situ soil or tuff materials. The term “near-surface” is used to indicate the upper 1 to 2 m (3.3 to 6.6 ft) of the mesa top, which includes the soil zone and either crushed tuff backfill (i.e., over the disposal units) or the top of the intact Tshirege Member of the Bandelier Tuff. Core samples were collected from borings into pit covers and into the adjacent areas that still retained in situ near-surface material. To evaluate hydrologic behavior, measurements of water content, pressure head, and naturally occurring chloride and stable oxygen and hydrogen isotope tracers were made. This suite of evaluations provides data for both a qualitative and quantitative assessment of the variation in the near-surface vadose-zone hydrology at MDA G.
An additional objective of the 1999 study was to examine the hydrologic effects of asphalt paving at MDA G. Since the initial performance assessment was completed, substantial areas of the mesa top have been paved with asphalt. To determine how the paving affects near-surface hydrologic behavior, an effort was made to compare water content, chloride concentrations, and stable isotope data from core samples taken in the unpaved areas to core samples from three paved locations. Four additional cores from paved areas were collected in 2002 to supplement the 1999 data.

Spatial Variation in Near-Surface Hydrologic Behavior at LANL TA-54, Material Disposal Area G 09-05
2
An objective of the 2002 study was to assess the impact of plant succession on the near-surface hydrology of the site. It is likely that MDA G will transition from a grassland to a piñon-juniper woodland after closure and the cessation of active management. To evaluate how this conversion may affect near-surface hydrologic behavior, 10 cores were collected in a portion of MDA G referred to in the LANL site-wide environmental impact statement as Zone 4 (DOE, 1999). This area, which extends westward from the active disposal area of MDA G to MDA L, contains a relatively undisturbed piñon-juniper woodland (i.e., no waste pit excavations have been made, and no thinning had taken place prior to sampling). Given its proximity to the active disposal area, Zone 4 is an excellent natural analog for likely post-institutional control conditions. Pore water chloride, water content, and stable isotope data collected from Zone 4 were compared to similar data collected from the active part of MDA G in 1999 and from an additional 3 cores collected from unpaved locations in the active area during 2002.
Following this introductory section, Section 2 of this report describes the methods used for obtaining and analyzing the borehole samples. Chloride and water content data were used to quantify differences in percolation fluxes across the major surface and near-surface conditions at MDA G (e.g., paved vs. unpaved, trees vs. no trees). Stable isotope values were used to examine variations in evaporation, which is a critical control on percolation rates. Finally, pressure head and nitrate data were used as additional characterization information to understand processes and differences in near-surface hydrologic behavior at MDA G. Section 3 discusses the results of the analyses and Section 4 presents a discussion of the significance of the findings, focusing on the objectives described above.

Spatial Variation in Near-Surface Hydrologic Behavior at LANL TA-54, Material Disposal Area G 09-05
3
2.0 Methods
This section describes how samples were collected and analyzed for the 1999 and 2002 investigations of near-surface hydrologic behavior. Section 2.1 provides information about the drilling of 26 boreholes in the active and currently undeveloped portions of MDA G. The methods used to determine chloride content, stable isotope ratios, and pressure head are described in Sections 2.2 through 2.5, and Section 2.6 discusses how statistical analyses were performed.
2.1 Borehole Drilling Nine boreholes were cored at MDA G on July 1 and 2, 1999 and an additional 17 boreholes were drilled in August 2002 (Table 1). The 1999 boreholes, shown in Figure 1, were drilled in the active part of MDA G using a CME-45 hollow-stem auger system. Three boreholes — designated Pit2, Pit17, and Pit24 — were drilled into existing crushed tuff pit covers and range from 0.9 to 1 m (3.0 to 3.3 ft) deep; the depths of these boreholes were limited to prevent drilling into waste. Boreholes 7B, 17B, and 21B are located next to deep boreholes 1107, 1117, and 1121, respectively, and are 1.9 to 2 m (6.2 to 6.6 ft) deep. Boreholes BT2, BT21, and BT30 are drilled into paved areas and are 1 to 2 m (3.3 to 6.6 ft) deep. At each of these boreholes, the core barrel was split and the core was quickly screened for tritium and volatile organic carbon contamination (none was found) using handheld survey instruments. Immediately after screening, samples were collected for water content, pressure head, chloride, and stable isotope analyses.
Sampling during the 2002 study was conducted using a trailer-mounted, hollow-stem auger rig manufactured by SIMCO Drilling Equipment, Inc. All 2002 boreholes were drilled between 1 and 2 m (3.3 and 6.6 ft) deep. Ten of the boreholes were drilled in Zone 4; these boreholes are shown in Figure 2. Boreholes IC1, IC2, IC3, and IC4 were located in intercanopy spaces in Zone 4 that had some sparse grass, but also a large amount of bare ground. Boreholes J1, J2, and J3 were drilled beneath juniper (Juniperus monosperma) canopies, approximately half the distance between the main trunk and the drip line. Boreholes P1, P2, and P3 were drilled underneath piñon (Pinus edulis) canopies in the same manner as the juniper boreholes. This approach allowed data to be collected from the three main vegetation-cover conditions present in typical piñon-juniper woodlands on the Pajarito Plateau. In addition to the boreholes drilled in Zone 4, seven boreholes were drilled in the active part of MDA G in 2002; the locations of these boreholes are shown in Figure 1. Boreholes G1, G2, and G3 were drilled in unpaved areas and boreholes AS1, AS2, AS3, and AS4 were drilled in paved areas. Details of the sampling and analytical procedures are provided below.

Spatial Variation in Near-Surface Hydrologic Behavior at LANL TA-54, Material Disposal Area G 09-05
4
Table 1 Shallow Boreholes Drilled within Material Disposal Area G
Year Drilled Borehole Depth (m) Description
1999 Pit2 0.9 –1 Drilled into existing crushed pit covers in active part of MDA G
Pit 17
Pit24
7B 1.9 – 2 Drilled into intact tuff between pits near deep borehole 1107
17B Drilled into intact tuff between pits near deep borehole 1117
21B Drilled into intact tuff between pits near deep borehole 1121
BT2 1 – 2 Drilled through asphalt pads in active part of MDA G
BT21
BT30
2002 IC1 1 – 2 Drilled in intercanopy spaces in Zone 4
IC2
IC3
IC4
J1 Drilled beneath juniper canopy in Zone 4
J2
J3
P1 Drilled beneath piñon canopy in Zone 4
P2
P3
G1 Drilled in unpaved location in active part of MDA G
G2 Drilled in unpaved location (but adjacent to pavement) in active part of MDA G
G3 Drilled in unpaved location in active part of MDA G
AS1 Drilled through asphalt pads in active part of MDA G
AS2
AS3
AS4

N
Spatial Variation in Near-Surface Hydrologic Behavior at LANL TA-54, Material Disposal Area G
09-055
Figure 1Location of 1999 and 2002 Boreholes in Active Part of
Material Disposal Area G
Scale
500 m0 250
Pit2
BT21
BT30
7B
G3G1
G2
17B
21BBT2
Pit17
Pit24
AS1
AS2AS3
AS4
1999 boreholes drilled into pit covers1999 boreholes drilled adjacent to pitsinto intact tuff1999 boreholes drilled through asphalt pads2002 boreholes drilled into unpaved areas2002 boreholes drilled through asphalt pads
Active part of MDA G

Spatial Variation in Near-Surface Hydrologic Behavior at LANL TA-54, Material Disposal Area G
09-056
Figure 2Location of 2002 Boreholes within Zone 4 at Material Disposal Area G
Scale
250 m0 125
P1
P1
IC1IC2
IC3
IC4
P1
J3
J1
J2
2002 boreholes drilled beneath piñon canopies2002 boreholes drilled beneath juniper canopies2002 boreholes drilled into intercanopy spaces
N
Active part of MDA G

Spatial Variation in Near-Surface Hydrologic Behavior at LANL TA-54, Material Disposal Area G 09-05
7
2.2 Chloride and Nitrate Analyses Pore water chloride concentrations are increasingly used as tracers of hydrologic behavior in arid and semiarid environments. Using a mass balance approach, pore water chloride concentrations can be used to estimate long-term average percolation fluxes in the vadose zone. This section describes the sampling and analytical methods used to determine pore-water chloride concentrations; Section 2.3 describes the mass balance approach used to estimate flux.
In addition to chloride concentrations, pore-water nitrate concentrations were measured. Nitrate is subject to a variety of biogeochemical processes that are often related to the presence of reducing or oxidizing conditions. Thus, nitrate levels can be a good qualitative indicator of the local biogeochemical conditions. This is especially true in Zone 4, where the presence of trees may result in different types and rates of biogeochemical cycling than occur in the adjacent grassy or bare intercanopy spaces. Local differences in nitrate content can provide insight into the spatial distributions and transport of radionuclides that may be translocated to the near-surface. Nitrate sampling and analysis was identical to that of chloride, and was performed on the same leachate samples used for the chloride analyses.
Chloride and nitrate profiles were determined for all of the boreholes shown in Figures 1 and 2. Samples were collected every 0.1 m (3.9 in.), stored in pretared amber glass jars with Teflon-lined lids, and oven dried to determine gravimetric water content according to ASTM International’s method D2216-90. Chloride and nitrate concentrations were determined following the procedure in Newman et al. (1997), except that samples were leached by combining approximately 50 g (0.11 lb) of dried soil or tuff with approximately 75 g (0.17 lb) of deionized water. The samples were agitated for 24 hours using a rotary shaker, the solid material was allowed to settle, and the supernatant was filtered and analyzed using a Dionex Ion Chromatograph at the LANL Earth & Environmental Sciences Geochemistry Laboratory. The analytical precision of the ion chromatograph is better than 5 percent.
Pore-water chloride and nitrate concentrations were calculated using leachate concentrations, gravimetric water contents, and bulk densities. A bulk density of 1.40 g/cm3 (87 lb/ft3) was used for soils and crushed tuff on the basis of values reported in DBS&A (1994). For intact tuff, a value of 1.37 g/cm3 (86 lb/ft3) was adopted from Rogers and Gallaher (1995), who reported this as the mean value for Bandelier Tuff Tshirege Member unit 2. These two bulk density values were also used to calculate volumetric water contents.
2.3 Chloride Mass Balance Approach The pore-water chloride concentrations were used in the chloride mass balance approach to estimate long-term average percolation fluxes and the corresponding vadose-water residence times. This approach, which involves measuring chloride concentrations in vadose-zone water

Spatial Variation in Near-Surface Hydrologic Behavior at LANL TA-54, Material Disposal Area G 09-05
8
with depth, is particularly useful for estimating vadose-zone fluxes in semiarid and arid environments (Allison et al., 1985; Newman et al., 1997; Phillips, 1994; Scanlon, 2000). Chloride concentrations serve as indicators of downward flux and water age. The downward flux is inversely proportional to the amount of chloride accumulation: high chloride concentrations indicate a low flux that represents many years of meteoric chloride accumulation coupled with the removal of water through evapotranspiration. Relatively low chloride contents indicate a high downward flux, or water that is able to move through the vadose zone at a fast enough rate to minimize evapotranspiration effects.
The chloride mass balance method is based on the following assumptions: (1) flow occurs largely in a downward piston-like fashion, (2) there is little dispersive mixing of water and chloride, (3) atmospheric chloride deposition has remained relatively constant over many thousands of years and is the sole source of chloride to the system, and (4) chloride uptake by plants is negligible.
If vadose-zone chloride concentrations are constant, the average annual flux can be estimated using the following equation:
sw
p
ClClP
R×
= 1
Where
R = flux (m/yr) P = the average annual precipitation rate (m/yr) Clp = the average concentration of chloride in bulk precipitation (g/m3) Clsw = the chloride concentration in vadose-zone water (g/m3)
However, chloride concentrations in profiles are not always constant (i.e., fluxes can change over time as a result of changes in climate, land use, or other factors). In this case, plots of cumulative chloride as a function of cumulative water in the profile can be used to determine changes in fluxes. Approximately linear segments on these water-versus-chloride-content plots indicate zones of constant flux. The flux for a segment is determined as follows:
seg
p
ClClP
R×
= 2
Where
Clseg = average chloride content of the samples represented by the segment (g/m3)

Spatial Variation in Near-Surface Hydrologic Behavior at LANL TA-54, Material Disposal Area G 09-05
9
A value of 0.37 m/yr (15 in./yr) was used for the average annual precipitation (P) on the basis of data in Bowen (1990). A value of 0.29 g/m3 (18 lb/ft3) was used for the average concentration of chloride in bulk precipitation (Clp), as reported in Anderholm (1994).
2.4 Stable Isotope Analyses Samples for pore water stable isotope analyses were collected over 0.02-m (0.79-in.) intervals for the first 0.1 m (3.9 in.) and every 0.1 m (3.9 in.) thereafter; higher resolution sampling was implemented above 0.1 m (3.9 in.) to better define the effect of evaporation. Upon removal from the core barrel, the samples were placed immediately in glass mason jars, the mouths of which were coated with vacuum grease, and screw-on lids were applied. This procedure reduces the chance that pore water will evaporate during the period between sampling and analysis, thus altering the isotopic composition of the water.
The stable-isotope analyses were carried out at the stable isotope laboratory at the New Mexico Institute of Mining and Technology. All samples taken from the top 1 m (3.3 ft.) were analyzed, but only one-quarter to one-half of the samples collected at depths greater than 1 m (3.3 ft) were analyzed (approximately one sample from each 0.2- to 0.4-m [7.9- to 16-in.] interval). Soil water was extracted by high-temperature vacuum distillation following methods reported by Shurbaji et al. (1995). The samples were analyzed with a Finnegan Mat Delta-E stable-isotope-ratio mass spectrometer using gas standards from the Oztech Trading Corporation. The isotopic values are expressed in delta (δ) notation as per mil (parts per thousand [‰]) differences relative to the Vienna Standard Mean Ocean Water (V-SMOW) isotope standard:
000,118 ×=−
−−
SMOWV
SMOWVsample
RRR
DorO δδ 3
Where
Rsample = the isotope ratio of the sample (18O:16O or D:H) RV-SMOW = the isotope ratio of the V-SMOW standard 1,000 = a constant used to allow delta values to be expressed as per mil (‰)
The value of δ18O was measured from extractions made using the carbon dioxide equilibration technique of Socki et al. (1992). For the δD analyses, hydrogen was extracted using the zinc method of Kendall and Coplen (1985). The analytical precision for the δ18O and δD analyses by mass spectroscopy is better than ±0.2 ‰ and ±2 ‰, respectively. However, some of the 2002 distillations did not yield sufficient water for analyses, especially for the δ18O analyses, because the samples were too dry.

Spatial Variation in Near-Surface Hydrologic Behavior at LANL TA-54, Material Disposal Area G 09-05
10
2.5 Pressure Head Analyses Pressure head analyses were conducted only for the 1999 samples. These analyses were made on samples of approximately 100 g (0.22 lb) taken at 0.1-m intervals from each borehole. Each sample was placed in a resealable plastic bag that was folded over and encapsulated in packaging tape to prevent the loss or gain of water that might alter the results. Analyses were conducted in duplicate using an AquaLab model CX2 chilled-mirror psychrometer following methods in Gee et al. (1992). All runs were bracketed by measurements of distilled water and salt solution standards. Analytical precision was better than 0.003 water activity units based on the distilled water standard.
2.6 Statistical Analyses Statistical analyses were performed using version 7.0 of the STATISTICA® software package (StatSoft, 2005). T-tests were used to compare data representing different site conditions (e.g., paved vs. unpaved areas or grassland vs. woodland vegetation). The tests included up to 28 hydrological variables obtained from the borehole analyses. A probability (p) value of 0.05 was used for all tests.

Spatial Variation in Near-Surface Hydrologic Behavior at LANL TA-54, Material Disposal Area G 09-05
11
3.0 Results
This section provides the results of the hydrologic analyses. Sections 3.1 and 3.2 summarize the results of the water content and chloride profile determinations, Section 3.3 provides results for the stable isotope analyses, and Section 3.4 describes the pressure head findings, and Section 3.5 presents a statistical comparison of the hydrological characteristics of the different boreholes. Attachment I provides specific water content, pressure head, chloride, and stable isotope data.
3.1 Water Content Gravimetric water content (θg) profiles for the various boreholes are shown in Figures 3 – 10. Water content profiles for pit cover boreholes collected in 1999 range from approximately 2 to 14 percent. Profiles from pits 17 and 24 are consistently below 10 percent, with pit 2 having some values in the low teens (Figure 3). Water content profiles for unexcavated areas adjacent to pits collected in 1999 range from 2 to 24 percent (Figure 4). The water contents from borehole 21b are the highest because of its proximity to a paved area.
The 1999 water content profiles from paved areas range from about 4 to 18 percent (Figure 5); 2002 profiles from paved areas range from about 3 to 16 percent (Figure 6). Water content profiles measured during 2002 in unpaved areas in the active part of MDA G range from nearly zero to about 19 percent (Figure 7). The profiles of boreholes G1 and G3 are substantially drier than that of G2. Borehole G2 was located next to a building suspected of having a leaky sump system; the reason this borehole was drilled was to help determine the extent of leakage.
The samples from boreholes located in the piñon-juniper canopy of Zone 4 have water contents ranging from nearly zero to 16 percent (Figures 8 and 9). Similarly, water contents for the boreholes in the Zone 4 intercanopy areas have a lower bound of approximately zero, but these boreholes are drier overall, with a maximum water content of about 9 percent (Figure 10).
3.2 Chloride Profiles and Flux Estimates Chloride profiles for each of the boreholes are shown in Figures 3 – 10. Samples from the 1999 boreholes drilled into pit covers yielded variable chloride contents (Figure 3) that are generally lower than for the 2002 boreholes (see Attachment I). Boreholes collected adjacent to pits in 1999 (Figure 4) have even more variability than the boreholes drilled within pits. Borehole 17B, for example, shows a substantial spike in chloride concentration of over 1,000 mg/L (1,000 ppm) at a depth of about 1.4 m (4.6 ft). Borehole 17B was drilled adjacent to deep borehole 1117, which was also found to have high chloride concentrations, although at greater depths (Newman, 1996). Borehole 21B has low chloride concentrations consistent with the high water contents.

12
Figure 3Water Content and Chloride Profiles of 1999
Boreholes Drilled into Pit Covers
200
180
160
140
120
100
80
60
40
20
0
0 2 4 6 8 10 12 14 16 18 20
0 20 40 60 80 100 120 140 160 180 200 220 240
200
180
160
140
120
100
80
60
40
20
0
0 2 4 6 8 10 12 14 16 18 20
0 20 40 60 80 100 120 140 160 180 200 220 240
Gravimetric water content (%)
)mc(
htpeD
Figure 3aBorehole Pit2
Figure 3bBorehole Pit17
Figure 3cBorehole Pit24
Water Content Chloride
Chloride (mg/L)
Gravimetric water content (%)
)mc(
htpeD
Chloride (mg/L)
200
180
160
140
120
100
80
60
40
20
0
0 2 4 6 8 10 12 14 16 18 20
0 20 40 60 80 100 120 140 160 180 200 220 240
Gravimetric water content (%)
)mc(
htpeD
Chloride (mg/L)
Spatial Variation in Near-Surface Hydrologic Behavior at LANL TA-54, Material Disposal Area G
09-05

13
Figure 4Water Content and Chloride Profiles of 1999
Boreholes Drilled Adjacent to Pits
Water Content Chloride
200
180
160
140
120
100
80
60
40
20
0
0 2 4 6 8 10 12 14 16 18 20 22 24
0 200 400 600 800 1000 1200
200
180
160
140
120
100
80
60
40
20
0
0 2 4 6 8 10 12 14 16 18 20 22 24
0 200 400 600 800 1000 1200
Gravimetric water content (%)
)mc(
htpeD
Chloride (mg/L)
Gravimetric water content (%)
)mc(
htpeD
Chloride (mg/L)
200
180
160
140
120
100
80
60
40
20
0
0 2 4 6 8 10 12 14 16 18 20 22 24
0 200 400 600 800 1000 1200
Gravimetric water content (%)
)mc(
htpeD
Chloride (mg/L)
Figure 4aBorehole 7B
Figure 4bBorehole 17B
Figure 4cBorehole 21B
Spatial Variation in Near-Surface Hydrologic Behavior at LANL TA-54, Material Disposal Area G
09-05

14
Figure 5Water Content and Chloride Profiles of 1999
Boreholes Drilled through Asphalt Pads
Water Content Chloride
Figure 5aBorehole BT2
Figure 5bBorehole BT21
Figure 5cBorehole BT30
200
180
160
140
120
100
80
60
40
20
0
0 2 4 6 8 10 12 14 16 18 20
0 20 40 60 80 100 120 140 160 180 200
200
180
160
140
120
100
80
60
40
20
0
0 2 4 6 8 10 12 14 16 18 20
0 20 40 60 80 100 120 140 160 180 200
Gravimetric water content (%)
)mc(
htpeD
Chloride (mg/L)
Gravimetric water content (%)
)mc(
htpeD
Chloride (mg/L)
200
180
160
140
120
100
80
60
40
20
0
0 2 4 6 8 10 12 14 16 18 20
0 20 40 60 80 100 120 140 160 180 200
Gravimetric water content (%)
)mc(
htpeD
Chloride (mg/L)
Spatial Variation in Near-Surface Hydrologic Behavior at LANL TA-54, Material Disposal Area G
09-05

Spatial Variation in Near-Surface Hydrologic Behavior at LANL TA-54, Material Disposal Area G09-05 15
Figure 6Water Content and Chloride Profiles of 2002
Boreholes Drilled through Asphalt Pads
Water Content Chloride
Figure 6cBorehole AS3
Figure 6dBorehole AS4
Figure 6aBorehole AS1
Figure 6bBorehole AS2
200
180
160
140
120
100
80
60
40
20
0
0 2 4 6 8 10 12 14 16 18 20
0 20 40 60 80 100 120 140 160 180 200
200
180
160
140
120
100
80
60
40
20
0
0 2 4 6 8 10 12 14 16 18 20
0 20 40 60 80 100 120 140 160 180 200
200
180
160
140
120
100
80
60
40
20
0
0 2 4 6 8 10 12 14 16 18 20
0 20 40 60 80 100 120 140 160 180 200
200
180
160
140
120
100
80
60
40
20
0
0 2 4 6 8 10 12 14 16 18 20
0 20 40 60 80 100 120 140 160 180 200
Gravimetric water content (%)
)mc(
htpeD
Chloride (mg/L)
Gravimetric water content (%))
mc(htpe
D
Chloride (mg/L)
Gravimetric water content (%)
)mc(
htpeD
Chloride (mg/L)
Gravimetric water content (%)
)mc(
htpeD
Chloride (mg/L)

16
Figure 7Water Content and Chloride Profiles of 2002
Boreholes Drilled in Unpaved Areas
Water Content Chloride
Figure 7aBorehole G1
Figure 7bBorehole G2
Figure 7cBorehole G3
200
180
160
140
120
100
80
60
40
20
0
0 2 4 6 8 10 12 14 16 18 20
0 5000 10000 15000 20000
200
180
160
140
120
100
80
60
40
20
0
0 2 4 6 8 10 12 14 16 18 20
0 5000 10000 15000 20000
Gravimetric water content (%)
)mc(
htpeD
Chloride (mg/L)
Gravimetric water content (%)
)mc(
htpeD
Chloride (mg/L)
200
180
160
140
120
100
80
60
40
20
0
0 2 4 6 8 10 12 14 16 18 20
0 5000 10000 15000 20000
Gravimetric water content (%)
)mc(
htpeD
Chloride (mg/L)
Spatial Variation in Near-Surface Hydrologic Behavior at LANL TA-54, Material Disposal Area G
09-05

17
Figure 8Water Content and Chloride Profiles of 2002 Boreholes
Drilled in Piñon Canopy Locations within Zone 4
Water Content Chloride
Figure 8aBorehole P1
Figure 8bBorehole P2
Figure 8cBorehole P3
200
180
160
140
120
100
80
60
40
20
0
0 2 4 6 8 10 12 14 16 18 20
0 5000 10000 15000 20000 25000 30000 35000 40000
200
180
160
140
120
100
80
60
40
20
0
0 2 4 6 8 10 12 14 16 18 20
0 5000 10000 15000 20000 25000 30000 35000 40000
Gravimetric water content (%)
)mc(
htpeD
Chloride (mg/L)
Gravimetric water content (%)
)mc(
htpeD
Chloride (mg/L)
200
180
160
140
120
100
80
60
40
20
0
0 2 4 6 8 10 12 14 16 18 20
0 5000 10000 15000 20000 25000 30000 35000 40000
Gravimetric water content (%)
)mc(
htpeD
Chloride (mg/L)
Spatial Variation in Near-Surface Hydrologic Behavior at LANL TA-54, Material Disposal Area G
09-05

18
Figure 9Water Content and Chloride Profiles of 2002 Boreholes Drilled in
Juniper Canopy Locations within Zone 4
Water Content Chloride
Figure 9aBorehole J1
Figure 9bBorehole J2
Figure 9cBorehole J3
200
180
160
140
120
100
80
60
40
20
0
0 2 4 6 8 10 12 14 16 18 20
0 500 1000 1500 2000 2500
200
180
160
140
120
100
80
60
40
20
0
0 2 4 6 8 10 12 14 16 18 20
0 500 1000 1500 2000 2500
Gravimetric water content (%)
)mc(
htpeD
Chloride (mg/L)
Gravimetric water content (%)
)mc(
htpeD
Chloride (mg/L)
200
180
160
140
120
100
80
60
40
20
0
0 2 4 6 8 10 12 14 16 18 20
0 500 1000 1500 2000 2500
Gravimetric water content (%)
)mc(
htpeD
Chloride (mg/L)
Spatial Variation in Near-Surface Hydrologic Behavior at LANL TA-54, Material Disposal Area G
09-05

Spatial Variation in Near-Surface Hydrologic Behavior at LANL TA-54, Material Disposal Area G09-05 19
Figure 10Water Content and Chloride Profiles of 2002 Boreholes
Drilled in Intercanopy Locations within Zone 4
Water Content Chloride
Figure 10cBorehole IC3
Figure 10dBorehole IC4
Figure 10aBorehole IC1
Figure 10bBorehole IC2
200
180
160
140
120
100
80
60
40
20
0
0 2 4 6 8 10 12 14 16 18 20
0 1000 2000 3000 4000 5000
200
180
160
140
120
100
80
60
40
20
0
0 2 4 6 8 10 12 14 16 18 20
0 1000 2000 3000 4000 5000
200
180
160
140
120
100
80
60
40
20
0
0 2 4 6 8 10 12 14 16 18 20
0 1000 2000 3000 4000 5000
200
180
160
140
120
100
80
60
40
20
0
0 2 4 6 8 10 12 14 16 18 20
0 1000 2000 3000 4000 5000
Gravimetric water content (%)
)mc(
htpeD
Chloride (mg/L)
Gravimetric water content (%))
mc(htpe
D
Chloride (mg/L)
Gravimetric water content (%)
)mc(
htpeD
Chloride (mg/L)
Gravimetric water content (%)
)mc(
htpeD
Chloride (mg/L)
Spatial Variation in Near-Surface Hydrologic Behavior at LANL TA-54, Material Disposal Area G 09-05
20
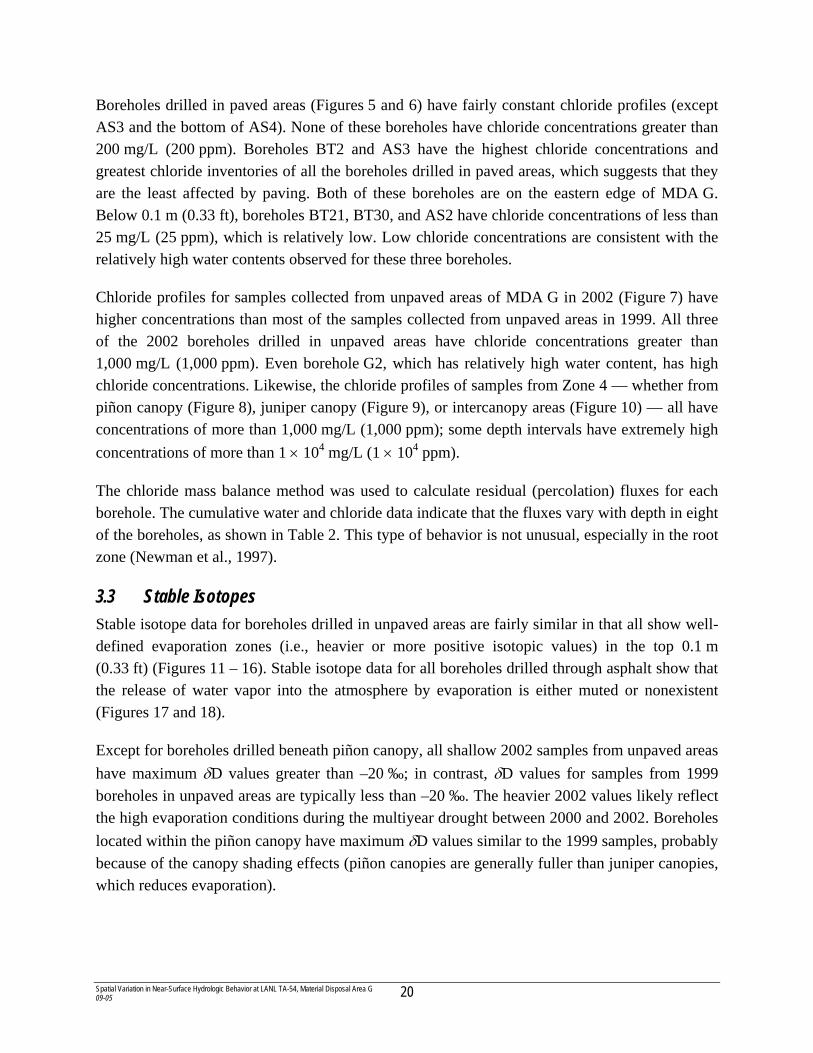
Boreholes drilled in paved areas (Figures 5 and 6) have fairly constant chloride profiles (except AS3 and the bottom of AS4). None of these boreholes have chloride concentrations greater than 200 mg/L (200 ppm). Boreholes BT2 and AS3 have the highest chloride concentrations and greatest chloride inventories of all the boreholes drilled in paved areas, which suggests that they are the least affected by paving. Both of these boreholes are on the eastern edge of MDA G. Below 0.1 m (0.33 ft), boreholes BT21, BT30, and AS2 have chloride concentrations of less than 25 mg/L (25 ppm), which is relatively low. Low chloride concentrations are consistent with the relatively high water contents observed for these three boreholes.
Chloride profiles for samples collected from unpaved areas of MDA G in 2002 (Figure 7) have higher concentrations than most of the samples collected from unpaved areas in 1999. All three of the 2002 boreholes drilled in unpaved areas have chloride concentrations greater than 1,000 mg/L (1,000 ppm). Even borehole G2, which has relatively high water content, has high chloride concentrations. Likewise, the chloride profiles of samples from Zone 4 — whether from piñon canopy (Figure 8), juniper canopy (Figure 9), or intercanopy areas (Figure 10) — all have concentrations of more than 1,000 mg/L (1,000 ppm); some depth intervals have extremely high concentrations of more than 1 × 10⁴ mg/L (1 × 10⁴ ppm).
The chloride mass balance method was used to calculate residual (percolation) fluxes for each borehole. The cumulative water and chloride data indicate that the fluxes vary with depth in eight of the boreholes, as shown in Table 2. This type of behavior is not unusual, especially in the root zone (Newman et al., 1997).
3.3 Stable Isotopes Stable isotope data for boreholes drilled in unpaved areas are fairly similar in that all show well-defined evaporation zones (i.e., heavier or more positive isotopic values) in the top 0.1 m (0.33 ft) (Figures 11 – 16). Stable isotope data for all boreholes drilled through asphalt show that the release of water vapor into the atmosphere by evaporation is either muted or nonexistent (Figures 17 and 18).
Except for boreholes drilled beneath piñon canopy, all shallow 2002 samples from unpaved areas have maximum δD values greater than –20 ‰; in contrast, δD values for samples from 1999 boreholes in unpaved areas are typically less than –20 ‰. The heavier 2002 values likely reflect the high evaporation conditions during the multiyear drought between 2000 and 2002. Boreholes located within the piñon canopy have maximum δD values similar to the 1999 samples, probably because of the canopy shading effects (piñon canopies are generally fuller than juniper canopies, which reduces evaporation).

Spatial Variation in Near-Surface Hydrologic Behavior at LANL TA-54, Material Disposal Area G 09-05
21
Table 2 Chloride-Based Flux Estimates
Borehole Flux 1 Depth Interval (m)
Flux (cm/yr)
Flux 2 Depth Interval (m)
Flux (cm/yr)
Flux 3 Depth Interval (m)
Flux (cm/yr)
7B 0 – 1.6 3.0E-01 --- --- --- ---
17B 0 – 0.6 3.0E-01 0.65 – 2 2.0E-02 --- ---
21B 0 – 2 9.0E-01 --- --- --- ---
Pit2 0 – 0.35 4.0E-01 0.35 – 1 6.0E-02 --- ---
Pit17 0 – 0.7 6.0E-01 0.7 – 1 2.0E-01 --- ---
Pit24 0 – 1 3.0E-01 --- --- --- ---
G1 0 – 1.5 1.0E-02 --- --- --- ---
G2 a 0 – 0.7 1.0E-02 0.7 – 1.1 3.0E-02 --- ---
G3 0 – 1.4 2.0E-02 --- --- --- ---
BT2 a 0 – 1 1.0E-01 --- --- --- ---
BT21 a 0 – 2 6.0E-01 --- --- --- ---
BT30 a 0 – 2 9.0E-01 --- --- --- ---
AS1 a 0 – 1.1 4.0E-01 --- --- --- ---
AS2 a 0 – 1.1 7.4E-01 --- --- --- ---
AS3 a 0 – 1.6 1.0E-01 --- --- --- ---
AS4 a 0 – 0.9 1.2E+00 0.9 – 1.2 2.0E-01 --- ---
P1 0 – 2.1 1.0E-02 --- --- --- ---
P2 0 – 1.5 4.0E-02 --- --- --- ---
P3 0 – 0.5 2.0E-02 0.5 – 1.5 1.0E-03 --- ---
J1 0 – 1.5 2.0E-02 --- --- --- ---
J2 0 – 0.5 2.0E-02 0.5 – 1.0 3.2E-02 1.0 – 1.5 1.0E-02
J3 0 – 1.5 1.0E-02 --- --- --- ---
IC1 0 – 1.5 2.0E-02 --- --- --- ---
IC2 0 – 0.3 2.8E-01 0.3 – 1.5 1.0E-02 --- ---
IC3 0 – 1.5 1.0E-02 --- --- --- ---
IC4 0 – 1.5 3.0E-02 --- --- --- ---
--- = Not applicable a Flux estimates for the boreholes drilled through asphalt and for G2 are highly uncertain.

22
Figure 11Stable Isotope Ratios in Pore Water of 1999
Boreholes Drilled Into Pit Covers
Figure 11aBorehole Pit2
Figure 11bBorehole Pit17
Figure 11cBorehole Pit24
-15 -12 -9 -6 -3 0 3 6 9 12 15 18 21 24200
180
160
140
120
100
80
60
40
20
0-160 -140 -120 -100 -80 -60 -40 -20 0
-15 -12 -9 -6 -3 0 3 6 9 12 15 18 21 24200
180
160
140
120
100
80
60
40
20
0-160 -140 -120 -100 -80 -60 -40 -20 0
δDδ18O
)mc(
htpeD
δ18 O (0/00) δ18 O (0/00) δ18 O (0/00)
δD (0/00) δD (0/00) δD (0/00)
)mc(
htpeD
-15 -12 -9 -6 -3 0 3 6 9 12 15 18 21 24200
180
160
140
120
100
80
60
40
20
0-160 -140 -120 -100 -80 -60 -40 -20 0
)mc(
htpeD
Spatial Variation in Near-Surface Hydrologic Behavior at LANL TA-54, Material Disposal Area G
09-05

23
Figure 12Stable Isotope Ratios in Pore Water of 1999
Boreholes Drilled Adjacent to Pits
Figure 12aBorehole 7B
Figure 12bBorehole 17B
Figure 12cBorehole 21B
δDδ18O
-15 -10 -5 0 5 10 15 20 25200
180
160
140
120
100
80
60
40
20
0-160 -140 -120 -100 -80 -60 -40 -20 0
-15 -10 -5 0 5 10 15 20 25200
180
160
140
120
100
80
60
40
20
0-160 -140 -120 -100 -80 -60 -40 -20 0
)mc(
htpeD
)m c(
h tpeD
-15 -10 -5 0 5 10 15 20 25200
180
160
140
120
100
80
60
40
20
0-160 -140 -120 -100 -80 -60 -40 -20 0
)mc(
htpeD
Spatial Variation in Near-Surface Hydrologic Behavior at LANL TA-54, Material Disposal Area G
09-05
δ18 O (0/00)
δD (0/00)
δ18 O (0/00)
δD (0/00)
δ18 O (0/00)
δD (0/00)

24
Figure 13Stable Isotope Ratios in Pore Water of 2002
Boreholes Drilled in Unpaved Areas
Figure 13aBorehole G1
Figure 13bBorehole G2
Figure 13cBorehole G3
δDδ18O
-15 -10 -5 0 5 10 15 20 25200
180
160
140
120
100
80
60
40
20
0-160 -140 -120 -100 -80 -60 -40 -20 0
-15 -10 -5 0 5 10 15 20 25200
180
160
140
120
100
80
60
40
20
0-160 -140 -120 -100 -80 -60 -40 -20 0
)mc(
htpeD
)mc(
htpeD
Spatial Variation in Near-Surface Hydrologic Behavior at LANL TA-54, Material Disposal Area G
09-05
-15 -10 -5 0 5 10 15 20 25200
180
160
140
120
100
80
60
40
20
0-160 -140 -120 -100 -80 -60 -40 -20 0
)mc(
htpeD
δ18 O (0/00) δ18 O (0/00) δ18 O (0/00)
δD (0/00) δD (0/00) δD (0/00)

25
Figure 14Stable Isotope Ratios in Pore Water of 2002 Boreholes Drilled inPiñon Canopy Locations at Woodland Analog Site within Zone 4
Figure 14aBorehole P1
Figure 14bBorehole P2
Figure 14cBorehole P3
δDδ18O
Spatial Variation in Near-Surface Hydrologic Behavior at LANL TA-54, Material Disposal Area G
09-05
-15 -10 -5 0 5 10 15 20 25
200
180
160
140
120
100
80
60
40
20
0-160 -140 -120 -100 -80 -60 -40 -20 0
-15 -10 -5 0 5 10 15 20 25
200
180
160
140
120
100
80
60
40
20
0-160 -140 -120 -100 -80 -60 -40 -20 0
)mc(
htpeD
)mc (
htp eD
-15 -10 -5 0 5 10 15 20 25
200
180
160
140
120
100
80
60
40
20
0-160 -140 -120 -100 -80 -60 -40 -20 0
)mc(
htpeD
δ18 O (0/00) δ18 O (0/00) δ18 O (0/00)
δD (0/00) δD (0/00) δD (0/00)

26
Figure 15Stable Isotope Ratios in Pore Water of 2002
Boreholes Drilled in Juniper Canopy Locations within Zone 4
Figure 15aBorehole J1
Figure 15bBorehole J2
Figure 15cBorehole J3
δDδ18O
Spatial Variation in Near-Surface Hydrologic Behavior at LANL TA-54, Material Disposal Area G
09-05
-15 -10 -5 0 5 10 15 20 25200
180
160
140
120
100
80
60
40
20
0-160 -140 -120 -100 -80 -60 -40 -20 0
-15 -10 -5 0 5 10 15 20 25200
180
160
140
120
100
80
60
40
20
0-160 -140 -120 -100 -80 -60 -40 -20 0
)mc(
htpeD
)m c(
ht peD
-15 -10 -5 0 5 10 15 20 25200
180
160
140
120
100
80
60
40
20
0-160 -140 -120 -100 -80 -60 -40 -20 0
)mc(
htpeD
δ18 O (0/00) δ18 O (0/00) δ18 O (0/00)
δD (0/00) δD (0/00) δD (0/00)

Spatial Variation in Near-Surface Hydrologic Behavior at LANL TA-54, Material Disposal Area G09-05 27
Figure 16Stable Isotope Ratios in Pore Water of 2002 Boreholes Drilled in
Intercanopy Locations within Zone 4
Figure 16cBorehole IC3
Figure 16dBorehole IC4
Figure 16aBorehole IC1
Figure 16bBorehole IC2
-15 -10 -5 0 5 10 15 20 25200
180
160
140
120
100
80
60
40
20
0-160 -140 -120 -100 -80 -60 -40 -20 0
-15 -10 -5 0 5 10 15 20 25200
180
160
140
120
100
80
60
40
20
0-160 -140 -120 -100 -80 -60 -40 -20 0
)mc(
htpeD
)mc(
h tpeD
-15 -10 -5 0 5 10 15 20 25200
180
160
140
120
100
80
60
40
20
0-160 -140 -120 -100 -80 -60 -40 -20 0
-15 -10 -5 0 5 10 15 20 25200
180
160
140
120
100
80
60
40
20
0-160 -140 -120 -100 -80 -60 -40 -20 0
)mc(
htpeD
)mc (
ht peD
δDδ18O
δ18 O (0/00)
δD (0/00)
δ18 O (0/00)
δD (0/00)
δ18 O (0/00)
δD (0/00)
δ18 O (0/00)
δD (0/00)

28
Figure 17Stable Isotope Ratios in Pore Water of 1999
Boreholes Drilled through Asphalt Pads
Figure 17aBorehole BT2
Figure 17bBorehole BT21
Figure 17cBorehole BT30
δDδ18O
Spatial Variation in Near-Surface Hydrologic Behavior at LANL TA-54, Material Disposal Area G
09-05
-15 -10 -5 0 5 10 15 20 25200
180
160
140
120
100
80
60
40
20
0-160 -140 -120 -100 -80 -60 -40 -20 0
-15 -10 -5 0 5 10 15 20 25200
180
160
140
120
100
80
60
40
20
0-160 -140 -120 -100 -80 -60 -40 -20 0
)mc(
htpeD
)m c(
htp eD
-15 -10 -5 0 5 10 15 20 25200
180
160
140
120
100
80
60
40
20
0-160 -140 -120 -100 -80 -60 -40 -20 0
)mc(
htpeD
δ18 O (0/00)
δD (0/00)
δ18 O (0/00)
δD (0/00)
δ18 O (0/00)
δD (0/00)

29
Figure 18Stable Isotope Ratios in Pore Water of 2002
Boreholes Drilled through Asphalt Pads
Figure 18cBorehole AS3
Figure 18dBorehole AS4
Figure 18aBorehole AS1
Figure 18bBorehole AS2
-15 -10 -5 0 5 10 15 20 25200
180
160
140
120
100
80
60
40
20
0-160 -140 -120 -100 -80 -60 -40 -20 0
-15 -10 -5 0 5 10 15 20 25200
180
160
140
120
100
80
60
40
20
0-160 -140 -120 -100 -80 -60 -40 -20 0
)mc(
htpeD
)mc (
htp eD
δDδ18O
-15 -10 -5 0 5 10 15 20 25200
180
160
140
120
100
80
60
40
20
0-160 -140 -120 -100 -80 -60 -40 -20 0
-15 -10 -5 0 5 10 15 20 25200
180
160
140
120
100
80
60
40
20
0-160 -140 -120 -100 -80 -60 -40 -20 0
)mc(
htpeD
)m c(
ht peD
δ18 O (0/00)
δD (0/00)
δ18 O (0/00)
δD (0/00)
δ18 O (0/00)
δD (0/00)
δ18 O (0/00)
δD (0/00)
Spatial Variation in Near-Surface Hydrologic Behavior at LANL TA-54, Material Disposal Area G09-05

Spatial Variation in Near-Surface Hydrologic Behavior at LANL TA-54, Material Disposal Area G 09-05
30
Stable isotope profiles for boreholes in active-area unpaved locations (Figures 11 – 16) typically have profiles with shallow, isotopically heavy evaporation bulges that are quite different from the profiles of boreholes drilled through pavement (Figures 17 and 18). This is shown in Figure 19, a meteoric water diagram on which isotopic values from the 1999 boreholes drilled through pit covers and asphalt are plotted against the local meteoric water line of Vuataz and Goff (1986). The local meteoric water line, a benchmark for evaluating evaporation, represents the isotopic composition of precipitation in the Los Alamos area. Isotopic compositions vary along this line because of temperature and other effects. When evaporation occurs, isotopic values increase and fall to the right of the meteoric water line; the difference between the measured values and the meteoric water line indicates the degree of evaporation. Samples from unpaved locations at MDA G plot well to the right of the meteoric water line, which indicates substantial evaporation. Samples from paved locations, however, show little evaporative effect.
3.4 Pressure Head Most samples used in the 1999 pressure head analyses were too wet for the chilled mirror method and yielded unreliable results; consequently, pressure head was not measured in 2002. The minimum pressure head that can be measured using the chilled-mirror method is about 4,100 cm (1,600 in.). This is indicated as a red dotted line in Figures 20 – 22, which show the pressure head values for the 1999 boreholes. Note that the red line appears at different locations on each of these figures because of the difference in scale.
Because of the wetness of the samples, the only reliable measurements for boreholes drilled into pit covers were from depths of 0.5 m (1.6 ft) or less (Figure 20 and Attachment I), where evapo-transpiration had depleted the water. Borehole 7B, drilled into unexcavated ground adjacent to pits, showed a similar high-suction (low-water-content) zone near the surface, but boreholes 17B and 21B, also drilled in unexcavated areas, did not. Below 0.8 m (2.6 ft), borehole 17B had pressure heads of around 1 × 104 cm (3,900 in.), which correspond to decreased water content and increased chloride. Borehole 21B was too wet throughout its entire profile to accurately measure the pressure head. Other than thin zones in the top 0.1 m (3.9 in.) of the profiles (and one zone at around 0.45 m [1.5 ft] in borehole BT2), all of the boreholes in paved areas were too wet to reliably determine pressure heads using the chilled mirror method.
3.5 Statistical Analyses T-tests were used to compare hydrological variables measured (1) in pit covers versus intact adjacent tuff, (2) at paved versus unpaved locations, and (3) under current versus potential postclosure vegetative conditions. Results for the variables used to compare the performance of pit covers and intact tuff are shown in Table 3. Similar statistics for paved and unpaved locations and for the active disposal area and Zone 4 are shown in Tables 4 and 5. Statistical comparisons of samples taken from canopy and intercanopy locations within Zone 4 are shown in Table 6.

31
Figure 19Comparison of Isotopic Ratios in 1999
Boreholes Drilled in Paved and Unpaved Areas
-120
-110
-100
-90
-80
-70
-60
-50
-40
-30
-20
-10
0
-15 -10 -5 0 5 10 15
δ18O (‰)
δD (‰
)
LMWL = Local meteoric water line
1999 boreholes drilled through asphalt pads(BT2, BT21, BT30)
1999 boreholes drilled into pit covers(Pit2, Pit17, Pit24)
1999 boreholes drilled in unpaved areas(7B, 17B, 21B)
LMW
L
Spatial Variation in Near-Surface Hydrologic Behavior at LANL TA-54, Material Disposal Area G09-05

Spatial Variation in Near-Surface Hydrologic Behavior at LANL TA-54, Material Disposal Area G
09-0532
Figure 20Pressure Head Measurements for 1999
Boreholes Drilled into Pit Covers
Figure 20aBorehole Pit2
Figure 20bBorehole Pit17
Figure 20cBorehole Pit24
200
180
160
140
120
100
80
60
40
20
0
0.0E+00 7.5E+04 1.5E+05 2.25E+05 3.0E+05 3.75E+05200
180
160
140
120
100
80
60
40
20
0
0.0E+00 7.5E+04 1.5E+05 2.25E+05 3.0E+05 3.75E+05
Pressure head (cm)
)mc(
htpeD
Pressure head (cm)
)mc(
htpeD
200
180
160
140
120
100
80
60
40
20
0
0.0E+00 7.5E+04 1.5E+05 2.25E+05 3.0E+05 3.75E+05
Pressure head (cm)
)mc(
htpeD
Minimum pressure head that can be measuredusing chilled-mirror method (about 4,100 cm)
Measured pressure head

Spatial Variation in Near-Surface Hydrologic Behavior at LANL TA-54, Material Disposal Area G
09-0533
Figure 21Pressure Head Measurements for 1999
Boreholes Drilled Adjacent to Pits
Figure 21aBorehole 7B
Figure 21bBorehole 17B
Figure 21cBorehole 21B
200
180
160
140
120
100
80
60
40
20
0
0E+00 2E+03 4E+03 6E+03 8E+03 1E+04 1.2E+04200
180
160
140
120
100
80
60
40
20
0
0E+00 2E+03 4E+03 6E+03 8E+03 1E+04 1.2E+04 0E+00 2E+03 4E+03 6E+03 8E+03 1E+04 1.2E+04
Pressure head (cm)
)mc(
htpeD
Pressure head (cm)
)mc(
htpeD
200
180
160
140
120
100
80
60
40
20
0
Pressure head (cm)
)mc(
htpeD
Minimum pressure head that can be measuredusing chilled-mirror method (about 4,100 cm)
Measured pressure head

Spatial Variation in Near-Surface Hydrologic Behavior at LANL TA-54, Material Disposal Area G
09-0534
Figure 22Pressure Head Measurements for 1999
Boreholes Drilled through Asphalt Pads
Figure 22aBorehole BT2
Figure 22bBorehole BT21
Figure 22cBorehole BT30
200
180
160
140
120
100
80
60
40
20
0
0E+04 1E+04 2E+04 3E+04 4E+04 5E+04 6E+04200
180
160
140
120
100
80
60
40
20
0
0E+04 1E+04 2E+04 3E+04 4E+04 5E+04 6E+04
Pressure head (cm)
)mc(
htpeD
Pressure head (cm)
)mc(
htpeD
200
180
160
140
120
100
80
60
40
20
0
0E+04 1E+04 2E+04 3E+04 4E+04 5E+04 6E+04
Pressure head (cm)
)mc(
htpeD
Minimum pressure head that can be measuredusing chilled-mirror method (about 4,100 cm)
Measured pressure head

Spatial Variation in Near-Surface H
ydrologic Behavior at LANL TA-54, M
aterial Disposal Area G
09-05
35
Table 3 Comparison of T-Test Results for Pit Covers and Unexcavated Locations Adjacent to Pits
Mean Value Number of Samples b
Standard Deviation
Hydrological Variable Adjacent
to Pit Pit T-Test
Statistic
Degrees of
Freedom p a Adjacent
to Pit Pit Adjacent
to Pit Pit
Water Residence Time at 1-m depth (yr) 5.0E+01 7.0E+01 -3.0E-01 3.0E+00 7.8E-01 2 3 3.9E+01 8.7E+01
Cumulative Water Content at 1-m depth 1.1E-01 4.8E-02 1.9E+00 3.0E+00 1.5E-01 2 3 1.0E-03 4.2E-02
Total Flux (cm/yr) c 1.7E-01 2.5E-01 -5.3E-01 3.0E+00 6.3E-01 2 3 2.0E-01 1.6E-01
Flux 1 (cm/yr) c 2.9E-01 4.4E-01 -1.0E+00 3.0E+00 3.9E-01 2 3 2.8E-02 2.0E-01
Flux 2 (cm/yr) c 1.7E-01 1.9E-01 -1.9E-01 3.0E+00 8.6E-01 2 3 2.0E-01 1.1E-01
Flux 3 (cm/yr) c 1.7E-01 1.9E-01 -1.9E-01 3.0E+00 8.6E-01 2 3 2.0E-01 1.1E-01
Average Chloride Content in Top 1 m (mg/L) 6.4E+01 6.2E+01 4.6E-02 3.0E+00 9.7E-01 2 3 5.0E+01 5.0E+01
Maximum Chloride Content in Top 1 m (mg/L) 1.4E+02 1.4E+02 4.7E-02 3.0E+00 9.7E-01 2 3 1.1E+02 8.7E+01
Average Nitrate Content in Top 1 m (mg/L) 6.4E+01 5.8E+01 8.5E-02 3.0E+00 9.4E-01 2 3 8.6E+01 8.9E+01
Maximum Nitrate Content in Top 1 m (mg/L) 2.7E+02 3.1E+02 -8.4E-02 3.0E+00 9.4E-01 2 3 3.6E+02 4.9E+02
Average δ18O in Top 1 m (‰) -3.4E+00 -7.7E-01 -1.8E+00 3.0E+00 1.8E-01 2 3 2.2E+00 1.3E+00
Maximum δ18O in Top 1 m (‰) 8.3E+00 1.0E+01 -8.9E-01 3.0E+00 4.4E-01 2 3 2.9E+00 2.1E+00
Average δD in Top 1 m (‰) -5.6E+01 -5.1E+01 -1.2E+00 3.0E+00 3.2E-01 2 3 3.1E+00 5.2E+00
Maximum δD in Top 1 m (‰) -2.9E+01 -2.2E+01 -1.7E+00 3.0E+00 1.9E-01 2 3 5.0E+00 3.6E+00
Average θg in Top 1 m (%) 7.7E+00 7.1E+00 2.4E-01 3.0E+00 8.2E-01 2 3 2.4E-01 3.0E+00
Maximum θg in Top 1 m (%) 1.2E+01 9.3E+00 7.7E-01 3.0E+00 5.0E-01 2 3 3.1E+00 4.2E+00
δ18O= Delta oxygen-18 value δD= Delta deuterium value θg = Gravimetric water content a Probability value used in the T-test approach to determine significance of differences b Samples from borehole 21B were not considered valid because of excessive water content due to its location near an asphalt pad. c Total flux represents the average chloride content from the entire borehole. For boreholes that displayed varying flux with depth (see Table 2), Flux 1 refers to the flux in the shallow region, Flux 2 refers to the flux in the intermediate region, and Flux 3 refers to the flux in the deepest region .

δ18O= Delta oxygen-18 value δD= Delta deuterium value θg = Gravimetric water content a Probability value used in the T-test approach to determine significance of differences b Samples from borehole 21B were not considered valid because of excessive water content due to its location near an asphalt pad. c Total flux represents the average chloride content from the entire borehole. For boreholes that displayed varying flux with depth (see Table 2), Flux 1 refers to the flux in the shallow region, Flux 2 refers tp the flux in the intermediate region, and Flux 3 refers to the flux in the deepest region.
Bold indicates variables are significantly different.
Spatial Variation in Near-Surface H
ydrologic Behavior at LANL TA-54, M
aterial Disposal Area G
09-05
36
Table 4 Comparison of T-Test Results for Paved and Unpaved Locations
Mean Value Number of Samples b Standard Deviation
Hydrological Variable Paved Unpaved T-Test
Statistic
Degrees of
Freedom p a Paved Unpaved Paved Unpaved
Water Residence Time at 1-m depth (yr) 4.2E+01 2.0E+02 -1.1E+00 2.3E+01 2.6E-01 7 18 3.7E+01 3.5E+02
Water Residence Time 1 at 5-m depth (yr) 9.3E+01 2.0E+02 -1.0E+00 1.5E+01 3.4E-01 3 14 1.1E+02 1.7E+02
Cumulative Water Content at 1-m depth 1.5E-01 5.9E-02 5.8E+00 2.3E+01 0.0E+00 7 18 4.4E-02 3.0E-02
Cumulative Water Content at 1.5-m depth 2.4E-01 7.4E-02 6.3E+00 1.5E+01 0.0E+00 3 14 5.8E-02 3.9E-02
Total Flux (cm/yr) c 4.6E-01 7.3E-02 4.7E+00 2.3E+01 0.0E+00 7 18 3.0E-01 1.2E-01
Flux 1 (cm/yr) c 5.8E-01 1.6E-01 3.6E+00 2.3E+01 2.0E-03 7 18 4.1E-01 1.8E-01
Flux 2 (cm/yr) c 4.5E-01 6.4E-02 4.8E+00 2.3E+01 0.0E+00 7 18 3.1E-01 9.9E-02
Flux 3 (cm/yr) c 4.5E-01 6.2E-02 4.8E+00 2.3E+01 0.0E+00 7 18 3.1E-01 1.0E-01
Average Chloride Content in Top 1 m (mg/L) 3.8E+01 9.7E+02 -1.3E+00 2.3E+01 2.2E-01 7 18 3.7E+01 1.9E+03
Average Chloride Content in Top 1.5 m (mg/L) 4.7E+01 9.8E+02 -1.1E+00 1.5E+01 2.9E-01 3 14 5.7E+01 1.4E+03
Maximum Chloride Content in Top 1 m (mg/L) 7.4E+01 3.9E+03 -1.2E+00 2.3E+01 2.4E-01 7 18 6.0E+01 8.3E+03
Maximum Chloride Content in Top 1.5 m (mg/L) 8.7E+01 5.1E+03 -9.3E-01 1.5E+01 3.7E-01 3 14 8.7E+01 9.1E+03
Average Nitrate Content in Top 1 m (mg/L) 8.6E+01 8.2E+01 5.1E-02 2.3E+01 9.6E-01 7 18 1.1E+02 2.2E+02
Average Nitrate Content in Top 1.5 m (mg/L) 7.2E+01 7.0E+01 1.7E-02 1.5E+01 9.9E-01 3 14 6.0E+01 1.8E+02
Maximum Nitrate Content in Top 1 m (mg/L) 1.6E+02 6.6E+02 -6.0E-01 2.3E+01 5.6E-01 7 18 1.8E+02 2.2E+03
Maximum Nitrate Content in Top 1.5 m (mg/L) 1.8E+02 7.8E+02 -4.0E-01 1.5E+01 6.9E-01 3 14 1.7E+02 2.5E+03

Table 4 (Continued) Comparison of T-Test Results for Paved and Unpaved Locations
Spatial Variation in Near-Surface H
ydrologic Behavior at LANL TA-54, M
aterial Disposal Area G
09-05
37
Mean Value Number of Samples b Standard Deviation
Hydrological Variable Paved Unpaved T-Test
Statistic
Degrees of
Freedom p a Paved Unpaved Paved Unpaved
Average δ18O in Top 1 m (‰) -5.0E+00 2.2E+00 -4.5E+00 2.3E+01 0.0E+00 7 18 2.1E+00 4.0E+00
Average δ18O in Top 1.5 m (‰) -6.3E+00 1.3E+00 -3.0E+00 1.5E+01 1.0E-02 3 14 1.9E+00 4.3E+00
Maximum δ18O in Top 1 m (‰) -9.1E-01 1.3E+01 -6.6E+00 2.3E+01 0.0E+00 7 18 3.8E+00 5.1E+00
Maximum δ18O in Top 1.5 m (‰) -2.8E+00 1.3E+01 -5.0E+00 1.5E+01 0.0E+00 3 14 3.6E+00 5.2E+00
Average δD in Top 1 m (‰) -6.0E+01 -5.2E+01 -1.6E+00 2.3E+01 1.3E-01 7 18 9.2E+00 1.1E+01
Average δD in Top 1.5 m (‰) -6.3E+01 -5.4E+01 -1.2E+00 1.5E+01 2.6E-01 3 14 5.2E+00 1.3E+01
Maximum δD in Top 1 m (‰) -4.4E+01 -1.6E+01 -3.0E+00 2.3E+01 7.0E-03 7 18 1.4E+01 2.3E+01
Maximum δD in Top 1.5 m (‰) -4.9E+01 -1.5E+01 -2.2E+00 1.5E+01 4.7E-02 3 14 8.6E+00 2.7E+01
Average θg in Top 1 m (%) 1.1E+01 4.7E+00 5.1E+00 2.3E+01 0.0E+00 7 18 3.1E+00 2.4E+00
Average θg in Top 1.5 m (%) 1.2E+01 3.5E+00 6.2E+00 1.5E+01 0.0E+00 3 14 3.0E+00 1.9E+00
Maximum θg in Top 1 m (%) 1.3E+01 1.0E+01 1.4E+00 2.3E+01 1.9E-01 7 18 4.0E+00 4.3E+00
Maximum θg in Top 1.5 m (%) 1.5E+01 1.0E+01 1.8E+00 1.5E+01 8.9E-02 3 14 3.2E+00 4.0E+00
δ18O= Delta oxygen-18 value δD= Delta deuterium value θg = Gravimetric water content a Probability value used in the T-test approach to determine significance of differences b Samples from borehole 21B were not considered valid because of excessive water content due to its location near an asphalt pad. c Total flux represents the average chloride content from the entire borehole. For boreholes that displayed varying flux with depth (see Table 2), Flux 1 refers to the flux in the shallow region, Flux 2 refers to the flux in the intermediate region, and Flux 3 refers to the flux in the deepest region.
Bold indicates variables are significantly different.

δ18O= Delta oxygen-18 value δD= Delta deuterium value θg = Gravimetric water content a Probability value used in the T-test approach to determine significance of differences b Samples from borehole 21B were not considered valid because of excessive water content due to its location near an asphalt pad. c Total flux represents the average chloride content from the entire borehole. For boreholes that displayed varying flux with depth (see Table 2), Flux 1 indicates the flux in the shallow region, Flux 2 indicates the flux in the intermediate region, and Flux 3 indicates flux in the deepest region.
Bold indicates variables are significantly different.
Spatial Variation in Near-Surface H
ydrologic Behavior at LANL TA-54, M
aterial Disposal Area G
09-05
38
Table 5 Comparison of T-Test Results for Unpaved Portions of Active Disposal Area and Zone 4
Mean Value Number of Valid
Samples b Standard Deviation
Hydrological Variable Active Area Zone 4
T-Test Statistic
Degrees of
Freedom p a Active Area Zone 4
Active Area Zone 4
Water Residence Time at 1-m depth (yr) 2.8E+02 1.4E+02 8.3E-01 1.6E+01 4.2E-01 8 10 5.2E+02 1.1E+02
Water Residence Time at 1.5-m depth (yr) 1.6E+02 2.1E+02 -4.4E-01 1.2E+01 6.7E-01 4 10 1.3E+02 1.9E+02
Cumulative Water Content at 1-m depth 6.5E-02 5.4E-02 7.7E-01 1.6E+01 4.5E-01 8 10 4.1E-02 2.0E-02
Cumulative Water Content at 1.5-m depth 9.5E-02 6.5E-02 1.3E+00 1.2E+01 2.2E-01 4 10 6.1E-02 2.7E-02
Total Flux (cm/yr) c 1.4E-01 1.7E-02 2.5E+00 1.6E+01 2.4E-02 8 10 1.6E-01 1.0E-02
Flux 1 (cm/yr) c 2.4E-01 9.8E-02 1.8E+00 1.6E+01 8.9E-02 8 10 2.3E-01 9.9E-02
Flux 2 (cm/yr) c 1.2E-01 1.8E-02 2.6E+00 1.6E+01 2.0E-02 8 10 1.3E-01 1.0E-02
Flux 3 (cm/yr) c 1.2E-01 1.4E-02 2.7E+00 1.6E+01 1.7E-02 8 10 1.3E-01 1.0E-02
Average Chloride Content in Top 1 m (mg/L) 4.7E+02 1.4E+03 -9.8E-01 1.6E+01 3.4E-01 8 10 5.8E+02 2.5E+03
Average Chloride Content Top 1.5 m (mg/L) 4.6E+02 1.2E+03 -8.5E-01 1.2E+01 4.1E-01 4 10 3.6E+02 1.6E+03
Maximum Chloride Content in Top 1 m (mg/L) 2.1E+03 5.4E+03 -8.2E-01 1.6E+01 4.2E-01 8 10 2.8E+03 1.1E+04
Maximum Chloride Content in Top 1.5 m (mg/L) 3.4E+03 5.8E+03 -4.3E-01 1.2E+01 6.7E-01 4 10 3.3E+03 1.1E+04
Average Nitrate Content in Top 1 m (mg/L) 1.7E+02 1.0E+01 1.6E+00 1.6E+01 1.4E-01 8 10 3.3E+02 1.3E+01
Average Nitrate Content in Top 1.5 m (mg/L) 2.2E+02 9.6E+00 2.3E+00 1.2E+01 4.3E-02 4 10 3.2E+02 1.1E+01
Maximum Nitrate Content in Top 1 m (mg/L) 1.4E+03 5.1E+01 1.3E+00 1.6E+01 2.0E-01 8 10 3.3E+03 6.1E+01
Maximum Nitrate Content in Top 1.5 m (mg/L) 2.6E+03 5.5E+01 1.9E+00 1.2E+01 8.6E-02 4 10 4.6E+03 6.0E+01

Table 5 (Continued) Comparison of T-Test Results for Unpaved Portions of Active Disposal Area and Zone 4
Spatial Variation in Near-Surface H
ydrologic Behavior at LANL TA-54, M
aterial Disposal Area G
09-05
39
Mean Value Number of Valid
Samples b Standard Deviation
Hydrological Variable Active Area Zone 4
T-Test Statistic
Degrees of
Freedom p a Active Area Zone 4
Active Area Zone 4
Average δ18O in Top 1 m (‰) 6.0E-01 3.6E+00 -1.6E+00 1.6E+01 1.2E-01 8 10 4.1E+00 3.6E+00
Average δ18O in Top 1.5 m (‰) -7.4E-01 2.1E+00 -1.1E+00 1.2E+01 2.8E-01 4 10 4.6E+00 4.1E+00
Maximum δ18O in Top 1 m (‰) 1.3E+01 1.4E+01 -2.9E-01 1.6E+01 7.7E-01 8 10 6.0E+00 4.7E+00
Maximum δ18O in Top 1.5 m (‰) 1.3E+01 1.4E+01 -2.2E-01 1.2E+01 8.3E-01 4 10 7.3E+00 4.7E+00
Average δD in Top 1 m (‰) -4.9E+01 -5.5E+01 1.2E+00 1.6E+01 2.6E-01 8 10 1.2E+01 9.6E+00
Average δD in Top 1.5 m (‰) -4.9E+01 -5.7E+01 9.8E-01 1.2E+01 3.5E-01 4 10 1.8E+01 1.0E+01
Maximum δD in Top 1 m (‰) -9.6E+00 -2.1E+01 1.0E+00 1.6E+01 3.3E-01 8 10 3.3E+01 1.1E+01
Maximum δD in Top 1.5 m (‰) -1.6E-01 -2.1E+01 1.4E+00 1.2E+01 2.0E-01 4 10 4.8E+01 1.1E+01
Average θg in Top 1 m (%) 6.0E+00 3.8E+00 2.1E+00 1.6E+01 5.1E-02 8 10 2.9E+00 1.4E+00
Average θg in Top 1.5 m (%) 4.6E+00 3.1E+00 1.4E+00 1.2E+01 1.8E-01 4 10 2.9E+00 1.2E+00
Maximum θg in Top 1 m (%) 9.6E+00 1.1E+01 -6.7E-01 1.6E+01 5.2E-01 8 10 5.6E+00 3.2E+00
Maximum θg in Top 1.5 m (%) 7.7E+00 1.1E+01 -1.5E+00 1.2E+01 1.7E-01 4 10 5.4E+00 3.2E+00
δ18O= Delta oxygen-18 value δD= Delta deuterium value θg = Gravimetric water content a Probability value used in the T-test approach to determine significance of differences b Samples from borehole 21B were not considered valid because of excessive water content due to its location near an asphalt pad. c Total flux represents the average chloride content from the entire borehole. For boreholes that displayed varying flux with depth (see Table 2), Flux 1 refers to the flux in the shallow region, Flux 2 refers to the flux in the intermediate region, and Flux 3 refers to the flux in the deepest region.
Bold indicates variables are significantly different.
Spatial Variation in Near-Surface H
ydrologic Behavior at LANL TA-54, M
aterial Disposal Area G
09-05
40
Table 6 Comparison of T-Test Results for Zone 4 Canopy and Intercanopy Locations
Mean Number of Valid
Samples b Standard Deviation
Hydrological Variable Inter-
canopy Canopy T-Test
Statistic
Degrees of
Freedom p a Inter-
canopy Canopy Inter-
canopy Canopy
Water Residence Time at 1-m depth (yr) 4.9E+01 1.9E+02 -2.5E+00 8.0E+00 3.8E-02 4 6 2.4E+01 1.1E+02
Water Residence Time at 1.5-m depth (yr) 7.1E+01 3.0E+02 -2.3E+00 8.0E+00 5.3E-02 4 6 3.1E+01 2.0E+02
Cumulative Water Content at 1-m depth 3.8E-02 6.4E-02 -2.6E+00 8.0E+00 3.4E-02 4 6 1.3E-02 1.7E-02
Cumulative Water Content at 1.5-m depth 4.4E-02 7.9E-02 -2.6E+00 8.0E+00 3.2E-02 4 6 1.4E-02 2.4E-02
Total Flux (cm/yr) c 1.7E-02 1.6E-02 1.4E-01 8.0E+00 8.9E-01 4 6 9.0E-03 1.1E-02
Flux 1 (cm/yr) c 1.1E-01 8.7E-02 3.8E-01 8.0E+00 7.1E-01 4 6 1.2E-01 9.2E-02
Flux 2 (cm/yr) c 1.7E-02 1.8E-02 -1.7E-01 8.0E+00 8.7E-01 4 6 1.0E-02 1.1E-02
Flux 3 (cm/yr) c 1.6E-02 1.3E-02 4.7E-01 8.0E+00 6.5E-01 4 6 1.1E-02 1.0E-02
Average Chloride Content in Top 1 m (mg/L) 8.8E+02 1.7E+03 -4.8E-01 8.0E+00 6.4E-01 4 6 4.7E+02 3.3E+03
Average Chloride Content Top 1.5 m (mg/L) 7.8E+02 1.4E+03 -6.0E-01 8.0E+00 5.6E-01 4 6 4.6E+02 2.1E+03
Maximum Chloride Content in Top 1 m (mg/L) 3.2E+03 6.8E+03 -5.0E-01 8.0E+00 6.3E-01 4 6 1.7E+03 1.4E+04
Maximum Chloride Content in Top 1.5 m (mg/L) 3.2E+03 7.6E+03 -6.1E-01 8.0E+00 5.6E-01 4 6 1.7E+03 1.4E+04
Average Nitrate Content in Top 1 m (mg/L) 2.2E+01 2.5E+00 3.9E+00 8.0E+00 4.0E-03 4 6 1.2E+01 2.3E+00
Average Nitrate Content in Top 1.5 m (mg/L) 2.0E+01 2.6E+00 3.8E+00 8.0E+00 5.0E-03 4 6 1.1E+01 1.9E+00
Maximum Nitrate Content in Top 1 m (mg/L) 1.1E+02 1.0E+01 5.0E+00 8.0E+00 1.0E-03 4 6 5.1E+01 7.8E+00
Maximum Nitrate Content in Top 1.5 m (mg/L) 1.2E+02 1.3E+01 5.7E+00 8.0E+00 0.0E+00 4 6 4.5E+01 6.6E+00

Table 6 (Continued) Comparison of T-Test Results for Zone 4 Canopy and Intercanopy Locations
Spatial Variation in Near-Surface H
ydrologic Behavior at LANL TA-54, M
aterial Disposal Area G
09-05
41
Mean Number of Valid
Samples b Standard Deviation
Hydrological Variable Inter-
canopy Canopy T-Test
Statistic
Degrees of
Freedom p a Inter-
canopy Canopy Inter-
canopy Canopy
Average δ18O in Top 1 m (‰) 6.1E+00 1.9E+00 2.1E+00 8.0E+00 6.6E-02 4 6 4.7E+00 1.3E+00
Average δ18O in Top 1.5 m (‰) 4.5E+00 4.9E-01 1.6E+00 8.0E+00 1.4E-01 4 6 5.6E+00 1.9E+00
Maximum δ18O in Top 1 m (‰) 1.6E+01 1.2E+01 1.6E+00 8.0E+00 1.6E-01 4 6 5.8E+00 3.2E+00
Maximum δ18O in Top 1.5 m (‰) 1.6E+01 1.2E+01 1.6E+00 8.0E+00 1.6E-01 4 6 5.8E+00 3.2E+00
Average δD in Top 1 m (‰) -4.7E+01 -6.0E+01 2.6E+00 8.0E+00 3.1E-02 4 6 9.1E+00 6.3E+00
Average δD in Top 1.5 m (‰) -4.8E+01 -6.2E+01 3.0E+00 8.0E+00 1.7E-02 4 6 9.2E+00 6.0E+00
Maximum δD in Top 1 m (‰) -1.2E+01 -2.6E+01 2.7E+00 8.0E+00 2.6E-02 4 6 4.1E+00 9.7E+00
Maximum δD in Top 1.5 m (‰) -1.2E+01 -2.6E+01 2.7E+00 8.0E+00 2.6E-02 4 6 4.1E+00 9.7E+00
Average θg in Top 1 m (%) 2.8E+00 4.4E+00 -2.2E+00 8.0E+00 5.7E-02 4 6 1.1E+00 1.2E+00
Average θg in Top 1.5 m (%) 2.1E+00 3.7E+00 -2.6E+00 8.0E+00 3.4E-02 4 6 7.5E-01 1.1E+00
Maximum θg in Top 1 m (%) 8.5E+00 1.3E+01 -2.7E+00 8.0E+00 2.6E-02 4 6 9.9E-01 3.0E+00
Maximum θg in Top 1.5 m (%) 8.5E+00 1.3E+01 -2.7E+00 8.0E+00 2.6E-02 4 6 9.9E-01 3.0E+00
δ18O= Delta oxygen-18 value δD= Delta deuterium value θg = Gravimetric water content a Probability value used in the T-test approach to determine significance of differences b Samples from borehole 21B were not considered valid because of excessive water content due to its location near an asphalt pad. c Total flux represents the average chloride content from the entire borehole. For boreholes that displayed varying flux with depth (see Table 2), Flux 1 refers to the flux in the shallow region, Flux 2 refers to the flux in the intermediate region, and Flux 3 refers to the flux in the deepest region.
Bold indicates variables are significantly different.

Spatial Variation in Near-Surface Hydrologic Behavior at LANL TA-54, Material Disposal Area G 09-05
42
4.0 Discussion
This section discusses the findings as they relate to the three primary objectives of the study: (1) determining if the assumption of a uniform near-surface vadose-zone flux at MDA G is appropriate, (2) gauging the effect of asphalt paving at the site, and (3) assessing the impact of vegetative succession on the near-surface hydrology of the site. Section 4.1 compares pit covers to adjacent unexcavated areas, Section 4.2 compares paved to unpaved areas, and Section 4.3 compares the active portion of MDA G to Zone 4, the analog site for postclosure conditions.
4.1 Comparative Hydrology of Pit Covers and Adjacent Unexcavated Areas The T-test results shown in Table 3 reveal no significant differences between pit covers and adjacent areas for any of the 16 hydrologic variables examined. There appears to be as much variation in water content values, chloride profiles, and stable isotope data within the pit covers and adjacent unexcavated areas as there is between the two types of sites. The downward fluxes at the two location types are similar, as shown in the box-and-whisker plot provided in Figure 23.
Chloride-based fluxes suggest that both the pit covers and unexcavated areas have fluxes in the soil zone ranging from about 0.3 to 0.9 cm/yr (0.1 to 0.4 in./yr). Below the soil zone, fluxes are more variable, ranging from 0.02 to 0.9 cm/yr (7.9 × 10⁻³ to 0.4 in./yr). The similarity in the range of chloride-based fluxes suggests that, if a conservative upper flux condition is used in numerical models of subsurface flow and transport, a uniform value appears justified. This finding indicates that the 1997 performance assessment assumption of a uniform flux across pit covers and adjacent unexcavated areas appears to be reasonable, especially since the flux used in the 1997 modeling was conservative (i.e., greater than the highest chloride-based flux identified in this study).
One limitation of the data used to draw this conclusion is the small number of boreholes, which results in low statistical power. (For reasons explained in Section 4.2, the data from borehole 21B, which was located in an adjacent area, were not used in the statistical T-test analyses.) Even so, the mean values for many of the variables (e.g., fluxes and water contents) in Table 3 show little difference between the pit and unexcavated areas, indicating qualitative support for the statistical conclusion. Finally, although there are no significant hydrological differences between pits and adjacent areas, there appears to be at least an order of magnitude variability in near-surface fluxes across the mesa (Table 2), and it may be important to consider this variability in stochastic models of the site.
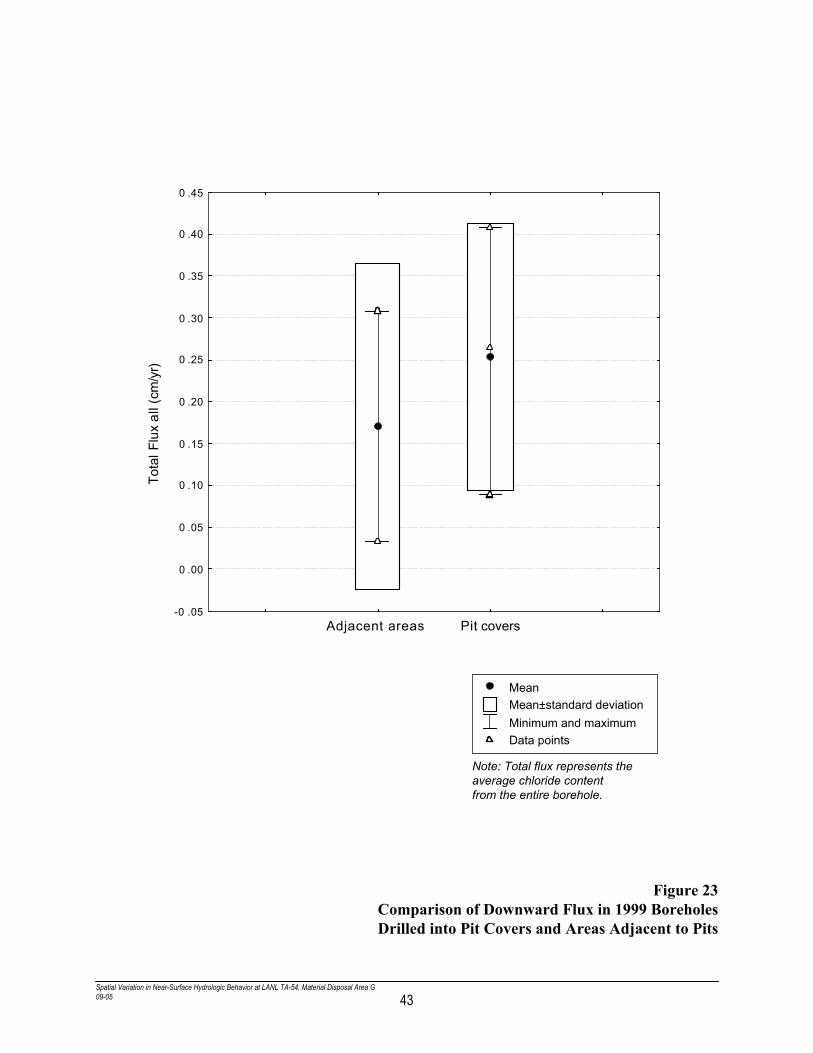
Spatial Variation in Near-Surface Hydrologic Behavior at LANL TA-54, Material Disposal Area G09-05 43
Figure 23Comparison of Downward Flux in 1999 BoreholesDrilled into Pit Covers and Areas Adjacent to Pits
Mean
Note: Total flux represents theaverage chloride contentfrom the entire borehole.
Mean±standard deviationMinimum and maximumData points
Adjacent areas Pit covers-0 .05
0 .00
0 .05
0 .10
0 .15
0 .20
0 .25
0 .30
0 .35
0 .40
0 .45
Fxul
a(ll
)ry/mc
Tota
l

Spatial Variation in Near-Surface Hydrologic Behavior at LANL TA-54, Material Disposal Area G 09-05
44
4.2 Comparative Hydrology of Paved and Unpaved Areas One of the more distinct differences between the boreholes at the paved and unpaved locations is the lack of well-developed isotopically heavy bulges in the top 0.1 m (0.33 ft) of the profiles (Figures 17 and 18). This result and the meteoric water line plot shown in Figure 19 indicate that evaporation of water is minimal under the asphalt. Because no plants grow through the asphalt, transpiration in paved areas is also minimal, except perhaps along the margins of the pads. The substantially lower level of evaporation and transpiration at the paved locations is an important hydrological difference that is reflected in the water content and flux data.
Comparative T-test results show significant differences between cores from paved and unpaved areas for 14 of the 28 hydrological variables examined (Table 4). The estimated flux and water content values of paved areas were higher than those observed at the unpaved locations and the isotopic values were lower. This indicates that water is accumulating beneath some paved areas. The differences in water content and stable isotope values between the paved and unpaved areas are shown in Figures 24 and 25. Over the long term, the lack of an evaporative (and transpirative) release of water can create an accumulation of water beneath the asphalt, which will increase percolation. This is demonstrated by the high apparent flux shown in Table 2 for borehole BT30, which was drilled in an asphalt-covered area.
The long-term impacts of the asphalt pads on site hydrology are not clear for two reasons. First, the downward extent of the elevated moisture conditions is unknown because of the limited sampling depths. Second, the period of time the asphalt pads will remain in place is unknown. If fluxes remain relatively low at depth and the pads are removed as currently planned, there may be no significant long-term effects from the pavement. However, the asphalt pads could cause increased fluxes through the waste zone, which may accelerate waste container degradation and rates of radionuclide release and transport.
Compared to other areas at the Laboratory where water accumulation has occurred under asphalt, the paved areas at MDA G are still relatively dry. Data from the former pad at MDA AB within TA-49 (Rofer et al., 1999) and from a TA-3 parking lot (Newman, 1998) show that saturated conditions can eventually develop under pavement. Thus, over time, differences between paved and unpaved areas at MDA G may increase. If the pavement becomes cracked or perforated, water accumulation will likely accelerate.

45
Figure 24Comparison of Average Water Content in
Boreholes Drilled in Paved and Unpaved Areas
Paved Unpaved0
2
4
6
8
10
12
14
16
Ave
rage
gra
vim
etric
wat
er c
onte
nt in
top
1 m
(%)
MeanMean±standard deviationMinimum and maximumData points
Spatial Variation in Near-Surface Hydrologic Behavior at LANL TA-54, Material Disposal Area G09-05

46
Figure 25Comparison of Maximum Delta Deuterium Values in
Boreholes Drilled in Paved and Unpaved Areas
Paved Unpaved-80
-60
-40
-20
0
20
40
60
80
xim
uma
MδD
in to
p 1
m (0
/00)
MeanMean±standard deviationMinimum and maximumData points
Spatial Variation in Near-Surface Hydrologic Behavior at LANL TA-54, Material Disposal Area G09-05

Spatial Variation in Near-Surface Hydrologic Behavior at LANL TA-54, Material Disposal Area G 09-05
47
The data from borehole 21B demonstrates an additional impact of paving. The area around this borehole received runoff from a paved area, which led to wetter near-surface conditions and a relatively high apparent flux (Table 2). The added runoff increases the uncertainty about the chloride-based flux estimate, but the relatively low chloride content and wetter conditions are also consistent with an elevated flux. Additional evidence for a relatively high flux in the vicinity of borehole 21B is provided by neutron probe surveys of deep borehole 1121, adjacent to borehole 21B. Data from deep borehole 1121 show increases in volumetric water content, over time, that occur as deep as 24 m (78 ft) (Newell, 1999). Thus, focused runoff from asphalt pavement near boreholes 21B and 1121 has had an apparently substantial impact on the movement of water into the subsurface. Since the boreholes were drilled, this problem has been remedied by directing asphalt runoff away from the area.
Some flux estimates presented in this section are more uncertain than others. The presence of pavement violates some assumptions associated with the chloride method (e.g., that flow is downward and piston-like). Thus, the estimated fluxes for boreholes drilled through asphalt covers and for borehole 21B (located adjacent to an asphalt area) must be viewed as highly uncertain. Leakage from a nearby building increases the uncertainty of the flux estimate for borehole G2. Although uncertain, these fluxes are presented in Table 2 for comparison to the fluxes from the unaffected boreholes. Prior to paving, each of these borehole locations probably had chloride contents similar to those observed at the borehole locations in unpaved areas. Therefore, any differences in chloride concentrations and resultant fluxes are likely to be related to changes that have occurred since the areas were paved.
4.3 Comparative Hydrology of Active Area and Zone 4 T-test results comparing 28 hydrological variables from the active (unpaved) disposal area and the Zone 4 site show significant differences for only 4 variables, 3 of which are downward flux estimates (Table 5). A box-and-whisker diagram comparing downward flux is shown in Figure 26. Flux differences may be related, in part, to the extreme drought conditions between the 1999 and 2002 sampling events. If these differences are not drought related, the transition from a grass- and forb-covered area to a mature piñon-juniper woodland may lead to drier near-surface conditions and a decrease in the downward flux of as much as an order of magnitude.
Differences between canopy and intercanopy conditions in the piñon-juniper analog area were also examined. T-tests on hydrologic variables obtained from canopy and intercanopy borehole samples indicate significant differences for 14 of 28 variables (Table 6). Most differences were related to nitrate concentrations or to δD values. The nitrate data suggest that there may be higher nitrate use under the canopy. These data also indicate that there may be variations in biogeochemical conditions at the canopy-intercanopy-scale that could affect the spatial distributions and transport of radionuclides that are translocated to the near-surface.

48
Figure 26Comparison of Downward Flux in Unpaved Parts of
Active Area and Zone 4
Active area Zone 4-0 .05
0 .00
0 .05
0 .10
0 .15
0 .20
0 .25
0 .30
0 .35
0 .40
0 .45
Fxul
a(ll
)ry/mc
MeanMean±standard deviationMinimum and maximumData points
Note: Total flux represents theaverage chloride contentfrom the entire borehole.
Spatial Variation in Near-Surface Hydrologic Behavior at LANL TA-54, Material Disposal Area G09-05
Tota
l

Spatial Variation in Near-Surface Hydrologic Behavior at LANL TA-54, Material Disposal Area G 09-05
49
The δD data shows generally heavier (more positive) values in the intercanopy areas (Figure 27). This suggests that more evaporation occurs in the intercanopy spaces; the δ18O data are consistent with this interpretation but show no significant difference. The lack of significance among δ18O data may be related to the dryness of many of the samples. Some samples were too dry to use for the δ18O analyses, thereby reducing the statistical power of the T-test; others yielded so little water that the accuracy of the δ18O data was relatively poor.
Interestingly, there are no significant differences in the chloride mass balance flux values for the canopy and intercanopy boreholes, despite the differences in evaporation at these locations. This suggests that increased transpiration under the tree canopies may balance out the lower evaporation values, resulting in total evapotranspiration values that are similar for the canopy and intercanopy spaces. However, this assumes that differences in interception and infiltration between the canopy and intercanopy areas also offset each other (i.e., higher interception in the intercanopy areas is offset by higher infiltration in the canopies). In terms of modeling post-institutional control conditions at MDA G, these results suggest that it may not be necessary to use different downward fluxes for canopy and intercanopy areas.

50
Figure 27Comparison of Maximum Delta Deuterium Values in Canopy
and Intercanopy Locations at Zone 4
Intercanopy Canopy-40
-35
-30
-25
-20
-15
-10
-5
xim
uma
MδD
in to
p 1
m (0
/00)
MeanMean±standard deviationMinimum and maximumData points
Spatial Variation in Near-Surface Hydrologic Behavior at LANL TA-54, Material Disposal Area G09-05

Spatial Variation in Near-Surface Hydrologic Behavior at LANL TA-54, Material Disposal Area G 09-05
51
5.0 References
Allison, G.B., W.J. Stone, and M.W. Hughes, 1985, “Recharge in Karst and Dune Elements of a Semi-Arid Landscape as Indicated by Natural Isotopes and Chloride,” Journal of Hydrology, Vol. 76, pp. 1–25.
Anderholm, S.K, 1994, Ground-Water Recharge Near Santa Fe, North-Central New Mexico, USGS Water Res. Invest. Rep. 94-4078.
Bowen, B.M., 1990, Los Alamos Climatology, Los Alamos National Laboratory Report LA-11735-MS.
DBS&A, 1994, Laboratory Analysis of Soil Hydraulic Properties of Protective Barrier Landfill Cover Demonstration Samples, Daniel B. Stephens & Associates, Inc. LANL\RPT494, April
DOE, 1999, Site-Wide Environmental Impact Statement for Continued Operation of the Los Alamos National Laboratory, U.S. Department of Energy, Albuquerque Operations Office,. DOE/EIS – 0238, Albuquerque, NM, January.
Gee, G.W., G.S. Campbell, and J.H. Campbell, 1992, “Rapid Measurement of Soil Water Potentials Using a Water Activity Meter,” Soil Science Society of America Journal, Vol. 56, pp. 1068–1070.
Hollis, D., E. Vold, R. Shuman, K. Birdsell, K. Bower, W. Hansen, D. Krier, P. Longmire, B. Newman, D. Rogers, E. Springer, 1997, Performance Assessment and Composite Analysis for the Los Alamos National Laboratory Disposal Area G, Los Alamos National Laboratory Report LA-UR-97-85, Report-54G-013, March.
Kendall, C., and T.B. Coplen, 1985, “Multisample Conversion of Water to Hydrogen by Zinc for Stable Isotope Determination,” Analytical Chemistry, Vol. 57, pp. 1437–1446.
Newell, D, 1999, Neutron Probe Water Content Data from Borehole 1121 at MDA G, Los Alamos National Laboratory unpublished report.
Newman, B.D., 1996, “Vadose Zone Water Movement at Area G, Los Alamos National Laboratory, TA-54: Interpretations Based on Chloride and Stable Isotope Profiles,” in D. Hollis et al., Performance Assessment and Composite Analysis for Los Alamos National Laboratory Material Disposal Area G.
Newman, B.D, 1998, Water Content Data Below a TA-3 Parking Lot, Los Alamos National Laboratory unpublished report.
Newman, B.D., A.R. Campbell, and B.P. Wilcox, 1997, “Tracer-Based Studies of Soil Water Movement in Semi-Arid Forests of New Mexico,” Journal of Hydrology, Vol. 196, pp. 251–270.

Spatial Variation in Near-Surface Hydrologic Behavior at LANL TA-54, Material Disposal Area G 09-05
52
Phillips, F.M, 1994, “Environmental Tracers for Water Movement in Desert Soils of the American Southwest,” Soil Science Society of America Journal, Vol. 58, p. 1994.
Rofer, C.K., B.A. Martinez, G.K. Bayhurst, and I.R. Triay, 1999, “Moisture Accumulation under Asphalt Cover at a Radioactive Waste-Burial Site,” Practice Periodical of Hazardous, Toxic, and Radioactive Waste Management, Vol. 3, pp. 10–16.
Rogers, D.B. and B.M. Gallaher, 1995, The Unsaturated Hydraulic Characteristics of the Bandelier Tuff, Los Alamos National Laboratory Report LA-12968-MS, September.
Scanlon, B.R, 2000, “Uncertainties in Estimating Water Fluxes and Residence Times Using Environmental Tracers in an Arid Unsaturated Zone,” Water Resources Research, Vol. 36, pp. 395–409.
Shurbaji, A.-R.M., F.M. Phillips, A.R. Campbell, and R.G. Knowlton, 1995, “Application of a Numerical Model for Simulating Groundwater Flow, Isotope Transport, and Heat Transfer in the Unsaturated Zone,” Journal of Hydrology, Vol. 171, pp. 143–163.
Socki, R.A., H.R. Karlsson, and E.K. Gibson, 1992, “Extraction Technique for the Determination of Oxygen-18 in Water Using Preevacuated Glass Vials,” Analytical Chemistry, Vol. 64, pp. 829–831.
StatSoft, 2005, “Statistica – Data Mining, Data Analysis, Quality Control, and Web Analytics Software,” http://www.statsoft.com (August 2005).
Vuataz, F.D., and F. Goff, 1986, “Isotope Chemistry of Thermal and Nonthermal Waters in the Valles Caldera, Jemez Mountains, Northern New Mexico,” Journal of Geophysical Research, Vol. 91, No. B2, pp. 1835–1853.

AAttttaacchhmmeenntt II HHyyddrrooggrraapphhiicc PPrrooppeerrttiieess ooff SShhaallllooww
BBoorreehhoolleess aatt MMaatteerriiaall DDiissppoossaall AArreeaa GG


Spatial Variation in Near-Surface Hydrologic Behavior at LANL TA-54, Material Disposal Area G Attachment I—Hydrographic Properties of Shallow Boreholes at MDA G 09-05
I-1
This attachment contains the hydrographic properties for the shallow boreholes drilled at Material Disposal Area G, Technical Area 54 during 1999 and 2002. A separate table is provided for each borehole; the locations of these boreholes are described in the main report.

--- = Not sampled NM = Not measured Spatial Variation in Near-Surface Hydrologic Behavior at LANL TA-54, Material Disposal Area G Attachment I–Hydrographic Properties of Shallow Boreholes at MDA G 09-05
I-2
Borehole Pit2
Sample Depth (cm)
Gravimetric Water Content
(%)
Chloride Content (mg/L)
Pressure Head (cm)
Isotope Sample
Depth (cm)
Delta Oxygen-18
(‰)
Delta Deuterium
(‰)
5 7.3E+00 2.0E+01 1.2E+05 1 4.4E+00 -5.5E+01
15 6.3E+00 1.9E+01 5.6E+03 3 8.7E+00 -2.6E+01
25 8.5E+00 2.5E+01 1.0E+00 5 7.8E+00 -3.6E+01
35 1.1E+01 4.4E+01 1.0E+00 7 4.5E+00 -3.5E+01
45 1.2E+01 1.3E+02 1.0E+00 9 6.1E+00 -4.5E+01
55 1.3E+01 1.8E+02 7.1E+02 15 -5.9E+00 -7.0E+01
65 1.3E+01 2.3E+02 1.0E+00 25 -7.5E+00 -6.4E+01
75 1.4E+01 2.2E+02 1.0E+00 35 -7.6E+00 -6.1E+01
85 9.8E+00 2.1E+02 7.1E+02 45 -7.0E+00 -6.0E+01
--- --- --- --- 55 -6.9E+00 -6.5E+01
--- --- --- --- 65 -7.9E+00 -7.0E+01
--- --- --- --- 75 -9.0E+00 -7.5E+01
--- --- --- --- 85 -8.6E+00 -8.4E+01
Borehole Pit17
Sample Depth (cm)
Gravimetric Water Content
(%)
Chloride Content (mg/L)
Pressure Head (cm)
Isotope Sample
Depth (cm)
Delta Oxygen-18
(‰)
Delta Deuterium
(‰)
5 3.0E+00 2.9E+01 3.7E+05 1 7.7E+00 -5.2E+01
15 6.9E+00 1.0E+01 4.6E+04 3 8.5E+00 -2.2E+01
25 7.0E+00 1.0E+01 2.1E+04 5 9.3E+00 -2.8E+01
35 4.0E+00 2.5E+01 1.8E+04 7 9.5E+00 -3.0E+01
45 5.9E+00 5.0E+00 2.8E+03 9 2.8E+00 -3.3E+01
55 6.2E+00 1.4E+01 4.2E+03 15 1.3E+00 -4.4E+01
65 5.9E+00 2.2E+01 2.1E+03 25 -3.8E+00 -6.1E+01
75 5.8E+00 5.5E+01 3.5E+03 35 -5.1E+00 -6.6E+01
85 6.1E+00 5.9E+01 1.4E+03 45 -6.8E+00 -6.8E+01
95 5.9E+00 3.4E+01 2.1E+03 55 -6.7E+00 -6.9E+01
--- --- --- --- 65 -6.0E+00 -5.7E+01
--- --- --- --- 75 -5.4E+00 -5.3E+01
--- --- --- --- 85 -5.2E+00 -5.1E+01
--- --- --- --- 95 -6.0E+00 -5.5E+01

--- = Not sampled NM = Not measured Spatial Variation in Near-Surface Hydrologic Behavior at LANL TA-54, Material Disposal Area G Attachment I–Hydrographic Properties of Shallow Boreholes at MDA G 09-05
I-3
Borehole Pit24
Sample Depth (cm)
Gravimetric Water Content
(%)
Chloride Content (mg/L)
Pressure Head (cm)
Isotope Sample
Depth (cm)
Delta Oxygen-18
(‰)
Delta Deuterium
(‰)
5 6.5E+00 2.0E+01 2.7E+05 1 6.1E+00 -4.5E+01
15 6.8E+00 5.9E+01 1.2E+05 3 1.1E+01 -3.4E+01
25 2.3E+00 1.3E+02 9.2E+03 5 1.3E+01 -1.9E+01
35 3.9E+00 2.8E+01 5.6E+03 7 1.0E+01 -2.9E+01
45 5.0E+00 2.2E+01 4.2E+03 9 5.1E+00 -3.2E+01
55 5.2E+00 3.0E+01 3.5E+03 15 -3.0E-01 -5.5E+01
65 5.9E+00 4.0E+01 3.5E+03 25 -1.5E+00 -5.5E+01
75 5.6E+00 3.2E+01 2.8E+03 35 -4.2E+00 -4.4E+01
85 5.3E+00 2.1E+01 2.8E+03 45 -4.3E+00 -5.6E+01
95 5.0E+00 2.4E+01 3.5E+03 55 -4.7E+00 -5.1E+01
--- --- --- --- 65 -4.8E+00 -5.6E+01
--- --- --- --- 75 -7.7E+00 -6.9E+01
--- --- --- --- 85 -6.3E+00 -5.9E+01
--- --- --- --- 95 -6.0E+00 -6.4E+01 Borehole 7B
Sample Depth (cm)
Gravimetric Water Content
(%)
Chloride Content (mg/L)
Pressure Head (cm)
Isotope Sample
Depth (cm)
Delta Oxygen-18
(‰)
Delta Deuterium
(‰)
5 4.7E+00 6.4E+01 5.1E+05 1 3.4E+00 -5.9E+01
15 7.6E+00 1.4E+01 2.5E+04 3 1.0E+01 -3.5E+01
25 9.9E+00 1.3E+01 4.2E+03 5 6.6E+00 -3.2E+01
35 7.3E+00 2.2E+01 2.1E+03 7 -7.0E-01 -5.3E+01
45 7.2E+00 2.4E+01 1.4E+03 9 -1.9E+00 -5.2E+01
55 7.1E+00 2.4E+01 1.4E+03 15 -3.5E+00 -5.8E+01
65 7.7E+00 4.0E+01 2.1E+03 25 -4.9E+00 -6.6E+01
75 9.6E+00 2.1E+01 2.1E+03 35 -7.8E+00 -8.0E+01
85 7.8E+00 2.9E+01 5.7E+03 45 -7.5E+00 -7.7E+01
105 6.6E+00 3.9E+01 2.1E+03 65 -6.9E+00 -6.0E+01
115 9.3E+00 4.1E+01 1.0E+00 85 -7.9E+00 -7.4E+01
125 9.9E+00 3.7E+01 2.1E+03 145 -9.8E+00 -8.4E+01
135 7.6E+00 5.3E+01 1.4E+03 --- --- ---
145 7.3E+00 5.2E+01 1.0E+00 --- --- ---
155 6.9E+00 4.7E+01 1.4E+03 --- --- ---

--- = Not sampled NM = Not measured Spatial Variation in Near-Surface Hydrologic Behavior at LANL TA-54, Material Disposal Area G Attachment I–Hydrographic Properties of Shallow Boreholes at MDA G 09-05
I-4
Borehole 17B
Sample Depth (cm)
Gravimetric Water Content
(%)
Chloride Content (mg/L)
Pressure Head (cm)
Isotope Sample
Depth (cm)
Delta Oxygen-18
(‰)
Delta Deuterium
(‰)
5 4.3E+00 5.6E+01 7.0E+02 1 NM -2.5E+01
15 8.4E+00 2.2E+01 1.0E+00 3 6.3E+00 -3.2E+01
25 1.0E+01 2.1E+01 1.0E+00 5 NM -3.5E+01
35 6.8E+00 3.5E+01 7.0E+02 7 -1.1E+00 -4.2E+01
45 1.1E+01 5.0E+01 1.0E+00 9 -2.5E+00 -4.4E+01
55 1.4E+01 5.5E+01 1.0E+00 15 -6.4E+00 -5.9E+01
65 1.1E+01 1.0E+02 2.1E+03 25 -8.9E+00 -6.8E+01
75 4.9E+00 2.1E+02 8.5E+03 35 -7.1E+00 -6.6E+01
85 4.1E+00 2.3E+02 9.2E+03 45 -9.0E+00 -7.4E+01
95 3.7E+00 2.2E+02 4.9E+03 65 -8.9E+00 -8.0E+01
105 3.2E+00 2.4E+02 4.9E+03 85 -7.6E+00 -7.2E+01
115 2.1E+00 5.7E+02 8.5E+03 145 -1.1E+01 -8.2E+01
125 2.1E+00 7.6E+02 1.2E+04 195 -1.2E+01 -9.9E+01
135 2.7E+00 1.2E+03 9.2E+03 --- --- ---
145 3.8E+00 8.1E+02 7.0E+03 --- --- ---
155 4.2E+00 6.8E+02 4.2E+03 --- --- ---
165 4.1E+00 4.4E+02 5.6E+03 --- --- ---
175 4.5E+00 2.8E+02 5.6E+03 --- --- ---
185 3.6E+00 2.8E+02 4.2E+03 --- --- ---
195 4.1E+00 3.1E+02 2.8E+03 --- --- ---

--- = Not sampled NM = Not measured Spatial Variation in Near-Surface Hydrologic Behavior at LANL TA-54, Material Disposal Area G Attachment I–Hydrographic Properties of Shallow Boreholes at MDA G 09-05
I-5
Borehole 21B
Sample Depth (cm)
Gravimetric Water Content
(%)
Chloride Content (mg/L)
Pressure Head (cm)
Isotope Sample
Depth (cm)
Delta Oxygen-18
(‰)
Delta Deuterium
(‰)
5 4.9E+00 3.4E+01 1.4E+03 1 1.2E+01 -4.7E+01
15 8.6E+00 1.4E+01 1.4E+03 3 5.6E+00 -3.0E+01
25 7.5E+00 1.2E+01 1.0E+00 5 -5.0E-01 -5.3E+01
35 6.9E+00 9.3E+00 1.4E+03 7 -4.7E+00 -6.2E+01
45 6.5E+00 1.4E+01 1.0E+00 9 -7.6E+00 -6.7E+01
55 1.9E+01 4.1E+00 1.0E+00 15 -7.2E+00 -5.2E+01
65 1.9E+01 4.3E+00 1.0E+00 25 -8.0E+00 -6.2E+01
75 2.0E+01 4.7E+00 1.0E+00 35 -8.4E+00 -6.9E+01
85 2.0E+01 6.3E+00 1.0E+00 45 -7.1E+00 -6.9E+01
95 1.8E+01 9.5E+00 1.0E+00 55 -9.4E+00 -7.3E+01
105 2.4E+01 4.4E+00 1.0E+00 65 -9.3E+00 -6.6E+01
115 1.8E+01 7.1E+00 1.0E+00 75 -8.7E+00 -6.8E+01
125 1.1E+01 1.8E+01 7.1E+02 85 -8.3E+00 -6.3E+01
135 1.2E+01 1.9E+01 1.0E+00 95 -1.1E+01 -9.2E+01
145 1.3E+01 1.6E+01 1.0E+00 105 -1.4E+01 -1.1E+02
155 1.3E+01 1.7E+01 1.0E+00 115 -1.4E+01 -1.1E+02
165 1.3E+01 1.2E+01 1.0E+00 125 -1.4E+01 -1.1E+02
175 1.3E+01 1.9E+01 1.0E+00 135 -1.4E+01 -1.1E+02
185 1.3E+01 2.3E+01 1.0E+00 145 -1.3E+01 -1.1E+02
195 1.3E+01 1.1E+01 1.0E+00 155 -1.4E+01 -1.0E+02
--- --- --- --- 165 -1.3E+01 -1.1E+02
--- --- --- --- 175 -1.3E+01 -1.0E+02
--- --- --- --- 185 -1.1E+01 -8.2E+01
--- --- --- --- 195 -9.2E+00 -7.3E+01

--- = Not sampled NM = Not measured Spatial Variation in Near-Surface Hydrologic Behavior at LANL TA-54, Material Disposal Area G Attachment I–Hydrographic Properties of Shallow Boreholes at MDA G 09-05
I-6
Borehole BT2
Sample Depth (cm)
Gravimetric Water Content
(%)
Chloride Content (mg/L)
Pressure Head (cm)
Isotope Sample
Depth (cm)
Delta Oxygen-18
(‰)
Delta Deuterium
(‰)
5 3.9E+00 1.6E+02 5.3E+04 1 -1.6E+00 -5.7E+01
15 6.6E+00 7.4E+01 7.0E+02 5 -2.1E+00 -6.7E+01
25 6.4E+00 6.5E+01 1.4E+03 9 -1.7E+00 -5.4E+01
35 6.0E+00 6.2E+01 7.0E+02 15 -3.4E+00 -6.3E+01
45 5.8E+00 8.0E+01 5.6E+03 25 -5.0E+00 -6.3E+01
55 5.8E+00 5.5E+01 7.0E+02 35 -5.1E+00 -6.3E+01
65 5.9E+00 5.9E+01 7.0E+02 45 -5.6E+00 -6.4E+01
75 5.1E+00 6.5E+01 7.0E+02 65 -6.1E+00
85 4.9E+00 6.4E+01 1.0E+00 85 -7.3E+00 -6.7E+01
95 4.9E+00 6.8E+01 2.1E+03 --- --- --- Borehole BT21
Sample Depth (cm)
Gravimetric Water Content
(%)
Chloride Content (mg/L)
Pressure Head (cm)
Isotope Sample
Depth (cm)
Delta Oxygen-18
(‰)
Delta Deuterium
(‰)
5 6.2E+00 4.7E+01 3.5E+03 1 -5.5E+00 -6.1E+01
15 1.0E+01 1.8E+01 1.0E+00 5 NM -7.8E+01
25 1.2E+01 1.5E+01 1.0E+00 9 -7.4E+00 -6.4E+01
35 1.2E+01 1.7E+01 1.0E+00 15 -7.7E+00 -6.9E+01
45 1.1E+01 1.0E+01 1.0E+00 25 -7.7E+00 -7.0E+01
55 1.2E+01 1.0E+01 1.0E+00 35 -8.0E+00 -7.1E+01
65 1.3E+01 1.0E+01 1.0E+00 45 -8.2E+00 -7.6E+01
75 1.3E+01 7.0E+00 1.0E+00 65 -8.8E+00 -7.3E+01
85 9.9E+00 1.1E+01 7.1E+02 85 -8.1E+00 -7.3E+01
95 8.9E+00 1.3E+01 1.0E+00 145 -7.4E+00 -5.7E+01
105 8.7E+00 2.2E+01 1.0E+00 195 -8.0E+00 -5.8E+01
115 8.3E+00 1.3E+01 1.0E+00 --- --- ---
125 6.1E+00 2.4E+01 7.0E+02 --- --- ---
135 1.1E+01 1.5E+01 1.0E+00 --- --- ---
145 6.9E+00 2.4E+01 1.0E+00 --- --- ---
155 8.6E+00 1.5E+01 1.0E+00 --- --- ---
165 7.3E+00 2.2E+01 1.0E+00 --- --- ---
175 6.0E+00 2.8E+01 1.0E+00 --- --- ---
185 6.4E+00 2.2E+01 1.0E+00 --- --- ---
195 7.3E+00 2.0E+01 NM --- --- ---

--- = Not sampled NM = Not measured Spatial Variation in Near-Surface Hydrologic Behavior at LANL TA-54, Material Disposal Area G Attachment I–Hydrographic Properties of Shallow Boreholes at MDA G 09-05
I-7
Borehole BT30
Sample Depth (cm)
Gravimetric Water Content
(%)
Chloride Content (mg/L)
Pressure Head (cm)
Isotope Sample
Depth (cm)
Delta Oxygen-18
(‰)
Delta Deuterium
(‰)
5 9.4E+00 2.8E+01 1.0E+00 1 -4.1E+00 -5.0E+01
15 1.3E+01 1.0E+01 1.0E+00 5 -4.4E+00 -4.7E+01
25 1.6E+01 9.0E+00 1.0E+00 9 -5.0E+00 -4.3E+01
35 1.4E+01 8.0E+00 1.0E+00 15 -5.1E+00 -4.0E+01
45 1.6E+01 1.0E+01 1.0E+00 25 -5.4E+00 -4.0E+01
55 1.8E+01 1.5E+01 1.0E+00 35 -6.4E+00 -4.1E+01
65 1.7E+01 1.6E+01 1.0E+00 45 -9.3E+00 -7.3E+01
75 1.6E+01 9.0E+00 1.0E+00 65 -1.1E+01 -9.3E+01
85 1.7E+01 1.3E+01 1.0E+00 85 -1.3E+01 -9.7E+01
95 1.7E+01 1.2E+01 1.0E+00 145 -7.3E+00 -6.5E+01
105 1.5E+01 9.0E+00 1.0E+00 195 -5.0E+00 -3.2E+01
115 1.6E+01 6.0E+00 1.0E+00 --- --- ---
125 1.8E+01 7.0E+00 1.0E+00 --- --- ---
135 1.5E+01 9.0E+00 1.0E+00 --- --- ---
145 1.1E+01 8.0E+00 1.0E+00 --- --- ---
155 8.9E+00 1.5E+01 1.0E+00 --- --- ---
165 9.5E+00 1.1E+01 1.0E+00 --- --- ---
175 9.0E+00 1.4E+01 1.0E+00 --- --- ---
185 1.0E+01 1.3E+01 1.0E+00 --- --- ---
195 1.2E+01 1.0E+01 1.0E+00 --- --- ---

--- = Not sampled NM = Not measured Spatial Variation in Near-Surface Hydrologic Behavior at LANL TA-54, Material Disposal Area G Attachment I–Hydrographic Properties of Shallow Boreholes at MDA G 09-05
I-8
Borehole AS1
Sample Depth (cm)
Gravimetric Water Content
(%)
Chloride Content (mg/L)
Pressure Head (cm)
Isotope Sample
Depth (cm)
Delta Oxygen-18
(‰)
Delta Deuterium
(‰)
5 6.2E+00 1.8E+01 NM 2.5 2.5E+00 -1.9E+01
17.5 1.0E+01 3.0E+01 NM 7.5 8.8E-01 -2.6E+01
27.5 1.1E+01 6.9E+00 NM 32.5 -2.3E+00 -3.6E+01
37.5 1.0E+01 1.4E+01 NM 62.5 -8.1E+00 -7.1E+01
47.5 1.0E+01 2.2E+01 NM 92.5 -6.5E+00 -5.5E+01
57.5 9.9E+00 2.2E+01 NM --- --- ---
67.5 8.7E+00 2.6E+01 NM --- --- ---
77.5 9.4E+00 4.5E+01 NM --- --- ---
87.5 8.9E+00 5.0E+01 NM --- --- ---
97.5 8.5E+00 6.0E+01 NM --- --- ---
107.5 9.0E+00 4.7E+01 NM --- --- ---
Borehole AS2
Sample Depth (cm)
Gravimetric Water Content
(%)
Chloride Content (mg/L)
Pressure Head (cm)
Isotope Sample
Depth (cm)
Delta Oxygen-18
(‰)
Delta Deuterium
(‰)
5 2.9E+00 1.5E+01 NM 2.5 1.0E+00 -4.7E+01
17.5 1.3E+01 1.1E+01 NM 7.5 4.8E+00 -4.9E+01
27.5 1.2E+01 2.4E+01 NM 32.5 -8.1E+00 -7.5E+01
37.5 1.1E+01 1.7E+01 NM 62.5 -7.9E+00 -7.5E+01
47.5 1.3E+01 1.8E+01 NM 92.5 -9.7E+00 -8.2E+01
57.5 1.2E+01 2.1E+01 NM --- --- ---
67.5 1.6E+01 1.9E+01 NM --- --- ---
77.5 1.2E+01 9.1E+00 NM --- --- ---
87.5 1.4E+01 8.8E+00 NM --- --- ---
97.5 1.3E+01 6.1E+00 NM --- --- ---
107.5 1.3E+01 1.2E+01 NM --- --- ---

--- = Not sampled NM = Not measured Spatial Variation in Near-Surface Hydrologic Behavior at LANL TA-54, Material Disposal Area G Attachment I–Hydrographic Properties of Shallow Boreholes at MDA G 09-05
I-9
Borehole AS3
Sample Depth (cm)
Gravimetric Water Content
(%)
Chloride Content (mg/L)
Pressure Head (cm)
Isotope Sample
Depth (cm)
Delta Oxygen-18
(‰)
Delta Deuterium
(‰)
5 5.3E+00 1.4E+02 NM 2.5 -6.0E-01 -5.1E+01
17.5 8.4E+00 1.4E+02 NM 7.5 1.3E+00 -5.2E+01
27.5 1.0E+01 8.7E+01 NM 32.5 -4.1E+00 -5.5E+01
37.5 9.1E+00 7.2E+01 NM 62.5 -3.0E+00 -5.6E+01
47.5 9.6E+00 5.9E+01 NM 92.5 -6.9E+00 -7.4E+01
57.5 9.8E+00 8.1E+01 NM 122.5 -7.4E+00 -7.5E+01
67.5 9.1E+00 6.2E+01 NM 152.5 -8.3E+00 -7.0E+01
77.5 8.6E+00 1.3E+02 NM --- --- ---
87.5 9.6E+00 1.4E+02 NM --- --- ---
97.5 1.0E+01 1.6E+02 NM --- --- ---
107.5 1.2E+01 1.9E+02 NM --- --- ---
117.5 1.1E+01 1.7E+02 NM --- --- ---
127.5 1.1E+01 1.6E+02 NM --- --- ---
137.5 1.0E+01 9.7E+01 NM --- --- ---
147.5 1.2E+01 2.6E+01 NM --- --- ---
157.5 9.6E+00 2.9E+01 NM --- --- ---
Borehole AS4
Sample Depth (cm)
Gravimetric Water Content
(%)
Chloride Content (mg/L)
Pressure Head (cm)
Isotope Sample
Depth (cm)
Delta Oxygen-18
(‰)
Delta Deuterium
(‰)
5 4.8E+00 9.1E+00 NM 2.5 -8.2E+00 -7.3E+01
17.5 1.3E+01 8.2E+00 NM 7.5 -5.1E+00 -7.0E+01
27.5 1.3E+01 8.5E+00 NM 32.5 -8.9E+00 -7.8E+01
37.5 1.4E+01 5.2E+00 NM 62.5 -8.2E+00 -6.2E+01
47.5 1.4E+01 5.6E+00 NM 92.5 -3.8E+00 -3.7E+01
57.5 1.5E+01 1.1E+01 NM 122.5 -4.7E+00 -4.8E+01
67.5 1.6E+01 1.5E+01 NM --- --- ---
77.5 1.5E+01 7.2E+00 NM --- --- ---
87.5 1.4E+01 1.0E+01 NM --- --- ---
97.5 1.2E+01 4.0E+01 NM --- --- ---
107.5 1.2E+01 1.0E+02 NM --- --- ---
117.5 1.3E+01 9.5E+01 NM --- --- ---

--- = Not sampled NM = Not measured Spatial Variation in Near-Surface Hydrologic Behavior at LANL TA-54, Material Disposal Area G Attachment I–Hydrographic Properties of Shallow Boreholes at MDA G 09-05
I-10
Borehole G1
Sample Depth (cm)
Gravimetric Water Content
(%)
Chloride Content (mg/L)
Pressure Head (cm)
Isotope Sample
Depth (cm)
Delta Oxygen-18
(‰)
Delta Deuterium
(‰)
5 3.0E+00 6.5E+02 NM 2.5 1.1E+01 -1.4E+01
17.5 2.1E+00 4.6E+02 NM 7.5 1.2E+01 -2.7E+01
27.5 1.8E+00 3.9E+02 NM 32.5 -5.5E+00 -7.5E+01
37.5 1.6E+00 5.5E+03 NM 62.5 -3.5E+00 -6.8E+01
47.5 2.0E+00 8.0E+02 NM 92.5 -5.8E+00 -7.1E+01
57.5 2.0E+00 7.1E+02 NM 122.5 -7.0E+00 -8.1E+01
67.5 2.7E+00 4.4E+02 NM --- --- ---
77.5 2.1E+00 4.5E+02 NM --- --- ---
87.5 3.2E+00 4.2E+02 NM --- --- ---
97.5 2.6E+00 3.3E+02 NM --- --- ---
107.5 2.9E+00 3.7E+02 NM --- --- ---
117.5 2.5E+00 4.1E+02 NM --- --- ---
127.5 2.3E+00 3.9E+02 NM --- --- ---
137.5 2.1E+00 4.3E+02 NM --- --- ---
147.5 2.4E+00 4.0E+02 NM --- --- --- Borehole G2
Sample Depth (cm)
Gravimetric Water Content
(%)
Chloride Content (mg/L)
Pressure Head (cm)
Isotope Sample
Depth (cm)
Delta Oxygen-18
(‰)
Delta Deuterium
(‰)
5 1.2E+00 5.2E+02 NM 2.5 1.9E+01 -3.6E+01
17.5 1.7E+01 8.4E+02 NM 7.5 2.1E+01 -8.7E+00
27.5 1.9E+01 3.8E+03 NM 32.5 -4.2E+00 -6.5E+01
37.5 3.4E+00 3.5E+03 NM 62.5 -7.2E+00 -7.4E+01
47.5 1.1E+00 3.7E+03 NM 92.5 -9.4E+00 -7.9E+01
57.5 4.7E+00 1.0E+03 NM --- --- ---
67.5 7.6E+00 8.3E+02 NM --- --- ---
77.5 4.1E+00 4.5E+02 NM --- --- ---
87.5 3.7E+00 1.8E+02 NM --- --- ---
97.5 6.9E+00 5.7E+01 NM --- --- ---
107.5 5.4E+00 4.6E+01 NM --- --- ---

--- = Not sampled NM = Not measured Spatial Variation in Near-Surface Hydrologic Behavior at LANL TA-54, Material Disposal Area G Attachment I–Hydrographic Properties of Shallow Boreholes at MDA G 09-05
I-11
Borehole G3
Sample Depth (cm)
Gravimetric Water Content
(%)
Chloride Content (mg/L)
Pressure Head (cm)
Isotope Sample
Depth (cm)
Delta Oxygen-18
(‰)
Delta Deuterium
(‰)
5 3.3E+00 2.3E+02 NM 2.5 1.4E+01 -2.6E+01
17.5 1.1E-01 7.0E+03 NM 7.5 2.3E+01 -1.5E+01
27.5 3.3E+00 2.3E+02 NM 32.5 1.1E+01 -1.1E+01
37.5 1.1E-01 7.0E+03 NM 62.5 -4.9E-01 -4.9E+01
47.5 6.5E-01 5.8E+02 NM 92.5 -5.2E+00 -6.7E+01
57.5 1.3E+00 3.3E+02 NM 122.5 -8.8E-01 -5.8E+01
67.5 2.0E+00 2.0E+02 NM 142.5 -4.1E+00 -7.1E+01
77.5 1.9E+00 2.3E+02 NM
87.5 2.0E+00 2.3E+02 NM --- --- ---
97.5 1.9E+00 2.7E+02 NM --- --- ---
107.5 2.2E+00 1.9E+02 NM --- --- ---
117.5 2.2E+00 9.5E+01 NM --- --- ---
127.5 2.2E+00 9.3E+01 NM --- --- ---
137.5 2.1E+00 1.2E+02 NM --- --- ---

--- = Not sampled NM = Not measured Spatial Variation in Near-Surface Hydrologic Behavior at LANL TA-54, Material Disposal Area G Attachment I–Hydrographic Properties of Shallow Boreholes at MDA G 09-05
I-12
Borehole P1
Sample Depth (cm)
Gravimetric Water Content
(%)
Chloride Content (mg/L)
Pressure Head (cm)
Isotope Sample
Depth (cm)
Delta Oxygen-18
(‰)
Delta Deuterium
(‰)
5 2.9E+00 1.8E+02 NM 2.5 8.9E+00 -3.2E+01
17.5 3.9E+00 1.1E+02 NM 7.5 7.3E+00 -3.9E+01
27.5 7.5E+00 1.9E+02 NM 32.5 -4.4E+00 -7.3E+01
37.5 1.1E+01 1.8E+02 NM 62.5 -5.6E+00 -7.4E+01
47.5 8.6E+00 2.9E+02 NM 92.5 -5.7E+00 -7.4E+01
57.5 7.2E+00 4.2E+02 NM 122.5 -5.4E+00 -7.8E+01
67.5 5.8E+00 5.2E+02 NM 142.5 -5.4E+00 -7.6E+01
77.5 4.7E+00 6.8E+02 NM 172.5 -4.6E+00 -6.6E+01
87.5 4.3E+00 7.2E+02 NM 202.5 -4.7E+00 -7.0E+01
97.5 4.4E+00 7.9E+02 NM --- --- ---
107.5 4.4E+00 8.0E+02 NM --- --- ---
117.5 4.8E+00 8.7E+02 NM --- --- ---
127.5 6.7E+00 8.5E+02 NM --- --- ---
137.5 4.1E+00 2.1E+03 NM --- --- ---
147.5 4.2E+00 1.1E+03 NM --- --- ---
157.5 1.6E+00 1.6E+03 NM --- --- ---
167.5 9.1E-01 2.0E+03 NM --- --- ---
177.5 5.8E-01 2.4E+03 NM --- --- ---
187.5 4.2E-01 3.1E+03 NM --- --- ---
197.5 1.7E+00 1.9E+03 NM --- --- ---
207.5 7.0E-01 2.0E+03 NM --- --- ---
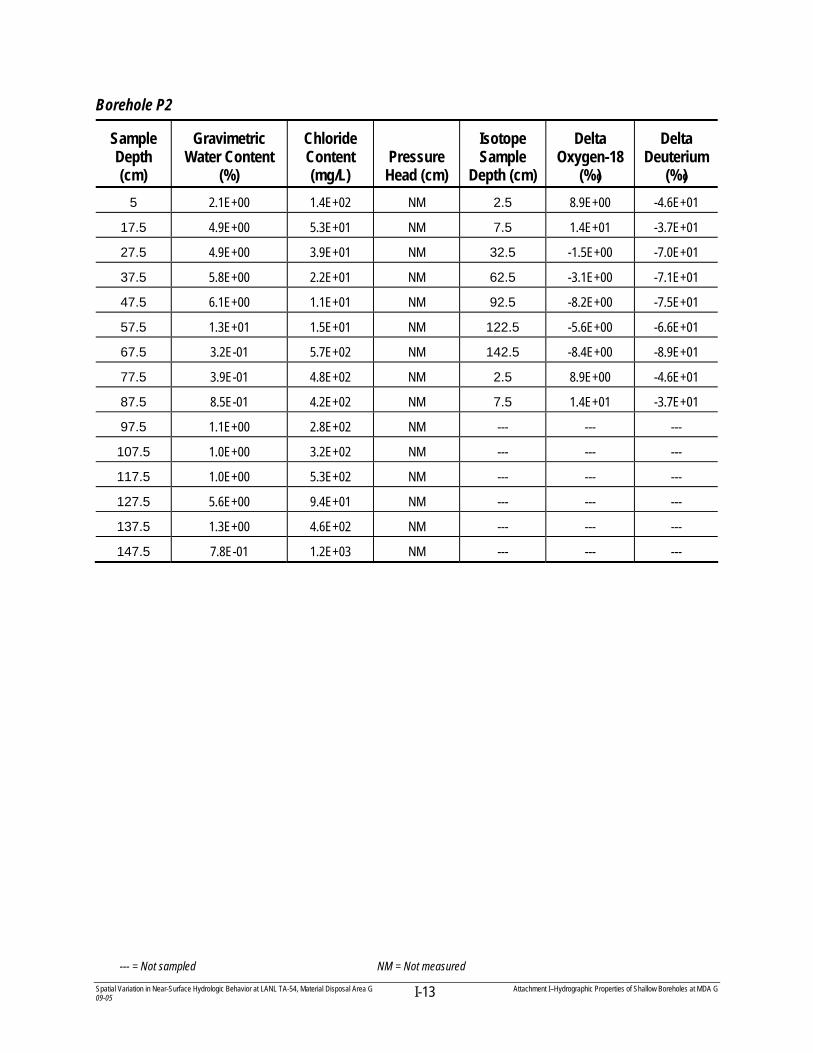
--- = Not sampled NM = Not measured Spatial Variation in Near-Surface Hydrologic Behavior at LANL TA-54, Material Disposal Area G Attachment I–Hydrographic Properties of Shallow Boreholes at MDA G 09-05
I-13
Borehole P2
Sample Depth (cm)
Gravimetric Water Content
(%)
Chloride Content (mg/L)
Pressure Head (cm)
Isotope Sample
Depth (cm)
Delta Oxygen-18
(‰)
Delta Deuterium
(‰)
5 2.1E+00 1.4E+02 NM 2.5 8.9E+00 -4.6E+01
17.5 4.9E+00 5.3E+01 NM 7.5 1.4E+01 -3.7E+01
27.5 4.9E+00 3.9E+01 NM 32.5 -1.5E+00 -7.0E+01
37.5 5.8E+00 2.2E+01 NM 62.5 -3.1E+00 -7.1E+01
47.5 6.1E+00 1.1E+01 NM 92.5 -8.2E+00 -7.5E+01
57.5 1.3E+01 1.5E+01 NM 122.5 -5.6E+00 -6.6E+01
67.5 3.2E-01 5.7E+02 NM 142.5 -8.4E+00 -8.9E+01
77.5 3.9E-01 4.8E+02 NM 2.5 8.9E+00 -4.6E+01
87.5 8.5E-01 4.2E+02 NM 7.5 1.4E+01 -3.7E+01
97.5 1.1E+00 2.8E+02 NM --- --- ---
107.5 1.0E+00 3.2E+02 NM --- --- ---
117.5 1.0E+00 5.3E+02 NM --- --- ---
127.5 5.6E+00 9.4E+01 NM --- --- ---
137.5 1.3E+00 4.6E+02 NM --- --- ---
147.5 7.8E-01 1.2E+03 NM --- --- ---
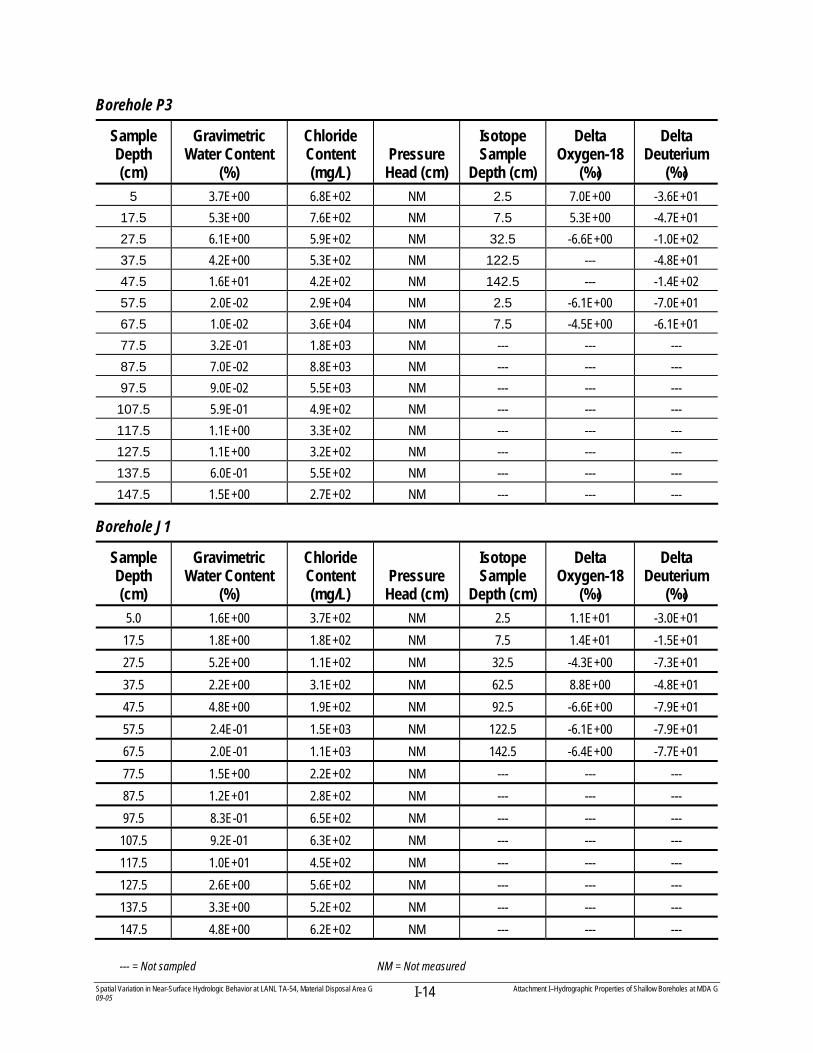
--- = Not sampled NM = Not measured Spatial Variation in Near-Surface Hydrologic Behavior at LANL TA-54, Material Disposal Area G Attachment I–Hydrographic Properties of Shallow Boreholes at MDA G 09-05
I-14
Borehole P3
Sample Depth (cm)
Gravimetric Water Content
(%)
Chloride Content (mg/L)
Pressure Head (cm)
Isotope Sample
Depth (cm)
Delta Oxygen-18
(‰)
Delta Deuterium
(‰)
5 3.7E+00 6.8E+02 NM 2.5 7.0E+00 -3.6E+01
17.5 5.3E+00 7.6E+02 NM 7.5 5.3E+00 -4.7E+01
27.5 6.1E+00 5.9E+02 NM 32.5 -6.6E+00 -1.0E+02
37.5 4.2E+00 5.3E+02 NM 122.5 --- -4.8E+01
47.5 1.6E+01 4.2E+02 NM 142.5 --- -1.4E+02
57.5 2.0E-02 2.9E+04 NM 2.5 -6.1E+00 -7.0E+01
67.5 1.0E-02 3.6E+04 NM 7.5 -4.5E+00 -6.1E+01
77.5 3.2E-01 1.8E+03 NM --- --- ---
87.5 7.0E-02 8.8E+03 NM --- --- ---
97.5 9.0E-02 5.5E+03 NM --- --- ---
107.5 5.9E-01 4.9E+02 NM --- --- ---
117.5 1.1E+00 3.3E+02 NM --- --- ---
127.5 1.1E+00 3.2E+02 NM --- --- ---
137.5 6.0E-01 5.5E+02 NM --- --- ---
147.5 1.5E+00 2.7E+02 NM --- --- ---
Borehole J1
Sample Depth (cm)
Gravimetric Water Content
(%)
Chloride Content (mg/L)
Pressure Head (cm)
Isotope Sample
Depth (cm)
Delta Oxygen-18
(‰)
Delta Deuterium
(‰)
5.0 1.6E+00 3.7E+02 NM 2.5 1.1E+01 -3.0E+01
17.5 1.8E+00 1.8E+02 NM 7.5 1.4E+01 -1.5E+01
27.5 5.2E+00 1.1E+02 NM 32.5 -4.3E+00 -7.3E+01
37.5 2.2E+00 3.1E+02 NM 62.5 8.8E+00 -4.8E+01
47.5 4.8E+00 1.9E+02 NM 92.5 -6.6E+00 -7.9E+01
57.5 2.4E-01 1.5E+03 NM 122.5 -6.1E+00 -7.9E+01
67.5 2.0E-01 1.1E+03 NM 142.5 -6.4E+00 -7.7E+01
77.5 1.5E+00 2.2E+02 NM --- --- ---
87.5 1.2E+01 2.8E+02 NM --- --- ---
97.5 8.3E-01 6.5E+02 NM --- --- ---
107.5 9.2E-01 6.3E+02 NM --- --- ---
117.5 1.0E+01 4.5E+02 NM --- --- ---
127.5 2.6E+00 5.6E+02 NM --- --- ---
137.5 3.3E+00 5.2E+02 NM --- --- ---
147.5 4.8E+00 6.2E+02 NM --- --- ---

--- = Not sampled NM = Not measured Spatial Variation in Near-Surface Hydrologic Behavior at LANL TA-54, Material Disposal Area G Attachment I–Hydrographic Properties of Shallow Boreholes at MDA G 09-05
I-15
Borehole J2
Sample Depth (cm)
Gravimetric Water Content
(%)
Chloride Content (mg/L)
Pressure Head (cm)
Isotope Sample
Depth (cm)
Delta Oxygen-18
(‰)
Delta Deuterium
(‰)
2.5 2.3E+00 1.6E+02 NM 2.5 1.4E+01 -1.8E+01
7.5 3.1E+00 3.6E+01 NM 7.5 1.4E+01 -1.7E+01
32.5 3.1E+00 3.0E+01 NM 32.5 -2.6E+00 -6.9E+01
62.5 3.6E+00 2.0E+01 NM 62.5 -4.3E+00 -7.7E+01
92.5 6.0E+00 1.4E+01 NM 92.5 -6.7E+00 -8.6E+01
122.5 5.9E+00 1.4E+02 NM 122.5 -5.4E+00 -6.8E+01
142.5 6.4E+00 2.6E+02 NM 142.5 -3.3E+00 -5.9E+01
2.5 4.1E+00 3.4E+02 NM --- --- ---
7.5 1.6E+01 5.0E+02 NM --- --- ---
32.5 8.2E+00 7.5E+02 NM --- --- ---
62.5 4.4E-01 2.1E+03 NM --- --- ---
92.5 5.3E-01 8.9E+02 NM --- --- ---
122.5 7.4E-01 7.1E+02 NM --- --- ---
142.5 6.4E-01 7.9E+02 NM --- --- ---
2.5 3.3E-01 1.8E+03 NM --- --- ---
7.5 6.3E-01 5.0E+02 NM --- --- ---

--- = Not sampled NM = Not measured Spatial Variation in Near-Surface Hydrologic Behavior at LANL TA-54, Material Disposal Area G Attachment I–Hydrographic Properties of Shallow Boreholes at MDA G 09-05
I-16
Borehole J3
Sample Depth (cm)
Gravimetric Water Content
(%)
Chloride Content (mg/L)
Pressure Head (cm)
Isotope Sample
Depth (cm)
Delta Oxygen-18
(‰)
Delta Deuterium
(‰)
5 2.1E+00 2.0E+02 NM 2.5 1.3E+01 -3.3E+01
17.5 8.0E+00 9.1E+01 NM 7.5 1.2E+01 -2.1E+01
27.5 6.1E+00 1.7E+02 NM 32.5 4.5E-01 -6.7E+01
37.5 4.9E+00 3.2E+02 NM 62.5 -4.1E+00 -8.6E+01
47.5 2.1E+00 3.9E+02 NM 92.5 -3.3E+00 -8.6E+01
57.5 1.9E+00 5.8E+02 NM 122.5 --- -5.8E+01
67.5 8.8E+00 4.7E+02 NM --- ---
77.5 2.4E+00 3.9E+02 NM --- ---
87.5 4.7E+00 1.9E+02 NM --- ---
97.5 4.7E-01 1.3E+03 NM --- --- ---
107.5 7.7E-01 9.2E+02 NM --- --- ---
117.5 5.1E-01 1.3E+03 NM --- --- ---
127.5 3.8E-01 2.2E+03 NM --- --- ---
137.5 4.2E-01 2.3E+03 NM --- --- ---
147.5 6.0E-01 2.3E+03 NM --- --- ---
Borehole IC1
Sample Depth (cm)
Gravimetric Water Content
(%)
Chloride Content (mg/L)
Pressure Head (cm)
Isotope Sample
Depth (cm)
Delta Oxygen-18
(‰)
Delta Deuterium
(‰) 2.5 7.9E+00 1.8E+01 NM 2.5 9.9E+00 -1.6E+01
7.5 3.1E+00 4.0E+01 NM 7.5 9.1E+00 -3.0E+01
17.5 2.6E+00 3.7E+01 NM 32.5 -3.0E+00 -6.6E+01
27.5 8.7E+00 4.2E+01 NM 62.5 2.4E+01 -3.9E+01
37.5 7.0E+00 5.4E+01 NM 92.5 -3.1E+00 -6.3E+01
47.5 4.5E+00 7.0E+01 NM 122.5 -3.9E+00 -6.1E+01
57.5 6.3E+00 1.5E+02 NM 142.5 -1.6E+00 -6.2E+01
67.5 9.0E-02 2.8E+03 NM --- --- ---
77.5 5.0E-02 4.4E+03 NM --- --- ---
87.5 2.3E-01 9.2E+02 NM --- --- ---
97.5 2.2E-01 1.1E+03 NM --- --- ---
107.5 7.6E-01 3.2E+02 NM --- --- ---
117.5 1.0E+00 2.2E+02 NM --- --- ---
127.5 5.0E-01 4.3E+02 NM --- --- ---
137.5 8.7E-01 2.8E+02 NM --- --- ---
147.5 7.9E-01 5.1E+02 NM --- --- ---

--- = Not sampled NM = Not measured Spatial Variation in Near-Surface Hydrologic Behavior at LANL TA-54, Material Disposal Area G Attachment I–Hydrographic Properties of Shallow Boreholes at MDA G 09-05
I-17
Borehole IC2
Sample Depth (cm)
Gravimetric Water Content
(%)
Chloride Content (mg/L)
Pressure Head (cm)
Isotope Sample
Depth (cm)
Delta Oxygen-18
(‰)
Delta Deuterium
(‰)
5 2.8E+00 2.5E+01 NM 2.5 2.4E+01 -6.7E+00
17.5 2.4E+00 1.3E+01 NM 7.5 1.3E+01 -1.7E+01
27.5 7.1E+00 1.8E+01 NM 32.5 1.7E+00 -5.6E+01
37.5 3.6E+00 5.9E+01 NM 62.5 --- -3.8E+01
47.5 1.5E+00 2.1E+02 NM 92.5 --- -4.5E+01
57.5 8.9E-01 5.4E+02 NM 122.5 --- -4.9E+01
67.5 1.4E-01 3.5E+03 NM --- --- ---
77.5 5.0E-02 3.1E+03 NM --- --- ---
87.5 2.4E-01 1.9E+03 NM --- --- ---
97.5 2.7E-01 1.6E+03 NM --- --- ---
107.5 2.9E-01 1.4E+03 NM --- --- ---
117.5 3.6E-01 1.1E+03 NM --- --- ---
127.5 5.0E-01 6.3E+02 NM --- --- ---
137.5 6.4E-01 4.0E+02 NM --- --- ---
147.5 5.5E-01 4.5E+02 NM --- --- ---
Borehole IC3
Sample Depth (cm)
Gravimetric Water Content
(%)
Chloride Content (mg/L)
Pressure Head (cm)
Isotope Sample
Depth (cm)
Delta Oxygen-18
(‰)
Delta Deuterium
(‰)
5 3.9E+00 9.1E+01 NM 2.5 1.5E+01 -2.0E+01
17.5 2.2E+00 8.4E+01 NM 7.5 1.5E+01 -1.5E+01
27.5 9.4E+00 1.0E+02 NM 32.5 -1.7E+00 -6.0E+01
37.5 3.2E+00 1.9E+02 NM 62.5 -6.7E+00 -1.1E+02
47.5 2.7E+00 1.7E+02 NM 92.5 -1.7E+00 -5.5E+01
57.5 6.9E+00 2.4E+02 NM 122.5 -6.4E+00 -6.7E+01
67.5 3.1E+00 2.9E+02 NM 142.5 -6.4E+00 -7.1E+01
77.5 6.0E-02 4.0E+03 NM --- --- ---
87.5 6.0E-02 4.4E+03 NM --- --- ---
97.5 6.7E-01 4.3E+02 NM --- --- ---
107.5 6.7E-01 4.7E+02 NM --- --- ---
117.5 1.9E+00 1.7E+02 NM --- --- ---
127.5 1.2E+00 3.3E+02 NM --- --- ---
137.5 1.3E+00 2.9E+02 NM --- --- ---
147.5 1.4E+00 3.9E+02 NM --- --- ---

--- = Not sampled NM = Not measured Spatial Variation in Near-Surface Hydrologic Behavior at LANL TA-54, Material Disposal Area G Attachment I–Hydrographic Properties of Shallow Boreholes at MDA G 09-05
I-18
Borehole IC4
Sample Depth (cm)
Gravimetric Water Content
(%)
Chloride Content (mg/L)
Pressure Head (cm)
Isotope Sample
Depth (cm)
Delta Oxygen-18
(‰)
Delta Deuterium
(‰)
5 3.3E+00 9.4E+01 NM 2.5 1.5E+01 -1.9E+01
17.5 3.2E+00 3.0E+01 NM 7.5 1.6E+01 -1.2E+01
27.5 8.6E+00 2.4E+01 NM 32.5 1.4E+00 -5.6E+01
37.5 1.3E+00 2.8E+02 NM 62.5 4.8E-01 -5.9E+01
47.5 1.5E-01 7.7E+02 NM 92.5 -4.0E+00 -7.5E+01
57.5 1.5E-01 1.1E+03 NM 122.5 -4.7E+00 -6.6E+01
67.5 2.3E-01 7.2E+02 NM 142.5 -4.7E+00 -6.0E+01
77.5 7.4E-01 2.1E+02 NM --- --- ---
87.5 5.4E-01 3.2E+02 NM --- --- ---
97.5 2.8E-01 6.8E+02 NM --- --- ---
107.5 8.6E-01 2.2E+02 NM --- --- ---
117.5 1.1E+00 1.3E+02 NM --- --- ---
127.5 3.5E-01 5.4E+02 NM --- --- ---
137.5 8.0E-01 2.4E+02 NM --- --- ---
147.5 1.4E+00 1.7E+02 NM --- --- ---