Embed Size (px)
Citation preview
1
SPATIAL MODELS FOR THE DEFINITION OF LANDSLIDE SUSCEPTIBILITY AND
LANDSLIDE HAZARD
FORM-OSE POST-GRADUATE TRAINING SCHOOLLiving with hydro-geomorphological risks: from theory to practice14-19 September 2004, Strasbourg - France
Centre of Geographical StudiesUniversity of Lisbon
J.L. Zêzere
1. BASIC CONCEPTS
Landslide Hazard:“the probability of occurrence of a potentially
damaging phenomenon [landslide] within a given area and in a given period of time.”
(Varnes et al., 1984)
Rt = (E) (Rs) = (E) (H x V)
H – Hazard
V – Vulnerability (degree of loss; 0-1)
E – Vulnerable Elements (Value of...)
Rs – Specific Risk (H x V)
Rt – Total Risk
CONCEPTUAL MODEL OF LANDSLIDE RISK
Dangerous PhenomenaRockfallToppleSlideSpreadFlow….
Vulnerable ElementsPopulationBuildingsInfrastructuresEconomic activitiesCultural and environmental values….
Landslide hazard Vulnerability
LANDSLIDE RISK
adapted from Panizza (1990 )
Landslide Hazard = probability of occurrence of a potentially damaging phenomenon [landslide] within a given area and in a given period of time.
1) SPATIAL LOCATION (“WHERE”?)
2) TIME RECURRENCE (“WHEN”?)
3) INTENSITY / MAGNITUDE (“HOW POWERFUL”?)
CRUCIAL ELEMENTS IN THE PREDICTION OF FUTURE LANDSLIDE BEHAVIOUR:
TYPICAL METHODS USED TO DEFINE LANDSLIDE PRONE ZONES AT A REGIONAL SCALE:
1)DIRECT APPROACH (Geomorphological)
2) INDIRECT APPROACHES (Quantitative and Semiquantitative)
Knowledge-based (index)Statistical (data-driven)Deterministic
Applied overpredefinedterrain units

2
BASIC ASSUMPTION OF BOTH DIRECT AND INDIRECT APPROACHES:
FUTURE LANDSLIDES ARE MORE LIKELY TO OCCUR UNDER THE SAME GEOLOGICAL AND GEOMORPHOLOGICAL CONDITIONS THAT LED TO PAST SLOPE INSTABILITY.
“PAST AND PRESENT ARE KEYS TO THE FUTURE”
KEYS FOR PREDICTION OF FUTURE LANDSLIDES:
MAPPING PAST AND RECENT SLOPE MOVEMENTS
IDENTIFICATION AND MAPPING OF THECONDITIONING OR PREPARATORY FACTORS OF SLOPE INSTABILITY
ASSESSMENT OF LANDSLIDE SUSCEPTIBILITY
LANDSLIDE SUSCEPTIBILITY
Expression of the likelihood that a landslide will occur in an area based on the local terrain conditions, not including the return period or the probability of occurrence of the instability processes.
Most regional landslide ‘hazard’ assessments (both direct and indirect) provide a ranking of terrain units only in terms of susceptibility (“spatial probability”), not including the temporal component of the hazard.
SUSCEPTIBILITY VS HAZARD
Gabbione, PaviaItalyRossetti (1997)
DIRECT APPROACH
Direct Landslide Susceptibility Assessment (Calhandriz Area)

3
Indirect Landslide Susceptibility Assessment (Information Value Method)
ITC, ILWIS Manual
By definition, a hazard map should include an evaluation of the probability of occurrence of new landslides, thus implying the consideration of a time dimension.
FROM LANDSLIDE SUSCEPTIBILITY TO LANDSLIDE HAZARD
In the case of rainfall induced landslides the statistical analysis of rainfall data may enable both the definition of the triggering threshold and calculation of the recurrence interval.
UNCERTAINTIES AND DRAWBACKS
1) DATA LIMITATIONS
UNCERTAINTIES IN LANDSLIDE IDENTIFICATIONAND MAPPING
QUALITY, QUANTITY AND RELEVANCE OF THEAVAILABLE INFORMATION:
The discontinuous nature in space and time of slopefailuresThe lack of a complete historical data concerningthe frequency of landslidesThe difficulty of identifying the causes, the triggeringfactors and cause-effect relationship
2) MODEL SHORTCOMINGS
EFFECTIVENESS AND RELIABILITY OF THE AVAILABLE MODELS
DIFFICULTY IN EXTRAPOLATION OF LOCAL DATATO LARGER AREAS
4
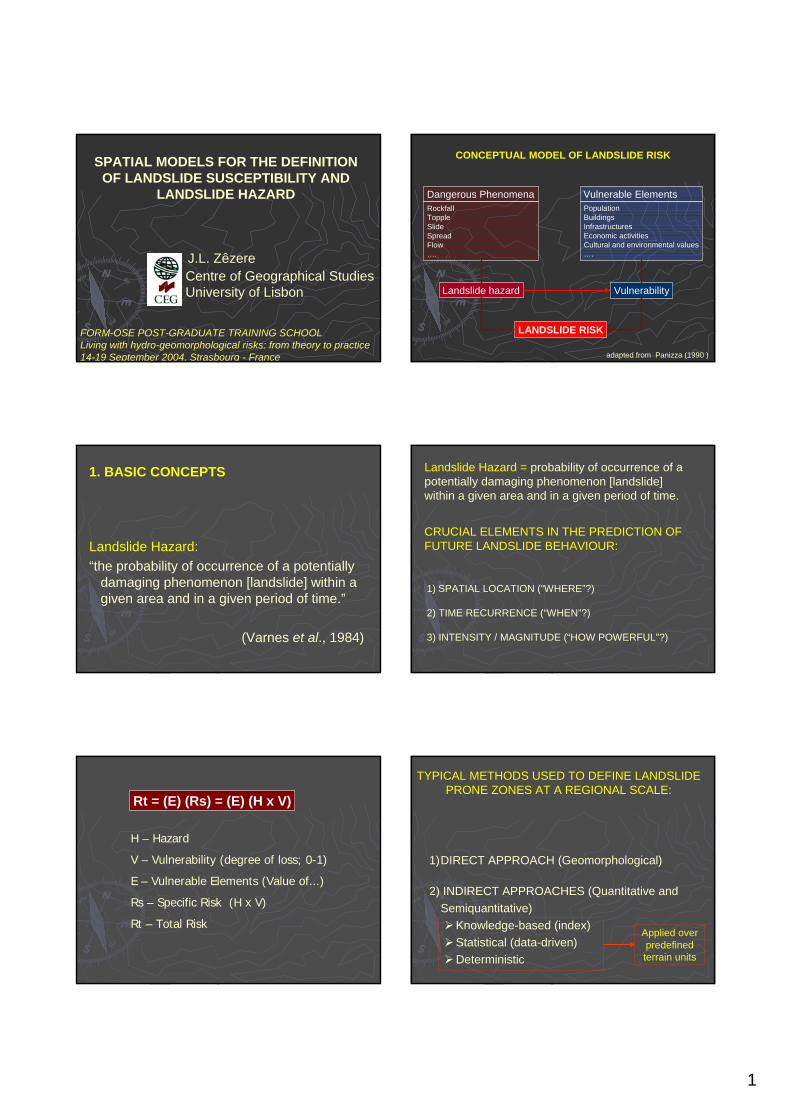
3) ADDITIONAL PROBLEM
THE DIFFERENT SPATIAL INCIDENCE OF DIFFERENT TYPES OF SLOPE MOVEMENTS,NORMALLY RELATED TO DISTINCT THRESHOLDSCONDITIONS CONCERNING PREPARATORY ANDTRIGGERING FACTORS.
ASSESSMENT OF LANDSLIDE HAZARDFOR EACH TYPE OF SLOPE MOVEMENTS
Indirect Landslide Susceptibility Assessment (Information Value Method)
Rotational movements susceptibility assessment (Information Value Method)
Translational movements susceptibility assessment (Information Value Method)
Shallow translational slides susceptibility assessment (Information Value Method)
VALIDATION OF SUSCEPTIBILITY AND HAZARD
WHY TO VALIDATE ?
Evaluation of the predictive power of models with respect to future slope movements
Strictly speaking, validation of the prediction of future landslides is only possible with the ‘wait and see’ procedure.

5
0 200 m
I
II
III
IV
1
2
120
80
160
200
240
280
120
16020
0240
280
240
200
160
120
160 200
240
EDP
Landslide susceptibility assessment in the Trancãoriver valley (Direct approach, 1988)
Very high
High
Moderate
Low
CREL motorway (1995)
December 1995 / January 1996 landslides
Susceptibility classes:
VALIDATION OF SUSCEPTIBILITY AND HAZARD
VALIDATION FOR WHAT ?
Evaluation of the predictive power of models with respect to future slope movements
Strictly speaking, validation of the prediction of future landslides is only possible with the ‘wait and see’ procedure.
Proposed method: spatial/ time partitioning of the spatial landslide databases.
2. LANDSLIDE SUSCEPTIBILITY, HAZARD ASSESSMENT AND ZONATION
Supporting patternsselected by expert
Prediction map:resource potential,hazard or impactExpert
Mathematician
Validation supporting pattern
geol
ogy
slope
Land
use
know
n ha
zard
s,
reso
urce
s or i
mpa
cts
Assessment of Landslide Risk and Mitigation in Mountain Areas EVG1-2001-00018
REGIONAL FRAMEWORK
Tagu
s river
Oporto
Lisbon
Atla
ntic
Oce
an
Studyarea
Spain
• Monocline structure dipping 5° to 25° to S and SE.• Heterogeneous bedrock (limestones, sandstones, basalts, volcanic
tuffs, marls, clays) dating from upper Jurassic to Miocene.• Cuestas, strongly dissected by fluvial cutting.• Maximum altitude = 350m; steep slopes on catacline valleys.
ALARM PROJECTFANHÕES-TRANCÃO
TEST SITE
Trancão valleyFanhões valley
Lithology Superficial Geomorph. Land use Slope Slope Slope deposits units profile angle aspect
landslides landslides landslides landslides landslides landslides landslides
Documentation
Air-photo interpretation
Field work
Altitude points
Contour lines (5 m)
DEM (pixel: 5m)
Verification Rectification
Slope angle(continuous)
Slope aspect(continuous)
algorithms
DATA CAPTURE AND DATA TREATMENT
Lithology
Superficial
deposits
Geomorph.
units
Landslide
map
Land use
Slope aspect
Slope profile
Slope angle
Independent data layers (categorical)
CARTHOGRAPHIC DATABASE
DATA INTEGRATION
LANDSLIDE SUSCEPTIBILITY MAP
Partition (temporal criteria)
Validation group[age > 1979]
(54 cases)
Estimation group [age <= 1979]
(46 cases)
Data integration
Susceptibility prediction
image
PREDICTION-RATE CURVE
CLASSIFICATIONINTERPRETATION
SUSCEPTIBILITY ASSESSMENT AND VALIDATION
General methodology from data capture and treatment to landslide susceptibility assessment and validation

6
Documentation
Air-photo interpretation
Field work
Altitude points
Contour lines (5 m)
DEM(pixel: 5m)
Verification Rectification
Slope angle (continuous)
Slope aspect (continuous)
algorithms
DATA CAPTURE AND DATA TREATMENT
Lithology
Superficial
deposits
Geomorph.
units
Landslide
map
Land use
Slope aspect
Slope profile
Slope angle
Independent data layers (categorical)
CARTHOGRAPHIC DATABASE
CONSTRUCTION OF A CARTHOGRAPHIC DATABASE
SLOPE ANGLE
(degrees)
SLOPE ASPECT
Flat areasNNEESESSWWNW
LITHOLOGY
SUPERFICIAL DEPOSITS
GEOMORPHOLOGICAL UNITS

7
LAND USE /VEGETATION COVER
TRANSVERSAL SLOPEPROFILE
Fan
hõe
s Ri ver
Tranc
ão
Rive
r
Rotational slides Translational sl ides Shallow translational slides
LANDSLIDES
Landslide Landslide morphometricmorphometric parameters of the parameters of the FanhõesFanhões--TrancãoTrancão test sitetest site
Landslide types
N
(%)
Mean depth (m)
Mean area (m2)
Total area (m2)
Mean volume
(m3)
Total volume
(m3) Rotational slides
21 14.3 5.3 6,544 137,415 14,650 307,653
Translational slides
26 17.7 3.4 6,429 167,151 6,699 174,185
Shallow transl. slides
100 68.0 1.0 1,422 142,176 357 35,357
Total 147 100.0 2.1 3,039 446,742 3,542 517,195
General assumption:
Future landslides can be predicted by statistical relationships between past landslides and the spatial data set of the conditioning factors (e.g. slope, aspect, slope profile, geomorphology, lithology, superficial deposits, land use, etc.).
SUSCEPTIBILITY ASSESSMENT
Lithology Superficial Geomorph. Land use Slope Slope Slope deposits units profile angle aspect
landslides landslides landslides landslides landslides landslides landslides
DATA INTEGRATION
DATA INTEGRATION

8
DATA INTEGRATION (BAYESIAN PROBABILITY)
affected area/total area
class area/total area
classtheinareaaffected
areaclass ⎟⎟⎠
⎞⎜⎜⎝
⎛−−
111
DATA INTEGRATION (BAYESIAN PROBABILITY)
Prior probability of finding a landslide
Prior probability of finding a class of a layer
Conditional probability of finding a landslide in each class, for each layer
where L1, L2, ..., Ln are the several data layers used as independent variables, (L1×L2×
... ×Ln) represents the prior probability of finding the n data layers in the test site, Cp
is the conditional probability of finding a landslide in a class of each layer, and Pp and
Ppslide are the prior probabilities of finding, respectively, a class and a landslide in
the study area.
DATA INTEGRATION (BAYESIAN PROBABILITY)
Probability of finding a landslide, given n data layers, usingthe conditional probability integration rule (Chung & Fabbri, 1999):
( )( )( )
PpL PpL PpLn CpL CpL CpLn
PpslideLn L L Ln
1 2 1 21
1 2
× × × × × ⋅ ⋅ ⋅ ×
− × × × ⋅ ⋅ ⋅ ×
. . .
0.0767
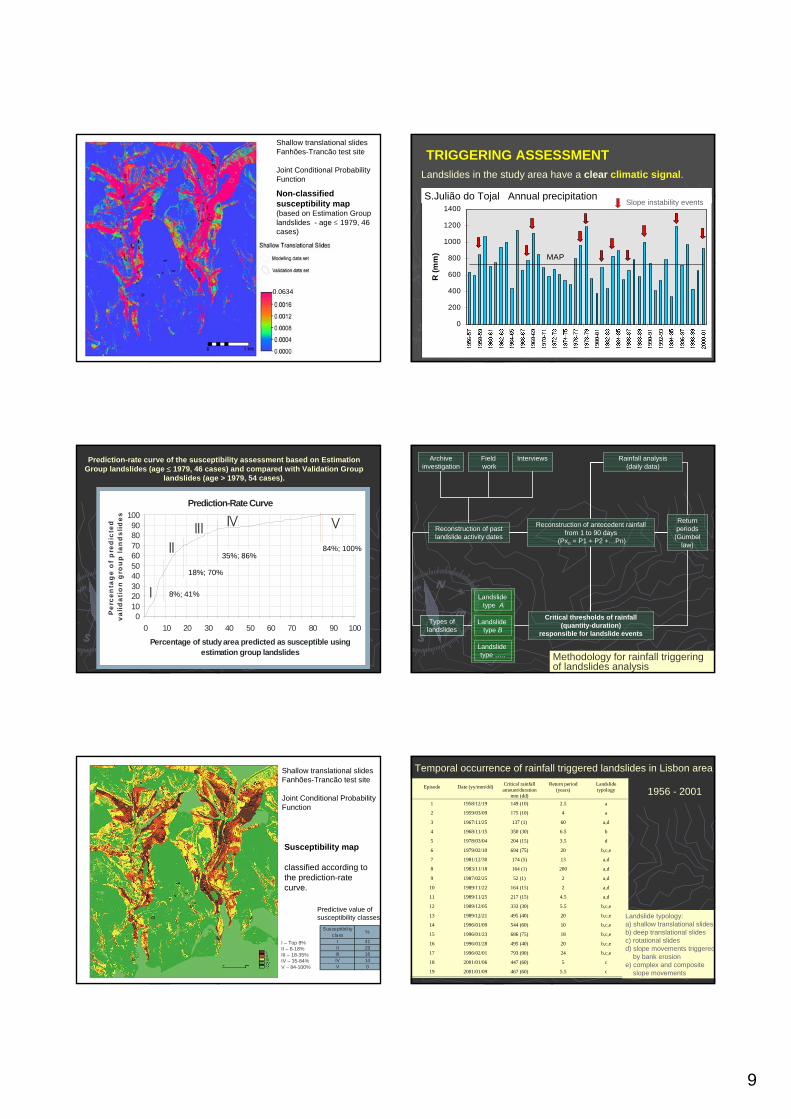
Non-classified susceptibility map
(based on the complete landslide data set -100 cases).
Shallow translational slidesFanhões-Trancão test site
Joint Conditional Probability Function
Success-rate curve of the susceptibility assessmentbased on the complete landslide data set
LANDSLIDE SUSCEPTIBILITY MAP
Partition (temporal criteria)
Validation group[age > 1979]
(54 cases)
Estimation group[age <= 1979]
(46 cases)
Data integration
Susceptibility prediction
image
PREDICTION-RATE CURVE
CLASSIFICATION INTERPRETATION
SUSCEPTIBILITY ASSESSMENT AND VALIDATION
LandslidesData set
LANDSLIDE SUSCEPTIBILITY VALIDATION AND CLASSIFICATION
9
0.0634
Shallow translational slidesFanhões-Trancão test site
Joint Conditional Probability Function
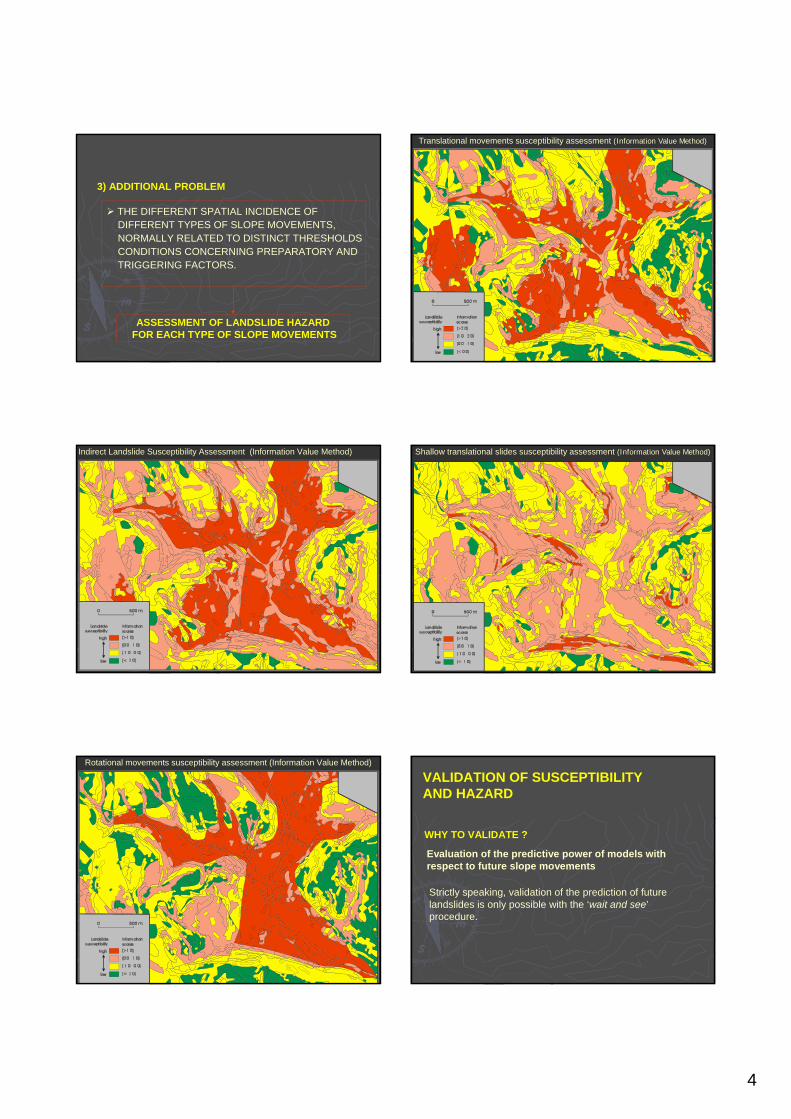
Non-classified susceptibility map(based on Estimation Group landslides - age ≤ 1979, 46 cases)
Prediction-rate curve of the susceptibility assessment based on Estimation Group landslides (age ≤ 1979, 46 cases) and compared with Validation Group
landslides (age > 1979, 54 cases).
Prediction-Rate Curve
0102030405060708090
100
0 10 20 30 40 50 60 70 80 90 100
Percentage of studyarea predicted as susceptible usingestimation group landslides
Per
cen
tag
eo
fp
red
icte
dva
lidat
ion
gro
up
lan
dsl
ides
I
IIIII IV V
8%; 41%
18%; 70%
35%; 86%84%; 100%
Susceptibility map
classified according to the prediction-rate curve.
Shallow translational slidesFanhões-Trancão test site
Joint Conditional Probability Function
I – Top 8%II – 8-18%III – 18-35%IV – 35-84%V – 84-100%
I 41II 29III 16IV 14V 0
Susceptibility class %
Predictive value ofsusceptibility classes
Landslides in the study area have a clear climatic signal.
TRIGGERING ASSESSMENT
0
200
400
600
800
1000
1200
1400
R (m
m) MAP
S.Julião do Tojal Annual precipitationSlope instability events
Archive investigation
Fieldwork
Interviews
Reconstruction of past landslide activity dates
Rainfall analysis(daily data)
Landslide type A
Landslide type B
Landslide type …..
Critical thresholds of rainfall (quantity-duration)
responsible for landslide events
Reconstruction of antecedent rainfall from 1 to 90 days
(Pxn = P1 + P2 +…Pn)
Return periods
(Gumbellaw)
Types oflandslides
Methodology for rainfall triggeringof landslides analysis
Episode Date (yy/mm/dd) Critical rainfall amount/duration
mm (dd)
Return period (years)
Landslide typology
1 1958/12/19 149 (10) 2.5 a
2 1959/03/09 175 (10) 4 a
3 1967/11/25 137 (1) 60 a,d
4 1968/11/15 350 (30) 6.5 b
5 1978/03/04 204 (15) 3.5 d
6 1979/02/10 694 (75) 20 b,c,e
7 1981/12/30 174 (5) 13 a,d
8 1983/11/18 164 (1) 200 a,d
9 1987/02/25 52 (1) 2 a,d
10 1989/11/22 164 (15) 2 a,d
11 1989/11/25 217 (15) 4.5 a,d
12 1989/12/05 333 (30) 5.5 b,c,e
13 1989/12/21 495 (40) 20 b,c,e
14 1996/01/09 544 (60) 10 b,c,e
15 1996/01/23 686 (75) 18 b,c,e
16 1996/01/28 495 (40) 20 b,c,e
17 1996/02/01 793 (90) 24 b,c,e
18 2001/01/06 447 (60) 5 c
19 2001/01/09 467 (60) 5.5 c
Landslide typology: a) shallow translational slidesb) deep translational slidesc) rotational slidesd) slope movements triggered
by bank erosione) complex and composite
slope movements
Temporal occurrence of rainfall triggered landslides in Lisbon area
1956 - 2001

10
0100200300400500600700800900
0 20 40 60 80 100
Duration (days)
Cum
ulat
ive ra
infa
ll (m
m)
landslides no landslides Cr = 6.3D + 70
Rotational slidesTranslational slidesComplex slope movements
Shallow translational slidesSlope movements triggered by bank erosion
Duration (consecutive days)
Age of and total affected areas by shallow translational slideswithin the Fanhões-Trancão test site.
100.0142,176100.0100Total
0.71,0004.041996, January0.79963.031989, December0.91,3153.031989, November2.33,2834.041987, February
33.147,12540.0401983, November31.344,44024.0241979, February31.044,01722.0221967 or prior(%)Total affected area (m2)(%)NAge
General assumption:
The rainfall patterns (quantity/duration) which produced slope instability in the past will produce the same effects in the future (i.e. same types of landslides and same total affected area).
Three scenarios for future landslide activity within the Fanhões-Trancão test site based on past landslide events
1,3154.5217/15(3) 1989, November47,125200164/1(2) 1983, November44,4408.5128/3(1) 1979, February
Affected area by shallow translational
slides (m2)
Return Period (years)
Critical rainfall amount/duration
(mm/days)
Scenario
HAZARD ASSESSMENT AT A PROBABILISTIC BASIS
For each particular triggering scenario, the conditionalprobability that a pixel will be affected by a shallowtranslational slide in the future is estimated by:
⎟⎟⎠
⎞⎜⎜⎝
⎛−−= pred
TyTaffectedP .11
Where:
Taffected = Total area to be affected by landslides in a scenario (x);
Ty = Total area of susceptibility class y
pred = prediction value of susceptibility class y.
Calculation of probabilities for landslide hazard assessmentworking on a scenario basis
0.000020.00000
0.00070.0000
0.00060.0000
0.13970.0000
382114127459
IV - 35-84%V – 84-100%
0.000060.00220.00210.1647142342III - 18-35%0.000190.00660.00620.288582044II – 8-18%0.000340.01200.01130.407164150I - Top 8%
(3)November
1989
(2)November
1983
(1)February
1979
Predictive value of susceptibility class
Area (number of pixels)
(pixel= 5m)
Landslide susceptibility
class
Scenarios
Probability to each pixel to be affected by a landslide

11
Hazard map
Triggering scenario (1)128 mm / 3 days (RP=8.5 years)
Shallow translational slidesFanhões-Trancão test site
Joint Conditional Probability Function
I 0.0113 II 0.0062 III 0.0021IV 0.0006 V 0.0000
Class Probability by pixel
Shallow translational slidesFanhões-Trancão test site
Joint Conditional Probability Function
Hazard map
Triggering scenario (3)217mm / 15 days(RP=4.5 years)
I 0.00034II 0.00019III 0.00006 IV 0.00002 V 0.00000
Class Probability by pixel
House(500 m2)
Shallow translational slidesFanhões-Trancão test site
Joint Conditional Probability Function
Hazard map
( ) ( )( )houseofsize
predITI
TaffectedP=
⎟⎟⎠
⎞⎜⎜⎝
⎛=
=−−=
2041.0.
150,6411'
Taffected = Total area to be affected by landslides in a scenario (x);
TI = Total area of susceptibility class I;PredI = prediction value of susceptibility class I.
Probability that a part of the house will be involved
in landslide activity
Scenario (1) 20.4% Scenario (2) 21.5% Scenario (3) 0.7%
Prediction-Rate Curve
0102030405060708090
100
0 10 20 30 40 50 60 70 80 90 100
Percentage of study area predicted as susceptible using estimation group landslides
Per
cen
tage
of p
redi
cted
va
lidat
ion
grou
p la
ndsl
ides
I
IIIII
IV V
I 13II 44III 11IV 32V 0
Susceptibility class %
ROTATIONALSLIDES
Predictive value ofsusceptibility classes
Prediction-Rate Curve
0102030405060708090
100
0 10 20 30 40 50 60 70 80 90 100
Percentage of study area predicted as susceptible usingestimation group landslides
Perc
enta
geof
pred
icte
dva
lidat
ion
grou
pla
ndsl
ides
I
IIIII IV V
I 61II 14III 4IV 21V 0
Susceptibility class
%
TRANSLATIONALSLIDES
Predictive value ofsusceptibility classes
WORKING ON A SCENARIO BASISScenario January 1996:Critical rainfall amount/duration - 495mm/40 daysReturn period - 20 years
Rotational slides 48,127Translational slides 6,552Shallow translational slides 1,000
Affected area by landslides (m2)

12
I - Top 1% 8122 0.1275 0.0302II - 1-12% 88934 0.4448 0.0096III - 12-17% 40334 0.1129 0.0054IV - 17-70% 423765 0.3148 0.0014V - 70-100% 236954 0.000 0.0000
Probability to each pixel to be
affected by a landslide
Predictive value of susceptibility
class
Area (# pixels)
Landslide susceptibility
class
I - Top 9% 72518 0.6080 0.0022II - 9-13% 32423 0.1418 0.0011III - 13-17% 33071 0.0426 0.0003IV - 17-75% 465020 0.2076 0.0001V - 75-100% 195077 0.000 0.0000
Probability to each pixel to be
affected by a landslide
Landslide susceptibility
class
Area (# pixels)
Predictive value of susceptibility
class
I - Top 8% 64150 0.4071 0.00025II - 8-18% 82044 0.2885 0.00014III - 18-35% 142342 0.1647 0.00005IV - 35-84% 382114 0.1397 0.00001V - 84-100% 127459 0.000 0.00000
Landslide susceptibility
class
Area (# pixels)
Predictive value of susceptibility
class
Probability to each pixel to be
affected by a landslide
ROTATIONALSLIDES
TRANSLATIONALSLIDES
SHALLOWTRANSLATIONALSLIDES
Susceptibility
Causes Effects
Vulnerable elements
Typology Value
Hazard Intensity Vulnerability
Specific Risk Potential loss
TOTAL RISK
RISK MANAGEMENT
Acceptable Risk
Temporal dimension
TOWARDS LANDSLIDE RISK ASSESSMENT AND MANAGEMENT
adapted from Canuti & Casagli (1994 )

![[hal-00360872, v1] Sismotectonique et socle tardi …eost.u-strasbg.fr/omiv/Publications/Fourno_et...pr of onde urs du M oho et l ext ensi on res pect ive des plaques Eur opéen ne,](https://img.dokumen.tips/doc/110x75/5ecf680cae1fa87c9200a651/hal-00360872-v1-sismotectonique-et-socle-tardi-eostu-pr-of-onde-urs-du.jpg)