Embed Size (px)
Citation preview
sustainability
Article
Spatial Diversity of Tourism in the Countries of theEuropean Union
Michał Roman 1 , Monika Roman 1,* and Arkadiusz Niedziółka 2
1 Institute of Economics and Finance, Warsaw University of Life Sciences, 02-787 Warsaw, Poland;[email protected]
2 Faculty of Agriculture and Economics, University of Agriculture in Krakow, 31-120 Krakow, Poland;[email protected]
* Correspondence: [email protected]
Received: 28 February 2020; Accepted: 27 March 2020; Published: 30 March 2020�����������������
Abstract: The aim of the article is to present the spatial diversity of tourism in the countries ofthe European Union (EU). The main objective of the article can be divided into three immediategoals, each of which is to determine countries that are similar by means of: (1) accommodation base;(2) tourism traffic; and (3) tourism-related expenditures and revenues. In order to group countries,Ward’s cluster analysis method is used. The aim is verified with the use of 2017 United Nations WorldTourism Organization (UNWTO) and Eurostat data. The analysis covers all EU member states. Theresearch conducted confirms, inter alia, the key role of the accommodation base in the developmentof tourism in those countries.
Keywords: tourism; spatial analyses; cluster analysis; Ward’s method; EU
1. Introduction
The issue of spatial diversity is a subject matter that often draws the attention of economistsstudying markets. This diversity is often analyzed in regions, macro-regions and countries. The spatialdiversity of markets is one of the matters used to assess interrelations and spatial development by theidentification of developed and underdeveloped areas. This also applies to the tourism market.
Travel and tourism make up the largest service industry in the world and it is continuing to grow.This industry stimulates Gross Domestic Product (GDP) growth in host countries and contributessubstantially to government tax revenues [1]. Worth USD 7.6 trillion, the travel and tourism sectoraccounts for more than 10% of global GDP and represents 7% of all international trade and 30% ofthe world’s export of services. Tourism receipts provide an important source of foreign exchange forcountries around the world, enabling economic growth and investment in a multitude of other sectors.In 2016, tourism grew by 3.1%, outperforming the global economy’s growth of 2.5% [2,3].
Tourism is the third largest socio-economic activity in the European Union (EU), and it makesan important contribution to the EU’s gross national product and to employment [4]. Europe is alsothe world’s number one tourist destination. Within the global sector, however, Europe is not thefastest-growing region and its market share, in terms of international tourist arrivals and receipts,is shrinking [5]. Europe is ranked as the world’s number one destination for international arrivals,USD 713 million in 2018, over half the global total, growing by 6% in 2018. Early indications are that2019 saw further growth, although at more modest levels than 2018. Tourism creates a surplus for theEU’s economy, with international tourism receipts exceeding EU residents’ spending on internationaltourism by USD 27 billion in 2016 [5,6].
Tourism businesses in the EU are confronted with a number of changes in tourists’ profiles andbehavior. Demographically, tourists in the EU are older than in previous decades. Geographically, a
Sustainability 2020, 12, 2713; doi:10.3390/su12072713 www.mdpi.com/journal/sustainability
Sustainability 2020, 12, 2713 2 of 16
growing number of tourists travelling to the EU come from emerging countries, although the EU’ssource markets still provide the biggest share of tourists [5,7].
Tourism has an important territorial dimension, with uneven spatial distribution between andwithin countries, and it delivers localized impacts. The importance of the spatial dimension of tourismis also underscored by findings indicating that tourism growth in one region positively influencestourism in neighboring regions [8], or that public policy can impact the spatial patterns of tourismdemand [9]. Therefore, an interesting research issue is the recognition of the spatial diversity oftourism in EU countries. This information may be useful for tour operators, owners of facilities andtourist attractions, and above all for EU and national government leaders. The conducted research willindicate areas with the weakest results, which may constitute valuable information for developingtourism in these countries.
The aim of the article is to present the spatial diversity of tourism in the countries of the EU bymeans of cluster analysis with the use of Ward’s method. Ward’s method was selected because of itstendency to produce more evenly sized clusters. Most other measures have a tendency to produce onelarge and numerous much smaller clusters, which is less useful for spatial diversity in tourism [10]. Aspart of the main goal, the authors looked for answers to the following questions:
• What is the spatial diversity of the accommodation base in EU countries?• What is the spatial diversity of tourist traffic in EU countries?• What is the spatial diversity of expenditures and revenues in EU countries?• Are countries with similarly developed accommodation facilities characterized by similar
tourist traffic?
The individual parts of the article present the theoretical premises for the spatial diversity oftourism, followed by the research part of the spatial analysis. After this, the initial issues of the thesis,theoretical background and research gaps are presented. Section 2 presents an in-depth literaturereview on how to use data sets to generate tourist statistics, especially spatial relationships. Section 3discusses the materials and methods. Section 4 deals with the results of the cluster analysis, and isdivided into three parts: spatial diversity of the accommodation base, spatial diversity of tourismtraffic and spatial diversity of tourism expenditures and revenues. The final part of the thesis concernsthe discussion and applications.
2. Literature Review
Tourism is perceived as a spatial phenomenon that has a great impact on society and varioussectors of the national economy, inter alia, the construction industry, transport and trade [11]. One ofthe elements of tourism development is the accommodation base. There are many studies coveringanalysis of the accommodation base of individual cities or small regions [12–14]. However, thereis no research on the spatial diversity of the accommodation base in EU countries. For example,Batista e Silva et al. [9] created a map of tourism capacity in the group of 28 EU countries (EU-28) in2017 using data from Booking.com and TripAdvisor. They also analyzed tourist density changes inselected months of the year in EU-28 at a city level. Navrátil et al. [15] assessed the impact of variouscharacteristics of the geographic space on the location of tourist accommodation facilities. Accordingto them, hotels create spatial clusters situated mainly in urbanized areas. Hostels are strictly relatedto towns, and camps and resorts are situated primarily near water resources in warmer areas. Thisis the reason why they are considered to be a core source for the sustainable competitiveness of adestination. The lack of an accommodation base “acts as a constraint on overnight visitor numbers” [16].Building up the accommodation capacity is one of the essential parts of the process of planning tourismdevelopment for destinations [17]. The location of hotels constitutes part of the development of theregions [18], as well as influencing tourism traffic [19].
Tourist traffic means the spatial movement of people, which is connected with voluntary andtemporal changes of residence, environment and the rhythm of life. Within tourist traffic, one can
Sustainability 2020, 12, 2713 3 of 16
distinguish leisure, sightseeing and specialist tourism [20]. In areas where tourist traffic is developing,in order to satisfy its needs, the natural environment is changed, transport infrastructure is built, andaccommodation and catering bases are created [21,22]. As a result, tourism can become a positive andvaluable element of the spatial order but also contribute to the degradation of a given area’s natural andcultural environment [23–25]. Shoval et al. [19] concluded that hotel location has a profound impact ontourist movements, with a large share of the total tourist time budget spent in the immediate vicinityof the hotel. Further, the study illustrated the impact of geomorphic barriers on tourist movements.Some research has examined the importance of location in hotel site selection, especially for urbandestinations [18,26,27]. In this case, it results in the creation of several models of hotel location [28,29].
Table 1 presents a list of the selected publications that are subject to analysis in order to identifymethods of using databases to generate tourist statistics, and in particular indicators measuring spatialdiversity dependencies and the use of cluster analyses. There is a lot of tourism research, but asXiao and Smith [30] have pointed out, one of the major limitations of research in tourism is causedby the fact that the research is, in most cases, concerned with a single case, location, nationality, etc.Examples of such research can be found in the work of e.g., Soybali [31], Raun et al. [32], Peng et al. [33],Del Vecchio et al. [34] and Guilarte and Quintans [35].
Table 1. List of publications on tourism spatial diversity and sustainability development (by dateof publication).
Authors and Years of Publication Title Methodology
Soybali (2005) [31] Temporal and spatial aspects of tourismin Turkey
Period: 1981–2003Area: TurkeyMethods: Questionnaire techniques,Chi-Square analysis
Papapavlou-Ioakeimidou,Rodolakis, Kalfakakou
(2006) [36]
Spatial structure of tourist supply andrelations between sub-regions: a case
study in a Coastal Region
Period: 10 yearsArea: Greece—Chalkidiki peninsulaMethods: Location Quotient, Coefficient ofLocation, Coefficient of Specialization,Correlation Analyses
Borzyszkowski, Marczak,Zarebski (2016) [37]
Spatial diversity of tourist functiondevelopment: the municipalities ofPoland’s West Pomerania province
Period: 2012Area: Poland—West Pomerania provinceMethods: Defert’s tourist function index(DTFI)
Raun, Ahas, Tiru (2016) [32] Measuring tourism destinations usingmobile tracking data
Period: 2011–2013Area: EstoniaMethods: Mobile tracking data
Navarro Chavez, Zamora Torres,Cano Torres (2016) [38]
Hierarchical Cluster Analysis ofTourism for Mexico and the Asia-Pacific
Economic Cooperation (APEC)Countries
Period: 2013Area: 20 of APEC countriesMethods: Cluster analysis—Ward’s methodand K-Means method
Peng, Huang (2017) [33]A Novel Popular Tourist Attraction
Discovering Approach Based onGeo-Tagged Social Media Big Data
Period: 2005–2016Area: BeijingMethods: DBSCAN algorithm
Swistak, Swiatkowska (2018) [39]Spatial Diversity of Accommodation as
a Determinant of Tourism in Poland
Period: 2014Area: PolandMethods: Indicator analysis ofaccommodation base
Del Vecchio, Mele Ndou,Secundo (2018) [34]
Open Innovation and Social Big Data forSustainability: Evidence from the
Tourism Industry
Period: 2015–2017Area: Italy—ApuliaMethods: Case study
Lascu, Manrai, Manrai, Gan(2018) [14]
A cluster analysis of tourist attractionsin Spain. Natural and cultural traits and
implications for global tourism
Period: 2017Area: Spain—17 regionsMethods: Cluster analysis
Guilarte, Quintans (2019) [35] Using Big Data to Measure TouristSustainability: Myth or Reality
Period: 1999–2019Methods: Systematic Literature Review (SLR)
Sustainability 2020, 12, 2713 4 of 16
Table 1. Cont.
Authors and Years of Publication Title Methodology
Gawronski, Król, Gawronska,Lesniara (2019) [40]
Spatial diversity of tourismattractiveness of the Nowy Sacz district,using the Wrocław taxonomic method
Period: 2015Area: Poland—Nowy Sacz districtMethods: Taxonomic methods
Rodriguez, Sanchez (2019) [41]
Spatial Imbalance Between TouristSupply and Demand: The Identification
of Spatial Clusters inExtremadura, Spain
Period: 2015–2017Area: Spain—ExtremaduraMethods: Moran’s test, High/Low Clustering(Getis-Ord_General G)
Kolvekova, Liptakova, Strba,Krsak, Sidor, Cehlar, Khouri,
Behun (2019) [42]
Regional Tourism Clustering Based onthe Three Ps of the Sustainability
Services Marketing Matrix: An Exampleof Central and Eastern
European Countries
Period: 2014Area: 54 regions of Central and EasternEurope (Czech Republic, Slovakia, Hungary,Poland, Estonia, Lithuania, Latvia, Slovenia,Romania and Bulgaria)Methods: Cluster analysis—Ward’s method
Source: [14,31–42].
The scientific publications presented in Table 1 indicate that work is focused on the use of databasesin order to develop methods and tools demonstrating the spatial diversity of tourism. The authors usea number of variables to show the spatial diversity of tourism. Some authors define the specializationof tourist regions using indicator and taxonomic methods. Papulova et al. [36] analyzed the economicrelations between sub-regions in a coastal area of Greece, and the spatial concentration of economicactivities and examination of communities within the sense of socio-economic characteristics, placingemphasis on the analysis of the correlation between employment in the tourism sector and othereconomic activities. These authors think the geographical allocation of tourist facilities constitutes abroadly applied hint on measuring spatial fluctuations in the tourist industry. It is important becausethe tourist base constitutes one of the most significant elements of a tourist product that makes itpossible to measure it, and data concerning the geographical allocation of the tourist base provideuseful elements because of the importance of tourism and its spatial structure. Borzyszkowski et al. [37]carried out an analysis of the spatial diversity of the tourist function development based on the valuesof Defert’s tourist function index (DTFI), which is one of the basic indicators used in tourism geography.The analysis showed considerable differences between the communes in the region examined. Thisconfirms the assumption that the highest tourist function development is typical of seaside communes.DTFI compares the number of tourist beds available in a destination to the total number of residentsor hosts in the region (in this article it is the variable X2). Gawronski and et al. [40] presented anevaluation of the spatial diversity of tourism attractiveness. They believe that an assessment canbe made based on the analysis of the statistical data carried out using taxonomic methods (zeroednotarization and the Wrocław taxonomic method).
Swistak and Swiatkowska [39] presented an analysis of the spatial diversity of accommodationfacilities in Poland and their use by the tourists. The scope of the work included the presentationof the resources and structure of the tourist accommodation base and a general spatial analysis anddatabase on the basis of selected indicators. In the study, the authors used, among others, Defert’stourist function index and the Charvata accommodation density indicator, expressed in the number oftourist beds per 1 km2 of land (in this paper, the variables X3 and X4).
There are also studies on the spatial diversity of tourism using cluster analysis. Lascu et al. [14]compared the level of tourism in the 17 major regions of Spain and identified the key natural, cultural,and dual attractions using a two-step cluster analysis to ascertain the relative importance of the threetypes of attractions. Rodriguez and Sanchez [41] claimed that the techniques provided by spatialanalysis have become a great ally of tourist planning as they allow exhaustive territorial analyses tobe carried out. The authors’ present study uses these techniques to study the degree of equilibriumin the distribution of places and its level of occupation in a region. Other authors perform clusteranalysis with Ward’s method. Navarro Chavez et al. [38] used cluster analysis for the analysis of14 competitive tourism factors for 20 member countries of the Asia-Pacific Economic Cooperation
Sustainability 2020, 12, 2713 5 of 16
(APEC). Kolvekova et al. [42] discussed the fusion of 54 regions of Central and Eastern Europe (CzechRepublic, Slovakia, Hungary, Poland, Estonia, Lithuania, Latvia, Slovenia, Romania and Bulgaria)into clusters according to the selected tourism indicators which Eurostat uses to evaluate tourism.The authors studied the capacity and occupancy of collective tourist accommodation using mainlynumerical data (except nights spent by residents and non-residents per thousand inhabitant and nightsspent by residents and non-residents per km2). This approach, in the case of spatial analysis, may giveinconclusive results, because the population and area of regions are different. Therefore, all of thevariables used in our article are not numerical values but indicators. The literature presents muchinformation about research in the issue of cluster analysis in tourism. The extensive use of Ward’smethod in tourism is summarized and discussed in Dwyer et al. [43].
Summing up, what is important from the point of view of the aim of the article is the issueconnected with the dependencies of the spatial diversity of tourism. The number of articles on the issueis still small (in particular ones providing a comparative analysis of countries). The issue discussed inthe article is a new one and has not been fully recognized from the research point of view till now. AnEU-wide study should be considered as a research gap. The use of the division of the analysis intoaccommodation base, tourist traffic and economic factors is a novelty. This will allow the identificationof specific tourist differences between EU countries.
3. Materials and Methods
Cluster analysis is a group of multivariate techniques whose primary purpose is to groupobjects based on the characteristics they possess. The resulting clusters should exhibit high internal(within-cluster) homogeneity and high external (between-cluster) heterogeneity. Cluster analysis hasbeen used in every research setting imaginable. It can classify different objects: individual people;markets, including the market structure; and analyses of the similarities and differences among newproducts or country [10]. Therefore, cluster analysis can be used to research in tourism and to showthe spatial diversity between countries. The spatial diversity of tourism was verified based on thecluster analysis with the use of Ward’s method. It is one of the agglomerative hierarchical clusteringmethods and is based on the classical criterion of the sum of squares [44]. The division should becarried out in such a way that objects of one group (class) are as similar as possible and those ofdifferent classes as different as possible. The measures of similarities or differences are based on thedistance between the units [45]. The starting point in this method is matrix D of Euclidean distance dijbetween classified objects:
d(x, y) =
√∑p
i=1(xi − yi)
2 (1)
The algorithm procedure is as follows:(1) Each Oi object (i = 1,2, . . . , n) is treated as a one-element group;(2) The distance matrix finds the minimum value: dpq = min{dij};(3) Op and Oq objects are treated as one-element groups and Ap and Aq are combined into one
two-element group Ar: Ar = Ap ∪ Aq;(4) Determination of the distance dir of the formed Ar group from all other groups Ai;(5) Repeating steps 2–4 until all objects form one group [10,46].The general formula for the conversion of the distance matrix while combining groups Api Aq
into a the new group Ar for hierarchical agglomerative methods based on the principle of the centralagglomerative procedure takes the following form:
dir = apdip + aqdiq + bdpq + c[dip − diq] (2)
where:dir—the distance between groups Ai and Ar;dip—the distance between groups Ai and Ap;

Sustainability 2020, 12, 2713 6 of 16
diq—the distance between groups Ai and Aq;dpq—the distance between groups Ap and Aq;ap, aq, b, c—the transformation parameters.Thus, Ward’s method consists of combining such clusters as Ap and Aq, which ensures the
minimum sum of squares of the distance from the center of gravity of the new cluster they create.Ward’s method aims to obtain rather small clusters and is believed to be very efficient. This methodwas able to better ascertain the optimal classification than other methods—minimum, maximum andmean. To choose the number of classes, the Cubic Clustering Criterion (CCC) [47] and Pseudo F [48]were used. All the calculations were made with the SAS 9.4 software.
In the case of an analysis of clusters, it is usually proposed to make the classification complete,disjunctive and non-empty. Completeness means that every object belongs to a class. Disjunctionmeans that it belongs to only one class. And non-emptiness requires that each class should contain atleast one object. The problem in cluster analysis may result from ensuring completeness in case thereare distinct units, dissimilar to others, in the examined cluster [46].
The simplest solution is the creation of one-element classes, which can in fact be interpreted as thespecific exclusion of such objects (countries). However, such a situation may result in the erroneousclassification of the remaining objects. This is why the article thoroughly analyzes the examinedvariables first, and then, when the distinct objects are recognized, they are eliminated in the course ofclustering countries and treated as separate classes.
In order to verify the spatial diversity of tourism, the authors based the analysis on secondary,non-public data from the United Nations World Tourism Organization (UNWTO) [49] and public datafrom Eurostat [50]. In order to verify the spatial diversity, the 2017 data were purposefully chosenbecause this was the latest year for which full data were available at the time of writing. The analysiscovers all the EU member states in 2018.
Seven variables were chosen to analyze the spatial diversity of tourism in the EU. These variablesare as follows:
X1—Average length of stay;X2—Available capacity (beds per 1000 inhabitants);X3—Accommodation for visitors (per 1000 km2);X4—Accommodation in hotels and similar establishments (per 1000 km2);X5—Overnight visitors (tourists) (per 1000 inhabitants);X6—Tourism expenditure over GDP (%);X7—Tourism receipts over GDP (%).The descriptive statistics of variables in the EU countries can be found in Table 2.
Table 2. The descriptive statistics of variables.
X1 X2 X3 X4 X5 X6 X7
Average 4.00 31.43 132.84 75.44 1.56 2.65 4.98Median 3.12 24.62 73.03 30.34 1.28 2.40 3.05Minimum 1.92 8.74 6.20 2.90 0.43 1.10 1.10Maximum 7.97 92.49 733.33 733.33 4.58 6.00 19.30Standard deviation 1.96 20.73 156.21 137.21 0.98 1.13 4.39Coefficient ofvariation (CV) (%) 49.03 65.95 117.60 181.88 62.98 42.60 88.22
Source: own studies based on UNWTO and Eurostat data [49,50].
The variables were selected on purpose so that it is possible to compare elements of theaccommodation base, tourist traffic and economic factors. It should be mentioned that, apartfrom the substantive criterion, the choice of the variables also resulted from the low mutual correlationof variables (correlation rate below 0.8) (Table 3). This proves the reliability and validity of the variablesin the cluster analysis. In addition, all variables were standardized. There are two main benefits
Sustainability 2020, 12, 2713 7 of 16
from standardization. First, it is much easier to compare variables because they are on the same scale.Second, no difference occurs in the standardized values when only the scale changes. Thus, usingstandardized variables eliminates the effects due to scale differences across variables and for the samevariable as well [10].
Table 3. Pearson’s correlation indicators.
X1 X2 X3 X4 X5 X6 X7
X1 1X2 0.50 1X3 0.23 0.54 1X4 0.24 0.64 0.79 1X5 0.28 0.77 0.48 0.57 1X6 0.06 0.25 0.07 0.18 0.33 1X7 0.39 0.65 0.30 0.37 0.74 0.40 1
Source: own studies based on UNWTO and Eurostat data [49,50].
4. Results of the Cluster Analysis
4.1. Spatial Diversity of the Accommodation Base
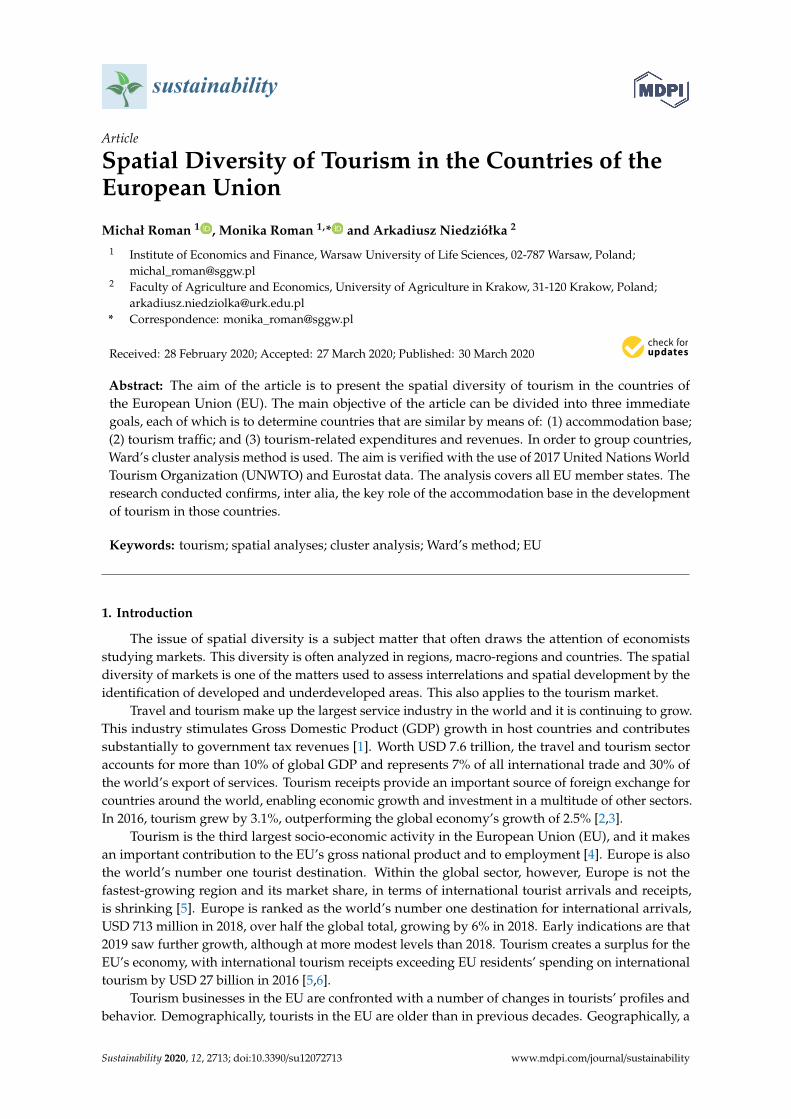
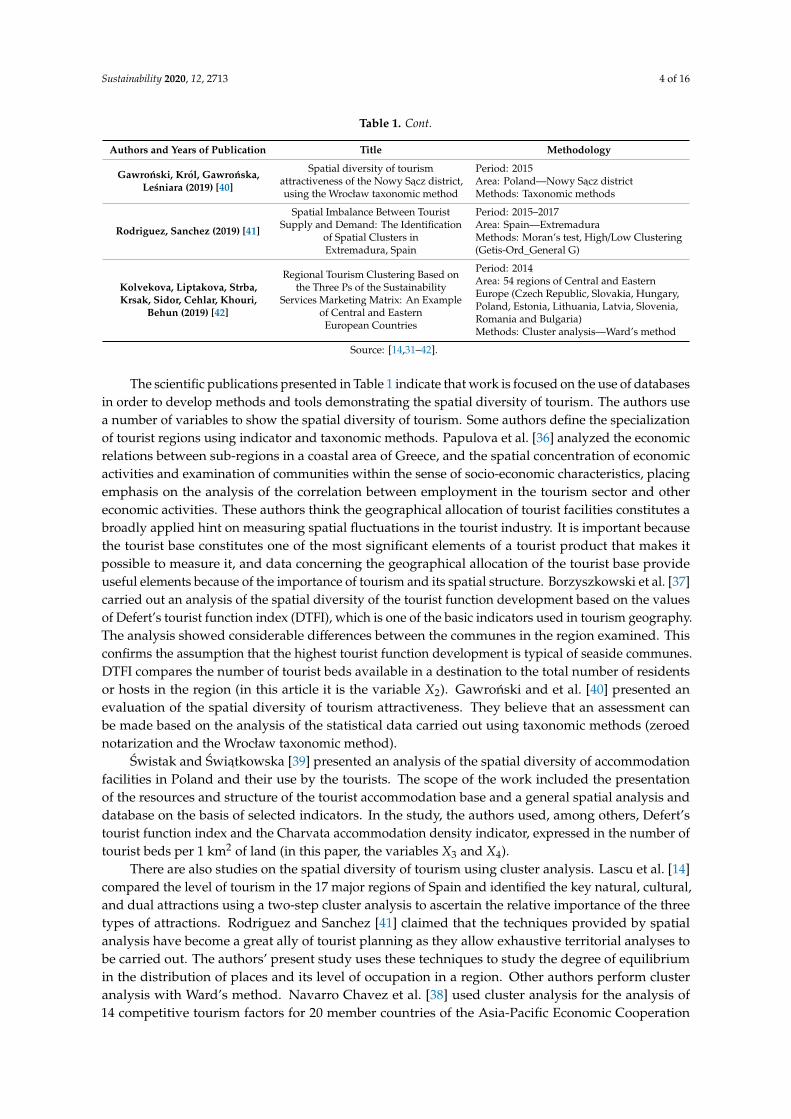
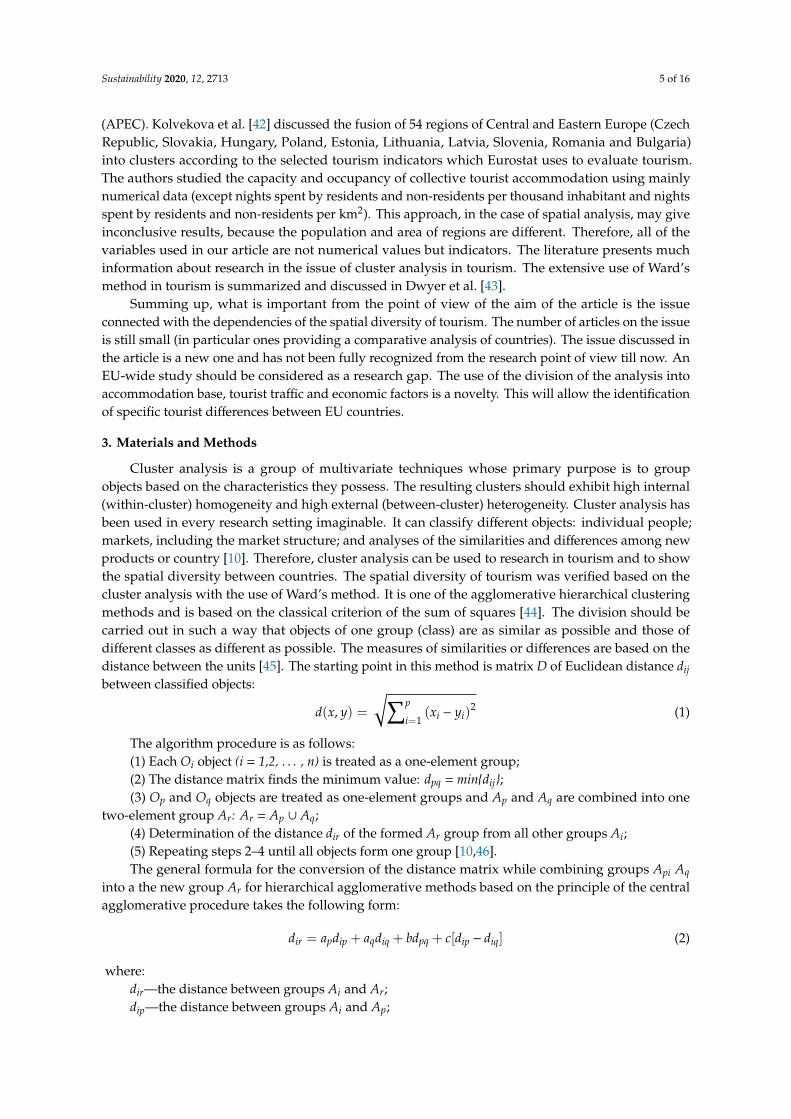
Accommodation facilities are basic elements of the material-technical base of tourism, sincethey facilitate the visitors’ stay at a destination and constitute a basis for further development of thedestination [35]. Figure 1 presents the outcomes of clustering the EU countries with regard to the levelof similarity of the accommodation base. The use of Ward’s method resulted in the differentiation offive groups of countries that are most similar in terms of accommodation base infrastructure. Thefirst one contains Austria, Cyprus and Greece. This cluster can be labeled as “Very well developedaccommodation base”. In these countries at that time there was a very large number of beds (amountingto about 70 places per 1000 inhabitants) and the accommodation was mainly in hotels and similarestablishments (Table 4).
Table 4. Cluster descriptive characteristics of available capacity (beds per 1000 inhabitants),accommodation for visitors (per 1000 km2) and accommodation in hotels and similar establishments(per 1000 km2).
Indicators
X2 X3 X4
Ward method
Cluster 1
Mean 70.2 126.7 88.6Max 71.0 245.5 147.2Min 69.1 60.6 44.9CV 1.2% 66.4% 48.6%
Cluster 2
Mean 24.6 150.5 100.0Max 31.4 264.8 178.2Min 15.4 85.6 51.8CV 23.9% 39.1% 38.1%
Cluster 3
Mean 22.0 40.3 16.0Max 39.7 125.0 30.6Min 8.7 6.2 2.9CV 42.9% 75.0% 61.2%
Cluster 4
Mean 32.4 329.4 62.9Max 40.8 363.4 109.8Min 18.6 302.6 23.7CV 0.3% 0.1% 0.6%
Malta 92.5 733.3 733.3
Source: own studies based on UNWTO data [49].
Sustainability 2020, 12, 2713 8 of 16Sustainability 2020, 12, x FOR PEER REVIEW 8 of 16
Figure 1. Grouping of countries according to cluster analysis—accommodation base. Source: own
studies based on UNWTO data [49].
Table 4. Cluster descriptive characteristics of available capacity (beds per 1000 inhabitants),
accommodation for visitors (per 1000 km2) and accommodation in hotels and similar establishments
(per 1000 km2).
Indicators
X2 X3 X4
Ward method
Cluster 1
Mean 70.2 126.7 88.6
Max 71.0 245.5 147.2
Min 69.1 60.6 44.9
CV 1.2% 66.4% 48.6%
Cluster 2
Mean 24.6 150.5 100.0
Max 31.4 264.8 178.2
Min 15.4 85.6 51.8
CV 23.9% 39.1% 38.1%
Cluster 3
Mean 22.0 40.3 16.0
Max 39.7 125.0 30.6
Min 8.7 6.2 2.9
CV 42.9% 75.0% 61.2%
Cluster 4
Mean 32.4 329.4 62.9
Max 40.8 363.4 109.8
Min 18.6 302.6 23.7
CV 0.3% 0.1% 0.6%
Malta 92.5 733.3 733.3
Source: own studies based on UNWTO data [49].
Figure 1. Grouping of countries according to cluster analysis—accommodation base. Source: ownstudies based on UNWTO data [49].
The second cluster rated as average developed accommodation base. The cluster is composedof Belgium, the Czech Republic, Germany, Luxembourg, The Netherlands, Portugal and the UnitedKingdom, where the number of beds per 1000 inhabitants ranged between 15.4 and 31.4. In addition, inthese countries there was quite a high availability of accommodation in hotels and similar establishments(per 1000 km2), which on average was 100.
The third cluster contains Bulgaria, Croatia, Denmark, Estonia, Finland, France, Ireland, Latvia,Lithuania, Poland, Romania, Slovakia, Slovenia and Sweden. This cluster can be labeled as “Lessdeveloped accommodation base”. In these countries, the availability of beds per 1000 inhabitants wasat a similar level to the second cluster. However, the availability of accommodation in hotels andsimilar establishments (per 1000 km2) was lower; on average it was 16 places with a maximum of 30.
The fourth cluster consists of three countries: Hungary, Italy and Spain, in which theaccommodation base is well developed. In these countries, the availability of accommodationfor visitors (per 1000 km2) was 330 on average. The last cluster consists solely of Malta, in whichthe number of beds was as much as 92 per 1000 inhabitants and the main accommodation was inhotels—733 places per 1000 km2.
4.2. Spatial Diversity of Tourism Traffic
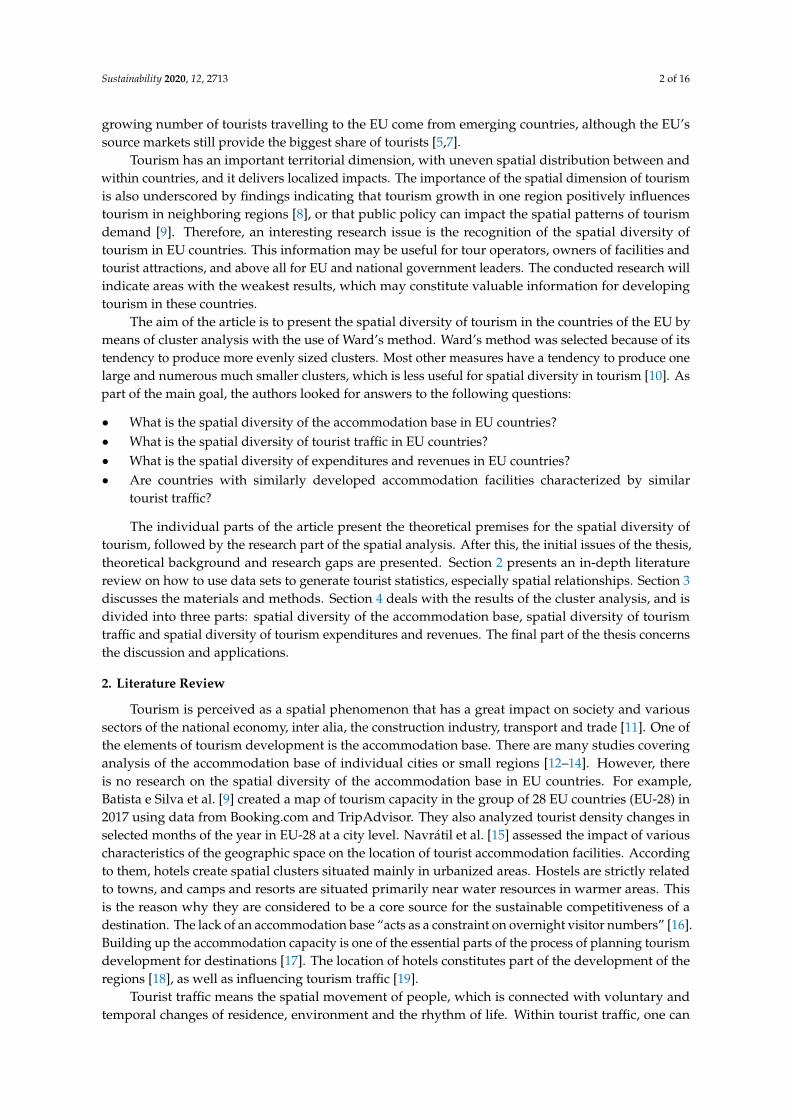
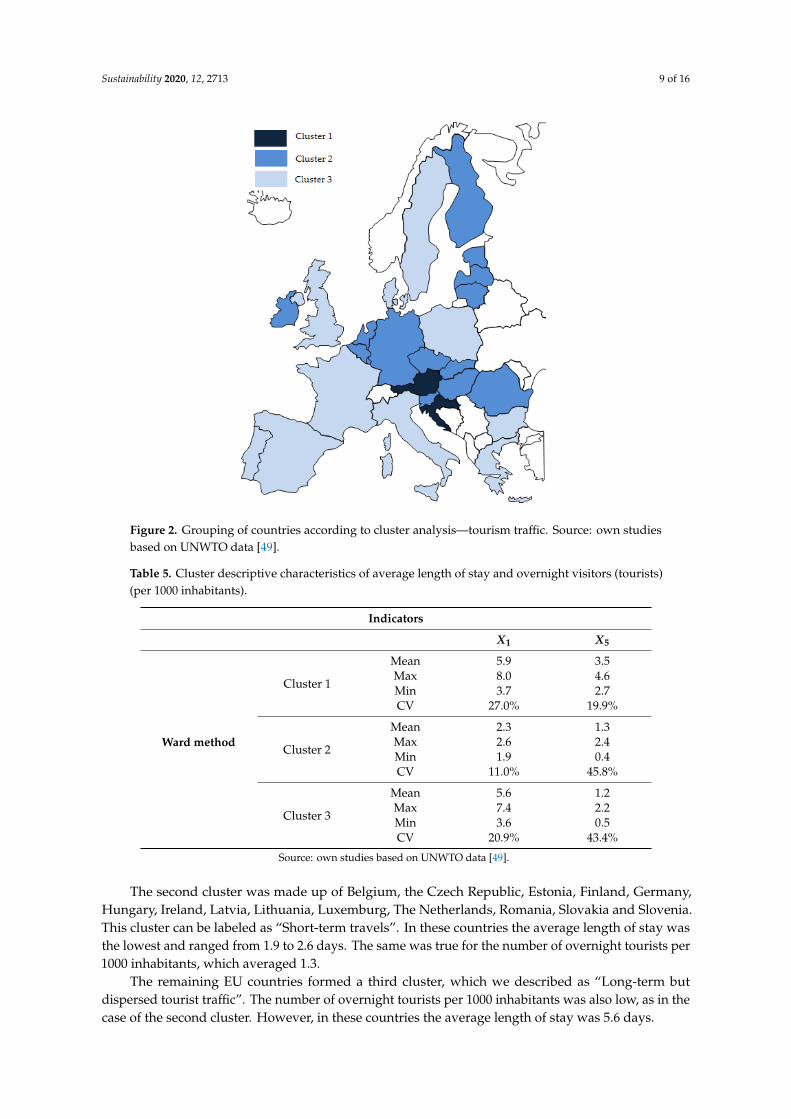
Figure 2 presents the grouping of EU countries in terms of tourist traffic. The use of Ward’smethod resulted in the distinction between three groups of countries. The first one contains Austria,Croatia, Cyprus and Malta. These countries were characterized by high tourist traffic and can belabeled as “Long-term travels”. The average length of stay was 5.9 days and the number of overnighttourists per 1000 inhabitants was 3.5 persons (Table 5).
Sustainability 2020, 12, 2713 9 of 16
Sustainability 2020, 12, x FOR PEER REVIEW 10 of 16
Figure 2. Grouping of countries according to cluster analysis—tourism traffic. Source: own studies
based on UNWTO data [49].
4.3. Spatial Diversity of Tourism Expenditures and Revenues
The importance of tourism in creating the GDP of a given country is an interesting research
issue. Figure 3 presents the grouping of EU countries in terms of tourism-related revenues and
expenditure. The use of Ward’s method resulted in the distinction between five groups of countries.
The first cluster, which we described as “An important role of tourism in the country’s GDP”,
represents Austria, Bulgaria, Greece, Hungary, Portugal, Slovenia and Spain. The group included
countries that were characterized by high revenues from tourism, on average 6.2% of GDP (Table 6),
while expenditures in these countries was at 2% of GDP.
The second cluster was made up of the following countries: Belgium, Denmark, Estonia,
Luxembourg and Sweden. This cluster can be labeled as “An average role of tourism in the country’s
GDP”. In these countries, revenues and expenditures as part of GDP were at a similar level, on
average about 4%.
The third cluster was made up of Croatia and Malta, where tourism revenues as part of GDP
were one of the largest and tourism expenditure over GDP was at a low level. This cluster can be
labeled as “Tourist countries”.
A separate cluster was created by Cyprus, in which revenues accounted for 14.1% and
expenditures for 6% of GDP. The other EU countries formed the fifth cluster. In these countries, both
revenue and expenditure for tourist purposes accounted for about 2% of GDP. This cluster can be
labeled as “Non-tourism countries”.
The groups of countries obtained in the research can be linked to research on measuring the
tourism efficiency of European countries by using Data Envelopment Analysis [51]. According to
this research, the third and fourth cluster countries were considered effective. In addition, effective
countries include: Estonia, Finland, France, Greece, Hungary, Ireland, Latvia, Luxembourg, Poland,
Portugal and Spain. Other studies confirm the relations between the income generated by the
inhabitants and the competitiveness of tourist destinations [24,25,52].
Figure 2. Grouping of countries according to cluster analysis—tourism traffic. Source: own studiesbased on UNWTO data [49].
Table 5. Cluster descriptive characteristics of average length of stay and overnight visitors (tourists)(per 1000 inhabitants).
Indicators
X1 X5
Ward method
Cluster 1
Mean 5.9 3.5Max 8.0 4.6Min 3.7 2.7CV 27.0% 19.9%
Cluster 2
Mean 2.3 1.3Max 2.6 2.4Min 1.9 0.4CV 11.0% 45.8%
Cluster 3
Mean 5.6 1.2Max 7.4 2.2Min 3.6 0.5CV 20.9% 43.4%
Source: own studies based on UNWTO data [49].
The second cluster was made up of Belgium, the Czech Republic, Estonia, Finland, Germany,Hungary, Ireland, Latvia, Lithuania, Luxemburg, The Netherlands, Romania, Slovakia and Slovenia.This cluster can be labeled as “Short-term travels”. In these countries the average length of stay wasthe lowest and ranged from 1.9 to 2.6 days. The same was true for the number of overnight tourists per1000 inhabitants, which averaged 1.3.
The remaining EU countries formed a third cluster, which we described as “Long-term butdispersed tourist traffic”. The number of overnight tourists per 1000 inhabitants was also low, as in thecase of the second cluster. However, in these countries the average length of stay was 5.6 days.
Sustainability 2020, 12, 2713 10 of 16
4.3. Spatial Diversity of Tourism Expenditures and Revenues
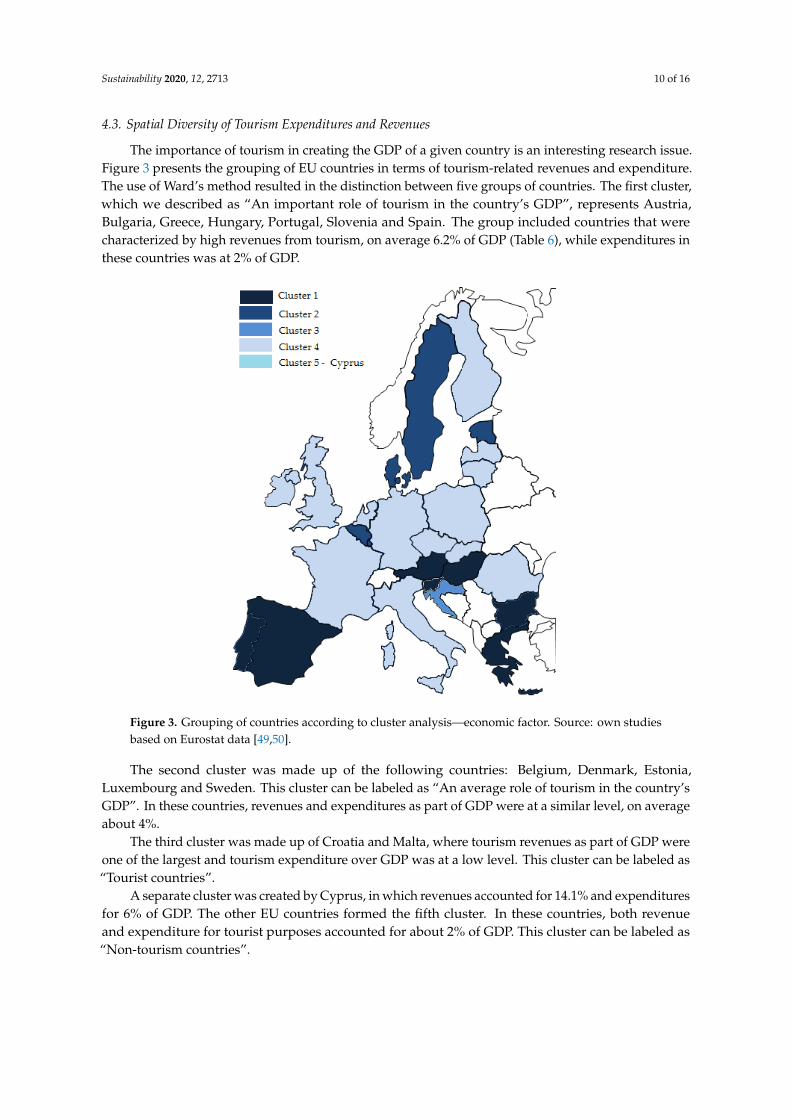
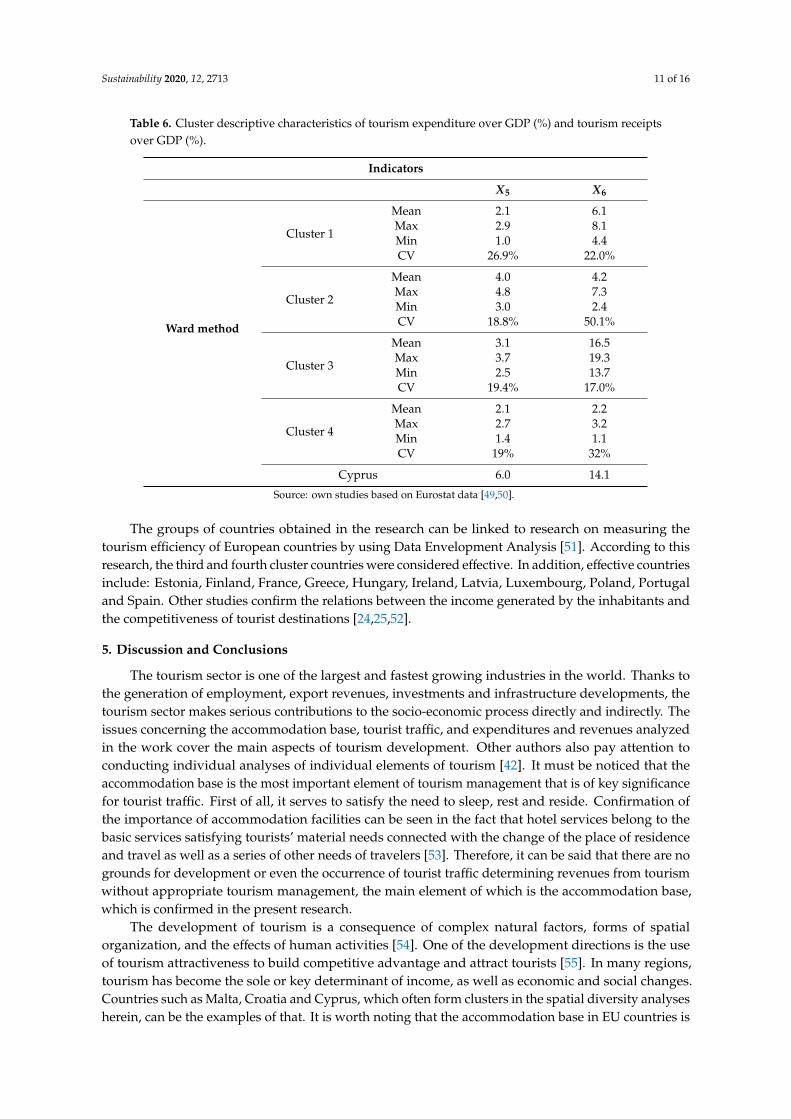
The importance of tourism in creating the GDP of a given country is an interesting research issue.Figure 3 presents the grouping of EU countries in terms of tourism-related revenues and expenditure.The use of Ward’s method resulted in the distinction between five groups of countries. The first cluster,which we described as “An important role of tourism in the country’s GDP”, represents Austria,Bulgaria, Greece, Hungary, Portugal, Slovenia and Spain. The group included countries that werecharacterized by high revenues from tourism, on average 6.2% of GDP (Table 6), while expenditures inthese countries was at 2% of GDP.
Sustainability 2020, 12, x FOR PEER REVIEW 11 of 16
Table 6. Cluster descriptive characteristics of tourism expenditure over GDP (%) and tourism
receipts over GDP (%).
Indicators
X5 X6
Ward method
Cluster 1
Mean 2.1 6.1
Max 2.9 8.1
Min 1.0 4.4
CV 26.9% 22.0%
Cluster 2
Mean 4.0 4.2
Max 4.8 7.3
Min 3.0 2.4
CV 18.8% 50.1%
Cluster 3
Mean 3.1 16.5
Max 3.7 19.3
Min 2.5 13.7
CV 19.4% 17.0%
Cluster 4
Mean 2.1 2.2
Max 2.7 3.2
Min 1.4 1.1
CV 19% 32%
Cyprus 6.0 14.1
Source: own studies based on Eurostat data [49,50].
Figure 3. Grouping of countries according to cluster analysis—economic factor. Source: own studies
based on Eurostat data [49,50].
Figure 3. Grouping of countries according to cluster analysis—economic factor. Source: own studiesbased on Eurostat data [49,50].
The second cluster was made up of the following countries: Belgium, Denmark, Estonia,Luxembourg and Sweden. This cluster can be labeled as “An average role of tourism in the country’sGDP”. In these countries, revenues and expenditures as part of GDP were at a similar level, on averageabout 4%.
The third cluster was made up of Croatia and Malta, where tourism revenues as part of GDP wereone of the largest and tourism expenditure over GDP was at a low level. This cluster can be labeled as“Tourist countries”.
A separate cluster was created by Cyprus, in which revenues accounted for 14.1% and expendituresfor 6% of GDP. The other EU countries formed the fifth cluster. In these countries, both revenueand expenditure for tourist purposes accounted for about 2% of GDP. This cluster can be labeled as“Non-tourism countries”.
Sustainability 2020, 12, 2713 11 of 16
Table 6. Cluster descriptive characteristics of tourism expenditure over GDP (%) and tourism receiptsover GDP (%).
Indicators
X5 X6
Ward method
Cluster 1
Mean 2.1 6.1Max 2.9 8.1Min 1.0 4.4CV 26.9% 22.0%
Cluster 2
Mean 4.0 4.2Max 4.8 7.3Min 3.0 2.4CV 18.8% 50.1%
Cluster 3
Mean 3.1 16.5Max 3.7 19.3Min 2.5 13.7CV 19.4% 17.0%
Cluster 4
Mean 2.1 2.2Max 2.7 3.2Min 1.4 1.1CV 19% 32%
Cyprus 6.0 14.1
Source: own studies based on Eurostat data [49,50].
The groups of countries obtained in the research can be linked to research on measuring thetourism efficiency of European countries by using Data Envelopment Analysis [51]. According to thisresearch, the third and fourth cluster countries were considered effective. In addition, effective countriesinclude: Estonia, Finland, France, Greece, Hungary, Ireland, Latvia, Luxembourg, Poland, Portugaland Spain. Other studies confirm the relations between the income generated by the inhabitants andthe competitiveness of tourist destinations [24,25,52].
5. Discussion and Conclusions
The tourism sector is one of the largest and fastest growing industries in the world. Thanks tothe generation of employment, export revenues, investments and infrastructure developments, thetourism sector makes serious contributions to the socio-economic process directly and indirectly. Theissues concerning the accommodation base, tourist traffic, and expenditures and revenues analyzedin the work cover the main aspects of tourism development. Other authors also pay attention toconducting individual analyses of individual elements of tourism [42]. It must be noticed that theaccommodation base is the most important element of tourism management that is of key significancefor tourist traffic. First of all, it serves to satisfy the need to sleep, rest and reside. Confirmation ofthe importance of accommodation facilities can be seen in the fact that hotel services belong to thebasic services satisfying tourists’ material needs connected with the change of the place of residenceand travel as well as a series of other needs of travelers [53]. Therefore, it can be said that there are nogrounds for development or even the occurrence of tourist traffic determining revenues from tourismwithout appropriate tourism management, the main element of which is the accommodation base,which is confirmed in the present research.
The development of tourism is a consequence of complex natural factors, forms of spatialorganization, and the effects of human activities [54]. One of the development directions is the useof tourism attractiveness to build competitive advantage and attract tourists [55]. In many regions,tourism has become the sole or key determinant of income, as well as economic and social changes.Countries such as Malta, Croatia and Cyprus, which often form clusters in the spatial diversity analysesherein, can be the examples of that. It is worth noting that the accommodation base in EU countries is
Sustainability 2020, 12, 2713 12 of 16
more spatially diverse (five clusters) than tourist traffic (three clusters). This may indicate that otherfactors that have not been studied in this paper also have an impact on tourist traffic. The distinguishingof areas attractive for possible tourism is based on the assessment of the occurrence of, inter alia, thetourism attractions that constitute the aim of tourists’ arrivals, and the tourism infrastructure thatmakes it possible to use those attractions [14,40].
Data on clusters, as presented in this paper, can be used in the effective planning anddecision-making for a destination [56] to support sustainable tourism development in a specificcountry. The data can also be used as a relevant base for potential future cooperation between variouscountries from one cluster to support tourism competitiveness and sustainable development [57,58].In some countries, tourism has a good opportunity for joint development, e.g., by introducing a jointoffer for tourists. Especially if the countries are located close to each other, there is a chance for touriststo use common tourist assets, such as tourist routes.
Moreover, the results presented in the article may be of application significance, both in scientificand practical terms. They can be useful for:
• Country’s authorities—to develop a strategy for tourism development in the country;• Universities, research institutes and scientists—comparison of obtained results; implementation
of projects on tourism development in EU countries; looking for dependencies in the spatialdevelopment of regions;
• Organizations (e.g., national, regional and local tourist organizations, tourist associations, touristclusters) and institutions (e.g., the Ministry of Tourism)—use of the results during trainings,courses, scientific conferences on the development of tourism and its spatial conditions; comparingelements of tourism in different countries;
• Tourist service providers (e.g., hotels, hostels, guesthouses)—defining perspectives for tourismdevelopment and tourist traffic (e.g., in areas of strong tourist competition).
Tourism is considered to be an activity that perfectly expresses spatial interaction [36]. Tourismhas a heavy impact on local development [59]. Based on the results of clusters it can be determined:
• The spatial diversity of the accommodation base may indicate countries in which it can lead tosome estimations of overuse, e.g., laundry, electricity or cosmetics (countries from clusters 1, 4and Malta). Other authors also pay attention to this [42];
• The spatial diversity of tourist traffic may indicate an increase in the use of tourist and associatedinfrastructure, such as the transport infrastructure in individual countries [60]. This can also showthe level of the impact on sustainable tourism development. On the other hand, countries withmore tourist traffic should have this infrastructure more developed (countries from the clusters“Long-term travels” and “Long-term but dispersed tourist traffic”);
• The analysis of the spatial differentiation of revenues and expenditure indicated countriesspecializing in “tourism”, which at the time of crises or epidemics may show very large losses inthe budget of the state and inhabitants (objects from cluster “Tourist countries”).
The importance of the spatial diversity of tourism in terms of the factors analyzed in the articlehas a great impact on the presentation of tourism development in a given country. Spatial diversity isfundamental for characterizing and carrying out research into tourism in a given area [11]. However,some limitations of the study should be acknowledged:
• It should be highlighted that the more countries or regions the research covers, the more probableit is that it will be more differentiated and it will be more necessary to obtain detailed andcomparable spatial-temporal data concerning tourism [9]. This is why the presented issue shouldbe recognized as very broad, with research into it not being fully exhausted. The more the availablestatistical data from official European data sources on tourism are limited in terms of both thespatial and temporal resolutions, the more it curbs potential analyses and applications relevantfor tourism management and policy.

Sustainability 2020, 12, 2713 13 of 16
• Use of more tourism indicators in the cluster analysis may result in more accurate outputs.However, in some cases, it may lead to changes within clusters and/or the number of clusters. Thelimitation in this case is also the lack of comparable data for all countries.
The literature on the subject lacks studies on the spatial diversity of tourism including the variablesused (accommodation, tourism, expenditures and revenues from tourism). There is also a lack ofspatial studies containing other factors such as tourist seasonality or the recently fashionable issueof innovation in tourism [61–63]). There are dynamic changes taking place in tourism so it is worthupholding the issue and conducting similar research, e.g., covering spatial relationships at lowerterritorial units (NUTS 2—basic regions for the application of regional policies or NUTS 3—smallregions for specific diagnoses).
Author Contributions: Conceptualization, M.R. (Michał Roman), M.R. (Monika Roman), A.N.; data curation,M.R. (Monika Roman), M.R. (Michał Roman); formal analysis, M.R. (Michał Roman), M.R. (Monika Roman);methodology, M.R. (Monika Roman), M.R. (Michał Roman); resources, M.R. (Michał Roman), M.R. (Monika Roman);visualization, A.N., M.R. (Michał Roman), M.R. (Monika Roman); writing—original draft, M.R. (Monika Roman),M.R. (Michał Roman), A.N.; writing—review and editing, M.R. (Monika Roman), M.R. (Michał Roman), A.N. Allauthors have read and agreed to the published version of the manuscript.
Funding: This research received no external funding.
Acknowledgments: Authors would like to thank reviewers for their helpful and constructive comments andsuggestions that greatly contributed to improving the final version of this paper.
Conflicts of Interest: The authors declare no conflict of interest.
References
1. World Tourism Organization (UNWTO). World Tourism Barometer; World Tourism Organization: Madrid,Spain, 2017; Volume 15, pp. 1–2. Available online: https://www.e-unwto.org/doi/pdf/10.18111/
wtobarometereng.2017.15.6.1 (accessed on 10 December 2019).2. World Bank Group. Tourism for Development. 20 Reasons Sustainable Tourism Counts for Development;
Public Disclosure Authorized. Knowledge Series; International Finance Corporation, World BankGroup: Washington, DC, USA, 2017; p. 8. Available online: http://documents.worldbank.org/
curated/en/558121506324624240/pdf/119954-WP-PUBLIC-SustainableTourismDevelopment.pdf (accessed on10 December 2019).
3. Hawkins, D.; Mann, S. The World Bank’s Role in Tourism Development. Ann. Tour. Res. 2007, 34, 348–363.[CrossRef]
4. Santos, A.; Cincera, M. Tourism demand, low cost carriers and European institutions: The case of Brussels.J. Transp. Geogr. 2018, 73, 163–171. [CrossRef]
5. Juul, M. Tourism and the European Union. Recent Trends and Policy Developments; European ParliamentaryResearch Service: Brussels, Belgium, 2015; p. 1.
6. Weston, R.; Guia, J.; Mihalic, T.; Prats, L.; Blasco, D.; Ferrer-Roca, N.; Lawler, M.; Jarratt, D. Research forTRAN Committee—European Tourism: Recent Developments and Future Challenges; European Parliament, PolicyDepartment for Structural and Cohesion Policies: Brussels, Belgium, 2019; p. 11.
7. Anastasiadou, C. Tourism and the European Union. In Tourism in the New Europe: The Challenges andOpportunities of EU Enlargement; Hall, D., Smith, M., Marciszewska, B., Eds.; CABI Publishing: Wallingford,UK, 2006; pp. 20–31.
8. Romão, J.; Guerreiro, J.; Rodrigues, P.M.M. Territory and sustainable tourism development: A space-timeanalysis on European regions. Region 2017, 4, 1–17. [CrossRef]
9. Batista e Silva, F.; Herrera, M.A.M.; Rosina, K.; Barranco, R.R.; Freire, S.; Schiavina, M. Analysingspatiotemporal patterns of tourism in Europe at High-Resolution with conventional and big data sources.Tour. Manag. 2018, 68, 101–115. [CrossRef]
10. Hair, J.; Black, W.; Babin, B.; Anderson, R.; Tatham, R. Multivariate Data Analysis; Prentice-Hall:Upper Saddle River, NJ, USA, 1998; pp. 417–440.
11. Zarebski, P.; Kwiatkowski, G.; Malchrowicz-Mosko, E.; Oklevik, O. Tourism Investment Gaps in Poland.Sustainability 2019, 11, 6188. [CrossRef]

Sustainability 2020, 12, 2713 14 of 16
12. Pina, I.P.A.; Delfa, M.T.D. Rural tourism demand by type of accommodation. Tour. Manag. 2005, 26, 951–959.[CrossRef]
13. Wall, G.; Dudych, D.; Hutchinson, J. Point pattern analyses of accommodation in Toronto. Ann. Tour. Res.1985, 12, 603–618. [CrossRef]
14. Lascu, D.N.; Manrai, L.A.; Manrai, A.K.; Gan, A. A cluster analysis of tourist attractions in Spain. Natural andcultural traits and implications for global tourism. Eur. J. Manag. Bus. Econ. 2018, 27, 218–230. [CrossRef]
15. Navrátil, J.; Švec, R.; Pícha, K.; Doležalová, H. The Location of Tourist Accommodation Facilities: A CaseStudy of the Šumava Mts. and South Bohemia Tourist Regions (Czech Republic). Morav. Geogr. Rep. 2012,20, 50–63.
16. Ritchie, J.R.B.; Crouch, G.I. The Competitive Destination: A Sustainable Tourism Perspective; CABI Publishing:Oxon, UK, 2003.
17. Goeldner, C.R.; Ritchie, J.R.B. Tourism: Principles, Practices, Philosophies; Wiley: New York, NY, USA, 2009.18. Bégin, S. The geography of a tourist business: Hotel distribution and urban development in Xiamen, China.
Tour. Geogr. 2000, 2, 448–471. [CrossRef]19. Shoval, N.; Mckercher, B.; NG, E.; Birenboim, A. Hotel location and tourist activity in cities. Ann. Tour. Res.
2011, 38, 1594–1612. [CrossRef]20. Roman, M.; Górecka, A.; Roman, M. Wykorzystanie Transportu Pasazerskiego w Rozwoju Turystyki (The Use of
Passenger Transport in Tourism Development); Wydawnictwo SGGW: Warsaw, Poland, 2018; pp. 13–15. Availableonline: https://witrynawiejska.org.pl/data/Transport%20w%20turystyce.pdf (accessed on 10 December 2019).
21. Enright, M.J.; Newton, J. Tourism destination competitiveness: A quantitative approach. Tour. Manag. 2004,25, 777–788. [CrossRef]
22. Das, J.; Dirienzo, C.E. Tourism competitiveness and the role of fractionalization. Int. J. Tour. Res. 2012, 14,285–297. [CrossRef]
23. Fuchs, M.; Hoepken, W.; Lexhagen, M. Big data analytics for knowledge generation in tourism destinations—Acase from Sweden. J. Destin. Mark. Manag. 2014, 3, 198–209. [CrossRef]
24. Garcia, C.F.; Valverde, I.M.; Mascuñano, P.J.; Gimeno, V.M. Quality Implications of the Use of Big Data inTourism Statistics: Three Exploratory Examples. In Proceedings of the European Conference on Quality inOfficial Statistics (Q2016), Madrid, Spain, 31 May–3 June 2016; Volume 11.
25. Miah, S.J.; Vu, H.Q.; Gammack, J.; McGrath, M. A Big Data Analytics Method for Tourist Behaviour Analysis.Inf. Manag. 2017, 54, 771–785. [CrossRef]
26. Dokmeci, V.; Balta, N. The evolution and distribution of hotels in Istanbul. Eur. Plan. Stud. 1999, 7, 99–109.[CrossRef]
27. Urtasun, A.; Gutierrez, I. Hotel location in tourism cities: Madrid 1936–1998. Ann. Tour. Res. 2006, 33,382–402. [CrossRef]
28. Egan, D.J.; Nield, K. Towards a theory of intraurban hotel location. Urban Stud. 2000, 37, 611–621. [CrossRef]29. Shoval, N. The geography of hotels in cities: An empirical validation of a forgotten theory. Tour. Geogr. 2006,
8, 56–75. [CrossRef]30. Xiao, H.; Smith, S.L.J. Case studies in tourism research: A state-of-the-art analysis. Tour. Manag. 2006, 27,
738–749. [CrossRef]31. Soybali, H.H. Temporal and Spatial Aspects of Tourism in Turkey. Ph.D. Thesis, Bournemouth University,
Bournemouth, UK, 2005.32. Raun, J.; Ahas, R.; Tiru, M. Measuring tourism destinations using mobile tracking data. Tour. Manag. 2016,
57, 202–212. [CrossRef]33. Peng, X.; Huang, Z. A Novel Popular Tourist Attraction Discovering Approach Based on Geo-Tagged Social
Media Big Data. ISPRS Int. J. Geo-Inf. 2017, 6, 216. [CrossRef]34. Del Vecchio, P.; Mele, G.; Ndou, V.; Secundo, G. Open Innovation and Social Big Data for Sustainability:
Evidence from the Tourism Industry. Sustainability 2018, 10, 3215. [CrossRef]35. Guilarte, Y.P.; Quintans, D.B. Using Big Data to Measure Tourist Sustainability: Myth or Reality. Sustainability
2019, 11, 5641. [CrossRef]
Sustainability 2020, 12, 2713 15 of 16
36. Papapavlou-Ioakeimidou, S.; Rodolakis, N.; Kalfakakou, R. Spatial structure of tourist supply and relationsbetween sub-regions: A case study in a coastal region. In Proceedings of the Conference Paper 46thCongress of the European Regional Science Association (ERSA): Enlargement, Southern Europe and theMediterranean, University of Thessaly—Department of Planning and Regional Development, Volos, Greece,30 August–3 September 2006.
37. Borzyszkowski, J.; Marczak, M.; Zarebski, P. Spatial diversity of tourist function development: Themunicipalities of Poland’s West Pomerania province. Acta Geogr. Slov. 2016, 56, 267–276. [CrossRef]
38. Navarro Chavez, J.C.L.; Zamora Torres, A.I.; Cano Torres, M. Hierarchical Cluster Analysis of Tourismfor Mexico and the Asia-Pacific Economic Cooperation (APEC) Countries. Tur. Anal. 2016, 27, 235–255.[CrossRef]
39. Swistak, E.; Swiatkowska, M. Spatial Diversity of Accommodation as a Determinant of Tourism in Poland.Econ. Probl. Tour. 2018, 2, 201–210. [CrossRef]
40. Gawronski, K.; Król, K.; Gawronska, G.; Lesniara, N. Spatial diversity of tourism attractiveness of the NowySacz district, using the Wrocław taxonomic method. Geomat. Landmanag. Landsc. 2019, 2, 37–54. [CrossRef]
41. Rodriguez Rangel, M.C.; Sanchez Rivero, M. Spatial Imbalance Between Tourist Supply and Demand: TheIdentification of Spatial Clusters in Extremadura, Spain. Sustainability 2019, 12, 1651. [CrossRef]
42. Kolvekova, G.; Liptakova, E.; Strba, L.; Krsak, B.; Sidor, C.; Cehlar, M.; Khouri, S.; Behun, M. RegionalTourism Clustering Based on the Three Ps of the Sustainability Services Marketing Matrix: An Example ofCentral and Eastern European Countries. Sustainability 2019, 11, 400. [CrossRef]
43. Dwyer, L.; Gill, A.; Seetaram, N. Handbook of Research Methods in Tourism: Quantitative and QualitativeApproaches; Edward Elgar Publishing: Cheltenham, UK, 2012; pp. 212–226.
44. Ward, J.H. Hierarchical Grouping to Optimize an Objective Function. J. Am. Stat. Assoc. 1963, 58, 236–244.[CrossRef]
45. Murtagh, F. Ward’s Hierarchical Agglomerative Clustering Method: Which Algorithms Implement Ward’sCriterion? J. Classif. 2014, 31, 274–295. [CrossRef]
46. Roman, M.; Roman, M. The similarity of the structure of foreign trade in dairy products in the European Union.In Proceedings of the 27th International Scientific Conference Agrarian Perspectives, Prague, Czech Republic,19–20 September 2018; pp. 297–303.
47. Sarle, W.S. Cubic Clustering Criterion; Technical Report A-108; SAS Institute Inc.: Cary, NC, USA, 1983.48. Calinski, T.; Harabasz, J.A. Dendrite Method for Cluster Analysis. Commun. Stat. Theory Methods 1974, 3,
1–27. [CrossRef]49. UNWTO. Tourism Statistics. 2017. Available online: https://www.e-unwto.org/action/doSearch?ConceptID=
1070&target=topic (accessed on 1 September 2019).50. Eurostat. Tourism Statistics. 2017. Available online: https://ec.europa.eu/eurostat/statistics-explained/images/
8/88/Travel_receipts_and_expenditure_in_balance_of_payments%2C_2012%E2%80%932017.png (accessedon 1 December 2019).
51. Soysal-Kurt, H. Measuring Tourism Efficiency of European Countries by Using Data Envelopment Analysis.Eur. Sci. J. 2017, 13, 31–49. [CrossRef]
52. Jackman, M.; Lorde, T.; Lowe, S.; Alleyne, A. Evaluating tourism competitiveness of small island developingstates: A revealed comparative advantage approach. Anatolia 2011, 22, 350–360. [CrossRef]
53. Knowles, T. Zarzadzanie Hotelarstwem i Gastronomia (Hotel and Catering Management); Wydawnictwo PWE:Warszawa, Poland, 2001.
54. Ntibanyurwa, A. Tourism as a factor of development. Sustain. Tour. 2006, 97, 73–84.55. Kang, S.; Kim, J.; Nicholls, S. National tourism policy and spatial patterns of domestic tourism in South
Korea. J. Travel Res. 2014, 53, 791–804. [CrossRef]56. Bhatia, A.K. International Tourism Management; Sterling Publishers Pvt. Ltd.: New Delhi, India, 2001; p. 539.57. Bramwell, B.; Lane, B. Tourism Collaboration and Partnerships: Politics, Practice and Sustainability; Channel View
Publications: Clevedon, UK, 2000; p. 351.58. Capone, F. Tourist desinations, clusters, and competitiveness: An introduction. In Tourist Clusters, Destinations
and Competitiveness: Theoretical Issues and Empirical Evidences; Capone, F., Ed.; Routledge: Abingdon, UK,2016; pp. 1–12.
Sustainability 2020, 12, 2713 16 of 16
59. Da Cunha, S.K.; da Cunha, J.C. Tourism cluster competitiveness and sustainability: Proposal for a systemicmodel to measure the impact of tourism on local development. Bar Braz. Admin. Rev. 2005, 2, 47–62.[CrossRef]
60. Roman, M.; Roman, M. Bicycle Transport as an Opportunity to Develop Urban Tourism—Warsaw Example.Procedia Soc. Behav. Sci. 2014, 151, 295–301. [CrossRef]
61. Hjalager, A. A review of innovation research in tourism. Tour. Manag. 2010, 31, 1–12. [CrossRef]62. Hu, M.M.; Horn, J.S.; Sun, Y.H. Hospitality teams: Knowledge sharing and service innovation performance.
Tour. Manag. 2009, 30, 41–50. [CrossRef]63. Hall, C.M.; Williams, A.M. Tourism and Innovation; Routledge: London, UK, 2008.
© 2020 by the authors. Licensee MDPI, Basel, Switzerland. This article is an open accessarticle distributed under the terms and conditions of the Creative Commons Attribution(CC BY) license (http://creativecommons.org/licenses/by/4.0/).


![Transmit Diversity v. Spatial Multiplexing in Modern … · Transmit Diversity v. Spatial Multiplexing in ... also considered for microwave links [7]. ... diversity, and thus reliability](https://img.dokumen.tips/doc/110x75/5ae13be77f8b9ac0428e7a69/transmit-diversity-v-spatial-multiplexing-in-modern-diversity-v-spatial-multiplexing.jpg)