Embed Size (px)
Citation preview

Rev. Chilena Ent.2008, 34: 37-55
SPATIAL DISTRIBUTION AND MAPPING OF JACOBIASCA LYBICA (BERGEVIN AND ZANON) (HEMIPTERA: CICADELLIDAE) EGG POPULATIONS IN
IRRIGATED SHERRY VINEYARDS
DISTRIBUCIÓN ESPACIAL Y MAPEO DE JACOBIASCA LYBICA (BERGEVIN Y ZANON) (HEMIPTERA: CICADELLIDAE) DE LAS POBLACIONES DE HUEVOS EN
VIÑEDOS DE REGADÍO
José Francisco ramírez-Dávila1 y elvia Porcayo-camargo2
ABSTRACT
The green cicadellid Jacobiasca lybica (Bergevin and Zanon) (Hemiptera: Cicadellidae) has recently become in one of the most serious pests on vineyards in the Southern regions of the Iberian Peninsula. In order to characterize the spatial and temporal variability of the density of J. lybica eggs, we employed the spatial statistical techniques such as Geostatistics and Spatial Analysis by Distance Index (SADIE). The density and spatial distribution of J. lybica varied considerably among the years. Spherical and exponential functions provided the best fit for cross-validation. The spatial distribution of J. lybica eggs was aggregated (non-random spatial dependence) in all data. J. lybica density data showed moderate spatial dependence. The nugget and sill varied considerably. J. lybica density maps achieved by kriging were used to estimate the percentage of susceptible surface that should be treated with a site-specific insecticide treatment based on an estimated economic threshold for each date. The index Ia and Ja showed aggregate distribution. Following the completion and analysis of the maps of infestation more than one centre of aggregation of this insect pest was observed. The J. lybica infested areas varied considerably among dates. About 73 and 8% of the total area was infested with J. lybica. So, if an insecticide application was limited to the areas exceeding the economic threshold, the average reduction in insecticide cost achieved in vineyard could be around 42%. J. lybica has been shown to have relatively stable patches over time and space.
Key words: Geostatistics, kriging, site-specific pest management, semivariogram, patch stability, SADIE.
RESUMEN
El cicadelido verde Jacobiasca lybica (Bergevin y Zanon) (Hemiptera: Cicadellidae) recientemente se ha convertido en una de las más graves plagas en los viñedos del sur de las regiones de la Península Ibérica. Con el fin de caracterizar la variabilidad espacial y temporal de la densidad de huevos de J. lybica, se emplearon técnicas de la estadística espacial tales como la Geoestadística y Análisis Espacial por Índices de Distancia (SADIE). La densidad y distribución espacial de J. lybica variaba considerablemente entre los años.
1 Profesor Investigador de la Facultad de Ciencias Agrícolas, UAEM, Centro Universitario el Cerrillo Piedras Blancas Km. 15 Carr. Toluca - Ixtlahuaca Entronque al Cerrillo. C.P. 50200. Toluca, México. E-mail: [email protected] Pasante de la Facultad de Geografía UAEM, Cerro de Coatepec s/n Ciudad Universitaria, C.P. 50000, Toluca, México. E-mail: [email protected]
(Recibido: 16 mayo 2008; Aceptado 27 octubre 2008)
38 Rev. Chilena Ent. 34, 2008
La distribución espacial de los huevos de J. lybica fue agregada (no aleatoria dependencia espacial) en todos los datos. J. lybica densidad de los datos mostraron dependencia espacial moderada. El efecto pepita varió considerablemente. J. lybica densidad de los mapas obtenidos por kriging los cuales fueron utilizados para estimar el porcentaje de la superficie susceptible de que deben ser tratados con un sitio específico tratamiento con insecticida sobre la base de un umbral económico estimado para cada fecha. Las áreas infestadas por J. lybica variaban considerablemente entre las fechas. Los índices Ia y Ja mostraron una distribución agregada. Tras la realización y análisis de los mapas de infestación se observó más de un centro de agregación de este insecto plaga. Cerca de 73 y 8% de la superficie total fue infestada por J. lybica. Por lo tanto, si la aplicación de un insecticida se limitaba a las zonas superiores a los umbrales económicos, el promedio de reducción de los costos en insecticidas realizados en viñedo podría situarse en torno a 42%. J. lybica ha demostrado tener manchones relativamente estables en el tiempo y el espacio.
Palabras clave: Geoestadística, krigeado, sitio específico de manejo de plagas, semivariograma, estabilidad espacio temporal, SADIE.
INTRODUCTION
Insect populations are typically spatially heterogeneous in their densities. This heterogeneity is often of considerable importance for the development of sampling procedures (Southwood, 1978), for understanding predator-prey relationships (Hassell and May, 1974), for understanding intraspecific competition (Iwao, 1970), and in the development of rational pest-management strategies (Hughes and McKinlay, 1988).
For these reasons, a great deal of effort has been invested in characterizing spatial patterns of insect densities. Most earlier studies have attempted to describe spatial patterns with the use of dispersion index such as s2/x (David and Moore, 1954), coefficients of Taylor’s power law (Taylor, 1984), Morisita index (Morisita, 1959), Lloyd’s patchiness index (Lloyd, 1967) and Iwao’s patchiness regression coefficients (Iwao, 1972). These index focused on the frequency distribution of samples (mostly quantify the relationship of the sample variance to the mean) but ignored the insect explicit spatial location. This property produces certain undesirable effects: a) these index often fails to differentiate among different spatial patterns (Hurlbert, 1990), and b) their descriptions
of spatial pattern greatly depend on the size of sample units (Sawyer, 1989). Therefore, alternative methods that rely on the geographic location of samples must be used to study their spatial arrangement. Geostatistical techniques offer such alternative approach.
Geostatistics is a branch of spatial statistic that was originally developed for the mining industry in the 1950s and 1960s. The technique is now widely recognized as an important tool for the estimation of the abundance and distribution of natural resources (Rossi et al., 1992). Unlike the traditional procedures commonly used in biological studies, in which mean-variance relationships are evaluated from observations assumed to be random and independent, spatial statistical procedures recognize that sample observations may be dependent, and nonrandom sampling strategies may be more useful (Schotzko and O’Keeffe, 1989). Consequently, spatial analysis measures the extent of dependence in the sample data by evaluating variance as a function of the distance and direction between observations. Recently there has been considerable interest in their application to study spatial distribution of insects (Schotzko and O'Keeffe, 1989; Liebhold et al., 1993; Crist, 1998; Schotzko and
39Ramírez-Dávila y Porcayo-Camargo: Spatial distribution of Jacobiasca lybica
Quisenberry, 1999). Therefore, application of geostatistics techniques allows the production of maps as the first step for spatially explicit management Fleischer et al. (1999).
Among the new developments of the spatial statistical studies, a new methodology has recently appeared; it is called Spatial Analysis Distance Indexes (SADIE by its initials in English) that has been developed by Dr. Joe N. Perry of the Department of Entomology and Nematology the Rothamsted Experiment Station (UK). SADIE identifies the data model for two-dimension space, with associated index of aggregation and a test for the diversion of randomness based on an algorithm attraction, which features a biological model for dispersing individuals from a source in which each individual is assigned a territory dynamic (Perry, 1995; Perry et al., 1996). This method makes use of data concerning each sampling and there is no restriction on the location of the sampling units.
J. lybica has recently become one of the most serious problems in vineyards in the Southern regions of the Iberian Peninsula, producing important economic injuries (Araújo, 1988; Quartau et al., 1989; Quartau and Rebelo, 1992; Ocete et al., 1999). In spite of the high incidence of its infestations, at present little is known about its spatial distribution and biology.
The objectives of this study were to: 1) characterise the spatial and temporal variability of J. lybica eggs in vineyards; 2) investigate the feasibility of developing accurate maps of J. lybica and 3) develop site-specific insecticide application maps for areas that exceeded an economic threshold.
MATERIAL AND METHODS
Study area and sampling
Field studies of J. lybica were conducted at Jerez de la Frontera (Cádiz, Spain). An area measuring 35 m wide by 55 m long was selected for the
intensive survey in 2005 and 2006. Rows were oriented south-north across the study area.
J. lybica egg density samples were collected on a 2- by 9-m grid pattern, resulting in a total of 126 sampling units. The position of each grid point was georeferenced using a Differential Global Positioning System (DGPS). At each node, the number of eggs of J. lybica was counted on ten leaves (López, 1997). Samplings (Table 1) was carried out monthly during the months of greatest insect activity, between June and October (Toledo, 1992). In year 2005 the experimental plot was treated with Malation to control J. lybica (7 of August).
An economic threshold (ET) was previously estimated at 1 egg plant–1 (Toledo, 1992). So when J. lybica egg density exceeded the ET a control action was required.
Exploratory statistical analysis
Egg density from each date was treated as a study case and was analysed statistically. Data distribution was described using classical descriptors (mean, standard deviation and skewness). The descriptive statistics of eggs density suggested that they were not normally distributed (skewness between 1 and –2) (Table 2) and therefore log transformation, log10(n+1), was used for geostatistical analysis.
Geostatistical analysis
The spatial variation of J. lybica eggs was described and quantified (Isaaks and Srivastava, 1989; Webster and Oliver, 1990). The variogram, a central tool of geostatistics, describes the structure and spatial scale of variation by measuring the degree of spatial correlation between sampling points. Geostatistical prediction or kriging enables a property to be predicted optimally at an unsampled location. Prediction of the property can be made for any points points (punctual kriging) or over certain areas (block kriging), and estimates are unbiased and have minimum variance.

40 Rev. Chilena Ent. 34, 2008
Semivariogram models were fitted to experimental semivariogram values to assess the spatial structure of variation in eggs plant-1. Isotropy was assumed because experimental semivariograms were fitted in four directions (0, 45, 90 and 135º) over the field and directional differences were not seen. Thus, omnidirectional experimental semivariograms were computed for interval distances of 1 m as follows (Journel and Huijbregts, 1978; Isaaks and Srivastava, 1989):
below, was used to estimate quantity of eggs at the location of the deleted sample using the remaining samples. Differences between estimated and experimental values of number of eggs were summarized using the following cross-validation statistics: mean estimation error (MEE), mean squared error (MSE), and standardized mean square error (SMSE) (Isaaks and Srivastava, 1989; Hevesi et al., 1992). A model was considered to ensure unbiased estimates of number of eggs if the MEE was not significantly different than zero and was considered accurate if the MSE was, as a practical rule, less than the variance of sample values (Hevesi et al., 1992). The SMSE indicated the consistency of the observed MSE with the calculated estimation uncertainty, expressed as the kriging estimation error variance, described below (Journel and Huijbregts, 1978; Isaaks and Srivastava, 1989). Model validity was satisfied if the SMSE was within the interval 1±2(2/m)0.5 (Hevesi et al., 1992).
This geostatistical technique provides the best linear unbiased estimates (BLUE) of a particular variable at a point where it is unknown (Journel and Huijbregts, 1978). The geostatistical analysis was performed with the geostatistical package COKRIG6 (Hevesi, 1992, personal supply). As a final step, SURFER 9.0 was used to map kriged estimates.
Site-Specific insecticide application
The different J. lybica egg density maps achieved by kriging were used to estimate the percentage of insect-free surface and the percentage of surface susceptible to be treated with a site-specific insecticide treatment. Insecticide treatment was assumed to be needed for a J. lybica egg density exceeding 1 egg plant–1 (Toledo, 1992).
Spatial and temporal stability
Short-term (within a year) and long-term (among the years) spatial stability was studied
Where:
γ*(h) = experimental semivariogram value at distance interval h.
N(h) = number of sample value pairs within the distance interval h.
z(xi), z(xi+h) = sample values at two sample points separated by a distance interval h.
Several semivariogram functions (Isaaks and Srivastava, 1989) were evaluated to identify the model that produced the best fit. The best fit models were used to perform ordinary point kriging on a regular grid of 1 m x 1 m.
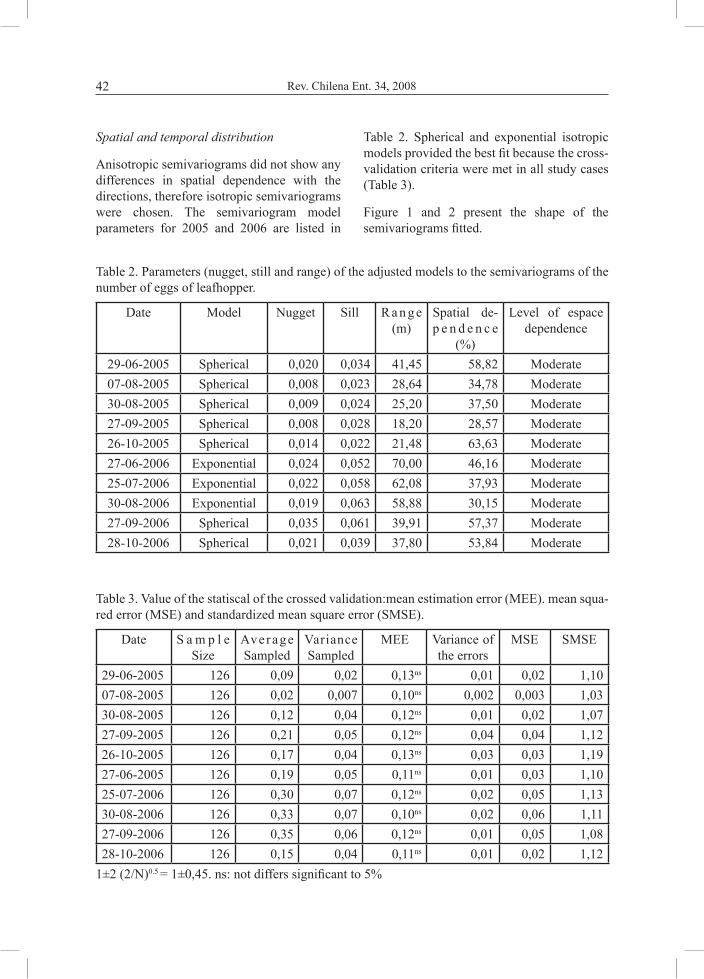
In order to compare the nugget magnitude, values of spatial dependence were calculated after Robertson (1995) as (1-nugget/sill)*100, indicating spatial distribution as random if <26%, moderately if between 26%-75% or strong spatial dependence if >75% (Gonzalez-Andujar et al., 2001).
A cross-validation procedure was performed to check model validity. The estimated model parameters were modified in a "trial-and-error" procedure until adequate cross-validation statistics were obtained (Isaaks and Srivastava, 1989). To cross-validate a semivariogram model, each sample value was deleted one by one from the data set and kriging, described
2)(
1
* )]()([)(2
1)( ∑=
−+=hN
iii xzhxz
hNhγ
41Ramírez-Dávila y Porcayo-Camargo: Spatial distribution of Jacobiasca lybica
using the bivariate Cramér-von Mises test (Syrjala, 1996). This test is an extension of the univariate Cramér-von Mises test used to contrast the difference between two cumulative distribution functions (Г1and Г2) (Conover, 1980). The test is defined by four statistics,
more clusters, for which its value is equal to or less than the unit.
Temporal stability
The association index Im (Perry 1997, 1998; Korie et al., 2000) was applied to assess the stability of spatial distribution between sampling periods. The index Im allows a direct comparison between two sets of counts (in these cases successive weeks and years). The index presents association (spatial stability) if Im>1. The probability that two distributions are associated is considered significant if Pm<0.025. A high level of association between eggs spatial distributions in successive samples would give an indication of their temporal stability.
RESULTS
Geostatistical analysis
Exploratory Statistical Analysis
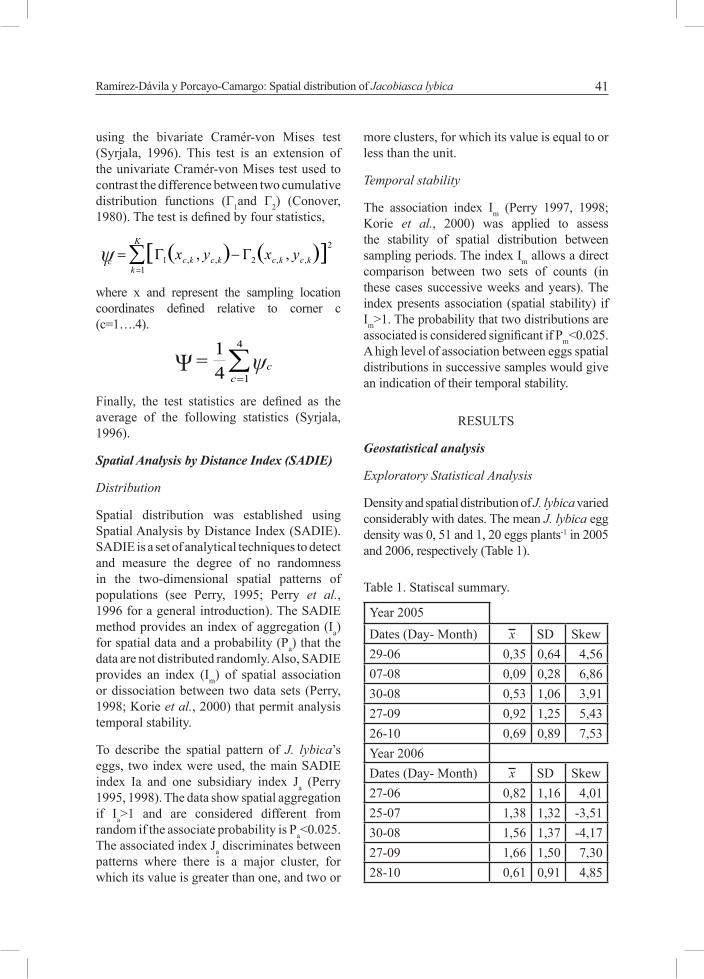
Density and spatial distribution of J. lybica varied considerably with dates. The mean J. lybica egg density was 0, 51 and 1, 20 eggs plants-1 in 2005 and 2006, respectively (Table 1).
ψ ( ) ( )[ ]∑=
Γ−Γ=K
kkckckckcc yxyx
1
2
,,2,,1 ,,
∑=
=4
141
ccΨ ψ
where x and represent the sampling location coordinates defined relative to corner c (c=1….4).
Year 2005Dates (Day- Month) x SD Skew29-06 0,35 0,64 4,5607-08 0,09 0,28 6,8630-08 0,53 1,06 3,9127-09 0,92 1,25 5,4326-10 0,69 0,89 7,53Year 2006Dates (Day- Month) x SD Skew27-06 0,82 1,16 4,0125-07 1,38 1,32 -3,5130-08 1,56 1,37 -4,1727-09 1,66 1,50 7,3028-10 0,61 0,91 4,85
Finally, the test statistics are defined as the average of the following statistics (Syrjala, 1996).
Spatial Analysis by Distance Index (SADIE)
Distribution
Spatial distribution was established using Spatial Analysis by Distance Index (SADIE). SADIE is a set of analytical techniques to detect and measure the degree of no randomness in the two-dimensional spatial patterns of populations (see Perry, 1995; Perry et al., 1996 for a general introduction). The SADIE method provides an index of aggregation (Ia) for spatial data and a probability (Pa) that the data are not distributed randomly. Also, SADIE provides an index (Im) of spatial association or dissociation between two data sets (Perry, 1998; Korie et al., 2000) that permit analysis temporal stability.
To describe the spatial pattern of J. lybica’s eggs, two index were used, the main SADIE index Ia and one subsidiary index Ja (Perry 1995, 1998). The data show spatial aggregation if Ia>1 and are considered different from random if the associate probability is Pa<0.025. The associated index Ja discriminates between patterns where there is a major cluster, for which its value is greater than one, and two or
Table 1. Statiscal summary.
42 Rev. Chilena Ent. 34, 2008
Spatial and temporal distribution
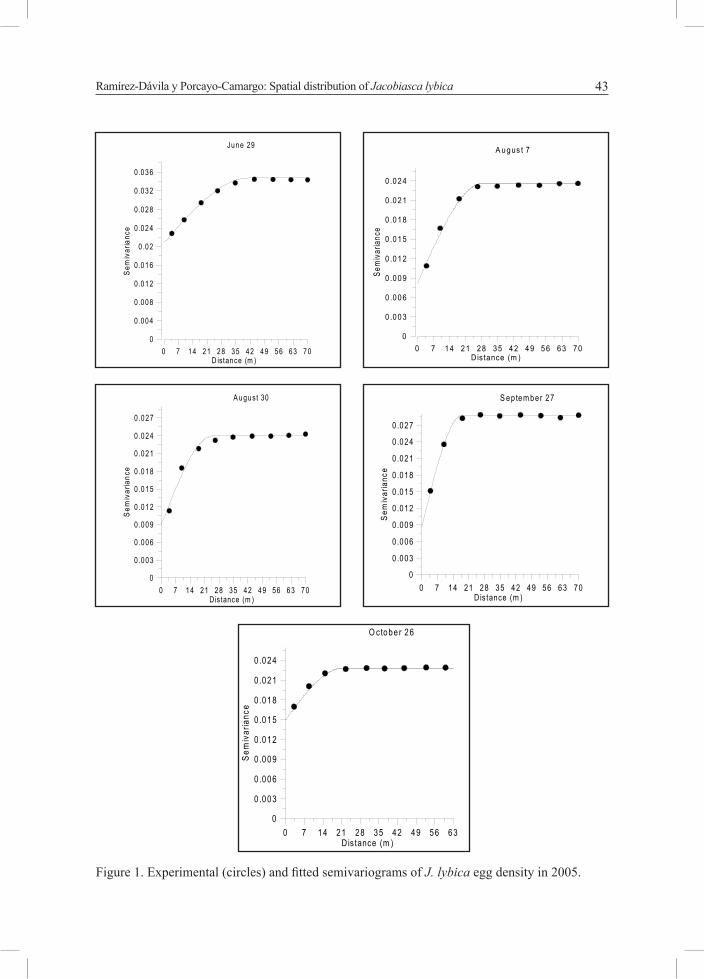
Anisotropic semivariograms did not show any differences in spatial dependence with the directions, therefore isotropic semivariograms were chosen. The semivariogram model parameters for 2005 and 2006 are listed in
Table 2. Spherical and exponential isotropic models provided the best fit because the cross-validation criteria were met in all study cases (Table 3).
Figure 1 and 2 present the shape of the semivariograms fitted.
Date Model Nugget Sill R a n g e (m)
Spatial de-p e n d e n c e
(%)
Level of espace dependence
29-06-2005 Spherical 0,020 0,034 41,45 58,82 Moderate07-08-2005 Spherical 0,008 0,023 28,64 34,78 Moderate30-08-2005 Spherical 0,009 0,024 25,20 37,50 Moderate27-09-2005 Spherical 0,008 0,028 18,20 28,57 Moderate26-10-2005 Spherical 0,014 0,022 21,48 63,63 Moderate27-06-2006 Exponential 0,024 0,052 70,00 46,16 Moderate25-07-2006 Exponential 0,022 0,058 62,08 37,93 Moderate30-08-2006 Exponential 0,019 0,063 58,88 30,15 Moderate27-09-2006 Spherical 0,035 0,061 39,91 57,37 Moderate28-10-2006 Spherical 0,021 0,039 37,80 53,84 Moderate
Date S a m p l e Size
Average Sampled
Variance Sampled
MEE Variance of the errors
MSE SMSE
29-06-2005 126 0,09 0,02 0,13ns 0,01 0,02 1,1007-08-2005 126 0,02 0,007 0,10ns 0,002 0,003 1,0330-08-2005 126 0,12 0,04 0,12ns 0,01 0,02 1,0727-09-2005 126 0,21 0,05 0,12ns 0,04 0,04 1,1226-10-2005 126 0,17 0,04 0,13ns 0,03 0,03 1,1927-06-2005 126 0,19 0,05 0,11ns 0,01 0,03 1,1025-07-2006 126 0,30 0,07 0,12ns 0,02 0,05 1,1330-08-2006 126 0,33 0,07 0,10ns 0,02 0,06 1,1127-09-2006 126 0,35 0,06 0,12ns 0,01 0,05 1,0828-10-2006 126 0,15 0,04 0,11ns 0,01 0,02 1,12
Table 2. Parameters (nugget, still and range) of the adjusted models to the semivariograms of the number of eggs of leafhopper.
Table 3. Value of the statiscal of the crossed validation:mean estimation error (MEE). mean squa-red error (MSE) and standardized mean square error (SMSE).
1±2 (2/N)0.5 = 1±0,45. ns: not differs significant to 5%
43Ramírez-Dávila y Porcayo-Camargo: Spatial distribution of Jacobiasca lybica
Figure 1. Experimental (circles) and fitted semivariograms of J. lybica egg density in 2005.
0 7 14 21 28 35 42 49 56 63 70D istance (m )
0
0.004
0.008
0.012
0.016
0 .02
0.024
0.028
0.032
0.036
Sem
ivar
ianc
e
June 29
0 7 14 21 28 35 42 49 56 63 70Distance (m )
0
0 .003
0 .006
0 .009
0 .012
0 .015
0 .018
0 .021
0 .024
Sem
ivaria
nce
A ugus t 7
0 7 14 21 28 35 42 49 56 63 70Distance (m )
0
0 .003
0 .006
0 .009
0 .012
0 .015
0 .018
0 .021
0 .024
0 .027
Sem
ivar
ianc
e
A ugust 30
0 7 14 21 28 35 42 49 56 63 70Distance (m )
0
0 .003
0 .006
0 .009
0 .012
0 .015
0 .018
0 .021
0 .024
0 .027
Sem
ivar
ianc
e
S ep tem ber 27
0 7 14 21 28 35 42 49 56 63Distance (m )
0
0 .003
0 .006
0 .009
0 .012
0 .015
0 .018
0 .021
0 .024
Sem
ivar
ianc
e
O c tobe r 26

44 Rev. Chilena Ent. 34, 2008
Figure 2. Experimental (circles) and fitted semivariograms of J. lybica egg density in 2006.
0 7 14 21 28 35 42 49 56 63 70Distance (m )
0
0 .006
0 .012
0 .018
0 .024
0 .03
0 .036
0 .042
0 .048
0 .054
Sem
ivar
ianc
e
June 27
0 7 14 21 28 35 42 49 56 63Distance (m )
0
0 .006
0 .012
0 .018
0 .024
0 .03
0 .036
0 .042
0 .048
0 .054
Sem
ivar
ianc
e
Ju ly 25
0 7 14 21 28 35 42 49 56 63Distance (m )
0
0 .007
0 .014
0 .021
0 .028
0 .035
0 .042
0 .049
0 .056
0 .063
Sem
ivar
ianc
e
A ugust 30
0 7 14 21 28 35 42 49 56 63 70Distance (m )
0
0 .007
0 .014
0 .021
0 .028
0 .035
0 .042
0 .049
0 .056
0 .063
Sem
ivar
ianc
eSep tem ber 27
0 7 14 21 28 35 42 49 56 63 70Distance (m )
0
0 .005
0 .01
0 .015
0 .02
0 .025
0 .03
0 .035
0 .04
Sem
ivar
ianc
e
O c tobe r 28

45Ramírez-Dávila y Porcayo-Camargo: Spatial distribution of Jacobiasca lybica
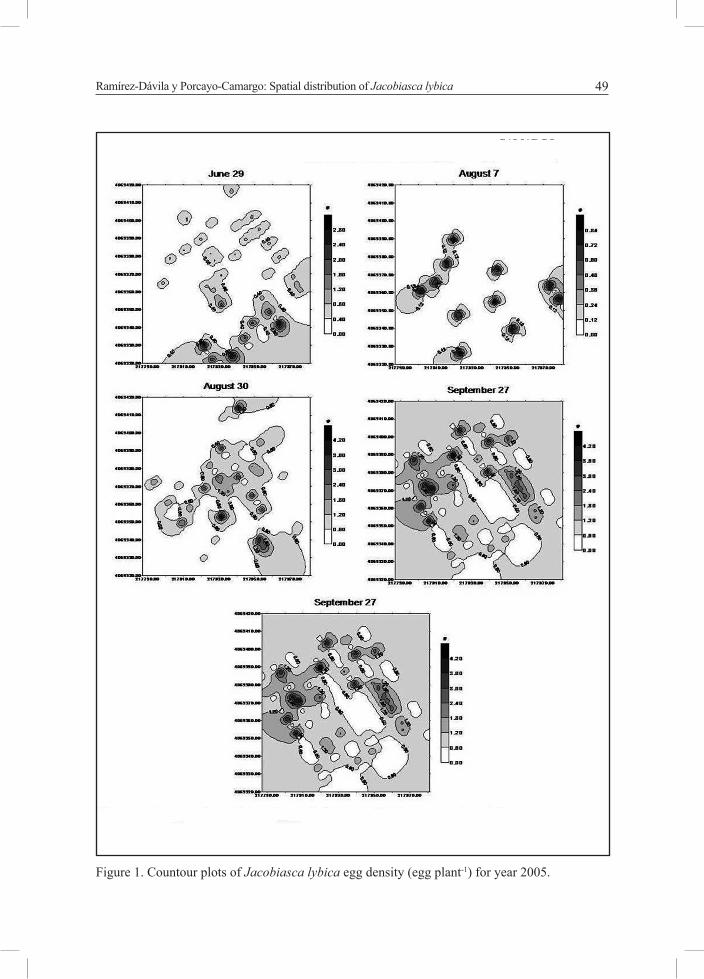
Mapping
The J. lybica egg density maps for each year are shown in Figure 3 and 4. A visual assessment reveals a distinct aggregation depending on dates.
Site-specific insecticide application
The use of the geostatistics allows the elaboration of maps. These resulting maps present clearly areas of variable densities and can lead accurately to the site-specific pest management (Fleischer et al., 1997). The J. lybica infested areas varied considerably between dates. About 73 and 8% of the total area was infested (Table 4).
The results of comparing the maps of density within and between years are specified in the Tables 5 and 6. Results indicate that within years there is some stability and between years the stability is lower, possibly by the action of the application of insecticides.
Date Total area infested (%)
29-06-2005 73,0
07-08-2005 8,7
30-08-2005 26,2
27-09-2005 48,4
26-10-2005 46,8
27-06-2006 54,8
25-07-2006 40,5
30-08-2006 36,5
27-09-2006 26,2
28-10-2006 57,9
Table 4. Percentage of total area infested (J. lybica density ≥ 1 egg plants-1 ).
Y e a r 2005
ψ 2005 Y e a r 2006
ψ2006
29-06 vs. 07-08
1,18s 27-06 vs. 25-07
1,58s
07-08 vs. 30-08
1,77s 25-07 vs 30-08
0,30ns
30-08 vs. 27-09
0,12ns 30-08 vs. 27-09
0,33ns
27-09 vs. 26-10
0,19ns 27-09 vs. 28-10
1,27s
Table 5. Bivariate Crámer-von Mises compa-rison of egg maps within years.
ns: not differs significant to 5%
Date Compared ψ29-06-05 vs. 27-06-06 1,64s
07-08-05 vs. 25-07-06 2,76s
30-08-05 vs. 30-08-06 2,09s
27-09-05 vs. 27-09-06 0,26ns
26-10-05 vs. 28-10-06 0,16ns
ns: not differs significant to 5%
Table 6. Bivariate Crámer-von Mises compa-rison of egg maps between years.
Spatial Analysis by Distance Index (SADIE)
Spatial distribution
In all the cases, the sample variance exceeded the mean, indicating overdispersion (Table 8). By 7 of August 2005 there was a strong reduction (75%) in the egg population compared to the previous sample as a consequence of an insecticide application (Table 7). There was a higher egg density in 2006 than 2005 probably associated with the insecticide in 2005 (Table 7). In both
46 Rev. Chilena Ent. 34, 2008
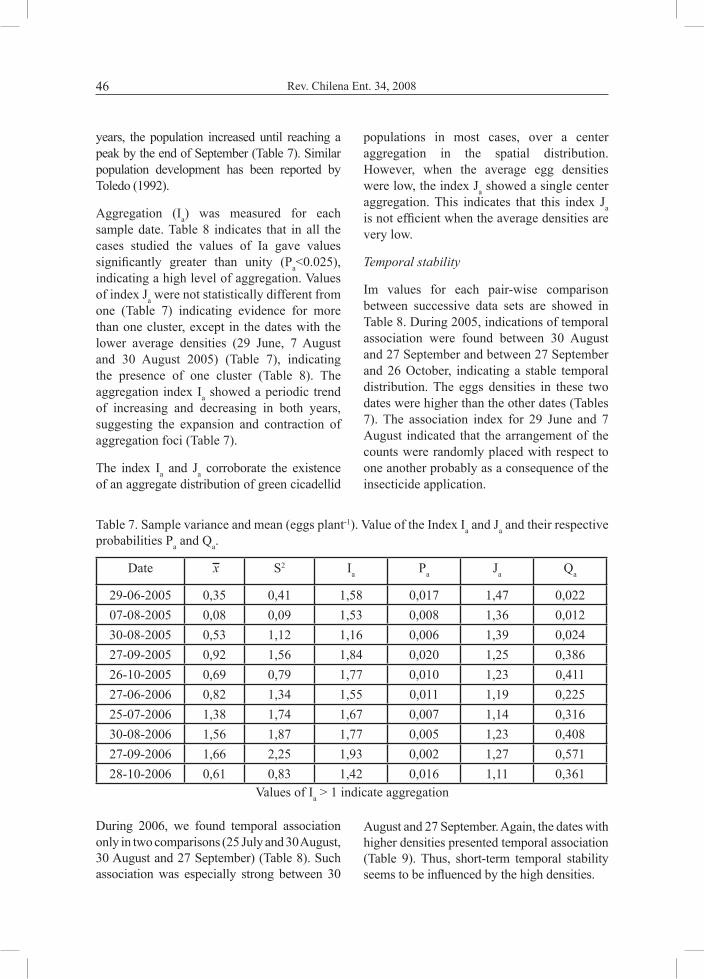
years, the population increased until reaching a peak by the end of September (Table 7). Similar population development has been reported by Toledo (1992).
Aggregation (Ia) was measured for each sample date. Table 8 indicates that in all the cases studied the values of Ia gave values significantly greater than unity (Pa<0.025), indicating a high level of aggregation. Values of index Ja were not statistically different from one (Table 7) indicating evidence for more than one cluster, except in the dates with the lower average densities (29 June, 7 August and 30 August 2005) (Table 7), indicating the presence of one cluster (Table 8). The aggregation index Ia showed a periodic trend of increasing and decreasing in both years, suggesting the expansion and contraction of aggregation foci (Table 7).
The index Ia and Ja corroborate the existence of an aggregate distribution of green cicadellid
populations in most cases, over a center aggregation in the spatial distribution. However, when the average egg densities were low, the index Ja showed a single center aggregation. This indicates that this index Ja is not efficient when the average densities are very low.
Temporal stability
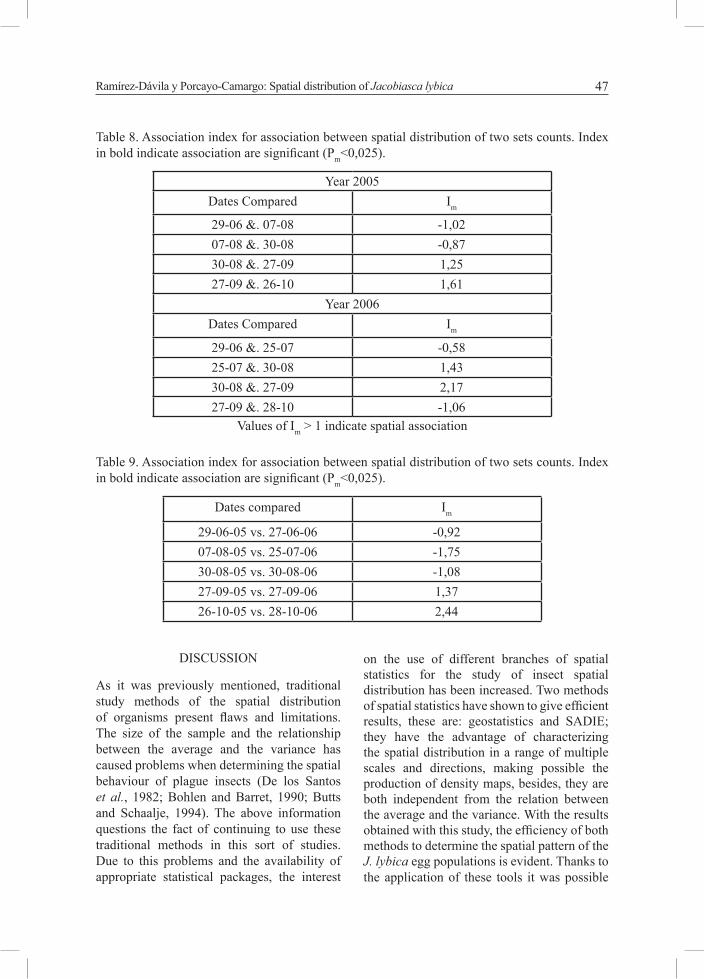
Im values for each pair-wise comparison between successive data sets are showed in Table 8. During 2005, indications of temporal association were found between 30 August and 27 September and between 27 September and 26 October, indicating a stable temporal distribution. The eggs densities in these two dates were higher than the other dates (Tables 7). The association index for 29 June and 7 August indicated that the arrangement of the counts were randomly placed with respect to one another probably as a consequence of the insecticide application.
Date x S2 Ia Pa Ja Qa
29-06-2005 0,35 0,41 1,58 0,017 1,47 0,02207-08-2005 0,08 0,09 1,53 0,008 1,36 0,01230-08-2005 0,53 1,12 1,16 0,006 1,39 0,02427-09-2005 0,92 1,56 1,84 0,020 1,25 0,38626-10-2005 0,69 0,79 1,77 0,010 1,23 0,41127-06-2006 0,82 1,34 1,55 0,011 1,19 0,22525-07-2006 1,38 1,74 1,67 0,007 1,14 0,31630-08-2006 1,56 1,87 1,77 0,005 1,23 0,40827-09-2006 1,66 2,25 1,93 0,002 1,27 0,57128-10-2006 0,61 0,83 1,42 0,016 1,11 0,361
Table 7. Sample variance and mean (eggs plant-1). Value of the Index Ia and Ja and their respective probabilities Pa and Qa.
Values of Ia > 1 indicate aggregation
During 2006, we found temporal association only in two comparisons (25 July and 30 August, 30 August and 27 September) (Table 8). Such association was especially strong between 30
August and 27 September. Again, the dates with higher densities presented temporal association (Table 9). Thus, short-term temporal stability seems to be influenced by the high densities.
47Ramírez-Dávila y Porcayo-Camargo: Spatial distribution of Jacobiasca lybica
Year 2005Dates Compared Im
29-06 &. 07-08 -1,0207-08 &. 30-08 -0,8730-08 &. 27-09 1,2527-09 &. 26-10 1,61
Year 2006Dates Compared Im
29-06 &. 25-07 -0,5825-07 &. 30-08 1,4330-08 &. 27-09 2,1727-09 &. 28-10 -1,06
Table 8. Association index for association between spatial distribution of two sets counts. Index in bold indicate association are significant (Pm<0,025).
Values of Im > 1 indicate spatial association
Table 9. Association index for association between spatial distribution of two sets counts. Index in bold indicate association are significant (Pm<0,025).
Dates compared Im
29-06-05 vs. 27-06-06 -0,9207-08-05 vs. 25-07-06 -1,7530-08-05 vs. 30-08-06 -1,0827-09-05 vs. 27-09-06 1,3726-10-05 vs. 28-10-06 2,44
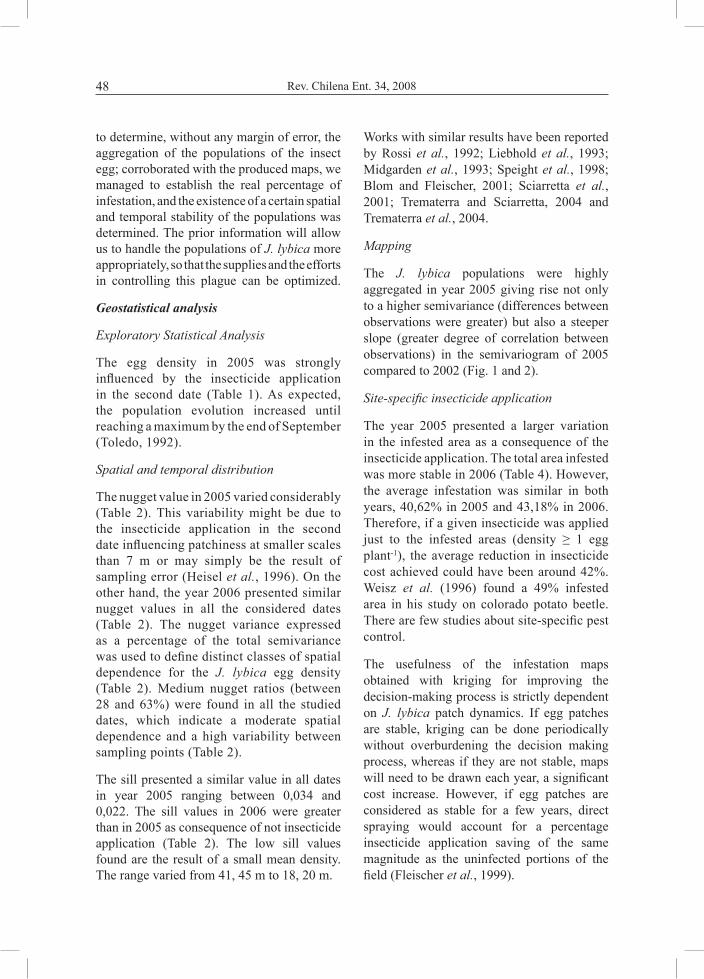
DISCUSSION
As it was previously mentioned, traditional study methods of the spatial distribution of organisms present flaws and limitations. The size of the sample and the relationship between the average and the variance has caused problems when determining the spatial behaviour of plague insects (De los Santos et al., 1982; Bohlen and Barret, 1990; Butts and Schaalje, 1994). The above information questions the fact of continuing to use these traditional methods in this sort of studies. Due to this problems and the availability of appropriate statistical packages, the interest
on the use of different branches of spatial statistics for the study of insect spatial distribution has been increased. Two methods of spatial statistics have shown to give efficient results, these are: geostatistics and SADIE; they have the advantage of characterizing the spatial distribution in a range of multiple scales and directions, making possible the production of density maps, besides, they are both independent from the relation between the average and the variance. With the results obtained with this study, the efficiency of both methods to determine the spatial pattern of the J. lybica egg populations is evident. Thanks to the application of these tools it was possible
48 Rev. Chilena Ent. 34, 2008
to determine, without any margin of error, the aggregation of the populations of the insect egg; corroborated with the produced maps, we managed to establish the real percentage of infestation, and the existence of a certain spatial and temporal stability of the populations was determined. The prior information will allow us to handle the populations of J. lybica more appropriately, so that the supplies and the efforts in controlling this plague can be optimized.
Geostatistical analysis
Exploratory Statistical Analysis
The egg density in 2005 was strongly influenced by the insecticide application in the second date (Table 1). As expected, the population evolution increased until reaching a maximum by the end of September (Toledo, 1992).
Spatial and temporal distribution
The nugget value in 2005 varied considerably (Table 2). This variability might be due to the insecticide application in the second date influencing patchiness at smaller scales than 7 m or may simply be the result of sampling error (Heisel et al., 1996). On the other hand, the year 2006 presented similar nugget values in all the considered dates (Table 2). The nugget variance expressed as a percentage of the total semivariance was used to define distinct classes of spatial dependence for the J. lybica egg density (Table 2). Medium nugget ratios (between 28 and 63%) were found in all the studied dates, which indicate a moderate spatial dependence and a high variability between sampling points (Table 2).
The sill presented a similar value in all dates in year 2005 ranging between 0,034 and 0,022. The sill values in 2006 were greater than in 2005 as consequence of not insecticide application (Table 2). The low sill values found are the result of a small mean density. The range varied from 41, 45 m to 18, 20 m.
Works with similar results have been reported by Rossi et al., 1992; Liebhold et al., 1993; Midgarden et al., 1993; Speight et al., 1998; Blom and Fleischer, 2001; Sciarretta et al., 2001; Trematerra and Sciarretta, 2004 and Trematerra et al., 2004.
Mapping
The J. lybica populations were highly aggregated in year 2005 giving rise not only to a higher semivariance (differences between observations were greater) but also a steeper slope (greater degree of correlation between observations) in the semivariogram of 2005 compared to 2002 (Fig. 1 and 2).
Site-specific insecticide application
The year 2005 presented a larger variation in the infested area as a consequence of the insecticide application. The total area infested was more stable in 2006 (Table 4). However, the average infestation was similar in both years, 40,62% in 2005 and 43,18% in 2006. Therefore, if a given insecticide was applied just to the infested areas (density ≥ 1 egg plant-1), the average reduction in insecticide cost achieved could have been around 42%. Weisz et al. (1996) found a 49% infested area in his study on colorado potato beetle. There are few studies about site-specific pest control.
The usefulness of the infestation maps obtained with kriging for improving the decision-making process is strictly dependent on J. lybica patch dynamics. If egg patches are stable, kriging can be done periodically without overburdening the decision making process, whereas if they are not stable, maps will need to be drawn each year, a significant cost increase. However, if egg patches are considered as stable for a few years, direct spraying would account for a percentage insecticide application saving of the same magnitude as the uninfected portions of the field (Fleischer et al., 1999).
49Ramírez-Dávila y Porcayo-Camargo: Spatial distribution of Jacobiasca lybica
Figure 1. Countour plots of Jacobiasca lybica egg density (egg plant-1) for year 2005.

50 Rev. Chilena Ent. 34, 2008
Figure 2. Countour plots of Jacobiasca lybica egg density (egg plant-1) for year 2006.
51Ramírez-Dávila y Porcayo-Camargo: Spatial distribution of Jacobiasca lybica
The comparison among the different maps could provide us with information regarding the predictability of the egg infestation. Table 6 shows results obtained in the comparison within a year. In year 2005 we can observe no statistical differences in the two last comparisons (Table 5). The eggs densities in these two last dates were higher than other dates (Table 1). Insecticide application in the second date broke the spatial structure and consequently the spatial population stability. Year 2006 presented a similar behavior. Again, the dates with higher densities (Table 1) presented a no significant difference. Thus, short-term stability seems to be influenced by the high densities.
Table 6 shows the results of long-term stability (between years). There were not significative statistical differences in the last two dates, indicating space stability. Possibly, as a consequence of the existence of preferential areas due to the better physiological conditions of the vineyards that would attract the adults to deposit eggs. However, such long-term stability did not appear in the other dates probably as the result of insecticide application.
Spatial Analysis by Distance Index (SADIE)
Spatial distribution
The J. lybica density maps for each year are shown in Figures 3 and 4. A visual assessment reveals a distinct aggregation depending on dates. Multiple clusters of high density were observed in 2001 (Fig. 3). Distribution in multiple aggregation centers has been reported for other insects (Magro et al., 1999; Ferguson et al., 2000; Perry et al., 2002).
On 7 August 2001, there was a strong decrease of the egg population as consequence of the insecticide application. However, some aggregation centers can be seen. It would seem that insect movement between the surrounding unsprayed areas and the treated crop may be occurred. After this date the population increased very quickly covering
practically the whole field (Fig. 3). Insecticide effect may be difficult to interpret or fail to detect the true effect if only small areas within a field are monitored of if a species exhibits either low number or spatial heterogeneity (Mead-Briggs, 1998). Our study indicates that the insecticide Malation disrupted the spatial structure of J. lybica and that the pattern of recovery can be related to dispersal ability (Holland et al., 2000).
During 2002, we found strong aggregations as indicated by Ia indices (Table 7) with multiple density clusters (Fig 4).
Some authors have detected edged effects in their studies (Perry, 1998; Winder et al., 1999; Bohan et al., 2000; Winder et al., 2001; Xu and Madden, 2003). Such circumstance was not apparent in our results (Fig. 3 and 4).
The J. lybica infested areas varied considerably between dates and can lead accurately to the site-specific pest management (Fleischer et al., 1997). Between 97% and 27% of the total area was free of J. lybica eggs (Fig. 3 and 4). Year 2005 presented the bigger variation in the infested area as consequence of the insecticide treatment.
What was detected with SADIE index can be observed with the maps developed with kriging of geostatistical analysis, an aggregated distribution and a several aggregation centers.
Temporal stability
Association between years was also tested. Indications of association were found in September and October (Table 9), suggesting a stable distribution pattern. In contrast, in June, July and August none association was apparent (Table 9) probably as consequence of insecticide application in early 2005.
Temporal stability has been detected for some insects (Ferguson et al., 2000; Fernandez et al., 2000; Thomas et al., 2001). In our case, there was not clear pattern of temporal
52 Rev. Chilena Ent. 34, 2008
stability. However, short and long-term spatial stability seems associated with high levels of populations.
If the location of egg population distribution is predictable and stable in space and time, the potential for reducing agrochemical inputs to farmland could be increased, through direct spraying on the leaf hopper population patches (Weisz et al., 1996; Fleischer et al., 1999). However, this study albeit based on a single field, indicates that the lack of a clear spatial stability both spatially and temporally, would make precision farming application difficult for J. lybica eggs. Further work is necessary to establish if insect aggregation can persist at the same location for long periods.
CONCLUSIONS
First, the space geostatistical methods and SADIE proved to be effective in establishing the spatial structure of populations of eggs J. lybica.
Second, the implementation of Geostatistics allowed us to model the spatial structure of J. lybica eggs with spherical models with nugget in the majority of cases.
Third, the results obtained with the techniques Geoestadísticas showed the existence of a spatial structure aggregate, and the level of dependency of the same, moderate.
Fourth, the analysis showed a pattern SADIE space added to the populations spread over several centers of aggregation.
Fifth, using kriging we were able to establish maps of the spatial distribution of the J. lybica eggs.
Sixth, in some cases was identified the existence of short and long spatial and temporal stability of populations of the insect eggs.
Seventh, the effect of insecticides in 2005 changed in a significant way the spatial structure of the populations of the insect eggs.
Eighth, the pest was not uniform, existing free areas of infestation by J. lybica.
ACKNOWLEDGEMENTS
Thanks Agencia Española de Cooperación Iberoamericana (AECI) for the financial support provided.
REFERENCES
araúJo, J.a. 1988. Panorâmica da viticultura alentejana. I Simpósio de Vitivinicultura Evora. pp. 1-6.
Blom, e. anD s. Fleisher. 2001. Dynamics in the spatial structure of Leptinotarsa decemlineata (Coleoptera: Chrysomelidae). Environ. Entomol., 30 (2): 350-364.
Bohan, D.; a. Bohan; D. glen; W. symanDson; c. Wiltshire anD l. hughes. 2000. Spatial dynamics of predation by carabid beetles on slugs. Journal of Animal Ecology, 69: 367-379.
Bohlen, P.J. anD g.W. Barret. 1990. Dispersal of Japanese beetle (Coleoptera: Scarabaeidae) in strip-cropped soybean agroecosystems. Environmental Entomology, 19: 955-960.
Butts, r. a. anD g. B. schaalJe. 1994. Spatial distribution of fall populations of Russian wheat aphid (Homoptera: Aphididae) in winter wheat. J. Encon. Entomol., 87(5): 1230-1236.
conover, W. J. 1980. Practical nonparametric statistics. Ecologia. Second edition. John Wiley & Sons, New York, USA.
crist, t. o. 1998. The spatial distribution of termites in shortgras steppe: a geostatistical approach. Ecología, 114: 410-416.
DaviD, F. n. anD P.g. moore. 1954. Notes on contagious distributions in plant populations. Annals of Botany, 18: 47-53.
De los santos, a.; montes, c. anD l. ramírez-Díaz. 1982. Modelos espaciales de algunas poblaciones de coleópteros terrestres en dos ecosistemas del bajo Guadalquivir (S.W. España). Mediterránea Ser. Biol., 6: 65-92.

53Ramírez-Dávila y Porcayo-Camargo: Spatial distribution of Jacobiasca lybica
Ferguson, W.; z. KluKoWsKi; B. WalczaK; J. n. Perry; m. mugglestone; s. clarK anD i. Williams. 2000. The spatio-temporal distribution of adult Ceutorhynchus assimilis in a crop of winter oilseed rape in relation to the distribution of their larvae and that of the parasitoid Trichomalus perfectus. Entomologia Experimentalis et Applicata, 95: 161-171.
FernánDez, a.; J. griFFiths anD g. thomas. 2000. Density; distribution and dispersal of the carabid beetle Nebria brevicollis in two adjacent cereal fields. Annals Applied Biology, 137: 89-97.
Fleischer, s. J.; P. Blom; D. emmem anD a. hoWer. 1999. Dynamics in the spatial continuity of insect density. Proceedings of the fourth International Conference on Precision Agriculture. pp. 133-141.
Fleischer, s.; r. Weisz; z. smiloWitz anD D. miDgarDen. 1997. Spatial variation in insect populations and site-specific integrated pest management. The state of Site-Specific Management for Agriculture. Edited by F J Pierce and E J Sadler. ASA Miscellaneous Publications. Madison, WI. pp. 101-130.
gonzález-anDuJar, J.l.; a. martínez-coB; F. lóPez-granaDos anD l. garcía-torres. 2001. Spatial distribution and mapping of crenate broomrape infestations in continuous broad bean cropping. Weed Science, 49: 773-779.
hassell, m. P. anD r. m. may. 1974. Aggregation of predators and insect parasites and its effect on stability. Journal of Animal Ecology, 43: 567-594.
heisel, t.; c. anDreassen anD a. K. ersBøll. 1996. Annual weed distribution can be mapped with kriging. Weed Research, 36: 325-337.
hevesi, J.a.; J. D. istoK anD a. l. Flint. 1992. Precipitation estimation in mountainous terrain using multivariate geostatistics. Agronomía Tropical, 31: 661-676.
hollanD, J. m.; l. WinDer anD J. n. Perry. 2000. The impact of dimethoate on the spatial distribution of beneficial arthropods in winter wheat. Annals Applied Biology, 136: 83-105.
hughes, g. anD r. g. mcKinlay. 1988. Spatial heterogeneity in yield-pest relationships for crop loss assessment. Ecological Modelling, 41: 67-73.
hulBert, s. 1990. Spatial distribution of the mountain unicorn. Oikos, 58: 257-271.
isaaKs, e. h. anD r. m. srivastava. 1989. An Introduction to Applied Geostatistics. Oxford University, New York. 561 pp.
iWao, s. 1970. Analysis of contagiousness in the action of mortality factors on the western tent caterpillar population by using the m-m relationship. Researches on Population Ecology, 12: 100-110.
iWao, s. 1972. Application of the m-m method to the analysis of spatial patterns by changing the quadrate size. Researches on Population Ecology, 14: 97-128.
Journel, a. g. anD c. J. huiJBregts. 1978. Mining Geostatistics. Academic Press, London. 600 pp.
Korie, s.; J. n. Perry; m. mugglestone; s. clarK; c. F. thomas anD r. mohamaD. 2000. Spatiotemporal Associations in beetle and virus count data. Journal of Agricultural, Biological and Environmental Statistics, 5: 214-239.
lieBolD, a.m.; r. e. rossi anD W. P. KemP. 1993. Geostatistics and geographical information systems in applied insect ecology. Annual Review of Entomology, 38: 303-327.
lloyD, m. 1967. Mean crowding. Journal of Animal Ecology, 35: 1-30.
lóPez, m. a. 1997. Incidencia de Kalotermes flavicollis (Fabr.) (Isoptera, Kalotermitidae) en el Marco del Jerez. Ensayos de Técnicas Blandas de Control sobre Plagas del Viñedo. Ph. D Thesis. Univ. de Sevilla, Sevilla. 477 pp.
magro, a.; J. araúJo anD l. hemPtinne. 1999. Coccinellids (Coleoptera: Coccinellidae) in citrus groves in Portugal: listing and analysis of geographical distribution. Boletin Sanidad Vegetal Plagas, 25: 335-345.
meaD-Briggs, m. 1998. The value of large-scale field trials for determining the effects
54 Rev. Chilena Ent. 34, 2008
of pesticide on the non-target arthropod fauna of cereal crops. Ecotoxicology: Pesticide and Beneficial Organisms. P. T. Haskell and P. McEwen. Dordrecht (Ed.): Kluwer Academia Publishers. The Netherlands. pp. 182-190.
miDgarDen, D; r. youngman anD s. Fleischer. 1993. Spatial Analysis of counts of Western corn rootworm (Coleoptera: Chrysomelidae). Adults on yellow sticky traps in corn: Geostatistics and dispersion indices. Environmental Entomology, 22(5): 1124-1123.
morisita, m. 1959. Measuring of the dispersion of individuals and analysis of the distributional patterns. Mem. Fac. Sci. Kyushu Univ. Ser. E. Biol., 2: 215-235.
ocete, r.; m. a. loPez; J. Quartau anD a. Pèrez. 1999. La problemática actual de los mosquitos verdes (Homoptera: Cicadillidae) en diversas zonas vitícolas españolas. Viticultura/Enologia professional, 63: 16-20.
Perry, J. n. 1995. Journal of Animal Ecology. Spatial Analysis by Distance Index, 64: 303-314.
Perry, J. n. 1997. Spatial association for counts of two species. Acta Jutlandica, 72: 149-169.
Perry, J. n. 1998. Measures of spatial pattern for counts. Ecology, 79: 1008-1017.
Perry, J. n.; a. m. lieBholD; m. s. rosemBerg; J. miriti; a. JaKolsKa anD s. citron-Pousty. 2002. Illustrations and guidelines for selecting statistical methods for quantifying spatial pattern in ecological data. Ecography, 25: 578-600.
Perry, J. n.; e. Bell; r. smith anD i. WoiWoD. 1996. Aspects of Applied Biology SADIE. Software to measure and model spatial pattern, 46: 95-102.
Quartau, J. a. anD m. t. reBelo. 1992. Estudios preliminares sobre os cicadelideos que constituem pragas das vinhas em Portugal (Homoptera: Cicadellidae). Boletin Sanidad Vegetal Plagas, 18: 407-417.
Quartau, J. a.; a. Françony anD g. anaDre. 1989. Jacobiasca lybica (Bergenin & Zanon) (Homoptera: Cicadellidae, Typhlocybinae) a new leafhopper infesting vineyards in Southern Portugal. Boletin da Sociedade Portuguesa de Entomologia, 114: 129-133.
roBertson, g. P., 1995. The spatial distribution of nematode trophic groups across a cultivated ecosystem. Ecology, 765: 1425-1432.
rossi, r.; J. mulla; g. Journel anD h. Franz. 1992. Ecological Monographs. Geostatistical Tools for Modeling and interpreting Ecological Spatial Dependence, 62: 277-314.
saWyer, J. 1989. Inconstancy of Taylor´s b: simulated sampling with different quadrat sizes and spatial distributions. Researches on Population Ecology, 31: 11-24.
schotzKo, D. J. anD l. e. o'KeeFe. 1989. Geostatistical description of the spatial distribution of Lygus hesperus (Heteroptera: Miridiae) in lentils. Journal Economic Entomology, 8: 1277-1288.
schotzKo, D. J. anD s. s. QuinsBerry. 1999. Pea leaf weevil (Coleoptera: Curculionidae) spatial distribution in peas. Environmental Entomology, 28: 477-484.
sciarretta, a.; P. trematerra anD B. aumgärtner. 2001. Geostatistical analisis of Cydia funebrana (Lepidoptera: Tortricidae) Pheromone trap catches at two spatial scales. American Entomologist, 47(3): 174-184.
southWooD, t. r. e. 1978. Ecological Methods. Wesley-Halsted. 2nd ed. Wesley-Halsted, New York, USA. 524 pp.
sPeight, m.; r. hails; m. gilBert anD a. Foggo. 1998. Horse chestnut scale (Pulvinaria regalis) (Homoptera: Coccidae) and urban host tree environment. Ecology, 79(5): 1503-1513.
syrJala, e. 1996. A statistical test for a difference between the spatial distributions of two populations. Ecology, 77: 75-80.
55Ramírez-Dávila y Porcayo-Camargo: Spatial distribution of Jacobiasca lybica
taylor, l. r. 1984. Assessing and interpreting the spatial distributions of insect populations. Annual Review of Entomology, 29: 321-357.
thomas, g.; l. ParKinson; K. griFFiths; g. FernánDez anD J. marshall. 2001. Aggregation and temporal stability of carabid beetle distributions in field and hedgerow habitats. Journal of Applied Ecology, 38: 100-116.
toleDo, J. 1992. Mosquitos verdes. Los parásitos de la vid. Estrategias de Protección Razonada. MAPA-Ediciones Mundi-Prensa, Madrid. pp. 67-70.
trematerra, P. anD a. sciarretta. 2004. Spatial distribution of some beetles infesting a feed mill with spatio-temporal dynamics of Orzaephilus surinamensis, Tribolium castaneum and Tribolium confusum. Journal of stored products research, 40(4): 363-377.
trematerra, P.; P. gentile anD a. sciarretta. 2004. Spatial analysis of pheromone trap catches of moth (Cydia pomonella) in two heterogeneous agro-ecosystems, usin geoestatistical techniques. Phytoparasitica, 32(4): 325-341.
WeBster, r. anD m. a. oliver. 1990. Statistical methods in soil and land resource survey. Oxford University Press, Oxford. 350 pp.
Weisz, r.; s. J. Fleischer anD a. smiloWitz. 1996. Site-specific integrated pest management for high value crops: Impact on tomato pest management. Journal of Economy Entomology, 89: 501-509.
WinDer, l.; c. alexanDer; J. m. hollanD; c. Wooley anD J. n. Perry. 2001. Modelling the dynamic spatio-temporal response of predators to transient prey patches in the field. Ecology letters, 4: 568-576.
WinDer, l; J. Perry anD J. hollanD. 1999. The spatial and temporal distribution of the grain aphid Sitobion avenae in winter wheat. Entomologia Experimentalis et Applicata, 93: 227-290.
xu, x. m. anD l. v. maDDen. 2003. Considerations for the use of SADIE statistics to quantify spatial patterns. Ecography, 26: 821-830.

56 Rev. Chilena Ent. 34, 2008