Embed Size (px)
DESCRIPTION
Institute for Environmental Studies. Spatial Decision Support Ron Janssen. Doelgerichte presentatie van informatie. De TGV. Napoleon’s campaign to Moscow. Poland 422000 Moscow 100.000 Poland 10000 Berezina 50000 28000 20° 28 oct. Tijd, plaats en omvang. Amoebe 2. Outline. - PowerPoint PPT Presentation
Citation preview

Spatial Decision Support
Ron Janssen
Institute for Environmental Studies

2
Doelgerichte presentatie van informatie
3
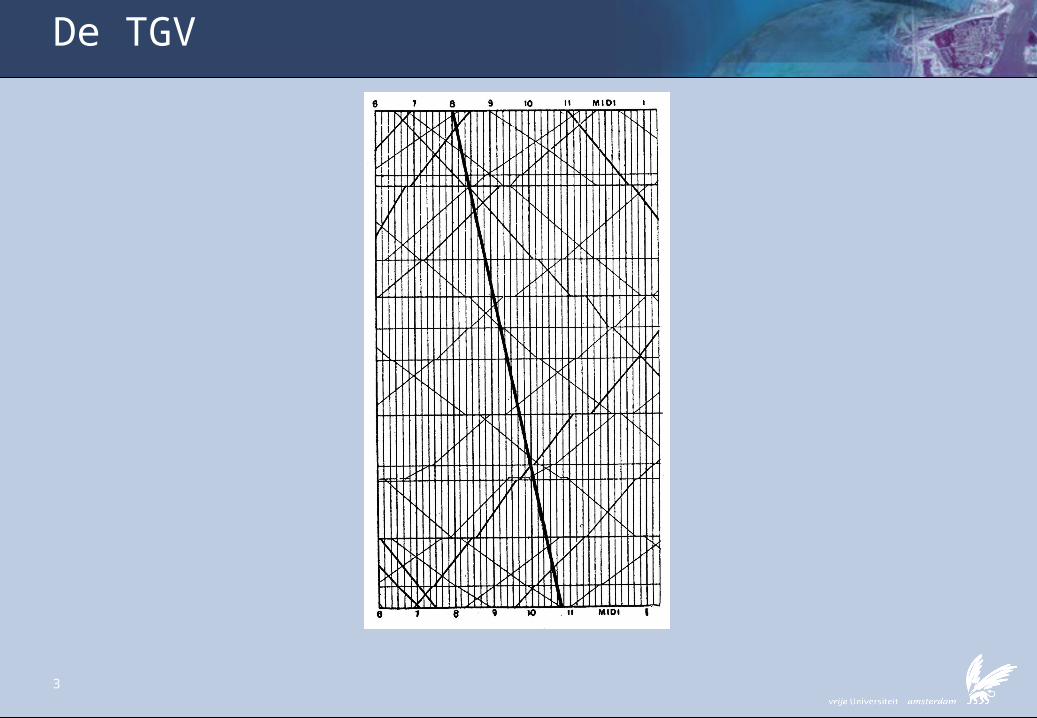
De TGV
4
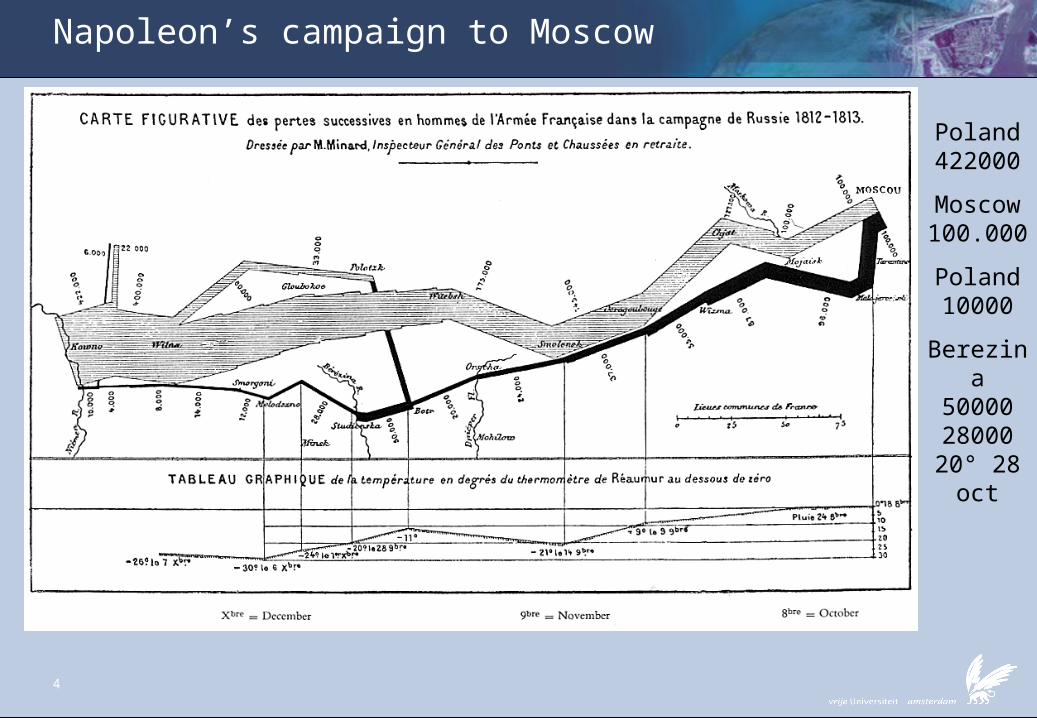
Napoleon’s campaign to Moscow
Poland 422000
Moscow 100.000
Poland 10000
Berezina5000028000
20° 28 oct

5
Tijd, plaats en omvang

6
Amoebe 2

7
8
Outline
• Introduction to the plan area• Evaluation of management alternatives• A virtual environment of the alternatives• Design of management alternatives• Use of maps for evaluation

9
Land use map of the plan area

10
A typical Dutch fen meadow area

11
High natural values

12
Marginal agriculture

13
High recreational values

14
Land use in the Wormer- and Jisperveld
Land usegrassland (agriculture)grassland (buffer zone)polderforestgrassland (nature)open water
1 0 1 2 Kilometers

15
Policy alternatives
• Modern fen meadow (current)water drainage to support agricultureopen landscapefood for meadow birds
• Historical fen meadoweduced drainageraise of water tablenegative impacts for agricultureopp. for some bird and plant species
• Dynamic mirefloods in winterpermanent waterlogged soilsno agriculturepeat growth
16
Stakeholders and their interests
• Agricultural organisationsConstant water levels , water quality Accessibility, SizeContinuity and future perspectives for farms
• Recreation (fisheries)Variation in landscapesAccessibilityWater quality
• Nature Conservation OrganisationsFlexible water levels, water qualityVariation in landscapes also cultural/historic landscapesCorridors, Larger units of protected nature
• Provincial/regional authoritiesSafetyWater qualityWater quantity

17
Water quality

18
Water quantity

19
Climate change
20
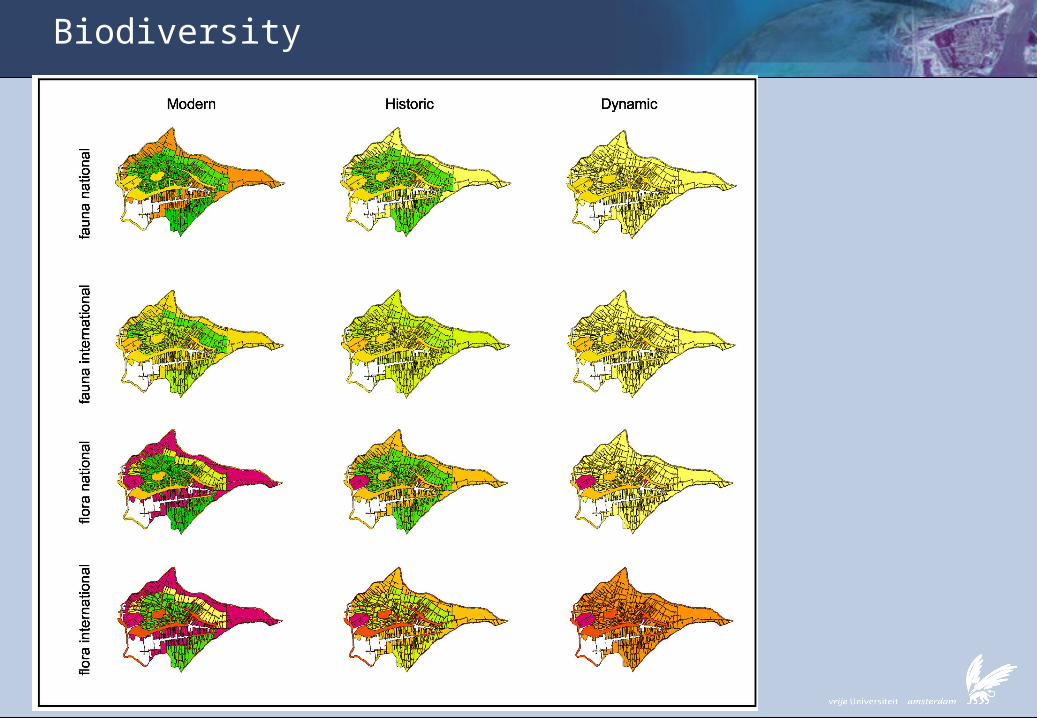
Biodiversity

21
Socio-economic

22
Results of evaluation3 alternatives x 10 criteria -> 30 evaluation maps
Modern fen meadow Historical fen meadow Dynamic fen mire
c1
c2
c..
c10

23
Three evaluation paths
a1 a2 a3
a1 a2 a3
c1
c2
c3
c4
a1 a2 a3
c1
c2
c3
c4
a1 a2 a3
MCA MCA
SA
SA
Path 1
Path 2
Path 3

24
Evaluation maps
a1 a2 a3
a1 a2 a3
c1
c2
c3
c4
Total value maps

25
Evaluation maps

26
Aggregated impact table
a1 a2 a3
c1
c2
c3
c4
a1 a2 a3
c1
c2
c3
c4
Spatial Aggregation

27
Evaluation table
Modern Historic Dynamic Water quality P retention 0.02 0.06 0.25 N retention 0.11 0.19 0.56 Water quantity Water retention 0.19 0.33 1.00 Peak storage 0.00 0.50 1.00 Flood storage 0.00 0.00 0.03 Biodiversity Fauna national 0.52 0.60 0.48 Flora national 0.43 0.53 0.47 Fauna international 0.56 0.62 0.51 Flora international 0.34 0.41 0.20 Climate change Greenhouse gas balance 0.18 0.48 0.71 Socio- economic Cultural heritage 0.80 1.00 0.20 Agriculture 0.41 0.17 0.00 Recreation 0.54 0.46 0.37
MCA result

29
Total ranking
0
0.440.43
0.35
Weights
Histor Dynam Modern
Water quality
Water quantity
Biodiversity
Climate change
Socio- economic

30
Ranking per policy objective Gewichten
0.44 0.43 0.35
0.12
0.40
0.07
0.28
0.68
0.06
0.540.42 0.46
0.480.71
0.18
0.55
0.19
0.58
Histor Dyn Modern
Result
Water quality
Water quantity
Biodiversity
Climate
Socio-economic
Water quality
Water quantity
Biodiversity
Climate change
Socio- economic

31
0 .440 .30 0 .24
0 .57
0 .24 0 .21
0 .570 .41 0 .34
0 .53 0 .50 0 .46
D ynam H istor M odern
W ater quality
W ater quantity
C lim ate
B iodiversity
Socio-econom ic0 .39
0 .49 0 .44
W ater qualityW ater quantityClimateBiodiv ers itySoc io-ec onomic
W ater qualityW ater quantityClimateBiodiv ers itySoc io-ec onomic
0 .440 .30 0 .24
0 .57
0 .24 0 .21
0 .570 .41 0 .34
0 .53 0 .50 0 .46
D ynam H istor M odern
W ater quality
W ater quantity
C lim ate
B iodiversity
Socio-econom ic
W ater quality
W ater quantity
C lim ate
B iodiversity
Socio-econom ic0 .39
0 .49 0 .44
W ater qualityW ater quantityClimateBiodiv ers itySoc io-ec onomic
W ater qualityW ater quantityClimateBiodiv ers itySoc io-ec onomic
Ranking per policy priority

32
A virtual environment of the plan area

33
Raising the water table to –1.5 NAP

34
Current situation

35
Raising the water table to –1.5 NAP

36
Current situation

37
Raising the water table to –1.5 NAP

38
Figure 1 Aerial photo of the
DESIGN of land use plans for the Jisperveld

39
A 20x20 representation of the Jisperveld

40
Intensive agricul ture
Extensive agri cultur e
Resi dence
Industry
Recreation (day)
Recreation (overnight)
Wet natural area
Water (recr eational use)
Water (l imi ted access)
# of cluster s 4
Largest cl uster 50
Compactness 4.61
Are a 92
Intensive agricul ture
Nature 2189
Recr eation 2527
Costs (mln €) 115
Intensive agricul ture
Extensive agri cultur e
Resi dence
Industry
Recreation (day)
Recreation (overnight)
Wet natural area
Water (recr eational use)
Water (l imi ted access)
Intensive agricul ture
Extensive agri cultur e
Resi dence
Industry
Recreation (day)
Recreation (overnight)
Wet natural area
Water (recr eational use)
Water (l imi ted access)
# of cluster s 4
Largest cl uster 50
Compactness 4.61
Are a 92
Intensive agricul ture
Nature 2189
Recr eation 2527
Costs (mln €) 115
Design interface

41
Six Policy objectives
Maximize totals1. Maximize the natural value of the area, 2. Maximize the recreational value of the area,3. Minimize cost of changing land use,
Optimize spatial characteristics4. Minimize fragmentation5. Maximize cluster size,6. Maximize compactness.

42
Spatial compactness
Spatial compactness is defined as a combination of three indicators:
fragmentation largest cluster compactness

43
1 1 1 8 1 1 1 1 8 1 1 1 1 8 8 8 1 1 1 1 11 1 8 8 1 1 1 8 8 8 8 7 7 7 8 8 8 1 1 11 1 1 8 8 1 1 8 1 1 8 8 7 8 8 8 8 8 8 81 1 1 1 8 8 1 8 1 1 1 8 8 8 8 8 8 8 1 11 1 1 1 1 8 1 8 8 8 1 1 1 8 8 8 8 8 8 88 8 8 8 1 8 8 8 7 8 8 8 8 8 1 1 1 1 1 11 1 1 8 8 8 8 7 7 7 8 8 1 1 1 1 1 8 8 81 1 1 1 6 1 8 8 8 8 8 8 8 8 8 1 8 8 1 13 3 3 3 3 8 8 8 1 1 1 1 1 1 8 8 8 1 1 15 5 3 8 8 8 8 8 8 8 1 1 1 8 8 1 8 8 8 85 8 8 8 8 8 8 8 8 8 8 8 8 8 1 1 1 1 1 18 8 1 8 8 8 8 8 8 8 8 8 1 8 8 1 1 1 1 11 1 1 8 8 8 8 8 8 1 1 8 1 1 8 8 8 8 8 81 8 8 8 8 8 8 8 8 1 1 8 8 1 1 1 1 1 1 18 8 1 1 8 8 8 8 5 3 1 1 8 8 8 8 1 1 1 11 1 1 1 1 8 8 8 5 3 3 3 8 1 1 8 8 8 8 81 1 8 8 8 8 8 3 3 3 3 3 8 1 1 1 1 8 1 18 8 1 1 1 1 1 3 3 3 3 5 8 8 8 8 8 8 8 88 1 1 1 8 3 3 3 3 3 3 4 4 8 1 1 1 1 1 18 8 8 8 8 3 3 3 4 4 4 4 4 8 8 1 1 1 1 1
highly fragmented area no extensive agriculture no wet natural area.
minimum sizes for ext. agriculture maximize all objectives simultaneously.
2
large areas of extensive agriculture a 8-hectare patch of wet natural area two land areas divided by a large patch of
water (low fragmentation) cost of 115 mln €. Increase the weight for costs.
3
low value for nature due to unfavourable locations
costs are acceptable
increase weight for nature.
8 8 8 8 2 2 2 2 2 2 2 2 2 2 2 2 1 1 1 1 8 8 8 8 2 2 2 2 2 2 2 2 2 2 2 2 1 1 1 1 8 8 8 8 8 8 8 8 2 8 8 8 2 2 2 2 1 1 1 1 8 8 8 8 8 8 8 8 8 8 8 8 2 2 2 2 1 1 1 1 8 6 6 8 8 8 8 8 8 8 8 2 2 2 2 2 1 1 1 1 8 8 8 8 8 8 8 8 8 8 8 2 2 2 2 2 7 7 1 1 5 5 5 8 8 8 8 8 2 2 2 2 2 2 2 7 7 7 1 1 5 5 5 5 5 8 8 8 2 2 8 8 8 8 8 7 7 7 1 1 5 5 5 5 5 8 8 8 2 2 8 8 8 8 8 2 2 8 1 1 1 1 5 8 8 8 8 8 8 8 8 8 8 8 8 2 2 8 1 1 1 1 8 8 8 8 8 8 8 8 8 8 8 8 8 8 8 8 1 1 8 8 8 8 8 8 8 8 8 8 8 8 8 8 8 8 8 9 1 1 1 1 1 1 1 1 8 8 8 8 8 8 8 8 8 8 9 9 9 8 1 1 1 1 1 1 1 8 8 8 8 8 8 8 8 8 8 9 9 8 1 1 1 1 1 1 1 8 8 3 3 8 8 8 8 8 8 8 8 8 1 1 1 1 1 1 1 8 3 3 3 3 8 8 8 8 8 8 8 8 1 1 1 1 1 1 1 3 3 3 3 3 8 8 8 8 8 8 8 8 1 1 1 1 1 1 3 3 3 3 3 3 8 1 1 8 8 8 8 8 1 1 1 1 1 3 3 3 3 3 3 4 4 1 1 8 8 8 8 8 1 1 1 1 1 3 3 3 5 5 4 4 4 8 8 8 8 8 8 8
1 1 1 1 1 1 1 1 1 1 1 1 8 8 2 2 2 2 2 2 1 1 1 1 1 1 1 1 1 1 1 7 7 7 8 8 9 2 2 2 1 1 1 1 1 1 1 1 1 1 1 7 7 8 8 8 8 9 9 2 1 1 1 1 1 1 1 1 1 1 1 8 8 8 8 8 9 9 2 2 5 1 1 1 1 1 1 8 8 8 1 8 8 8 8 9 9 9 9 9 1 1 1 8 8 8 8 8 7 8 8 8 8 8 1 1 1 1 9 2 1 1 1 8 8 8 8 7 7 7 8 8 8 1 1 1 1 8 8 2 1 1 1 6 6 6 8 8 8 8 8 8 8 8 8 1 8 8 8 2 3 3 3 3 3 8 8 8 1 1 1 1 1 8 8 8 8 8 2 2 1 1 3 8 8 8 8 8 8 8 1 1 1 8 8 1 8 8 8 8 1 1 8 8 8 8 8 8 8 8 8 8 8 8 1 1 8 8 8 8 8 8 8 8 8 8 8 8 8 8 8 8 1 1 1 1 2 2 2 8 5 8 8 8 8 8 8 8 8 1 1 8 1 1 8 8 8 2 8 8 5 8 8 8 8 8 8 8 8 1 1 8 8 1 8 2 2 2 2 8 8 8 2 2 8 8 8 8 3 3 3 8 8 8 8 8 2 2 2 2 1 1 1 1 2 8 8 8 3 3 3 3 8 2 2 8 8 2 2 2 1 1 1 1 8 8 8 3 3 3 3 3 8 2 2 2 2 2 2 2 1 1 1 1 1 3 3 3 3 3 3 3 8 8 8 8 2 2 2 2 1 1 1 1 1 3 3 3 3 3 3 4 4 8 1 1 1 1 1 2 1 1 1 1 1 3 3 3 4 4 4 4 4 1 1 1 1 1 1 2
Interactive design of a land use plans:round 1-3

44
Round 0 1 2 3 4 5 6 7 8 Additive objectives Nature (400-4000) 1766 2189 1928 2098 2087 2037 2146 2173 1960 Recreation (400-4000) 2580 2527 2558 2514 2423 2358 2358 2410 2383 Costs (mln €) 0 115 13 12 13 20 25 27 12 Spatial objectives # of clusters int.agriculture 19 4 8 11 10 1 4 4 9 # of clusters wet nat.area 2 1 2 2 1 1 1 1 1 # of clusters water lim.use 0 1 1 3 1 2 1 3 3 largest cluster wet nat. area 4 8 5 10 25 23 21 27 31 Compactn. int.agr. (9.4-4) 5.42 4.61 4.98 5.04 5.28 4.83 4.68 4.50 4.90 Area per land use type Intensive agriculture (ha) 157 92 130 103 98 107 105 105 108 Extensive agriculture (ha) 0 58 50 52 33 48 51 51 43 Residence (ha) 28 26 34 29 35 28 28 28 32 Industry (ha) 7 5 7 8 8 8 7 7 7 Recreation (day) (ha) 6 16 3 5 5 21 5 5 6 Recreation (overnight) (ha) 1 2 3 11 8 9 2 8 9 Wet natural area (ha) 8 8 9 14 25 23 21 27 31 Water (recreational) (ha) 193 187 153 150 157 120 142 125 121 Water (limited access) (ha) 0 6 11 28 31 36 39 44 31
Results round 1-9

45
4
increase in natural value clusters of wet natural area and water
limited access are not connected.
minimal 14 ha wet natural area minimal 28 ha water limited access. increase weights number of clusters of
wet natural and water limited access 5
many, small and irregular patches of agricultural land
access in some cases can only by boat.
increase weight of # of clusters increase weight of compactness fix total size of agricultural area at
the level in round 4. 6
max connectedness of intensive agricultural
compactness has improved.
fix the area for intensive agriculture lower weight for costs
1 1 1 2 2 2 2 2 2 1 1 1 7 7 7 2 2 2 2 2 1 1 1 2 2 2 2 2 8 8 7 7 7 7 9 9 9 2 2 2 1 1 1 2 2 1 1 8 2 2 8 7 7 7 9 9 9 8 2 2 6 6 6 6 8 8 1 8 8 2 2 8 8 9 9 9 9 8 8 2 6 6 6 6 6 8 1 8 8 8 2 2 2 8 8 8 8 8 8 8 1 1 8 8 6 8 8 8 7 8 8 8 8 8 2 2 2 2 9 9 1 1 1 8 8 8 8 7 7 7 8 8 2 2 2 2 2 2 9 9 1 1 1 1 6 8 8 8 8 8 8 8 8 8 8 2 8 8 1 1 3 3 3 3 3 8 8 8 1 1 1 1 1 1 8 8 8 8 1 1 5 5 3 8 8 8 8 8 8 8 1 1 1 8 8 8 8 8 8 8 5 8 8 8 8 8 8 8 8 8 8 8 8 8 8 1 2 2 2 2 8 1 1 8 8 8 8 8 8 8 8 8 8 8 8 1 1 1 2 2 8 1 1 8 8 8 8 8 8 1 1 8 8 8 8 8 1 1 1 1 8 8 8 8 8 8 8 8 8 1 1 8 8 8 1 1 1 1 1 1 8 8 1 1 8 8 8 8 5 3 1 8 8 8 8 1 1 1 1 1 1 1 1 1 1 8 8 8 5 3 3 3 8 2 1 8 8 8 9 9 1 1 8 8 8 8 8 3 3 3 3 3 8 2 2 2 8 9 9 9 1 1 1 1 1 1 3 3 3 3 3 4 8 9 9 9 9 8 9 9 1 1 1 1 1 3 3 3 3 3 3 4 4 9 9 1 1 1 1 1 1 1 1 1 1 3 3 3 4 4 4 4 4 9 1 1 1 1 1 1
1 1 8 1 1 1 1 1 1 1 1 1 8 8 8 8 8 2 2 2 1 1 8 8 1 1 1 1 1 1 7 7 7 7 8 8 8 2 2 2 1 1 1 8 8 1 1 1 7 7 7 7 7 8 8 8 8 8 2 2 1 1 1 1 8 8 1 7 7 7 7 7 7 8 8 8 8 8 2 2 1 1 1 1 1 8 1 7 7 7 7 7 8 8 8 8 8 8 8 2 8 8 8 8 8 8 8 8 7 7 8 8 9 8 8 2 2 2 1 1 6 6 6 8 8 8 8 7 7 7 8 8 9 2 2 2 2 2 1 1 6 6 6 6 6 3 8 8 8 8 8 8 9 9 9 2 9 9 9 9 3 3 3 3 3 8 8 8 8 1 1 1 1 9 9 9 9 9 9 9 1 1 3 8 8 8 8 8 8 8 1 1 1 9 9 9 9 9 9 9 1 8 8 8 8 8 8 8 8 8 8 8 8 9 9 1 1 1 1 9 8 8 1 8 8 8 8 8 8 8 8 8 1 8 9 9 1 1 1 1 1 1 1 8 8 8 8 8 8 8 8 8 8 1 8 8 9 9 1 1 1 8 8 8 8 8 8 8 8 3 3 8 8 1 1 8 9 2 2 1 8 8 1 8 8 8 8 8 5 3 3 3 8 8 8 8 2 8 2 2 1 1 1 1 8 8 8 8 5 3 3 3 8 2 2 8 8 8 2 8 1 1 8 8 8 8 8 3 3 3 3 3 8 8 2 2 2 8 8 8 1 1 1 1 1 3 3 3 3 3 3 4 8 8 8 8 8 8 8 8 1 1 1 1 1 3 3 3 3 3 3 4 4 8 2 8 1 1 1 5 1 1 1 1 1 3 3 3 4 4 4 4 4 8 2 1 1 1 5 5
5 5 8 8 2 2 2 8 2 2 2 2 2 2 2 9 2 2 2 5 5 5 8 8 2 2 8 8 8 8 2 7 7 7 9 9 9 9 9 2 5 5 5 8 8 8 8 8 7 7 7 7 7 9 9 9 9 9 9 9 5 5 5 5 8 8 8 8 7 7 7 7 7 9 9 9 9 9 2 2 5 5 5 5 8 8 8 8 7 7 7 7 7 9 9 9 9 9 9 2 8 8 8 8 8 8 8 8 7 7 8 9 9 1 1 1 1 1 1 1 6 6 6 8 8 8 8 7 7 7 8 8 1 1 1 1 1 1 1 1 6 6 6 6 6 6 8 8 8 8 8 8 1 1 1 1 1 1 1 1 3 3 3 3 3 8 8 8 8 1 1 1 1 1 1 1 1 1 1 1 5 5 3 8 8 8 8 8 8 8 1 1 1 1 1 1 1 1 1 1 5 8 8 8 8 8 8 8 8 8 8 1 1 1 1 1 1 1 1 1 8 8 2 8 8 8 8 8 8 8 1 1 1 1 1 1 1 1 1 1 2 2 2 8 8 8 8 8 8 1 1 1 1 1 1 1 1 1 1 1 8 8 8 8 8 8 8 8 8 1 1 1 1 1 1 1 1 1 1 1 8 8 2 2 8 8 8 8 5 3 1 1 1 1 1 1 1 1 1 1 8 8 2 2 8 8 8 8 5 3 3 3 2 1 1 1 1 1 1 1 8 2 8 8 8 8 8 3 3 3 3 3 9 2 2 1 1 1 1 1 8 8 2 2 2 8 8 3 3 3 3 4 9 9 9 9 9 9 9 9 8 8 8 8 8 3 3 3 3 3 3 4 4 9 2 2 2 2 2 2 8 8 8 8 8 3 3 3 4 4 4 4 4 2 2 2 2 2 2 2
Interactive design of a land use plans:round 4-6

46
7
due to WFD costs of soil removal water may increase.
conversion cost of agriculture to
water are increased with €100.000.-/ha.-.
8
Characteristics of the landscape are lost.
Block changes from agriculture
land to water.
9
natural value is substantially improved
costs are acceptable spatial characteristics have are
good
planner is satisfied with the result session is ended.
1 1 1 1 1 1 1 1 1 2 2 2 2 2 2 2 2 2 2 2 1 1 1 1 1 1 1 1 1 1 1 7 7 7 9 9 9 9 2 2 1 1 1 1 1 1 1 1 1 1 1 7 7 7 9 9 9 9 9 2 1 1 1 1 1 1 1 1 1 1 1 7 7 7 9 9 9 9 9 2 1 1 1 1 1 1 1 1 1 1 7 7 7 9 9 9 9 9 9 2 1 1 1 1 1 1 1 7 7 7 7 7 9 9 9 9 9 9 1 1 1 1 1 1 8 8 8 7 7 7 7 8 9 2 2 9 9 1 1 1 1 1 1 1 6 6 8 8 8 8 8 8 9 9 9 2 2 1 1 8 3 3 3 3 3 8 8 8 8 8 8 9 9 9 8 8 8 8 8 8 5 5 3 8 8 8 8 8 8 8 9 9 9 9 8 2 8 8 8 8 5 8 8 8 8 8 8 8 8 8 8 8 8 8 2 2 2 2 2 8 8 8 8 8 8 8 8 8 8 8 8 8 2 8 8 2 2 2 2 8 8 8 8 8 8 8 8 8 8 8 8 8 8 2 8 2 2 8 8 8 8 8 8 8 8 8 8 8 8 8 8 8 8 8 2 2 2 2 8 8 8 8 2 2 8 8 8 8 5 3 8 8 8 8 8 8 2 2 8 8 8 8 2 8 8 8 8 8 5 3 3 3 8 8 8 8 8 8 8 1 8 8 8 8 8 8 8 3 3 3 3 3 8 2 2 2 8 8 1 1 8 8 8 1 1 1 8 3 3 3 3 8 8 1 1 1 1 1 1 1 2 2 8 1 1 3 3 3 3 3 3 4 4 1 1 1 1 1 1 1 2 2 2 1 1 3 3 3 4 4 4 4 4 1 1 1 1 1 1 1
1 1 1 1 1 1 1 9 9 5 5 5 9 9 9 2 2 2 2 2 1 1 1 1 1 1 1 9 9 9 7 7 7 7 9 9 2 2 9 2 1 1 1 1 1 1 1 1 9 2 7 7 7 7 9 9 9 9 9 2 1 1 1 1 1 1 1 8 2 2 7 7 7 7 9 9 9 9 9 2 1 1 1 1 1 1 1 8 7 7 7 7 7 7 9 9 9 9 2 2 1 1 1 1 1 8 8 8 7 7 7 7 7 9 8 9 9 2 2 2 6 6 6 8 8 8 8 7 7 7 7 8 8 9 8 9 2 9 2 2 6 6 6 6 6 8 8 8 8 8 8 8 8 8 8 9 9 9 2 2 3 3 3 3 3 8 8 8 2 2 8 2 2 2 8 9 1 1 2 2 8 8 3 8 8 8 8 8 8 8 2 2 2 2 8 2 1 1 9 9 8 8 8 8 8 8 8 8 8 8 8 8 8 8 2 2 8 1 9 9 8 8 8 8 8 8 8 8 8 8 8 8 8 8 2 8 2 2 9 9 8 8 8 8 8 8 8 8 8 8 8 8 8 8 8 8 2 2 9 9 8 8 8 8 8 8 8 8 8 8 8 8 8 8 2 2 2 1 1 1 8 8 8 2 8 8 8 8 8 3 8 8 8 8 8 8 1 1 1 1 5 2 2 2 2 8 8 8 8 3 3 3 8 1 1 1 1 1 1 1 5 2 8 8 8 8 8 3 3 3 3 3 1 1 1 1 1 1 1 1 1 1 1 1 8 8 8 3 3 3 3 1 1 1 1 1 1 1 1 1 1 1 1 1 1 3 3 3 3 3 3 4 4 1 1 1 1 1 1 1 1 1 1 1 1 3 3 3 4 4 4 4 4 1 1 1 1 1 1 1
1 1 1 1 1 1 2 2 1 1 7 7 9 9 9 5 5 5 5 5 1 1 1 1 1 1 1 2 1 1 7 7 7 7 9 9 8 5 5 5 1 1 1 1 1 1 2 2 7 7 7 7 7 9 9 8 8 8 8 8 2 2 2 2 9 2 2 2 7 7 7 7 7 9 9 9 8 8 1 1 2 2 2 2 2 9 2 9 7 7 7 7 7 8 8 8 8 8 1 1 9 9 9 9 2 9 9 9 7 7 7 8 8 2 2 2 2 2 1 1 6 6 6 9 9 9 9 7 7 7 7 8 2 2 2 5 2 2 1 1 6 6 6 6 6 6 8 8 7 7 7 8 8 8 8 5 8 8 1 1 3 3 3 3 3 8 8 8 2 2 2 1 1 1 8 8 8 5 5 5 8 8 3 8 8 8 8 8 8 8 1 1 1 8 8 5 8 8 8 8 8 8 8 8 8 8 8 8 8 8 8 8 8 8 5 5 5 5 1 1 8 8 1 8 8 8 8 8 8 8 8 8 1 8 8 1 1 1 1 1 1 1 1 8 8 8 8 8 8 1 1 8 1 1 1 1 1 1 1 1 2 8 8 8 8 8 8 8 8 1 1 8 8 1 1 1 1 1 1 1 2 8 2 2 8 8 8 8 8 3 3 3 8 8 8 8 1 1 1 2 2 1 1 1 2 8 8 8 8 3 3 3 8 1 1 8 8 8 8 8 2 1 1 1 8 8 8 3 3 3 3 3 8 1 1 1 1 8 2 2 9 9 1 1 1 3 3 3 3 3 3 8 8 8 1 1 1 8 8 8 9 2 1 1 1 3 3 3 3 3 3 4 4 8 1 1 1 1 1 1 9 9 9 9 1 3 3 3 4 4 4 4 4 1 1 1 1 1 1 1
Interactive design of a land use plans:round 6-9

47
A 200x200 grid representation of the Jisperveld

48
How to use this system?
• First round of policy design, scanning of alternatives
• Preparation of land use and water management plans
• Support of land use planners• Support of interactive processes
49
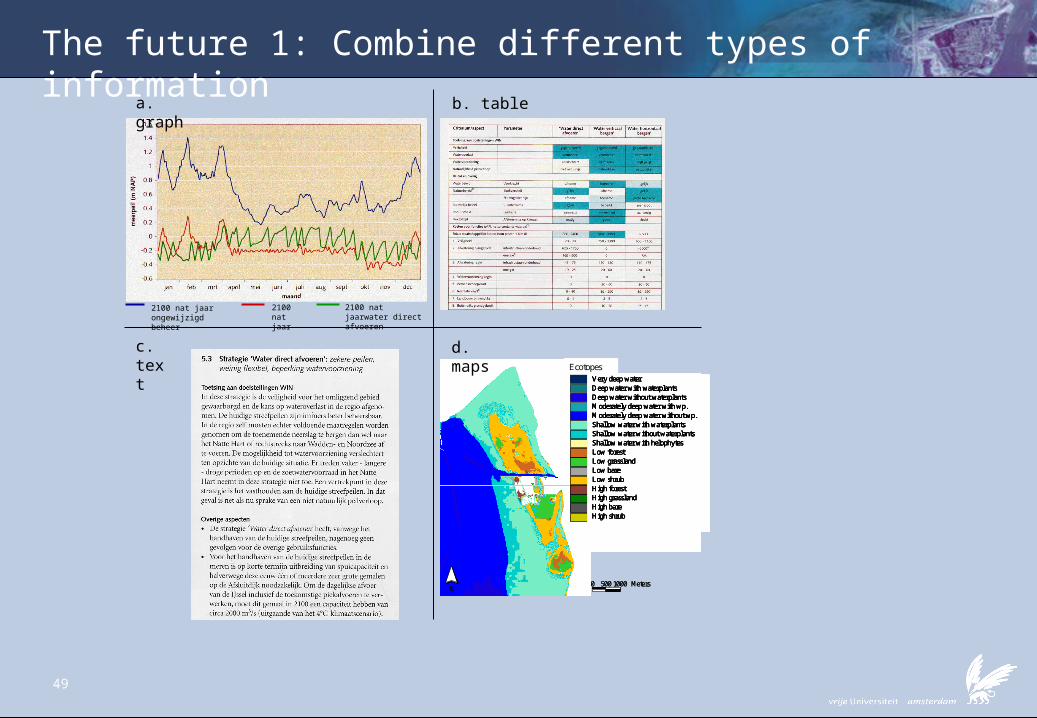
The future 1: Combine different types of information
2100 nat jaar ongewijzigd beheer
2100 nat jaar
2100 nat jaarwater direct afvoeren
EcotopenZeer diep waterDiep water met wplDiep water - wplMatig diep wtr + wplMatig diep wtr - wplOndiep water + wplOndiep water - wplOndiep wtr + helofytenLaag gelegen bosLaag gelegen graslandLaag gelegen kaalLaag gelegen ruigteHoog gelegen bosHoog gelegen graslandHoog gelegen kaalHoog gelegen ruigte
0 500 1000 MetersN
EcotopesVery deep waterDeep water with waterplantsDeep water without waterplantsModerately deep water with wp.Moderately deep water without wp.Shallow water with waterplantsShallow water without waterplantsShallow water with helophytesLow forestLow grasslandLow bareLow shrubHigh forestHigh grasslandHigh bareHigh shrub
EcotopesVery deep waterDeep water with waterplantsDeep water without waterplantsModerately deep water with wp.Moderately deep water without wp.Shallow water with waterplantsShallow water without waterplantsShallow water with helophytesLow forestLow grasslandLow bareLow shrubHigh forestHigh grasslandHigh bareHigh shrub
EcotopenZeer diep waterDiep water met wplDiep water - wplMatig diep wtr + wplMatig diep wtr - wplOndiep water + wplOndiep water - wplOndiep wtr + helofytenLaag gelegen bosLaag gelegen graslandLaag gelegen kaalLaag gelegen ruigteHoog gelegen bosHoog gelegen graslandHoog gelegen kaalH
ep water + wplOndiep water - wplOndiep wtr + helofytenLaag gelegen bosLaag gelegen graslandLaag gelegen kaalLaag gelegen ruigteHoog gelegen bosHoog gelegen graslandHoog gelegen kaalHoog gelegen ruigte
0 500 1000 MetersN
EcotopesVery deep waterDeep water with waterplantsDeep water without waterplantsModerately deep water with wp.Moderately deep water without wp.Shallow water with waterplantsShallow water without waterplantsShallow water with helophytesLow forestLow grasslandLow bareLow shrubHigh forestHigh grasslandHigh bareHigh shrub
EcotopesVery deep waterDeep water with waterplantsDeep water without waterplantsModerately deep water with wp.Moderately deep water without wp.Shallow water with waterplantsShallow water without waterplantsShallow water with helophytesLow forestLow grasslandLow bareLow shrubHigh forestHigh grasslandHigh bareHigh shrub
EcotopesVery deep waterDeep water with waterplantsDeep water without waterplantsModerately deep water with wp.Moderately deep water without wp.Shallow water with waterplantsShallow water without waterplantsShallow water with helophytesLow forestLow grasslandLow bareLow shrubHigh forestHigh grasslandHigh bareHigh shrub
EcotopesVery deep waterDeep water with waterplantsDeep water without waterplantsModerately deep water with wp.Moderately deep water without wp.Shallow water with waterplantsShallow water without waterplantsShallow water with helophytesLow forestLow grasslandLow bareLow shrubHigh forestHigh grasslandHigh bareHigh shrub
a. graph
b. table
c. text
d. maps

50
The future 2: Support different stages of design processes
0.
1.
2.
3.
4.
5.
6.
7.
8.
9.
10.
1. participatie
2. draagvlak
3. aanpasbaarheid
4. legitimiteit
5. efficiency
6. doelgericht
7. verantwoording
8. datagebaseerd
1.001.005.00
2.00
7.00
7.00
7.00
7.00
Consensusperspectief
Politiek perspectief
Ratioperspectief
Empirisch perspectief
0. 1. 2. 3. 4. 5. 6. 7. 8. 9.
10. 1. participatie
2. draagvlak
3. aanpasbaarheid
4. legitimiteit
5. efficiency
6. doelgericht
7. verantwoording
8. datagebaseerd 8.00
7.00
5.00
5.00 3.00 3.00
3.00
3.00
Empirisch perspectief Consensusperspectief
Politiek perspectief Ratioperspectief

51
The future 3: Integration of tools
0 .440 .30 0 .24
0 .57
0 .24 0 .21
0 .570 .41 0 .34
0 .53 0 .50 0 .46
D ynam H istor M odern
W ater quality
W ater quantity
C lim ate
B iodiversity
Socio -econom ic0 .39
0 .49 0 .44
W ater qualityW ater quantityClimateBiodiv ers itySoc io -ec onomic
W ater qualityW ater quantityClimateBiodiv ers itySoc io -ec onomic
0 .440 .30 0 .24
0 .57
0 .24 0 .21
0 .570 .41 0 .34
0 .53 0 .50 0 .46
D ynam H istor M odern
W ater quality
W ater quantity
C lim ate
B iodiversity
Socio -econom ic
W ater quality
W ater quantity
C lim ate
B iodiversity
Socio -econom ic0 .39
0 .49 0 .44
W ater qualityW ater quantityClimateBiodiv ers itySoc io -ec onomic
W ater qualityW ater quantityClimateBiodiv ers itySoc io -ec onomic


![[PRODUCT NAME]” - Janssen](https://img.dokumen.tips/doc/110x75/6206140f8c2f7b1730046562/product-name-janssen.jpg)