Embed Size (px)
Citation preview

Philipp Grötsch, Stefan Simis, Marieke Eleveld, Steef Peters
Spatial Coherence between Ferrybox Fluorescence measurements

4/19
How can cyanobacteria blooms be detected from Ferrybox data?
Challenge:
Measurements from in situ and remote sensing are not reliable during strong stratification:
● Ferryboxes sample at ~5 m depth● Remote sensing bio-optical algorithms assume vertically mixed water columns
Hypotheses:
1.Within a cyanobacteria bloom, Chlorophyll a (CHLa) and Phycocyanin (PC) fluorescence vary coherently, independent of the concentrations.
2.This coherence can be spatially resolved with continuous wavelet transform.
We show this for a summer bloom in the Baltic Sea.

7/19
Cyanobacterial Fluorescence
Ferrybox Fl. R2
CHLa 0.39
PC 0.76
CHLa, PC 0.82
All cyanobacteria include CHLa pigment. High % in non-fluorescing PSI.All cyanobacteria include PC pigment in fluorescing PSII
In a cyanobacteria dominated bloom:
→ CHLa fl. present but low→ CHLa and PC fl. are varying coherently
Seppälä2007: Explained variability of CHLa lab samples during summer bloom 2005 in the Baltic Sea
Where on a Ferrybox transect CHLa and PC fl.
are varying coherently?

8/19
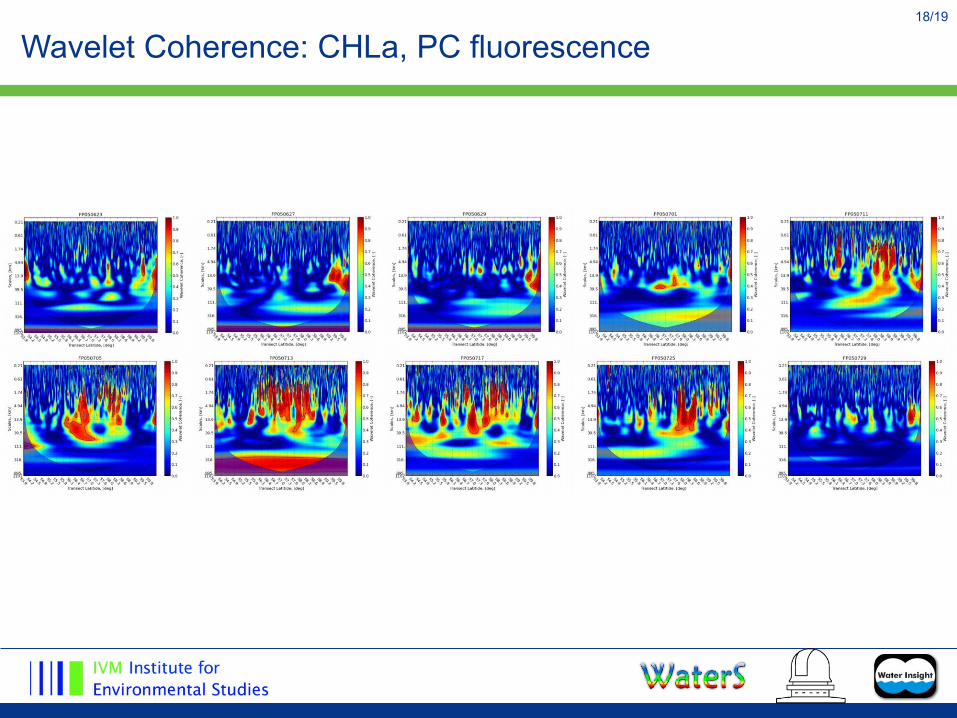
Wavelet Coherence
Signal 2
Signal 1
Wavelet Coherence
Fourier Transform● Decomposes signal in frequencies● Works only on stationary data
Continuous Wavelet Transform● Decomposes signal in frequency AND space● No stationarity assumption
Wavelet Coherence Transform
Measure of coherence between two wavelet transformed signals
Where and at what scales are two signals varying coherently

9/19
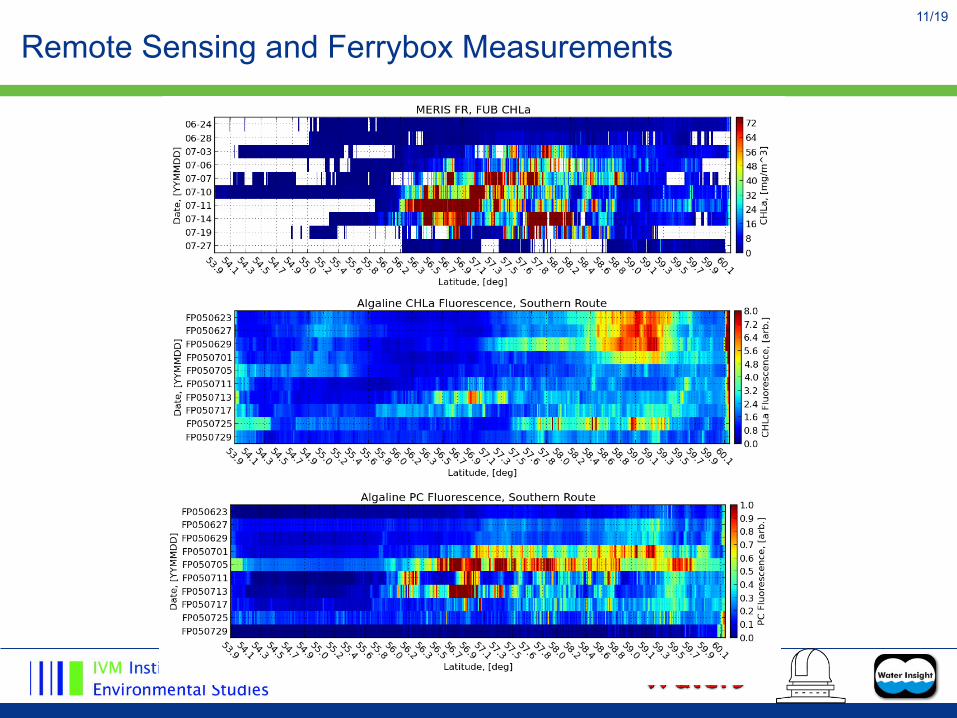
Case Study: Baltic Sea Summer Bloom 2005 (June, July)
● 10 Ferrybox transects (East of Gotland)● Travemünde (Germany) - Helsinki (Finland)● CHLa, PC fluorescence,
turbidity, temperature, salinity● Measurement depth: 5 m● Described in Seppälä2007
● 10 MERIS FR scenes (processed with WeW/FUB)
● ECMWF interim reanalysis: wind speed, SST
CHLa concentration from MERIS FR scene.
2005-07-14

10/19
Meteorological Situation
11/19
Remote Sensing and Ferrybox Measurements

12/19
Wavelet Coherence: CHLa, PC fluorescence

13/19
Synopsis

14/19
Synopsis

15/19
Summary, Application and Open Questions
Summary
● Wavelet coherence between CHLa and PC fluorescence is calculated● Coherence is high in cyanobacteria dominated transect-sections● Stratification situation can be estimated
Direct Applications
● Water samples from cyanobacteria dominated sections can be flagged for the calibration of CHLa fluorescence.
● Stratified sections can be dealt with separately during the validation with remote sensing data
Open Questions
● Distribution of Ferrybox CHLa and PC fl. is not Gaussian. Typical tests for significance of wavelet coherence rely on Gaussian distribution.
● What can the scale distribution of the wavelet coherence tell us?

16/19
Acknowledgements
Alg@line

17/19
Thank you for your attention – feedback is very welcome!!
18/19
Wavelet Coherence: CHLa, PC fluorescence

19/19
Vertical Distribution of the Water Column
Kutser, T., Metsamaa, L., & Dekker, A. G. (2008). Influence of the vertical distribution of cyanobacteria in the water column on the remote sensing signal. Estuarine, Coastal and Shelf Science, 78(4), 649-654. doi:10.1016/j.ecss.2008.02.024
● Water remote sensing:2D snapshots of 3D systems
● Vertical dimension NOT directly observable through remote sensing
→ Assumptions necessary
Most common assumption:
Vertically homogeneouswater column
→ High uncertainties


![[Coherence] coherence 모니터링 v 1.0](https://img.dokumen.tips/doc/110x75/54c1fc894a79599f448b456b/coherence-coherence-v-10.jpg)

