Embed Size (px)
Citation preview
Remote Sens. 2011, 3, 752-766; doi:10.3390/rs3040752
Remote Sensing ISSN 2072-4292
www.mdpi.com/journal/remotesensing
Article
Spatial and Temporal Land Cover Changes in the Simen
Mountains National Park, a World Heritage Site in
Northwestern Ethiopia
Menale Wondie 1,
*, Werner Schneider 2, Assefa M. Melesse
3 and Demel Teketay
4
1 Adet Agricultural Research Center, P.O. Box 08, Bahar Dar, Ethiopia
2 University of Natural Resources and Applied Life Science, A-1180 Vienna, Austria;
E-Mail: [email protected] 3 Department of Earth and Environment, Florida International University, ECS 339, 11200 S.W.8th
Street, Miami, FL 33199, USA; E-Mail: [email protected] 4 Okavango Research Institute, University of Botswana, Shorobe Road, Private Bag 285, Maun,
Botswana; E-Mail: [email protected]
* Author to whom correspondence should be addressed; E-Mail: [email protected];
Tel.: +251-583-380-828; Fax: +251-583-380-235.
Received: 5 January 2011; in revised form: 11 February 2011 / Accepted: 23 February 2011 /
Published: 8 April 2011
Abstract: The trend of land cover (LC) and land cover change (LCC), both in time and
space, was investigated at the Simen Mountains National Park (SMNP), a World Heritage
Site located in northern Ethiopia, between 1984 and 2003 using Geographical Information
System (GIS) and remote sensing (RS). The objective of the study was to generate spatially
and temporally quantified information on land cover dynamics, providing the basis for
policy/decision makers and resource managers to facilitate biodiversity conservation,
including wild animals. Two satellite images (Landsat TM of 1984 and Landsat ETM+ of
2003) were acquired and supervised classification was used to categorize LC types. Ground
Control Points were obtained in field condition for georeferencing and accuracy
assessment. The results showed an increase in the areas of pure forest (Erica species
dominated) and shrubland but a decrease in the area of agricultural land over the 20 years.
The overall accuracy and the Kappa value of classification results were 88 and 85%,
respectively. The spatial setting of the LC classes was heterogeneous and resulted from the
biophysical nature of SMNP and anthropogenic activities. Further studies are suggested to
evaluate the existing LC and LCC in connection with wildlife habitat, conservation and
management of SMNP.
OPEN ACCESS
Remote Sens. 2011, 3
753
Keywords: change analysis; GIS; land cover; land cover change; Landsat; remote sensing;
supervised classification
1. Introduction
Starting from the beginning of civilization, human-beings have deliberately managed and converted
the landscape to utilize and exploit natural resources mainly to derive basic needs such as food, shelter,
fresh water, and pharmaceutical products [1]. However, the increase in population has proportionally
increased the demand for resources for centuries; leading to the conversion of natural environmental
conditions. Ecological processes and human interventions are facilitating ecosystem changes as a
whole and land cover change (LCC) in particular. In particular term, LCC is a dynamic phenomenon
occurring within the interface between human agricultural and ecological systems [2]. In most parts of
the world, agriculture is the primary driver of land use change. The main pressure is to convert forests
to agricultural uses in order to meet the increasing demands caused by human population growth.
Scholes and Breeman [3] indicated that in addition to fossil fuels, the conversion of natural vegetation
to agriculture is partially responsible for changes in the atmospheric composition and climate
conditions. Despite the importance of landscape conversion to fulfill basic needs of humankind, LCCs
such as deforestation have been recognized as major problems in the world and are drivers of global
warming [4,5], which result in negative consequences for life on earth.
LCC may be the most significant agent of global change influencing hydrology, climate, and global
biogeochemical cycles. The negative consequences of LCC are changes of global and regional
climates, the global biogeochemical cycles such as carbon, nitrogen and water, biodiversity as well as a
change of the ecosystem functions as a whole [1,6-8]. It is a continuing process, a challenging
consequence and an environmental problem, especially in tropical regions where deforestation is
occurring at an alarming rate [3].
Information on LCC induced by population pressure and other external factors is required as a basis
for counter measures. Up-to-date global land cover data sets are necessary for various global change
research studies, including climate change, biodiversity conservation, ecosystem assessment and
environmental modeling [9]. Since land cover is the actual distribution of physical and biological
features of the land surface, up-to-date information on the status of the land surface is crucial for
environmental planning and management reasons [10]. The resource managers can superimpose the
land cover map to existing management and conservation zone maps and use it as a planning tool for
the optimization of protection sites (e.g., in SMNP) by providing information on the status of wildlife
and natural resources [11]. Remotely sensed image data are widely used in terrestrial, oceanographic
and atmospheric applications such as land cover mapping, environmental modeling and monitoring,
updating of geographical databases of the specific area, etc. [12]. Satellite remote sensing (RS) and
Geographical Information System (GIS) have been widely applied in identifying and analyzing LCC
for different purposes [13].
For sustainable management and decision making processes related to natural resources, knowledge
about the ecosystem on both the temporal and the spatial scale is required [14]. This managerial

Remote Sens. 2011, 3
754
decision on resources has to be based on change analysis, which is the comparison of the current status
with past events.
The physical, social and economic situations in Ethiopia have contributed to the degradation of
resources. There are different types of land cover formed by both human activities and natural factors
over the last centuries. Population pressure accompanied by sedentary agriculture, extensive animal
husbandry (livestock herding), settlement and socio-political instability have resulted in heavy
deforestation, forest fragmentation, loss of biodiversity and undesirable changes in the natural
ecosystem, including LCC [15].
Tatem et al. [16] noted that accurate information on land cover is required for both scientific
research and undertaking management interventions. The assessment of conversion of the land cover
types due to socio-economic and ecological factors helps to qualify and quantify its (Land cover
change determines or has an implication on the potential of the resource change) status with respect to
resource changes. Particularly, for SMNP, it is necessary to know which kind of land conversion is a
threat to the wildlife habitat so that further decision making processes can be initiated to undertake
management intervention for biodiversity conservation. If changes are assessed both quantitatively and
qualitatively, the management intervention as well as the decision making process can be planned to
meet the main objectives of the SMNP.
The general objective of the study was to generate spatially and temporally quantified information
on land cover dynamics and provide basic information for policy/decision makers and for resource
managers to undertake mitigation measures in areas at risk where the wildlife habitat is threatened.
This includes, primarily, biodiversity conservation and management of the park. The specific objective
of this study was to identify and quantify the rate of spatio-temporal LCC between 1984 and 2003. The
study also helps to produce land cover map to show the overall situation of the heritage site and
provides basic information for further study.
2. Materials and Methods
2.1. Study Site
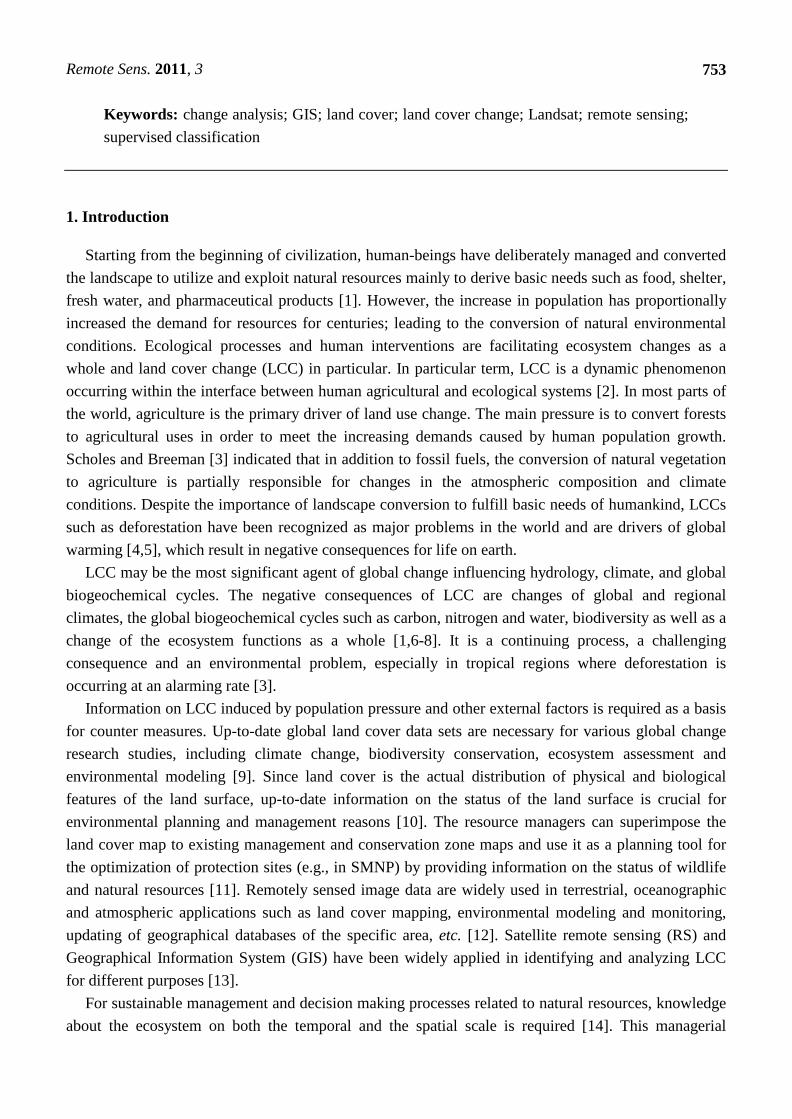
The SMNP is situated approximately between 13°09′ and 13°12′N and 38°00′ and 38°12′E [17]
(Figure 1). The nearest town is Debark in the North Gonder Zone, northwestern Ethiopia. It is about
920 km north of Addis Ababa. The altitude of SMNP ranges from 1,900 to 4,430 m. It has an
Afro-alpine undulating grassland plateau with steep escarpments lying towards both the north and east
direction, giving spectacular views of peaks and canyons of areas found outside the boundary of the
park. There are V- and U-shaped canyons due to geological processes. The rainfall pattern is
characterized by a single rainy season, whereby the highest amount of precipitation is between June
and September [18]. The average annual rainfall is between 1,350 and 1,550 mm and varies with
altitude [18,19]. Temperature ranges from −2 to 18 °C.
Remote Sens. 2011, 3
755
Figure 1. Location of the study area.
Due to differences in land use practice, geological events, topography and climate, different soil
types are found in the SMNP. Andosol type of soil is found on uncultivated land above 3,000 m,
whereas below 3,000 m and on cultivation land above 3,000 m, the dominant type of soil are
Phaeozem, Vertisol, Luvisol, Regosol and Leptosol [18]. The grassland is dominantly covered with
Andosol. The very small area, with no agricultural potential is attributed to Fluvisol. The Simen was
made up of thick basalt deposited on Mesozoic sandstone and limestone, Precambrian crystalline
basement, and harder rocks on the foot of the escarpment [19].
The park was officially established, delineated and legally gazetted on 31 October 1969 by order
No. 59 in the Negarit Gazeta [19]. Initially, it was proposed to cover an approximate area of 225 km2.
According to Hurni and Ludi [18], the SMNP was estimated to cover 13,900 ha (139 km2). During the
study of 2006, it covered an area of 13,907 ha [11]. Because of its rich biodiversity, high number of
endemic species and special bio-physical features, SMNP was one of the country‟s first sites to be
inscribed and listed as a World Heritage Site by UNESCO in 1978 [19].
2.2. Methods
Two methods, namely analysis of Landsat satellite image and field observations, were employed in
the study. The analysis of Landsat Satellite Images of TM 1984 and ETM+ 2003 was carried out to
identify LCC while the field observations (July–September 2006) were performed to collect reference
information for image analysis and verification of automated classification.

Remote Sens. 2011, 3
756
2.3. Data Collection
Two satellite images (Landsat TM of 1984 and Landsat ETM+ of 2003) were acquired from Earth
Science Data Interface (ESDI) [12]. A Digital Elevation Model (DEM) was needed for georeferencing
the 2003 Landsat image and for producing 3D perspective views of the resulting thematic maps.
Shuttle Radar Topographic Mission (SRTM) DEM 90 m was acquired from CGIAR-CSI that has no
areas of missing Z values. The specifications of this SRTM data set are: © 2004 CGIAR-CSI, Product:
SRTM 90-m DEM, Latitude: 10′ to 15′N, Longitude: 35′ to 40′E, Center Point: Latitude 12.50′N,
Longitude 37.50′E and, Tile: X = 44 and Tile Y = 10.
Field observations were carried out to obtain Ground Control Points (GCPs) for georeferencing the
images, to understand the features of the different LC classes, support visual interpretation of the
images and select reference areas [consisting of training areas (for supervised classification) and test
areas (for accuracy assessment)]. All reference areas were documented by photos and localized by GPS
measurements. Representative samples were taken from agricultural land, grassland/pasture, forest,
shrubland, settlement. The number of representative training samples for agriculture, mixed forest,
pure forest, shrubland and grassland were 31, 19, 22, 7 and 25, respectively. GPS readings were taken
for each sample point with an accuracy varying from 7 to 12 m. The land cover categorization scheme
was based on Tso and Mather [12] and Amsalu et al. [21] with some modifications (Table 1).
Table 1. Land cover classes used in the classification scheme.
Cover class Characterization features
Agricultural land
/cultivation
Cultivated and fallow land has a characteristic pattern, for example sharp
edges between fields. Dark to grey color in the Landsat image (4, 3 and 2
color composition), unless the land lies fallow [18,21]
Grassland/Pasture Land under permanent pasture and grassland, grassland mixed with Lobelia
species. Homogeneous, no pattern compared to agricultural land [18]
Mixed and matured
natural forest
Natural forests and woodlands with a composition of different tree species
[18]
Pure Forest One dominating species (Ericaceous species, >95% of the mix) [18]
Shrubland Shrubs, bushes and young tree species, bright red on the Landsat 4, 3 and 2
color composite [18]
2.4. Data Analyses
The TM 1984 image was georeferenced by the supplier using nearest neighbor resampling
technique [22]. The Landsat ETM+ 2003 image was georeferenced using 69 GCPs. The 2003 ETM+
Landsat image was rectified t o the UTM projection system WGS-1984-UTM-Zone 37N. The total
RMS error was 0.95 pixels, an error of 28.5 m. The residual of individual GCPs vary from 0.16 to
1.76 pixels. Due to the rugged topographic nature of the area and the existence of limited information
on GCPs, the RMS error is assumed to be satisfactory. The orthorectification resampling method used
is nearest neighbor. The method used to classify the Landsat images according to LC was supervised
classification using ERDAS Imagine 9.1 image processing software. Pixels were clustered into the
categories of agriculture, mixed natural forest, pure forest (dominant by >95% Ericaceous species),

Remote Sens. 2011, 3
757
shrubland and/or young species of other trees and grassland. ArcGIS 9.1 software was used for
spatial analysis.
Areas of Interests (AOIs) were selected as training areas (polygons) for image classification. The TM
1984 and ETM+ 2003 datasets were classified with the same number and size of AOIs of the respective
individual land cover types. Number, size and distribution of individual AOIs were variable within and
between LC classes depending on the location, information and data availability. The number of sample
AOIs (from field work, visual interpretation and the map) for agriculture, natural mixed forest, pure forest,
shrubland, grassland and unclassified (shadow) was 128, 50, 53, 65, 56 and 34, respectively. A total of
386 AOIs were used for classification. The decision rule used in supervised classification was the maximum
likelihood classifier algorithm. Equal a-priori probabilities of the individual categories were assumed.
The accuracy of the classification and the output of land cover mapping were assessed using
representative samples taken during field observations. The accuracy statistics provides objective
information about the quality of the LC classification. Accuracy assessment helps to identify
misidentifications as well as understand and measure how errors tend to be spatially correlated. Hence,
to control the quality of the classification output, accuracy assessment between the representative
samples of LC categories in field data versus the automated classification was conducted. Accuracy
assessment was carried out using error matrix techniques. The error matrix is one of the tools used for
classification accuracy assessment in order to compare known data (field data) with the corresponding
results of automated classification [23]. It helps to compare two thematic maps in a tabular form that
describes the accuracy of a classified map with respect to a reference map. In remote sensing image
analysis, the two thematic maps are often a “ground truth” map (the reference map) and a map derived
from automated image classification [23]. Based on the field survey, an error matrix (sometimes
referred to as confusion matrix) was compiled, showing field data versus automated classification
output. Overall accuracy of the classification, producer‟s and user‟s accuracy and Kappa Coefficient
were calculated from this error matrix.
Post classification comparison was carried out for the two independent images (thematic maps),
which is the most proven technique to deal with change detection [24]. Difference or change
information is generated by comparing image values of one data set (TM 1984) with those of the
corresponding layer of the second data set (ETM+ 2003). The ERDAS modeler is used to detect LCC
between the two datasets [25]. There were 36 change categories, corresponding to the transition from
each of the six classification categories of the one date to each one of the other date (including
“no-change”). A „conversion matrix‟ between TM 1984 versus ETM+ 2003 was compiled in the form
of a contingency table. This conversion matrix was used to quantify LCC in terms of pixel values, ha
or percentage of area coverage.
3. Results and Discussion
3.1. Results
The results of classification accuracy assessment are shown in Table 2. The overall accuracy and the
Kappa value of field data versus automated classification results were 88 and 85%, respectively. The
accuracy level of each true LC category is indicated in Table 3.

Remote Sens. 2011, 3
758
Table 2. Error matrix of field data versus ETM+ 2003 showing classification accuracy of
the true land cover (LC).
Automated
Classification Result
Field data
Total Agriculture
Mixed
forest
Pure
forest Shrubland Grassland
Agriculture 29 – 1 – 3 33
Mixed forest 0 19 – – – 19
Pure forest 1 – 16 – – 17
Shrubland 1 – 2 7 1 11
Grassland – – 3 - 21 24
Total Observations 31 19 22 7 25 104
Table 3. The accuracy level of each true LC category.
Land Cover Classes Producer’s accuracy (%) User’s accuracy (%)
Agriculture 93.6 87.9
Mixed natural forest 100.0 100.0
Pure forest 72.7 94.1
Shrubland/young trees 100.0 63.6
Grassland 84.0 87.5
The overall accuracy and Kappa values were 88 and 85%, respectively. The classification of
shrubland and mixed natural forest showed that 100% producer‟s accuracy, which means no pixel was
incorrectly excluded from its category. However, agriculture, pure forest and grassland showed the
omission of 6.4, 17.3 and 16%, respectively. Mixed natural forest showed 100% user‟s accuracy
indicating accurately automated classification was carried out, whereas shrubland is less accurately
classified (63%) in automated classification.
Two LC maps and one change map were produced for visual display of different LC categories
(Figure 2). On the classified map of TM 1984 and ETM+ 2003 images, the shadow/unclassified part
was included as a separate class in Figures 2a and b. In the LCC map, the shadow/unclassified category
was excluded, because the focus of the study was LCC, i.e., the change of true land cover.
Six categories were identified in each of the images of the two acquisition dates. Five categories can
be regarded as true LC classes, namely: mixed forest, pure forest, shrubland, grassland and agriculture.
One category was stated as shadow (unclassified) category. All the six categories (five true LC classes
and one unclassified category) generated a total of 36 possible combinations or transformations,
including the six identity transformations (no change). The total area of the SMNP under this study
was estimated at about 13,907 ha (154,526 pixels). From the total area of the park, 90,331 pixels
(58.5% of the area) remained unchanged and 41.5% of the area changed from one category to another
within 20 years (Figure 2(c)).

Remote Sens. 2011, 3
759
Figure 2. LC maps of: (a) 1984, (b) 2003 and (c) land cover change (LCC).
(a)
(b)

Remote Sens. 2011, 3
760
Figure 2. Cont.
(c)
3.2. Discussion
In the year 1984, the LC categories arranged in order of increase in extent were the shrubland, pure
forest, shadow, mixed natural forest, grassland and agricultural land. But, in the 2003 categorization,
the result changed due to shift of one category to another, i.e., mixed forest, pure forest, shrubland,
grassland and agriculture land (in the order of increase). This shift showed dynamicity of LC categories
over time. It is known that agriculture and grazing are the main livelihood strategies of the population
living in and around the SMNP. In 1984, grassland and agriculture in combination covered 50.26% of
the SMNP. Agriculture followed by grassland were the top two dominant LC classes of the SMNP
both in 1984 and in 2003 (Figure 3). The overall area of forest and shrubland increased in spite of the
intensive management of the park by agriculture and grazing (Figure 4). The increase may be due to the
decrease of the shadow area from 1984 to 2003, regulations of the abandonment of the land from
agriculture through government intervention and land fallowing due to decline of the soil fertility.
The percentage of the study area covered by pure forest and shrubland increased from 1984 to 2003.
Pure forest increased from 11.71 to 15.63% of the total cover area, which means increase by 33% of
1984 cover (Figure 4). Erica species dominated forest increased particularly at the “Gich” plateau due
to protection of the forest of the park and limited disturbance. The largest expansion was observed in
the category of shrubland/young forest. It covered 7.34% of the total area of the park in 1984. In 2003,
it expanded to 16.61% which is more than twice the cover of the year 1984. The net gain of shrubland
was 126% of that in the year 1984. The overall percentage of grassland remained relatively unchanged.
But, agricultural land decreased with a net loss of 683.82 ha between 1984 and 2003. The increases in
Remote Sens. 2011, 3
761
forest cover and diminishing of agricultural land have positive contribution to wildlife habitat and
protection of the natural resources. The conversion of one land cover to another is indicated in Figure 5.
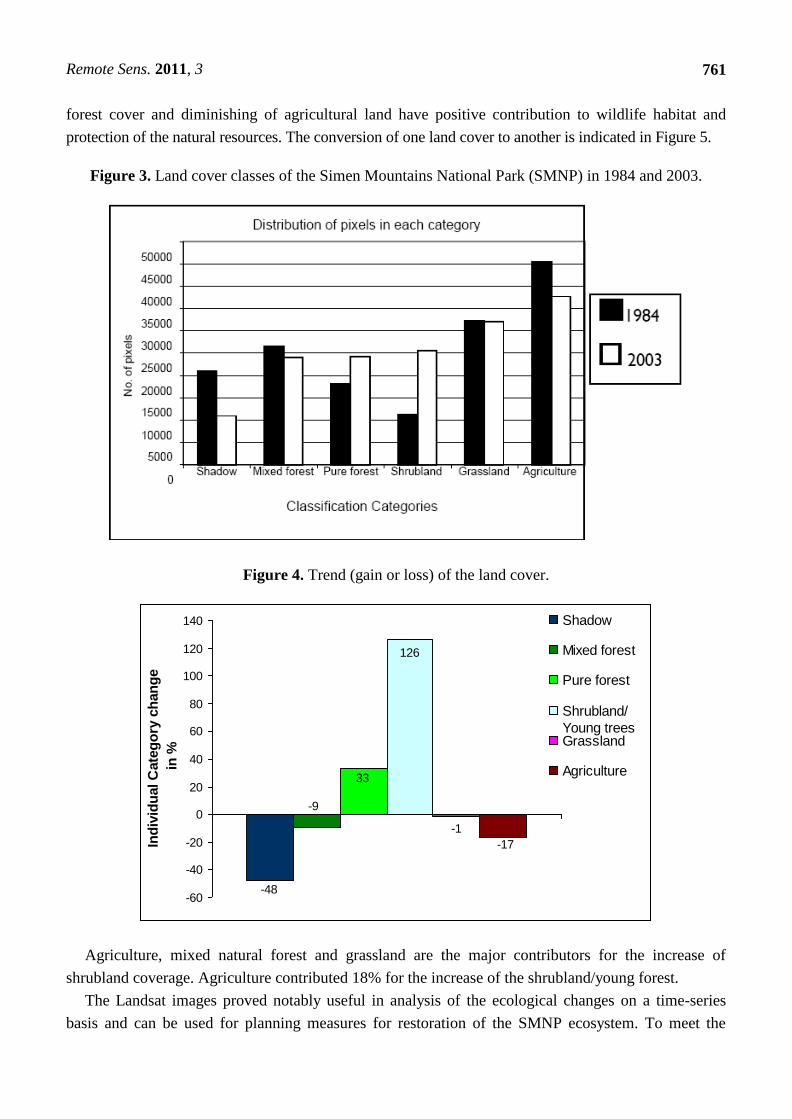
Figure 3. Land cover classes of the Simen Mountains National Park (SMNP) in 1984 and 2003.
Figure 4. Trend (gain or loss) of the land cover.
-1
-48
-9
33
126
-17
-60
-40
-20
0
20
40
60
80
100
120
140
Ind
ivid
ual C
ate
go
ry c
han
ge
in
%
Shadow
Mixed forest
Pure forest
Shrubland/
Young treesGrassland
Agriculture
Agriculture, mixed natural forest and grassland are the major contributors for the increase of
shrubland coverage. Agriculture contributed 18% for the increase of the shrubland/young forest.
The Landsat images proved notably useful in analysis of the ecological changes on a time-series
basis and can be used for planning measures for restoration of the SMNP ecosystem. To meet the
Remote Sens. 2011, 3
762
objectives of the SMNP, wildlife habitats, conservation sites, and management units can be identified
and delineated with the help of GIS and RS to set up development strategies, design management
activities and make decision on natural resources management. The output can be used as a basis for
future conservation, management and land development strategies.
Figure 5. Direction of change of one LC to another.
Using Landsat TM 1984 and ETM+ 2003 datasets, LCC was detected to understand the
trend/direction of the natural resources mainly of the land cover. The result showed that integration of
GIS and RS is effective in monitoring the overall status of the SMNP. The quantitative evidence of
land cover dynamics showed that the forest cover increased from 1984 to 2003 in spite of the increase
of human and animal population of the SMNP. The human and animal population is said to have
increased in the last five decades. However, the result of the study indicated that agricultural areas and
grassland, which form the economic basis for the people, have decreased and relatively remained
unchanged, respectively, between 1984 and 2003. This can be attributed to the biophysical nature of
the SMNP, regulatory rules of both National Regional and Federal Governments, international
organizations and, probably, land fallowing due to decline of the soil fertility. Therefore, it is not only
the socio-economic situation that has a direct impact on the dynamics of the LC, but also the

Remote Sens. 2011, 3
763
biophysical nature of the area. In general, the spatial distribution of the individual LC classes is the
result of human intervention and biophysical influences.
4. Conclusions
Five land cover categories are successfully classified and the shadow remained unclassified. The
classified categories were shown with their spatial distribution over time. Our results provide a
springboard to identify the LCC and an overall picture of the SMNP, which can serve as a hint to
anticipate the trend of land cover, mainly the forest cover. LCC also has an impact on the Afroalpine
ecosystem, which is the most important part of the national park as a habitat for the endangered
species. However, the shadow was stated as unclassified category. Further investigation on the
unclassified land cover categories, such as the shadow areas have to be incorporated in further research
and development programs designed for the park. These areas could be hot spot areas as wildlife
habitats, mainly, of birds, mountain climbing animals and highland forest species. Although
settlements have direct correlation to LCC, they were not successfully classified due to the limited
spatial resolution of the Landsat images and the pattern of settlements. Similarly, cliffs or the land
cover class of so-called “unusable land” as discussed in the study of Hurni and Ludi [18] could not be
recognized in the present study. There is a limitation to comparative study of the land cover change
using aerial photos and Landsat images owing to time and resource constraints. It was difficult to
address long term changes from the year in which SMNP was gazetted up to the present time.
Therefore, inclusion of all these data would help to show the long time trend of the resources and to
predict and model the future status of the SMNP. Trend information is recommended from the year
1969 to the present time in order to have a clearer and continuous database to further facilitate policy
decisions.
Analysis and display of LC and LCC in this study indicate the overall situation and highlight the
trends of the SMNP in terms of the LC. Therefore, our results can provide basic information for
efficient and effective monitoring of LC in relation to wildlife habitat conditions. The resource
managers can superimpose the land cover map to existing management and conservation zone maps
and use it as a planning tool for the optimization of protection sites within the park, providing
information on the status of wildlife and natural resources. Furthermore, the LC map can provide
information as an indicator of the overall environmental quality and direction of change of the SMNP
over the given time. Environmental parameters may be used as hints to plan the restoration of the park
and to support strategic decisions for conservation and development policy.
Remotely sensed data have a limitation: they provide information on land cover, but they cannot
provide information on „land use‟, which relates to the human (economic and cultural) activities
utilizing and influencing land cover. Combined analyses of field observations, socio-economic and
remotely sensed data are recommended to have a better output in terms of land use (LU) information.
This can provide better information on the inherent characteristics of LC and LU classes and give a
better overview on the status of the SMNP.
Although the energy source of the local people is wood-based, the overall annual rate of forest
increased, which is different from the general situation in Ethiopia. This figure might mask the
ecological status of different endangered species. LC map can be used to visualize the status of the

Remote Sens. 2011, 3
764
SMNP by both local people and policy makers so that they can feel the changes and suggest the
possible solutions. RS, with Landsat images, can detect the coarse scale status and change. However, it
may overlook fine-scale changes, e.g., a fine-scale fragmentation of the ecosystem. Grazing cattle can
have significant impact on vegetation, birds, mammals, and water, without being recognized by the
remote sensing methods applied here. Therefore, it is recommended to identify the status of the habitat
of wildlife, trend of the numbers of endemic and rare species as well as management and conservation
strategies in relation to LCC with terrestrial methods.
The change detection showed that shrubland/young forest area has increased. This may be due to the
abandonment of agricultural and grazing land. This evidence, in turn, indicates that the government
restrictions on agricultural practice within the park have been important in mitigating the pressures of
wildlife conservation and management over the last two decades: There is a reduction of agricultural
land, and almost no expansion of grazing land. But, the LCC should correlate with the objective of
SMNP related to conservation of endangered wildlife and endemic species and conservation of
biodiversity. Furthermore, off farm activities should be considered to improve the livelihood of farmers
so that the fragile ecosystem is maintained and the situation of natural resources is improved.
Land use activities could not be explained by image analysis in this study. Only the physical features
of the park are displayed and analyzed mainly cover categories. Therefore, further investigations on the
inherent characteristics of different LC classes have to be carried out. Further investigations of the
combination of remote sensing with data on the trend of human and animal populations, economic
activities, the social and cultural importance of the region, and policy issues would be helpful in
solving conservation and management problems and designing future development strategies.
It is important to prevent or take measures against further expansion of settlements, which might
have a negative impact on wildlife habitats. Limiting settlement expansion may help to manage and
conserve the wildlife and the fragile ecosystem. Consensus-based compromises are needed among the
stakeholders to facilitate both policy issues and management strategies in relation to land and land
cover changes in SMNP.
Acknowledgements
Austrian Foreign Exchange Service (Österreichischer Austauschdienst, ÖAD) is highly acknowledged
for covering all the financial expenses of the study. Franz Suppan is acknowledged for technical support
and guidance in remote sensing part of the study. Our thanks go to Adet Agricultural Research Center for
logistic and office facility support. We are very grateful to farmers of the SMNP for their hospitality
during field work.
References
1. Goldewijk, K.; Ramankutty, K. Land cover change over the last three centuries due to human
activities: The availability of new global data sets. Geojournal 2004, 61, 335-344.
2. Manson, S.M. Agent-based modeling and genetic programming for modeling land change in the
Southern Yucatán Peninsular Region of Mexico. Agr. Ecosyst. Environ. 2005, 111, 47-62.
3. Scholes, R.J.; Breeman, N. The effects of global change on tropical ecosystems. Geoderma 1997,
79, 9-24.

Remote Sens. 2011, 3
765
4. Velazquez, A.; Elvira, D.; Ramirez, I.; Mas, J.; Bocco, G.; Ramirez, G.; Palacio, J. Land
use-cover change processes in highly biodiverse areas: The case of Oaxaca, Mexico. Glob.
Environ. Change 2003, 13, 175-184.
5. Kintz, D.B.; Young, K.R.; Crews-Meyer, K.A. Implications of land use/land cover change in the
buffer zone of a national park in the tropical andes. Environ. Manage. 2006, 38, 238-252.
6. Lopez, E.; Bocco, G.; Mendoza, M.; Velazquez, A.; Axguirre-Rivera, J.R. Peasant emigration and
land-use change at the watershed level: A GIS-based approach in Central Mexico. Agr. Syst. 2006,
90, 62-78.
7. Xiao, J.; Shen, Y.; Ge, J.; Tateishi, R.; Tang, C.; Liang, Y.; Huang, Z. Evaluating urban expansion
and land use change in Shijiazhuang, China, by using GIS and remote sensing. Landscape Urban
Plan. 2006, 75, 69-80.
8. Wu, Q.; Li, H.; Wang, R.; Paulussen, J.; He, Y.; Wang, M.; Wang, B.; Wang, Z. Monitoring and
predicting land use change in Beijing using remote sensing and GIS. Landscape Urban Plan.
2006, 78, 322-333.
9. Giri, C.; Zhu, Z.; Reed, B. A comparative analysis of the Global Land Cover 2000 and MODIS
land cover data sets. Remote Sens. Environ. 2007, 94, 123-132.
10. Melesse, A.M. Spatiotemporal dynamics of land surface parametres in the Red River of the North
Basin. Phys. Chem. Earth 2004, 29, 795-810.
11. Wondie, M. Study on Spatial and Temporal Land Cover Changes Using Geographical Information
System (GIS) and Remote Sensing in the Simen Mountains National Park, Northwestern Ethiopia.
M.Sc. Thesis, University of Natural Resources and Applied Life Sciences, Vienna, Austria, 2007.
12. Tso, B.; Mather, P. Classification Methods for Remotely Sensed Data; CRC Press: Boca Raton,
FL, USA, 2007.
13. Hathout, S. The use of GIS for monitoring and predicting urban growth in East and West St Paul,
Winnipeg, Manitoba, Canada. J. Environ. Manag. 2002, 66, 229-238.
14. Burnnett, C.; Fall, A.; Temppo, E.; Kalliola, R. Monitoring current status of and trends in boreal
forest land use in Russian Karelia. Conserv. Ecol. 2003, 7, 8.
15. Yirdaw, E. Restoration of the Native Woody-Species Diversity, Using Plantation Species as
Foster Trees, in the Degraded Highlands of Ethiopia. Ph.D. Dissertation, University of Helsinki,
Helsinki, Finland, 2007.
16. Tatem, A.J.; Lewis, H.G.; Atkison, P.M.; Cixon, M.S. Increasing the spatial resolution of
agricultural land cover maps using a Hopfield neural network. Int. J. Geogr. Inform. Syst. 2003, 7,
647-672.
17. Edroma, E.L.; Smith, K.H. Monitoring Mission Report to Simen Mountains National Park and
World Heritage Site, Ethiopia; UNESCO and IUCN the World Heritage Centre: Paris, France,
9–14 April 2001.
18. Hurni, H.; Ludi, E. Reconciling Conservation with Sustainable Development: A Participatory
Study inside and around the Simen Mountains National Park, Ethiopia; Center for Development
and Environment (CDE), University of Bern: Bern, Switzerland, 2000.

Remote Sens. 2011, 3
766
19. Hurni, H. Management Plan: Simen Mountains National Park and Surrounding Rural Area;
UNESCO World Heritage Committee and Wild Life Conservation Organization: Addis Ababa,
Ethiopia, 1986.
20. Earth Science Data Interface at the Global Land Cover Facility. Available online:
http://glcfapp.umiacs.umd.edu:8080/esdi/esdi_index.jsp (accessed on 4 January 2007).
21. Amsalu, A.; Stroosnijder, L.; de Graaff, J. Long-term dynamics in land resource use and the
driving forces in the Beressa watershed, highlands of Ethiopia. J. Environ. Manag. 2007, 83,
448-459.
22. NASA Landsat Program. Landsat ETM+ scene L71008058_05820031026, SLC-Off; USGS:
Sioux Falls, SD, USA, 26 October 2003. Available online: http://srtm.csi.cgiar.org (accessed on 4
January 2007).
23. Lillesand, T.M.; Kiefer, R.W. Remote Sensing and Image Interpretation, 4th ed.; John Wiley and
Sons, Inc.: Hoboken, NJ, USA, 2000.
24. Shalaby, A.; Tateishi, R. Remote sensing and GIS for mapping and monitoring land cover and
land-use changes in the Northwestern coastal zone of Egypt. Appl. Geogr. 2007, 27, 28-41.
25. ERDAS Imagine. ERDAS IMAGINE® Tour Guides™; ERDAS: Atlanta, GA, USA, 2006.
© 2011 by the authors; licensee MDPI, Basel, Switzerland. This article is an open access article
distributed under the terms and conditions of the Creative Commons Attribution license
(http://creativecommons.org/licenses/by/3.0/).


![Untitled-2 [encomas.com]encomas.com/wp-content/uploads/2019/10/Bintong-PDF.pdf · 2019-10-01 · Lepaan Simen Jubin Seramik Lapisan Simen Cat Lapisan Simen Cat Jubin Gilap Setinggi](https://img.dokumen.tips/doc/110x75/5e592267d8bff7332d70f5f5/untitled-2-2019-10-01-lepaan-simen-jubin-seramik-lapisan-simen-cat-lapisan.jpg)