Embed Size (px)
Citation preview

Atmos. Chem. Phys., 18, 11389–11407, 2018https://doi.org/10.5194/acp-18-11389-2018© Author(s) 2018. This work is distributed underthe Creative Commons Attribution 4.0 License.
Spatial and seasonal variations of aerosols over China from twodecades of multi-satellite observations – Part 1: ATSR (1995–2011)and MODIS C6.1 (2000–2017)Larisa Sogacheva1, Gerrit de Leeuw1, Edith Rodriguez1, Pekka Kolmonen1, Aristeidis K. Georgoulias2,Georgia Alexandri2, Konstantinos Kourtidis2, Emmanouil Proestakis3,4, Eleni Marinou5, Vassilis Amiridis3,Yong Xue6, and Ronald J. van der A7
1Finnish Meteorological Institute (FMI), Climate Research Programme, Helsinki, Finland2Laboratory of Atmospheric Pollution and Pollution Control Engineering of Atmospheric Pollutants,Department of Environmental Engineering, Democritus University of Thrace, Xanthi, Greece3National Observatory Athens (NOA), Greece4Laboratory of Atmospheric Physics, Department of Physics, University of Patras, 26500, Greece5Deutsches Zentrum für Luft und Raumfahrt (DLR), Institut für Physik der Atmosphäre, Oberpfaffenhofen, Germany6Department of Electronics, Computing and Mathematics, College of Engineering and Technology,University of Derby, Derby DE22 1GB, UK7Royal Netherlands Meteorological Institute (KNMI), De Bilt, the Netherlands
Correspondence: Larisa Sogacheva ([email protected])
Received: 16 March 2018 – Discussion started: 26 March 2018Revised: 25 June 2018 – Accepted: 12 July 2018 – Published: 14 August 2018
Abstract. Aerosol optical depth (AOD) patterns and inter-annual and seasonal variations over China are discussedbased on the AOD retrieved from the Along-Track ScanningRadiometer (ATSR-2, 1995–2002), the Advanced ATSR(AATSR, 2002–2012) (together ATSR) and the MODer-ate resolution Imaging Spectroradiometer (MODIS) aboardthe Terra satellite (2000–2017). The AOD products usedwere the ATSR Dual View (ADV) v2.31 AOD and theMODIS/Terra Collection 6.1 (C6.1) merged dark target (DT)and deep blue (DB) AOD product. Together these datasetsprovide an AOD time series for 23 years, from 1995 to2017. The difference between the AOD values retrieved fromATSR-2 and AATSR is small, as shown by pixel-by-pixel andmonthly aggregate comparisons as well as validation results.This allows for the combination of the ATSR-2 and AATSRAOD time series into one dataset without offset correction.
ADV and MODIS AOD validation results show simi-lar high correlations with the Aerosol Robotic Network(AERONET) AOD (0.88 and 0.92, respectively), while thecorresponding bias is positive for MODIS (0.06) and neg-ative for ADV (− 0.07). Validation of the AOD productsin similar conditions, when ATSR and MODIS/Terra over-
passes are within 90 min of each other and when both ADVand MODIS retrieve AOD around AERONET locations,show that ADV performs better than MODIS in autumn,while MODIS performs slightly better in spring and sum-mer. In winter, both ADV and MODIS underestimate theAERONET AOD.
Similar AOD patterns are observed by ADV and MODISin annual and seasonal aggregates as well as in time series.ADV–MODIS difference maps show that MODIS AOD isgenerally higher than that from ADV. Both ADV and MODISshow similar seasonal AOD behavior. The AOD maximashift from spring in the south to summer along the easterncoast further north.
The agreement between sensors regarding year-to-yearAOD changes is quite good. During the period from 1995to 2006 AOD increased in the southeast (SE) of China. Be-tween 2006 and 2011 AOD did not change much, showingminor minima in 2008–2009. From 2011 onward AOD de-creased in the SE of China. Similar patterns exist in year-to-year ADV and MODIS annual AOD tendencies in the over-lapping period. However, regional differences between theATSR and MODIS AODs are quite large. The consistency
Published by Copernicus Publications on behalf of the European Geosciences Union.

11390 L. Sogacheva et al.: Spatial and seasonal variations of aerosols over China – Part 1
between ATSR and MODIS with regards to the AOD ten-dencies in the overlapping period is rather strong in summer,autumn and overall for the yearly average; however, in win-ter and spring, when there is a difference in coverage be-tween the two instruments, the agreement between ATSR andMODIS is lower.
AOD tendencies in China during the 1995–2017 periodwill be discussed in more detail in Part 2 (a following paper:Sogacheva et al., 2018), where a method to combine AODtime series from ADV and MODIS is introduced, and com-bined AOD time series are analyzed.
1 Introduction
The concentrations of aerosols in China have been relativelyhigh over the last two decades (e.g., Wang et al., 2017; Zhanget al., 2017), and are rising as a consequence of economic de-velopment, industrialization, urbanization and the associatedtransport and traffic. Examples of other factors affecting in-terannual and seasonal variations of the aerosol optical depth(AOD) over China are the generation and transport of desertdust (e.g., Proestakis et al., 2018; Wang et al., 2008), sea-sonal biomass burning (e.g., Chen et al., 2017a) and meteo-rological conditions and large-scale circulation (Zhu et al.,2012). Both the direct production of aerosol particles andthe emission of aerosol precursor gases, such as SO2, NO2and volatile organic compounds (VOCs), contribute to theobserved aerosol concentrations, which manifest themselvesas particulate matter (PM) or AOD (Bouarar et al., 2017).PM2.5, the dry mass of aerosol particles with an ambient di-ameter smaller than 2.5 µm, is often used in air quality andhealth studies as a measure for aerosol concentrations. PM2.5is a local quantity that is usually measured near the surface.In contrast, AOD is the column-integrated extinction coeffi-cient, which is an optical property commonly used in climatestudies; AOD can be measured from satellites or ground-based remote sensing. PM2.5 and AOD, although both usedas a measure for the occurrence of aerosols, are very differentaerosol properties which cannot be directly compared.
Spatial variation, seasonal variability and time series havebeen observed from the analysis of ground-based networksmeasuring aerosol optical properties using sun photometersin, e.g., the Aerosol Robotic Network (AERONET, Hol-ben et al., 1998), the China Aerosol Remote Sensing Net-work (CARSNET, Che et al., 2015), the Campaign on Atmo-spheric Aerosol Research network of China (CARE-China,Xin et al., 2015) and the Sun-sky radiometer ObservationNETwork (SONET, Li et al., 2018) or hand-held sun pho-tometers in the Chinese Sun Hazemeter (CSHNET, Wang etal., 2011) networks. These networks provide point measure-ments, which are representative for a limited area, and thecoverage across China still leaves large gaps. Satellite obser-vations, although less accurate, fill these gaps and provide
a clear picture of spatial and temporal variations across thewhole country.
In de Leeuw et al. (2018), it was shown how the comple-mentary use of three satellite-based radiometers, the Along-Track Scanning Radiometer ATSR-2 on ERS-2, the Ad-vanced ATSR (AATSR) aboard the environmental satelliteEnvisat, and the MODerate resolution Imaging Spectrora-diometer (MODIS) on Terra, results in two decades (1995–2015) of AOD observations over mainland China. This infor-mation was complemented with observations on the aerosolvertical structure from the Cloud-Aerosol Lidar with Or-thogonal Polarization (CALIOP) between January 2007 andDecember 2015. The satellite data show the high aerosolconcentrations over distinct regions in China such as theNorth China Plain (NCP) including the Beijing–Tianjin–Hebei (BTH) area, the Yangtze River Delta (YRD), the PearlRiver Delta (PRD) and Sichuan Province/Chongqing, as wellas the enhanced AOD over the Taklamakan Desert (TD).
The two-decadal time series show the initial rise of theaerosol burden over China at the end of the 1990s, whichwas followed by AOD variations in response to policy mea-sures to improve air quality via the reduction of emissionsof both aerosol particles and their precursor gases such asSO2 and NO2 (e.g., van der A et al., 2017). After 2011, theAOD appears to decrease toward the end of the study periodused in de Leeuw et al. (2018), i.e., the end of 2015. Theseobserved temporal variations of the AOD have also been re-ported elsewhere, including recent analyses indicating a de-cline since about 2011 (Zhang et al., 2017; Zhao et al., 2017)with some variation in the reported pivot point. The ques-tion of whether the recent decrease in AOD is confirmed byan extension of the time series with the most recent data isaddressed in the current paper and studied in more detail inSogacheva et al. (2018) – hereafter referred as Part 2.
Most of the aerosol studies over China are focused onthe southeastern (SE) part of the country or on specific re-gions or cities in SE China. However, the economic situationand governmental policy measures to improve air quality byemission reduction obviously influence the temporal varia-tions of the AOD in each province. This is due to the factthat differences in the emissions between provinces also oc-cur due to the differences in regional policies on emissioncontrol and their implementation schedule (Jin et al., 2016;van der A et al., 2017). In addition, both meteorological con-ditions and large-scale circulation will vary from year to yearand between different parts of China during each year. As aresult, the aerosol properties and their spatial and temporalvariations are expected to be different across China. As an il-lustration, Fig. 1 shows the AOD time series retrieved usingthe ATSR Dual View aerosol retrieval algorithm (ADV) ver-sion 2.31 (Kolmonen et al., 2016; Sogacheva et al., 2017),for the years 1995–2011, for two areas. One area coversmainland China, the other one only SE China (see Sect. 2and Fig. 2 for specification of these regions). Clearly, theAOD over SE China is substantially higher than over main-
Atmos. Chem. Phys., 18, 11389–11407, 2018 www.atmos-chem-phys.net/18/11389/2018/

L. Sogacheva et al.: Spatial and seasonal variations of aerosols over China – Part 1 11391
Figure 1. Time series of ATSR-retrieved AOD at 550 nm over Chinafor the years 1995–2011. Note that data are missing at the beginningof the ATSR-2 observation period in 1995 and 1996, and AATSRdata start from August 2002.
land China, but the AOD also increases much faster over SEChina. In addition, the interannual variations are quite simi-lar, with minima and maxima occurring in the same years butwith larger amplitudes over SE China.
In this paper, the work presented in de Leeuw et al. (2018)is extended to obtain information on the occurrence ofaerosols and their spatial and temporal variation over Chinawith a focus on regional differences in annual and seasonalAOD behavior. In addition, the study period is extended byincluding 2016 and 2017 and the most recent update of theMODIS AOD data set, Collection 6.1 (C6.1), is used insteadof C6. The C6.1 AOD validation results, the C6.1 vs. C6comparison, the differences between the ADV and MODISC6.1 seasonal AOD aggregates and the differences in AODtendencies during the overlapping period (2000–2011) arediscussed. The results from the ADV and MODIS AOD com-parison will be utilized in Part 2 to construct a combinedlong-term AOD time series from ADV and MODIS for theperiod from 1995 to 2017. AOD tendencies over the selectedregions will be estimated in Part 2 for the different periodscharacterized by changes in air pollution control policies inChina (Jin et al., 2016; van der A et al., 2017).
The structure of this paper is as follows. In Sect. 2, thestudy area, including the selection of the 10 regions, is de-scribed. In Sect. 3, satellite data are introduced, with a focuson the data coverage (Sect. 3.2), consistency between ATSR-2 and AATSR AOD (Sect. 3.3) and MODIS C6.1 and C6AOD differences over China (Sect. 3.4). ATSR and MODISvalidation results are discussed in Sect. 4. Section 5 focuseson the seasonal AOD variations and their differences for theselected regions across China. In Sect. 6, the main results aresummarized as conclusions.
Figure 2. Regions over mainland China selected for further studyof seasonal, interannual and long-term behavior of the AOD, over-laid on the ATSR-retrieved (ADV version 2.31) 12-year aggregatedAOD map. Mainland China is indicated by the black line. Figureshows the 10 selected regions over China and a larger area over SEChina indicated by SE.
2 Study area and selection of different regions
The study area, China, encompasses the same area as in deLeeuw et al. (2018), i.e., the area between 18–54◦ N and73–135◦ E defined as 1◦× 1◦ grid cells with retrievals overland and constrained by the borders indicated by the blackline in Fig. 2. The spatial variations of the AOD (Fig. 2)combined with geographical knowledge (cf. de Leeuw et al.,2018) and general knowledge of the locations of highly pop-ulated and industrialized urban centers in China was used toselect regions with different characteristics for a more de-tailed study on the long-term variation of the seasonal andannual AOD. The results are expected to show differencesin the AOD across China due to different climate conditionsand differences in economic development. Such considera-tions resulted in the selection of 10 study areas as shownin Fig. 2: seven study areas (regions 1–7) in SE China (de-fined in this study as the over-land area between 20–41◦ Nand 103–135◦ E), one covering the Tibetan Plateau (region8), one over the Taklamakan Desert (region 9) and one overnortheastern (NE) China (region 10). It is noted that all ar-eas used in this study only consider the AOD over mainlandChina, i.e., AOD over the oceans or islands is not included.
Obviously, other choices are possible, such as those madeby Luo et al. (2014) or Wang et al. (2017). The regions se-lected by Luo et al. (2014) are generally somewhat smallerthan those in Fig. 2, although some were in slightly differentregions to those in this study. However, overall the choicesare similar and seem to cover major urban/industrial regionssuch as BTH, the YRD and the PRD, Sichuan/Chongqingand cleaner regions in the north (region 10 in Fig. 2) andsoutheast (region 3). Regions were also chosen to repre-sent the Tibetan Plateau and Taklamakan Desert. Wang et
www.atmos-chem-phys.net/18/11389/2018/ Atmos. Chem. Phys., 18, 11389–11407, 2018

11392 L. Sogacheva et al.: Spatial and seasonal variations of aerosols over China – Part 1
al. (2017) selected seven regions in North China (north of32◦ N), some of which partly overlap with the regions se-lected for the current study. Other studies on the seasonalvariation over China were guided by the location of ob-servational sites (e.g., Wang et al., 2011; Che et al., 2015;Wang et al., 2015). Another option may be to select regionsby province (e.g., van der A et al., 2017); however, someprovinces would cover a mix of high and low AOD regions,while other provinces would be too small for a statisticallymeaningful data set.
3 Satellite data
3.1 MODIS C6.1 DTDB and ATSR ADV version 2.31
The data used in this work were discussed in detail in deLeeuw et al. (2018). However, in the current study, theMODIS C6 DTDB merged AOD product (Sayer et al., 2014)was replaced with the recently released MODIS C6.1. In ad-dition, MODIS/Terra data for 2016 and 2017 have been in-cluded in the analysis to provide information on the AODevolution for the most recent years. In short, L3 (aver-aged on a grid of 1◦× 1◦) monthly AOD data retrievedfrom ATSR-2 (1995–2002) and AATSR (2002–2012) (to-gether referred to as ATSR) using ADV version 2.31 (Kol-monen et al., 2016; Sogacheva et al., 2017; Veefkind et al.,1998) and MODIS/Terra AOD C6.1 merged DTDB (L3)monthly data (MOD08_M3, 2000–2017, https://ladsweb.modaps.eosdis.nasa.gov/, last access: 6 August 2018) wereused together to cover the period from 1995 to 2017. Valida-tion of the ADV and MODIS AOD products was performedfor L2 (averaged on a grid of 0.1◦×0.1◦) daily data, retrievedwith the same corresponding ADV and MODIS algorithmsas for L3. Hereafter, the ATSR ADV version 2.31 AOD prod-uct will be referred to as ADV, and the MODIS/Terra AODC6.1 merged DTDB AOD product will be referred to asMODIS.
In this study, the annually averaged AOD data were ob-tained by averaging monthly aggregated AOD data for eachyear. Furthermore, the seasonal means were obtained as av-erages of monthly aggregates for winter (DJF, including De-cember, January and February), spring (MAM, includingMarch, April and May), summer (JJA, including June, Julyand August) and autumn (SON, including September, Octo-ber and November). Annual and seasonal linear AOD tenden-cies for both MODIS and ADV AOD for the overlapping pe-riod (2000–2011), when both ATSR and MODIS exist, wereestimated using the least squares linear regression method(Chandler and Scott, 2011).
3.2 ADV and MODIS coverage over selected regions
As introduced in de Leeuw et al. (2018), ATSR and MODIShave different temporal and spatial coverage over China. In
brief, MODIS/Terra covers China in 1–2 days, while ATSRcovers China in 4–5 days.
The ADV datasets for the years 1995, 1996 and 2012 areincomplete. For 1995 and 1996, ADV AOD data are avail-able for the second half of each year (June–December andJuly–December, respectively). However, all available ADVAOD data in 1995 and 1996 are used in the current studyto construct the annual aggregates for comparison with otherannual aggregates. Obviously, the 1995 and 1996 aggregatesare not exact; therefore, the possible error related to the miss-ing data has been estimated by comparison of the full-year(January to December) AOD composites with the half-year(July–December) AOD composites for the complete years(1997–2011). This comparison shows that when the half-year aggregate was used to present the full-year aggregate,the AOD was underestimated by −0.036 on average (withstandard deviation of 0.02), or about 15 % of the yearly ag-gregated AOD value. In this study, the aggregated AOD val-ues for the years 1995 and 1996 have not been corrected forthe missing data and those years are included in the furtheranalysis as they are. Another point worth mentioning is thatthe white area in the far west of the study area, where ATSR-2 did not provide data, was because the data collection wasswitched off for data transfer to the receiving station overthat area. For 2012, the ADV AOD data are available untilthe connection with the satellite was lost on the 6 April.
For MODIS/Terra, the AOD data record starts from theend of February 2000. Thus, the winter season for 2000 ismissing.
To estimate the spatial coverage of AOD, the fraction ofthe area where AOD is available has been calculated for allseasonal and annual aggregates for the selected regions (Ta-ble S1 in the Supplement). In spring (MAM), summer (JJA)and autumn (SON), the respective ADV coverage reaches84 %, 91 % and 91 %, while MODIS coverage is 93 %, 93 %and 97 %, respectively, over mainland China. Throughout theyear, both ADV and MODIS coverages are close to 100 %,except for region 9, where the ADV coverage is 62 %. Forboth ADV and MODIS, the Tibetan Plateau (region 8), theTaklamakan Desert (region 9) and NE China (region 10) arecovered less than other regions, throughout the year.
Regarding the seasons, the lowest AOD coverage is ob-served in winter (DJF), when northern and western Chinaare covered with snow. As with most aerosol retrieval al-gorithms, MODIS and ADV have difficulty retrieving AODover snow and ice (Hsu et al., 2013; Istomina et al., 2011;Kolmonen et al., 2016), in addition to year-round difficultyover bright surfaces such as the Taklamakan Desert. On av-erage, in winter MODIS provides AOD values over 70 % ofmainland China, while ADV AOD is available over 35 % ofChina. For certain years, ADV AOD is not available in thewinter over regions 9 and 10; thus, it is not shown in theanalysis (Sect. 5). However, as the annual AOD time seriesfor ADV and MODIS in regions 9 and 10 show similar ten-dencies (discussed later in Sect. 5.3), we assume that missing
Atmos. Chem. Phys., 18, 11389–11407, 2018 www.atmos-chem-phys.net/18/11389/2018/

L. Sogacheva et al.: Spatial and seasonal variations of aerosols over China – Part 1 11393
(for some years) ADV AOD in winter does not considerablybias the results.
Therefore, besides the difference in the validation resultspresented and discussed below (Sect. 4), which is likelydue to the differences in the ADV and MODIS AOD re-trieval approaches and their implementation, the differencein the ATSR and MODIS/Terra spatial and temporal cover-age might influence the AOD composites. Another exercisemight be performed, where AOD aggregates are built for col-located ADV and MODIS pixels, but this is beyond the scopeof the current paper, where AOD aggregates for all availablepoints in the ADV and MODIS standard products are ana-lyzed and compared.
3.3 Consistency between ATSR-2 and AATSR AODdatasets
The ATSR-2 and AATSR instrument characteristics are verysimilar (ATSR-1/2 User Guide, 1999; AATSR Product Hand-book, 2007). The main potential reason for a differencewould be offsets of the sensors’ absolute calibration andsmall differences in band spectral response functions. Unfor-tunately, error characteristics of the two instruments are notavailable. Thus, we compare and validate the AOD productsobtained from ATSR-2 and AATSR with the same retrievalalgorithm (ADV V2.31). ATSR-2 was in an orbit ca. 30 minlater than AATSR, which allows for the direct comparison ofthe retrieved collocated pixels. The number of collocationsis limited by the cloud-free conditions for both overpassesneeded for the retrieval.
The AATSR AOD data series starts on the 20 May 2002.However, several data interruptions in June–July do not al-low for the constructions of monthly aggregates. Thus, thecomparison analysis between ATSR-2 and AATSR AOD isperformed for August–December 2002. The period is lim-ited by technical issues with the ATSR-2 pointing accuracy,which started in 2003.
Pixel-by-pixel comparison between the ATSR-2 andAATSR L2 AOD is shown in Fig. 3 with (i) a scatter densityplot of the difference between AATSR and ATSR-2 AODs asa function of AATSR and AOD and (ii) box plots with statis-tics related to certain AOD bins. For AOD< 0.5 (78.8 % ofall retrieved pixels), the offset is close to 0, which means thatthere is practically no offset between ATSR-2 and AATSRAOD for low (<0.5) AOD. For an AOD between 0.5 and1.5 (20.6 % of all retrieved pixels), the median values inchosen bins are slightly below 0, while the mean AATSRAOD is 0.05–0.12 lower than the mean ATSR-2 AOD. For anAOD> 1.5, AATSR AOD is considerably higher. However,only 0.6 % of the retrieved pixels fit into the AOD> 1.5 bin.
Monthly AOD aggregates for August–December 2002 forChina and globally over land are shown in Fig. 4. Themonthly aggregates over China combined from L3 data showsimilar values for the two ATSR instruments, i.e., there are nosystematic difference between ATSR-2 and AATSR AODs.
ATSR-2 AOD is ca 0.035 higher in August and October,while AATSR is higher by a similar amount in Septemberand by ca 0.02 in November. In December, AOD retrievedwith the two instruments is similar. On a global scale, AODretrieved from ATSR-2 is somewhat higher (ca. 0.01–0.03)than that from AATSR in all months except October, wherethe AOD difference is negligible. Error bars, which show 1σstandard deviation of AOD for each aggregate, closely over-lap for all of the pairs that were compared.
For an evaluation of the differences between the AOD re-trieved from ATSR-2 and AATSR, data from the overlap pe-riod (August–December 2002) were validated using ground-based AOD from AERONET, which for that period are avail-able over the BTH area from 2002 and over Taiwan (whereAERONET measurements were started in 1998). The lowdensity of AERONET stations during that period and the lim-ited number of available collocations (5 for ATSR-2 and 17for AATSR) does not allow for statistically significant con-clusions on the AOD quality. Thus, we additionally added allavailable global locations for August–December 2002 for anevaluation exercise. The results in Fig. 5 show the correlationcoefficient (R = 0.89), and the low bias between AERONETand ATSR-2 AOD (Fig. 5, left). For AATSR the correlation isalso high (0.86), with a small bias (0.01). AOD standard de-viation is 0.008 and 0.005 and root mean square error is 0.12and 0.13 for ATSR-2 and AATSR, respectively. Thus, thevalidation results confirm the similar performance of ADVfor both sensors.
Thus, the AOD values retrieved from ATSR-2 and AATSRare consistent, as shown by pixel-by-pixel, monthly aggre-gates and validation results comparisons. Furthermore, mostof the differences are within the measurement uncertainty(0.03, or 10 %) requirement of the Global Climate Observ-ing System (GCOS, 2011); this makes it possible to combineATSR-2 and AATSR AOD into one dataset without offsetcorrection.
3.4 Comparison between MODIS merged DTDB C6.1and C6 AOD
In MODIS C6.1, the brightness temperatures biases andtrending were significantly reduced compared to C6, whichaffected ice cloud detection over water surfaces (Moeller etal., 2017). The electronic crosstalk correction discussed inWilson et al. (2017) was also made, which greatly improvedthe performance of the cloud mask.
The difference between the C6.1 and C6 annual AODover China averaged for the 2000–2011 period is shown inFig. 6. This period was chosen because of the overlap be-tween ATSR and MODIS, which is studied in the current pa-per. Over most of China, the difference between C6.1 andC6 is very small (within ±0.025), except for certain areas(Fig. 6). The annual aggregated C6.1 AOD over the TibetanPlateau and over the area north of the Taklamakan Desertis 0.1–0.2 lower than for C6, while over Ningxia Province
www.atmos-chem-phys.net/18/11389/2018/ Atmos. Chem. Phys., 18, 11389–11407, 2018

11394 L. Sogacheva et al.: Spatial and seasonal variations of aerosols over China – Part 1
Figure 3. Scatterplot for AATSR AOD and the difference in AOD between AATSR and ATSR-2. For AATSR AOD bins, box plots (magenta)are shown, which include the following statistics: mean values as “+”, median values as “−”, lower and upper quartiles (box), 9 % and 91 %as lower and upper whiskers. The percentages from all retrieved pixels in three AOD bins (AOD< 0.5, 0.5<=AOD<= 1.5, AOD> 1.5)are shown in brown.
Figure 4. AOD monthly aggregates for ATSR-2 (purple line) andAATSR (blue line) over China (green dots) and globally over land(red diamonds). The vertical dashed lines on each marker represent1σ standard deviation.
(ca. 35–37◦ N and 103–107◦ E) and the Sichuan Basin (ca.28–30◦ N and 103–107◦ E) the AOD increased by 0.1–0.2.Figure 6b shows that the AOD differences over the TP andin the north are mostly due to the lower C6.1 AOD in thewinter (DJF, about 0.15) and spring (MAM, up to 0.25), andthat the differences over Ningxia are due to the much higherAOD in these seasons in C6.1. Over the Sichuan Basin theC6.1 and C6 AOD values are similar in all seasons exceptwinter, when C6.1 is about 0.25 higher. Similar changes inthe AOD between C6.1 and C6 are shown by Sayer (2017)for the period from 2000 to 2008 over China.
With regards to coverage, over most of mainland China,the differences between C6.1 and C6 are very small, except
over elevated areas such as the Tibetan Plateau, the HuangiuGaoyuan Plateau and areas in the northeast and northwest ofthe country (Andrew Sayer, personal communication, 2017).However, the MODIS AOD coverage over other locationshas increased in C6.1, which is concluded from the increas-ing number of points available for validation, as discussed inSect. 4.
4 ADV and MODIS AOD validation
4.1 General validation over China and validationresults for selected regions
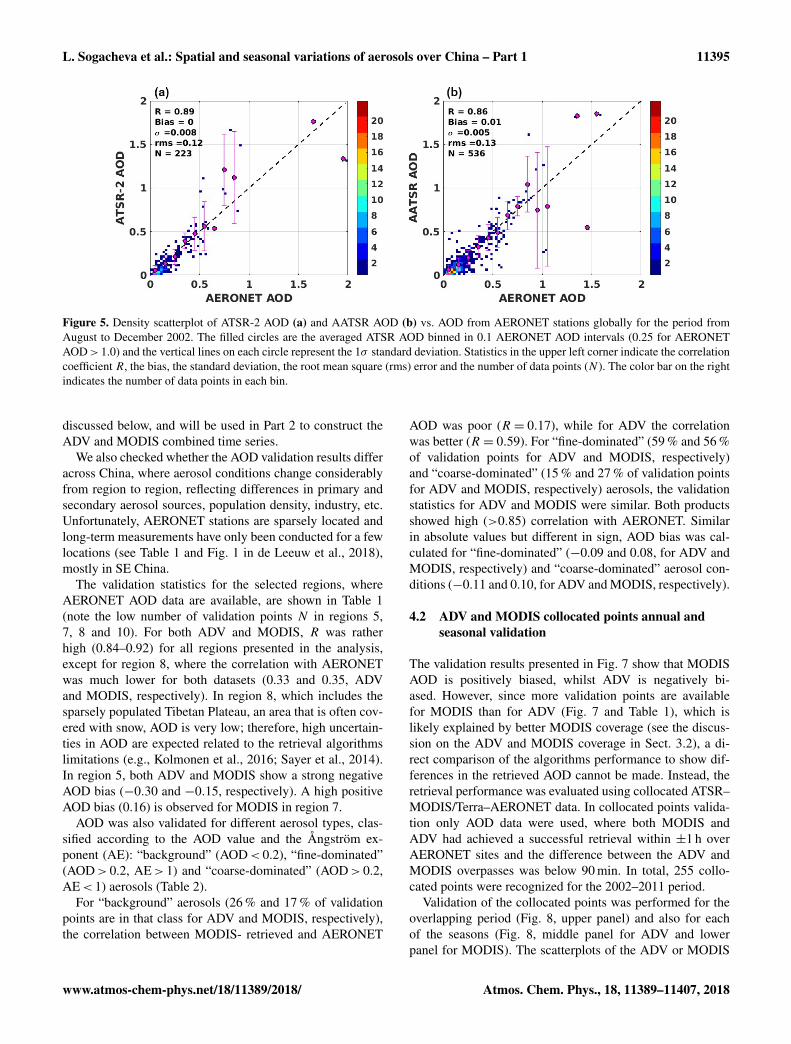
MODIS C6.1 was validated over China with AERONETAOD (Fig. 7, right) for the sites available in the studyarea similar to C6 validation, as described in de Leeuw etal. (2018). Briefly, collocated satellite and AERONET datawere used, i.e., satellite data within a radius of 0.125◦ aroundthe AERONET site are averaged and compared with the av-eraged AERONET data measured within ±1 h of the satel-lite overpass time (Virtanen et al., 2018). C6.1 had about 5 %more matchups with AERONET. For C6.1 the validation re-sults did not changed much, since the number of AERONETstations is limited over the areas where the changes in AODin C6.1 compared to C6 are visible in the yearly and seasonalaggregates (Fig. 6).
ADV validation results (Fig. 7a, left) are adopted fromde Leeuw et al. (2018). The main difference in ADV andMODIS performance, the bias, which is similar in absolutevalue but opposite in sign (0.06 for MODIS and −0.07 forADV), changed little from C6 to C6.1 (Fig. 7). This differ-ence in AOD bias is emphasized here because it explains theoffset in the AOD between ADV and MODIS, as shown and
Atmos. Chem. Phys., 18, 11389–11407, 2018 www.atmos-chem-phys.net/18/11389/2018/
L. Sogacheva et al.: Spatial and seasonal variations of aerosols over China – Part 1 11395
Figure 5. Density scatterplot of ATSR-2 AOD (a) and AATSR AOD (b) vs. AOD from AERONET stations globally for the period fromAugust to December 2002. The filled circles are the averaged ATSR AOD binned in 0.1 AERONET AOD intervals (0.25 for AERONETAOD> 1.0) and the vertical lines on each circle represent the 1σ standard deviation. Statistics in the upper left corner indicate the correlationcoefficient R, the bias, the standard deviation, the root mean square (rms) error and the number of data points (N ). The color bar on the rightindicates the number of data points in each bin.
discussed below, and will be used in Part 2 to construct theADV and MODIS combined time series.
We also checked whether the AOD validation results differacross China, where aerosol conditions change considerablyfrom region to region, reflecting differences in primary andsecondary aerosol sources, population density, industry, etc.Unfortunately, AERONET stations are sparsely located andlong-term measurements have only been conducted for a fewlocations (see Table 1 and Fig. 1 in de Leeuw et al., 2018),mostly in SE China.
The validation statistics for the selected regions, whereAERONET AOD data are available, are shown in Table 1(note the low number of validation points N in regions 5,7, 8 and 10). For both ADV and MODIS, R was ratherhigh (0.84–0.92) for all regions presented in the analysis,except for region 8, where the correlation with AERONETwas much lower for both datasets (0.33 and 0.35, ADVand MODIS, respectively). In region 8, which includes thesparsely populated Tibetan Plateau, an area that is often cov-ered with snow, AOD is very low; therefore, high uncertain-ties in AOD are expected related to the retrieval algorithmslimitations (e.g., Kolmonen et al., 2016; Sayer et al., 2014).In region 5, both ADV and MODIS show a strong negativeAOD bias (−0.30 and −0.15, respectively). A high positiveAOD bias (0.16) is observed for MODIS in region 7.
AOD was also validated for different aerosol types, clas-sified according to the AOD value and the Ångström ex-ponent (AE): “background” (AOD< 0.2), “fine-dominated”(AOD> 0.2, AE> 1) and “coarse-dominated” (AOD> 0.2,AE< 1) aerosols (Table 2).
For “background” aerosols (26 % and 17 % of validationpoints are in that class for ADV and MODIS, respectively),the correlation between MODIS- retrieved and AERONET
AOD was poor (R = 0.17), while for ADV the correlationwas better (R = 0.59). For “fine-dominated” (59 % and 56 %of validation points for ADV and MODIS, respectively)and “coarse-dominated” (15 % and 27 % of validation pointsfor ADV and MODIS, respectively) aerosols, the validationstatistics for ADV and MODIS were similar. Both productsshowed high (>0.85) correlation with AERONET. Similarin absolute values but different in sign, AOD bias was cal-culated for “fine-dominated” (−0.09 and 0.08, for ADV andMODIS, respectively) and “coarse-dominated” aerosol con-ditions (−0.11 and 0.10, for ADV and MODIS, respectively).
4.2 ADV and MODIS collocated points annual andseasonal validation
The validation results presented in Fig. 7 show that MODISAOD is positively biased, whilst ADV is negatively bi-ased. However, since more validation points are availablefor MODIS than for ADV (Fig. 7 and Table 1), which islikely explained by better MODIS coverage (see the discus-sion on the ADV and MODIS coverage in Sect. 3.2), a di-rect comparison of the algorithms performance to show dif-ferences in the retrieved AOD cannot be made. Instead, theretrieval performance was evaluated using collocated ATSR–MODIS/Terra–AERONET data. In collocated points valida-tion only AOD data were used, where both MODIS andADV had achieved a successful retrieval within ±1 h overAERONET sites and the difference between the ADV andMODIS overpasses was below 90 min. In total, 255 collo-cated points were recognized for the 2002–2011 period.
Validation of the collocated points was performed for theoverlapping period (Fig. 8, upper panel) and also for eachof the seasons (Fig. 8, middle panel for ADV and lowerpanel for MODIS). The scatterplots of the ADV or MODIS
www.atmos-chem-phys.net/18/11389/2018/ Atmos. Chem. Phys., 18, 11389–11407, 2018

11396 L. Sogacheva et al.: Spatial and seasonal variations of aerosols over China – Part 1
Figure 6. Difference between MODIS C6.1 and C6 DTDB merged AOD over China: annual averages for 2000–2011 (a) and seasonalaverages for the same period (b), where DJF represents winter, MAM represents spring, JJA represents summer and SON represents autumn).Areas for which no data are available are shown in white.
Table 1. AOD validation results (number of points (N ), correlation coefficient (R), bias, standard deviation (σ ) and root mean square (rms)error) for ADV and MODIS (MOD) obtained for the regions (left column), where AERONET data are available.
N R Bias σ rms
Region ADV MOD ADV MOD ADV MOD ADV MOD ADV MOD
China 1132 4964 0.88 0.92 −0.07 0.06 0.07 0.003 0.24 0.20China, SE 1074 4846 0.88 0.92 −0.07 0.06 0.007 0.003 0.25 0.201 475 2928 0.89 0.94 −0.08 0.06 0.014 0.003 0.30 0.202 118 188 0.86 0.84 −0.09 0.00 0.023 0.024 0.26 0.353 343 937 0.84 0.89 0.00 0.07 0.009 0.005 0.16 0.155 15 80 0.90 0.87 −0.30 −0.15 0.049 0.014 0.22 0.197 9 18 0.92 0.92 −0.01 0.16 0.006 0.032 0.17 0.248 21 11 0.37 0.33 0.04 0.02 0.011 0.017 0.05 0.0610 11 26 0.88 0.96 0.05 0.04 0.073 0.019 0.32 0.10
Atmos. Chem. Phys., 18, 11389–11407, 2018 www.atmos-chem-phys.net/18/11389/2018/
L. Sogacheva et al.: Spatial and seasonal variations of aerosols over China – Part 1 11397
Figure 7. Density scatterplot of ATSR ADV v2.31 AOD (a, reproduced from de Leeuw et al., 2018, Fig. 7), and MODIS C6.1 DTDB vs.AOD from AERONET stations in mainland China (b)for the years 2002–2011. The filled circles are the averaged ATSR AOD binned in 0.1AERONET AOD intervals (0.25 for AERONET AOD> 1.0) and the vertical lines on each circle represent the 1σ standard deviation of theaverages. Statistics in the upper left corner indicate the correlation coefficient R, the bias, the standard deviation, the root mean square (rms)error and the number of data points (N ). The color bar on the right indicates the number of data points.
Table 2. AOD validation results (number of points (N ), correlation coefficient (R), bias, standard deviation (σ ) and root mean square (rms)error) for ADV and MODIS (MOD) obtained for different aerosol types, classified with the AOD and the Ångström exponent (AE).
Aerosol type Conditions R Bias σ rms
ADV MOD ADV MOD ADV MOD ADV MOD
Background AOD< 0.2 0.59 0.17 0.04 0.10 0.006 0.005 0.12 0.12
Fine- AOD> 0.2, 0.85 0.89 −0.09 0.08 0.014 0.005 0.30 0.24dominated AE> 1
Coarse- AOD> 0.2, 0.85 0.88 −0.11 0.10 0.032 0.007 0.37 0.22-dominated AE< 1
AOD vs. AERONET AOD show that for all collocated points(Fig. 8, upper panel) the R is similar for ADV and MODIS(0.92 and 0.93, respectively), while the bias is negative forADV (−0.11) and positive for MODIS (0.06). In winter,when the number of collocated points is low (10), both ADVand MODIS slightly underestimate AOD. In spring, R islower than for other seasons and is the same (0.81) for bothADV and MODIS, while bias is 0 for ADV and positive forMODIS (0.11). In summer, R is slightly higher for MODIS(0.96 vs. 0.94 for ADV), and the bias is similar in absolutevalue (0.13) but has different sign for ADV (positive) andMODIS (negative). In autumn, ADV performs slightly better(R is 0.92 and 0.88, bias is −0.02 and 0.05 for ADV andMODIS, respectively). Thus, in all seasons except winter,positive bias is observed for MODIS, while ADV AOD isbiased negative in all seasons except spring, when the ADVbias is 0.
We also checked whether the difference in the ADV andMODIS AOD depends on the difference in overpass time be-
tween ATSR and MODIS/Terra. The comparison of the AODfor ADV–MODIS–AERONET collocated points is shownas a scatterplot of MODIS AOD vs. ADV AOD in Fig. 9.The color code indicates the difference in the exact overpasstime between ADV and MODIS. For all collocated points,MODIS AOD is usually higher, with an offset of 0.2. Thispositive difference does not depend on the difference in over-pass times between ATSR and MODIS/Terra; thus, the dif-ference cannot be explained by the influence of the possibleAOD daily cycle.
5 AOD seasonal variation
The AOD over China does not only vary in space, seasonalvariations are also observed, as briefly discussed in de Leeuwet al. (2018) based on MODIS/Terra C6 data. Seasonal AODmaps for ADV and MODIS C6.1, aggregated over the years2000–2011, and ADV–MODIS difference maps for each sea-
www.atmos-chem-phys.net/18/11389/2018/ Atmos. Chem. Phys., 18, 11389–11407, 2018

11398 L. Sogacheva et al.: Spatial and seasonal variations of aerosols over China – Part 1
Figure 8. Density scatterplots of collocated ATSR ADV v2.31 AOD and MODIS C6.1 DTDB merged AOD vs. AOD from AERONETstations in China for the years 2002–2011: all points (a) and seasonal statistics (b for ADV and c for MODIS). The color bar at the bottomindicates the number of data points.
Figure 9. MODIS/Terra C6.1 DTDB merged AOD vs. ATSR ADVv2.31 AOD, for collocated ATSR–MODIS/Terra–AERONET data,as described in Sect. 4.1. The colors (scale at the right) indicate thedifference between the MODIS/Terra and ATSR overpass times inminutes.
son, are presented in Fig. 10. The spatial distribution of sea-sonally averaged AOD is similar to the spatial patterns ofthe annually averaged AOD. However, Fig. 10 shows someclear differences between ADV and MODIS, i.e., the MODISAOD is often higher than that from ADV, and MODIS hasbetter coverage over bright surfaces. The latter is particularlyprominent for the winter season (DJF) when the north andwest of China are covered with snow. As previously men-tioned, like most aerosol retrieval algorithms, ADV has dif-ficulty retrieving AOD over snow and ice, as well as yearround over bright surfaces such as deserts. In seasons otherthan winter, ADV has reasonable coverage over most ofChina (see Table S1), except over the Taklamakan Desertwhere high dust episodes are missed. It is noted that MODISalso does not provide AOD over snow and ice (Levy et al.,2013; Hsu et al., 2013); however, over bright desert sur-faces the DB algorithm does provide AOD (Hsu et al., 2004),which is included in the DBDT product used in this study.
Atmos. Chem. Phys., 18, 11389–11407, 2018 www.atmos-chem-phys.net/18/11389/2018/

L. Sogacheva et al.: Spatial and seasonal variations of aerosols over China – Part 1 11399
Nevertheless, as shown in Fig. 10, MODIS also misses AODover the Tibetan Plateau along the southern border of Chinaduring all seasons, as well as along the northwest border inthe winter. North of ca. 45◦ N both MODIS and ADV do notprovide AOD data in the winter.
With regards to the AOD differences between MODIS andADV, the difference maps in Fig. 10 show that MODIS ismuch higher (≥ 0.25) than ADV over part of SE China inwinter and spring, especially over the NCP and the SichuanBasin, as well as over the desert areas west of the LoessMountains. In summer, these differences are generally muchsmaller (≤ 0.15–0.2) except over the Sichuan Basin, the Tak-lamakan and Gobi deserts and some smaller areas in SEChina. Furthermore, just south of the Himalayas the MODISAOD is much higher (≥ 0.25) than that retrieved using ADV.In autumn, the differences between MODIS and ADV aremostly small (≤ 0.1) except for some regions in the SE ofChina (e.g., Sichuan, YRD and Hebei), as well as SW of theHimalayas. These observations regarding the differences be-tween ADV and MODIS can be partly explained by the val-idation results presented in Figs. 7 and 8, i.e., MODIS is bi-ased high and ADV is biased low by a similar amount. How-ever, these biases do not explain the seasonal variations of thedifferences between MODIS and ADV. These are likely dueto retrieval assumptions with regards to the aerosol proper-ties and the surface reflectance. The largest discrepancies areobserved in the area north of about 27◦ N and over relativelybright areas in the deserts as well as over the NCP, whichis dryer in winter and spring than during the summer andautumn. In addition, these regions are influenced by desertdust, which has relatively large contributions to the AOD inspring as discussed below. ADV does not provide a qual-ity retrieval over bright surfaces, in addition to the fact thatthe ADV AOD for SE China is substantially lower than thatfrom MODIS. The substantially lower ADV-retrieved AODin spring may indicate that the ADV retrieval of dust, whichis most prominent in spring (e.g., Proestakis et al., 2018),needs some improvement. The difference between ADV andMODIS AOD may also be due to the fact that MODIS pro-vides more results over bright surfaces, where ADV AOD islower, if retrieved. In contrast, in summer the differences aremuch smaller.
Regarding the AOD seasonal variation, the maps in Fig. 10show similar variations for the ADV and MODIS-retrievedAODs. For instance, for the PRD the AOD is highest inspring and lower in other seasons, whereas over the NCP(in the area from BTH to the YRD) the AOD is highest insummer. The ADV and MODIS AOD seasonal aggregatesfor different areas will be discussed in Sect. 5.1.
5.1 Seasonal variation by region for the 2000–2011period
AOD seasonal time series for China, SE China and each ofthe 10 regions over China, selected as described in Sect. 2,
are shown in Fig. 11, for both ADV and MODIS. The datashown in Fig. 11 are averages over the three months in eachseason, and over the years 2000–2011, i.e., the overlappingperiod for ATSR and MODIS/Terra. These time series il-lustrate the overall behavior that emerged from the seasonalAOD maps in Fig. 10, i.e., a clear seasonal variation of theAOD over all regions, which is similar for both ADV andMODIS but with MODIS AOD somewhat higher than thatfrom ADV. For all regions, the AOD is lowest in the winter,except for region 6 (Sichuan/Chongqing), where the mini-mum occurs in autumn. For all of mainland China, AOD isalso slightly lower in autumn, as compared to winter. For allregions, the AOD is highest in spring, except for regions 1and 5 where the maximum AOD is observed in the sum-mer. In region 2, the AOD is similar in spring and summer.The difference in the seasonal variation of the AOD betweenregions 1 (NCP) and 5 and those further south in region 2(YRD) and region 7 (PRD), which are all very large urban ar-eas with a high population and large industrial development,is likely due to the different climatological zones. The NCP issituated in a temperate monsoon climate region, the YRD ina subtropical monsoon climate region and region 7 combinesregions with a subtropical and a tropical monsoon climate,with strong differences in rain-season trends, i.e., precipita-tion and number of rain days (Song et al., 2011; Kourtidiset al., 2015; Stathopoulos et al., 2017). The East Asian sum-mer monsoon (EASM) and the associated rain patterns overeastern China (Song et al., 2011) progress from the south inApril to the YRD in the early summer and reach BTH inJuly. When the monsoon period ends in August, the rain beltmoves back to the south. Precipitation obviously affects theAOD due to wash out of the aerosol particles, although onwarm days with high relative humidity the aerosol particlesswell and small (<100 nm) aerosol particles grow into theoptically active size range. As a result, the particle size dis-tribution shifts to larger particles and the aerosol scatteringand associated AOD increase (Bian et al., 2014; Zhang et al.,2015). In region 10, in the northeast of China, which has acooler climate that the EASM does not reach, the AOD max-imum occurs in spring.
Another factor influencing the seasonal variation of theAOD is the dust emitted from the deserts, with the highestemission intensity in spring and summer (cf. Proestakis etal., 2018). The largest dust sources in China are the Takla-makan Desert and the Gobi (GD) Desert. Due to differencesin topography, elevation, thermal conditions and atmosphericcirculation, the GD has a much more important role than theTD in contributing to the dust concentrations in East Asia(Chen et al., 2017b). Figure 12, reproduced from Proestakiset al. (2018), who described how these products were ob-tained in detail, shows seasonal maps of dust AOD (DAOD)at 532 nm, based on CALIOP (Cloud Aerosol Lidar with Or-thogonal Polarization; Winker et al., 2009) observations be-tween January 2007 and December 2015. These maps clearlyillustrate the effect of the dust generated over the TD, with
www.atmos-chem-phys.net/18/11389/2018/ Atmos. Chem. Phys., 18, 11389–11407, 2018

11400 L. Sogacheva et al.: Spatial and seasonal variations of aerosols over China – Part 1
Figure 10. Seasonal AOD maps aggregated over the years 2000–2011 (top to bottom: DJF (winter), MAM (spring), JJA (summer) and SON(autumn)). (a, d, g, j): ATSR ADV v2.31 (adapted from de Leeuw et al., 2018, Fig. 11); (b, e, h, k): MODIS/Terra C6.1 merged DBDT; (c,f, i, l): difference maps ADV–MODIS. The AOD and difference scales are plotted at the bottom. Pixels for which no value was retrieved areplotted in white.
very high DAOD in the spring (up to about 0.7) and sum-mer, and much lower DAOD in the autumn and winter (about0.2). In contrast, there is no clear dust signal over the north-ern part of the Gobi Desert, where surface dust concentra-tions are high (cf. Chen et al., 2017b), in either the CALIOPDAOD maps in Fig. 12 or the ADV and MODIS AOD mapsin Fig. 10. In these satellite observations the dust appears tobe confined south of 40◦ N.
A noticeable feature is the distinct eastward pathway ofdust aerosol transport, although the observed features varystrongly with season. The eastward dust aerosol pathwayextends from the Taklamakan Desert over central China(Kuhlmann and Quaas, 2010), with DAOD values of up to 0.3in the spring and much lower in other seasons (0.1), towardsthe Yellow Sea and the Pacific Ocean (Uno et al., 2009). Thisdust aerosol trans-Pacific belt extends over central China be-tween 30 and 45◦ N, contributing (with dust aerosols) up to
Atmos. Chem. Phys., 18, 11389–11407, 2018 www.atmos-chem-phys.net/18/11389/2018/

L. Sogacheva et al.: Spatial and seasonal variations of aerosols over China – Part 1 11401
Figure 11. AOD seasonal time series averaged over the 2000–2011 period for ADV and MODIS (see legend for explanation) for China, SEChina and the 10 selected regions as discussed in Sect. 2. Error bars shown on each seasonal data point are 1σ standard deviation.
Figure 12. Spatial distribution of the seasonal mean dust AOD, as determined from CALIPSO observations, aggregated over the period fromJanuary 2007 to December 2015. Adopted from Proestakis et al. (2018). Chinese borders are indicated by the black line.
www.atmos-chem-phys.net/18/11389/2018/ Atmos. Chem. Phys., 18, 11389–11407, 2018

11402 L. Sogacheva et al.: Spatial and seasonal variations of aerosols over China – Part 1
50 % to the total aerosol load of the densely populated Bei-jing, Hebei, Tianjin and Shandong provinces (Proestakis etal., 2018). However, very low DAOD values are observed tothe south of about 30◦ N throughout the year, i.e., south ofthe Yangtze River basin, indicating the very low dust aerosoltransport to the south of the observed dust aerosol trans-Pacific belt. The YRD is also the area where the seasonalmaximum shifts between spring and summer; north of theYRD are regions 1 and 5 with summer AOD maxima, as de-scribed above. Clearly, in spite of the relatively high DAODover the TD in the summer and presumed sources over theGD, there appears to be little eastward transport. DAOD isalso not responsible for the high summer AOD, with DAODover the NCP in the order of 0.1. Another reason for the highAOD in summer might be agricultural fires during the sum-mer harvest period in June in the NCP (Zhang et al., 2018),in addition to the mechanism proposed above in reaction tothe migration of the EASM.
5.2 Long-term AOD seasonal variations for ATSRADV (1995–2011) and MODIS (2000–2017)
Figure 10 shows the spatial distribution of the multi-yearaveraged ADV and MODIS seasonal AOD for the years2000–2011. However, this leaves out the pre-EOS periodcovered by ATSR-2 and the post-Envisat period coveredby MODIS. Furthermore, interannual variations occur. InFig. 13, the summer AOD datasets for China, SE Chinaand the 10 selected regions are divided into three periods,i.e., pre-EOS with only ATSR-2 (1995–2000), post-Envisatwith only MODIS/Terra (2011–2017) and the overlap period(2000–2011, shaded light green) when both algorithms pro-vided valid AOD retrievals. Time series for other seasons andyearly aggregates are shown in the Supplement.
The time series of the summer AOD over China (Fig. 13)show a small increase of the AOD over the years 1995–2011, with a somewhat larger tendency for MODIS than forATSR, whereas from 2011 the MODIS data show a definitedecrease. This behavior seems to be mainly determined bythe AOD decrease in SE China (and regions 1–7 therein),where the AOD is substantially higher than in other parts ofChina, and tendencies until 2011 have a similar direction butare much stronger than over the west and north of China (re-gions 8–10).
Here we estimate the AOD tendencies during the over-lapping period, only to establish that ATSR and MODIStime series are similar; thus, they can be used to constructa combined long-term time series. AOD tendencies duringthe 1995–2017 period, as related to the changes in the emis-sion control policy in China, are presented and discussed indetail in Part 2.
For the overlapping period, linear fits were made using aMATLAB tool (https://se.mathworks.com/products/matlab.html, last access: 6 August 2018, and a detailed descriptionof the statistics) to determine the variation of the AOD vs.
time. AOD tendencies (dAOD) per decade, bias and slope forthe linear regression lines, as well as the p value estimatedusing a t test and absolute error for linear fits are presented inTable S2 (for seasonal aggregates) and Table S3 (for annualaggregates) for all selected regions.
For both China and SE China, the annual (Fig. S4) and sea-sonal (Fig. 13, Figs. S1–S3) time series for ADV and MODISare very similar, albeit with an almost constant offset withMODIS high and ADV low. When looking at the long-termtime series of the yearly averaged AOD for each of the 10 re-gions, this behavior is replicated, with some anomalous yearsfor each of them. The possible exception is region 8 (theTibetan Plateau). Here the AOD is very low in comparisonto other regions, with practically no interannual variation orlong-term tendency. AOD tendencies during the whole pe-riod (1995–2017) will be discussed in Part 2.
5.3 Comparison between ATSR ADV and MODISseasonal AOD tendencies
To compare the seasonal year-to-year behavior of the AODretrieved with ATSR and MODIS, the AOD tendencies forthe overlapping period (2000–2011) were estimated by fit-ting the time series with linear regression lines. The linear fitfor AOD seasonal tendencies for the overlapping period forADV and MODIS is shown in Fig. 13 and Figs. S1–S4, andthe corresponding statistics are summarized in Table S2 andS3.
For the overlapping period, positive AOD tendencies wereobserved with both instruments over China for all seasons,except for spring, when the AOD tendency was close tozero or slightly negative. In winter, the ADV-retrieved AODshows a strong increase (between 1.31 and 1.51 per decade)in regions 4 to 7, which represent the south and east of SEChina. Interestingly, along the east coast, the AOD tendencyincreases in winter from north to south, as shown with ADV.MODIS shows a strong (near 0.16) AOD increase in win-ter in regions 1 and 2. In spring, the AOD tendencies arevery low for both instruments, showing an increase in theMODIS AOD and a decrease for ADV. The highest AOD in-crease was observed in region 7 for both ADV and MODIS(0.181 and 0.171 per decade, respectively). In summer, astrong AOD increase is observed in region 1 for both ADVand MODIS (0.503 and 0.422 per decade, respectively). Thepositive AOD tendencies were higher in SE China, reaching0.168 and 0.154 for ADV and MODIS, respectively. In au-tumn, the AOD tendencies were smaller for both ADV andMODIS and agreed in sign for most of the selected regions,except for region 10. Note that the AOD tendencies were sta-tistically significant for regions 1, 2, 4 and over SE China forMODIS only.
The AOD tendencies for the overlapping period derivedfrom MODIS are plotted in Fig. 14 vs. those derived fromATSR. This scatterplot includes tendencies for yearly andseasonal AOD aggregates (dots, see legend for colors) for
Atmos. Chem. Phys., 18, 11389–11407, 2018 www.atmos-chem-phys.net/18/11389/2018/

L. Sogacheva et al.: Spatial and seasonal variations of aerosols over China – Part 1 11403
Figure 13. Time series of the summer-averaged AOD over China, SE China and each of the 10 selected regions, for ADV (1995–2011, greencircles) and MODIS (2000–2017, red diamonds). The overlapping period is colored light green. AOD linear fits for the overlapping periodsare shown for each instrument (green and red dashed lines for ADV and MODIS, respectively). Statistics for linear fits are shown in Table S2.
China, SE China and for each of the 10 selected regions.The confidence for linear fits (p value) is indicated by thecolored (with respect to p value for each instrument) circlesaround each symbol. The areas where both instruments showa similar tendency are denoted by a light red (both positive)and light blue (both negative) background. The same plot,but with symbols replaced with region numbers, is presentedin Fig. 14b.
Most of the ADV and MODIS AOD tendencies for cor-responding periods are located in the colored (red and blue)areas, which confirm that ADV and MODIS show AOD ten-dencies that are similar in sign during the overlapping period.The grouping of the tendency points along the 1 : 1 line (line
is not shown here) shows that the AOD tendencies derivedfor ADV and MODIS are also similar in an absolute sense.
However, seasonal differences exist in the agreement be-tween the ADV and MODIS AOD tendencies. The AOD ten-dencies derived from the two instruments are in good agree-ment in summer, autumn and annually (R is 0.87, 0.77 and0.88, respectively). In winter and spring, the correlation co-efficient is smaller (0.41).
Thus, the consistency between ATSR and MODIS withregards to the AOD tendencies in the overlapping period israther strong in the summer, the autumn and for the yearlyaverage, while in the winter and spring, when there is a dif-ference in coverage between the two instruments (Table S1),the agreement in the AOD tendencies is lower.
www.atmos-chem-phys.net/18/11389/2018/ Atmos. Chem. Phys., 18, 11389–11407, 2018

11404 L. Sogacheva et al.: Spatial and seasonal variations of aerosols over China – Part 1
Figure 14. Scatterplot of the 2000–2011 yearly tendencies (a) derived from MODIS C6.1 DBDT vs. those derived from ATSR ADV v2.31,for China, SE China and the 10 selected areas (as specified in b) for the yearly (black dots) and seasonally averaged AOD (colored dots, seelegend). Colored circles indicate if the p value< 0.05 for both ADV and MODIS (red), for ADV only (blue) or for MODIS only (green).
6 Summary and conclusions
The current research is an extension of the study by de Leeuwet al. (2018), where ATSR-retrieved AOD using ADV v2.31for the 1995–2011 period and the MODIS/Terra C6 DBDTmerged AOD product for the 2000–2015 period were ex-plored. In this paper, the MODIS/Terra C6 DBDT mergedAOD product has been replaced with the recently releasedcollection C6.1 and extended to include 2016 and 2017. TheAOD annual anomaly maps are shown and discussed, and theanalysis of the seasonal variability has been extended to 10selected regions; the AOD tendencies for the overlapping pe-riod (2000–2011) for both ADV and MODIS are presentedand compared.
The main results and conclusions are summarized below.
– The difference in AOD retrieved from ATSR-2 andAATSR is small, as shown by pixel-by-pixel, monthlymeans and validation results comparisons for the periodfrom August to December 2002 over China and glob-ally. Most of the differences fit to the measurement un-certainty requirement of the GCOS (0.03, or 10 %). Thismakes it possible to combine ATSR-2 and AATSR AODtime series into one dataset without offset correction.
– Comparison with AERONET shows similar perfor-mance for both C6.1 and C6. The correlation coefficientincreased slightly from 0.9 in C6 to 0.92 in C6.1, andthe bias decreased slightly from 0.07 to 0.06. The AODspatial coverage in C6.1 increased by ca. 5 % with re-spect to that in C6.
– AOD validation with AERONET shows that the valida-tion results depend on the sampling. If the sampling in-cludes all available collocations with AERONET (1132
and 4964 points for ADV and MODIS, respectively),the validation statistics are slightly better for MODIS.The bias in both datasets is similar but with an oppositesign (0.06 for MODIS and −0.07 for ADV). However,for collocated points, when ATSR and MODIS over-passes are within±90 min and AERONET data exist forvalidation, the correlation coefficient is closer betweenADV and MODIS (0.92 and 0.93, respectively) for allcollocated points. However, ADV performs better thanMODIS in autumn, while MODIS performs slightlybetter in spring and summer. In winter, both ADV andMODIS underestimate AOD. For “fine-dominated” and“coarse-dominated” aerosols, validation statistics aresimilar for ADV and MODIS. Both products show high(>= 0.85) correlation with AERONET. Similar in ab-solute values but different in sign, AOD bias is calcu-lated for “fine-dominated” (−0.09 and 0.08, for ADVand MODIS, respectively) and for “coarse-dominated”(−0.11 and 0.10, for ADV and MODIS, respectively)aerosol conditions.
– The AOD interannual variability over China was pre-sented based on annual anomaly maps (with respect tothe 2000–2011 averages). During the period from 1995to 2006, AOD increased in SE China, while no signif-icant changes in AOD were observed in the west orin the north. Between 2006 and 2011, AOD did notchange much, showing minor minima in 2008–2009.From 2011 onward, AOD was observed to decrease inSE China.
– Both ADV and MODIS show similar seasonal behavior,with spring AOD maxima in the south that shift from
Atmos. Chem. Phys., 18, 11389–11407, 2018 www.atmos-chem-phys.net/18/11389/2018/

L. Sogacheva et al.: Spatial and seasonal variations of aerosols over China – Part 1 11405
spring to summer along the eastern coast in a northerlydirection.
– Similar patterns are shown in year-to-year differencesfor ASTR ADV and MODIS AOD. For the overlap-ping period, positive AOD tendencies were observedwith both instruments over China for all seasons, exceptfor spring, when the AOD tendency was close to zeroor slightly negative. More pronounced changes in AODwere confirmed for SE China. AOD changed faster inspring and autumn, compared to other seasons.
– The consistency between ATSR and MODIS with re-gards to the AOD tendencies in the overlapping periodwas rather strong in summer, autumn and for the yearlyaverage, while in winter and spring, when there was adifference in coverage between the two instruments, theagreement in AOD tendency was lower.
The overall conclusion is that both ATSR ADV andMODIS individually show similar spatial and temporal AODpatterns over China. That conclusion is used as a main start-ing point in Part 2, where the combined long-term AOD timeseries over China and selected areas will be introduced forthe 1995–2017 period. In Part 2, AOD tendencies in the com-bined time series will be estimated for the periods associatedwith changes in air pollution control policies in China.
Data availability. The ATSR data used in this research are pub-licly available (after registration a password will be issued) at: http://www.icare.univ-lille1.fr/ (Finnish Meteorological Institute, 2018).MODIS data are publicly available at: https://ladsweb.modaps.eosdis.nasa.gov/ (NASA, 2018a). AERONET data are available atAERONET: https://aeronet.gsfc.nasa.gov/ (NASA, 2018b).
Supplement. The supplement related to this article is availableonline at: https://doi.org/10.5194/acp-18-11389-2018-supplement.
Author contributions. The whole team designed the research. LS,AKG, ER and EP performed the analysis and prepared the figuresand tables. LS and GL wrote the paper with comments/contributionsfrom the whole team.
Competing interests. The authors declare that they have no conflictof interest.
Acknowledgements. Work presented in this paper was undertakenas part of the Marco Polo project supported by the EU, FP7 SPACEgrant agreement no. 606953 and as part of the GlobEmission projectESA–ESRIN Data Users Element (DUE), project AO/1-6721/11/I-NB; it also contributes to the ESA/MOST DRAGON4 program. TheATSR algorithm (ADV/ASV) used in this work is improved with
support from ESA as part of the Climate Change Initiative (CCI)project Aerosol_cci (ESA-ESRIN projects AO/1-6207/09/I-LGand ESRIN/400010987 4/14/1-NB). Further support was receivedfrom the Centre of Excellence in Atmospheric Science funded bythe Finnish Academy of Sciences Excellence (project no. 272041).Many thanks are expressed to the NASA Goddard Space FlightCenter (GSFC) Level 1 and Atmosphere Archive and DistributionSystem (LAADS) (http://ladsweb.nascom.nasa.gov, last access:6 August 2018) for making the L3 MODIS/Terra C6.1 and C6aerosol data available. The AERONET team is acknowledged forestablishing and maintaining the AERONET sites used in this study.
Edited by: Stelios KazadzisReviewed by: Andrew Sayer and two anonymous referees
References
AATSR Product Handbook: ESA, available at: http://envisat.esa.int/handbooks/aatsr/CNTR.html (last access: 18 June 2018), 2007.
ATSR-1/2: User Guide, available at: http://www.atsr.rl.ac.uk/documentation/docs/userguide/atsr_user_guide_rev_3.pdf (lastaccess: 18 June 2018), 1999.
Bian, Y. X., Zhao, C. S., Ma, N., Chen, J., and Xu, W. Y.: A studyof aerosol liquid water content based on hygroscopicity measure-ments at high relative humidity in the North China Plain, At-mos. Chem. Phys., 14, 6417–6426, https://doi.org/10.5194/acp-14-6417-2014, 2014.
Bouarar, I., Wang, X., and Brasseur, G. P.: Air Pollution in East-ern Asia: An Integrated Perspective, Springer, ISSI, 16, Bern,Switzerland, 504 pp., 2017.
Chandler, R. and Scott, M.: Statistical methods for trend detec-tion and analysis in the environmental sciences, Wiley, 368,https://doi.org/10.1111/ejss.12105 , 2011.
Che, H., Zhang, X.-Y., Xia, X., Goloub, P., Holben, B., Zhao,H., Wang, Y., Zhang, X.-C., Wang, H., Blarel, L., Damiri,B., Zhang, R., Deng, X., Ma, Y., Wang, T., Geng, F., Qi, B.,Zhu, J., Yu, J., Chen, Q., and Shi, G.: Ground-based aerosolclimatology of China: aerosol optical depths from the ChinaAerosol Remote Sensing Network (CARSNET) 2002–2013, At-mos. Chem. Phys., 15, 7619–7652, https://doi.org/10.5194/acp-15-7619-2015, 2015.
Chen, J., Li, C., Ristovski, Z., Milic, A., Gu, Y., Islam, M.S., Wang, S., Hao, J., Zhang, H., He, C., Guo, H., Fu, H.,Miljevic, B., Morawska, L., Thai, P., Lam, Y. F., Pereira,G., Ding, A., Huang, X., and Dumka, U. C.: A review ofbiomass burning: Emissions and impacts on air quality, healthand climate in China, Sci. Total Environ., 579, 1000–1034,https://doi.org/10.1016/j.scitotenv.2016.11.025, 2017a.
Chen, S. Y., Huang, J. P., Li, J. X., Jia, R., Jiang, N. X., Kang, L. T.,Ma, X. J., and Xie, T. T.: Comparison of dust emissions, trans-port, and deposition between the Taklimakan Desert and GobiDesert from 2007 to 2011, Science China Earth Sciences, 60,1338–1355, https://doi.org/10.1007/s11430-016-9051-0, 2017b.
de Leeuw, G., Sogacheva, L., Rodriguez, E., Kourtidis, K., Geor-goulias, A. K., Alexandri, G., Amiridis, V., Proestakis, E.,Marinou, E., Xue, Y., and van der A, R.: Two decadesof satellite observations of AOD over mainland China us-ing ATSR-2, AATSR and MODIS/Terra: data set evaluation
www.atmos-chem-phys.net/18/11389/2018/ Atmos. Chem. Phys., 18, 11389–11407, 2018

11406 L. Sogacheva et al.: Spatial and seasonal variations of aerosols over China – Part 1
and large-scale patterns, Atmos. Chem. Phys., 18, 1573–1592,https://doi.org/10.5194/acp-18-1573-2018, 2018.
Finnish Meteorological Institute: ATRS-2/AATSR Aerosol OpticalDepth, available at: http://www.icare.univ-lille1.fr/, last access:6 August 2018.
GCOS: Systematic Observation Requirements for Satellite-BasedData Products for Climate, 2011 Update, Supplemental Detailsto the Satellite-Based Component of the “Implementation Planfor the Global Observing System for Climate in Support of theUNFCCC (2010 Update)”, GCOS-154, WMO, Geneva, Switzer-land, 2011.
Holben, B. N., Eck, T. F., Slutsker, I., Tanré, D., Buis, J. P., Set-zer, A., Vermote, E., Reagan, J. A., Kaufman, Y., Nakajima, T.,Lavenu, F., Jankowiak, I., and Smirnov, A.: AERONET – A fed-erated instrument network and data archive for aerosol character-ization, Remote Sens. Environ., 66, 1–16, 1998.
Hsu, N. C., Tsay, S. C., King, M. D., and Herman, J.R.: Aerosol properties over bright-reflecting sourceregions, IEEE T. Geosci. Remote, 42, 557–569,https://doi.org/10.1109/TGRS.2004.824067, 2004.
Hsu, N. C., Jeong, M.-J., Bettenhausen, C., Sayer, A. M.,Hansell, R., Seftor, C. S., Huang, J., and Tsay, S.-C.: En-hanced Deep Blue aerosol retrieval algorithm: The sec-ond generation, J. Geophys. Res.-Atmos., 118, 9296–9315,https://doi.org/10.1002/jgrd.50712, 2013.
Istomina, L. G., von Hoyningen-Huene, W., Kokhanovsky, A. A.,Schultz, E., and Burrows, J. P.: Remote sensing of aerosols oversnow using infrared AATSR observations, Atmos. Meas. Tech.,4, 1133–1145, https://doi.org/10.5194/amt-4-1133-2011, 2011.
Jin, Y., Andersson, H., and Zhang, S.: Air Pollution Con-trol Policies in China: A Retrospective and Prospects, editedby: Levy, J. K., Int. J. Env. Res. Pub. He., 13, 1219,https://doi.org/10.3390/ijerph13121219, 2016.
Kolmonen, P., Sogacheva, L., Virtanen, T. H., de Leeuw,G., and Kulmala, M.: The ADV/ASV AATSR aerosol re-trieval algorithm: current status and presentation of a full-mission AOD data set, Int. J. Digit. Earth, 9, 545–561,https://doi.org/10.1080/17538947.2015.1111450, 2016.
Koukouli, M. E., Balis, D. S., van der A, R. J., Theys, N.,Hedelt, P., Richter, A., Krotkov, N., Li, C., and Taylor, M.:Anthropogenic sulphur dioxide load over China as observedfrom different satellite sensors, Atmos. Environ., 145, 45–59,https://doi.org/10.1016/j.atmosenv.2016.09.007, 2016.
Kourtidis, K., Stathopoulos, S., Georgoulias, A. K., Alexandri, G.,and Rapsomanikis, S.: A study of the impact of synoptic weatherconditions and water vapor on aerosol-cloud relationships overmajor urban clusters of China, Atmos. Chem. Phys., 15, 10955–10964, https://doi.org/10.5194/acp-15-10955-2015, 2015.
Kuhlmann, J. and Quaas, J.: How can aerosols affect theAsian summer monsoon? Assessment during three consecu-tive pre-monsoon seasons from CALIPSO satellite data, At-mos. Chem. Phys., 10, 4673–4688, https://doi.org/10.5194/acp-10-4673-2010, 2010.
Levy, R. C., Mattoo, S., Munchak, L. A., Remer, L. A., Sayer, A.M., Patadia, F., and Hsu, N. C.: The Collection 6 MODIS aerosolproducts over land and ocean, Atmos. Meas. Tech., 6, 2989–3034, https://doi.org/10.5194/amt-6-2989-2013, 2013.
Li, Z., Xu, H., Li, K. T., Li, D. H., Xie, Y. S., Li, L., Zhang, Y.,Gu, X. F., Zhao, W., Tian, Q. J., Deng, R. R., Su, X. L., Huang,
B., Qiao, Y. L., Cui, W. Y, Hu, Y., Gong, C. L., Wang, Y. Q.,Wang, X. F., Wang, J. P., Du, W. B., Pan, Z. Q., Li, Z. Z., andBu, D.: Comprehensive study of optical, physical, chemical andradiative properties of total columnar atmospheric aerosols overChina: An overview of Sun-sky radiometer Observation NET-work (SONET) measurements, B. Am. Meteorol. Soc., 99, 4,https://doi.org/10.1175/BAMS-D-17-0133.1, 2018.
Luo, Y., Zheng, X., Zhao, T., and Chen, J.: A climatology of aerosoloptical depth over China from recent 10 years of MODIS remotesensing data, Int. J. Climatol., 34, 863–870, 2014.
Moeller, C., Frey, R., Borbas, E., Menzel, W. P., Wil-son, T., Wu, A., and Geng, X.: Improvements to TerraMODIS L1B, L2, and L3 science products through usingcrosstalk corrected L1B radiances, Earth Observing SystemsXXII, (5 September 2017), Proc. SPIE, 10402, 104020O,https://doi.org/10.1117/12.2274340, 2017.
NASA: MODIS/Terra Aerosol Optical Depth, available at: https://ladsweb.modaps.eosdis.nasa.gov/, last access: 6 August 2018a.
NASA: AERONET:AErosol RObotic NETwork, available at: https://aeronet.gsfc.nasa.gov/, last access: 6 August 2018b.
Proestakis, E., Amiridis, V., Marinou, E., Georgoulias, A. K., Solo-mos, S., Kazadzis, S., Chimot, J., Che, H., Alexandri, G., Bini-etoglou, I., Daskalopoulou, V., Kourtidis, K. A., de Leeuw,G., and van der A, R. J.: Nine-year spatial and temporal evo-lution of desert dust aerosols over South and East Asia asrevealed by CALIOP, Atmos. Chem. Phys., 18, 1337–1362,https://doi.org/10.5194/acp-18-1337-2018, 2018.
Sayer, A. M., Munchak, L. A., Hsu, N. C., Levy, R. C.,Bettenhausen, C., and Jeong, M.-J.: MODIS Collection 6aerosol products: Comparison between Aqua’s e-Deep Blue,Dark Target, and “merged” data sets, and usage recom-mendations, J. Geophys. Res.-Atmos., 119, 13965–13989,https://doi.org/10.1002/2014JD022453, 2014.
Sayer, A. M.: Interactive comment on “Two decades of satellite ob-servations of AOD over mainland China” by Gerrit de Leeuw etal., https://doi.org/10.5194/acp-2017-838-RC1, 2017.
Sogacheva, L., Kolmonen, P., Virtanen, T. H., Rodriguez, E.,Saponaro, G., and de Leeuw, G.: Post-processing to removeresidual clouds from aerosol optical depth retrieved using the Ad-vanced Along Track Scanning Radiometer, Atmos. Meas. Tech.,10, 491–505, https://doi.org/10.5194/amt-10-491-2017, 2017.
Sogacheva, L., Rodriguez, E., Kolmonen, P., Virtanen, T. H.,Saponaro, G., de Leeuw, G., Georgoulias, A. K., Alexandri, G.,Kourtidis, K., and van der A, R. J.: Spatial and seasonal varia-tions of aerosols over China from two decades of multi-satelliteobservations. Part II: AOD time series for 1995–2017 combinedfrom ATSR ADV and MODIS C6.1 for AOD tendencies estima-tion, Atmos. Chem. Phys. Discuss., https://doi.org/10.5194/acp-2018-288, in review, 2018.
Song, Y., Achberger, C., and Linderholm, H. W.: Rain-seasontrends in precipitation and their effect in different climate re-gions of China during 1961–2008, Environ. Res. Lett., 6, 034025,https://doi.org/10.1088/1748-9326/6/3/034025, 2011.
Stathopoulos, S., Georgoulias, A. K., and Kourtidis, K.: Space-borne observations of aerosol – cloud relations for cloud systemsof different heights, Atmos. Res., 183, 191–201, 2017.
Uno, I., Eguchi, K., Yumimoto, K., Takemura, T., Shimizu, A., Ue-matsu, M., Liu, Z., Wang, Z., Hara, Y., and Sugimoto, N.: Asian
Atmos. Chem. Phys., 18, 11389–11407, 2018 www.atmos-chem-phys.net/18/11389/2018/

L. Sogacheva et al.: Spatial and seasonal variations of aerosols over China – Part 1 11407
dust transported one full circuit around the globe, Nat. Geosci.,2, 557–560, https://doi.org/10.1038/NGEO583, 2009.
van der A, R. J., Mijling, B., Ding, J., Koukouli, M. E., Liu, F., Li,Q., Mao, H., and Theys, N.: Cleaning up the air: effectivenessof air quality policy for SO2 and NOx emissions in China, At-mos. Chem. Phys., 17, 1775–1789, https://doi.org/10.5194/acp-17-1775-2017, 2017.
Veefkind, J. P., de Leeuw, G., and Durkee, P. A.: Retrieval of aerosoloptical depth over land using two-angle view satellite radiometryduring TARFOX, Geophys. Res. Lett., 25, 3135–3138, 1998.
Virtanen, T. H., Kolmonen, P., Sogacheva, L., Rodrìguez, E.,Saponaro, G., and de Leeuw, G.: Collocation mismatch uncer-tainties in satellite aerosol retrieval validation, Atmos. Meas.Tech., 11, 925–938, https://doi.org/10.5194/amt-11-925-2018,2018.
Wang, P., Ning, S., Dai, J., Sun, J., Lv, M., Song, Q.,Dai, X., Zhao, J., and Yu, D.: Trends and Variability inAerosol Optical Depth over North China from MODIS C6Aerosol Products during 2001–2016, Atmosphere, 8, 223 pp.,https://doi.org/10.3390/atmos8110223, 2017.
Wang, S., Xing, J., Chatani, S., Hao, J., Klimont, Z., Cofala, J., andAmann, M.: Verification of anthropogenic emissions of China bysatellite and ground observations, Atmos. Environ., 45, 6347–6358, 2011.
Wang, S., Li, G., Gong, Z., Du, L., Zhou, Q., Meng, X., Xie, S., andZhou, L.: Spatial distribution, seasonal variation and regional-ization of PM2.5 concentrations in China, Sci. China Chem., 58,1435–1443, https://doi.org/10.1007/s11426-015-5468-9, 2015.
Wang, Y., Xin, J., Li, Z., Wang, S., Wang, P., Hao, W. M., Nord-gren, B. L., Chen, H., Wang, L., and Sun, Y.: Seasonal variationsin aerosol optical properties over China, J. Geophys. Res., 116,D18209, https://doi.org/10.1029/2010JD015376, 2011.
Wang, X., Huang, J. P., Ji, M. X., and Higuchi, K.: Variability ofEast Asia dust events and their long–term trend, Atmos. Environ.,42, 3156–3165, 2008.
Wilson, T., Wu, A., Shrestha, A., Geng, X., Wang, Z., Moeller,C., Frey, R., and Xiong, X.: Development and Implementa-tion of an Electronic Crosstalk Correction for Bands 27–30 inTerra MODIS Collection 6., Remote Sens.-Basel, 9, 569 pp.,https://doi.org/10.3390/rs9060569, 2017.
Winker, D. M., Vaughan, M. A., Omar, A., Hu, Y., Pow-ell, K. A., Liu, Z., Hunt, W. H., and Young, S. A.:Overview of the CALIPSO Mission and CALIOP Data Pro-cessing Algorithms, J. Atmos. Ocean. Tech., 26, 2310–2323,https://doi.org/10.1175/2009JTECHA1281.1, 2009.
Xin, J., Wang, Y., Pan, Y., Ji, D., Liu, Z., Wen, T., Wang, Y., Li, X.,Sun, Y., Sun J., Wang, P., Wang, G., Wang, X., Cong, Z., Song,T., Hu, B., Wang, L., Tang, G., Gao, W., Guo, Y., Miao, H., Tian,S., and Wang, L.: The Campaign on Atmospheric Aerosol Re-search Network of China: CARE-China, B. Am. Meteorol. Soc.,96, 1137–1155, 2015.
Zhang, L., Sun, J. Y., Shen, X. J., Zhang, Y. M., Che, H., Ma,Q. L., Zhang, Y. W., Zhang, X. Y., and Ogren, J. A.: Observa-tions of relative humidity effects on aerosol light scattering in theYangtze River Delta of China, Atmos. Chem. Phys., 15, 8439–8454, https://doi.org/10.5194/acp-15-8439-2015, 2015.
Zhang, J., Reid, J. S., Alfaro-Contreras, R., and Xian, P.:Has China been exporting less particulate air pollutionover the past decade?, Geophys. Res. Lett., 44, 2941–2948,https://doi.org/10.1002/2017GL072617, 2017.
Zhang, X., Lu, Y., Wang, Q., and Qian, X.: A high-resolution inventory of air pollutant emissions from cropresidue burning in China, Atmos. Chem. Phys. Discuss.,https://doi.org/10.5194/acp-2017-1113, in review, 2018.
Zhao, B., Jiang, J. H., Gu, Y., Diner, D., Worden, J., Liou, K.-N., Su, H., Xing, J., Garay, M., and Huang, L.: Decadal-scale trends in regional aerosol particle properties and theirlinkage to emission changes, Environ. Res. Lett., 12, 054021,https://doi.org/10.1088/1748-9326/aa6cb2, 2017.
Zhu, J. L., Liao, H., and Li, J. P.: Increases in aerosol concentrationsover eastern China due to the decadal-scale weakening of theEast Asian summer monsoon, Geophys. Res. Lett., 39, L09809,https://doi.org/10.1029/2012GL051428, 2012.
www.atmos-chem-phys.net/18/11389/2018/ Atmos. Chem. Phys., 18, 11389–11407, 2018