Embed Size (px)
Citation preview

Syst. Biol. 59(1):42–58, 2010c© The Author(s) 2009. Published by Oxford University Press, on behalf of the Society of Systematic Biologists. All rights reserved.
For Permissions, please email: [email protected]:10.1093/sysbio/syp075Advance Access publication on November 11, 2009
Sparse Supermatrices for Phylogenetic Inference: Taxonomy, Alignment, Rogue Taxa, andthe Phylogeny of Living Turtles
ROBERT C. THOMSON∗ AND H. BRADLEY SHAFFER
Department of Evolution and Ecology and Center for Population Biology, University of California, Davis, CA 95616, USA;∗Correspondence to be sent to: Department of Evolution and Ecology and Center for Population Biology, University of California, Davis, CA 95616, USA;
E-mail: [email protected].
Received 7 January 2009; reviews returned 18 April 2009; accepted 28 September 2009Associate Editor: Thomas Buckley
Abstract.—As phylogenetic data sets grow in size and number, objective methods to summarize this information are becom-ing increasingly important. Supermatrices can combine existing data directly and in principle provide effective synthesesof phylogenetic information that may reveal new relationships. However, several serious difficulties exist in the construc-tion of large supermatrices that must be overcome before these approaches will enjoy broad utility. We present analysesthat examine the performance of sparse supermatrices constructed from large sequence databases for the reconstruction ofspecies-level phylogenies. We develop a largely automated informatics pipeline that allows for the construction of sparsesupermatrices from GenBank data. In doing so, we develop strategies for alleviating some of the outstanding impedi-ments to accurate phylogenetic inference using these approaches. These include taxonomic standardization, automatedalignment, and the identification of rogue taxa. We use turtles as an exemplar clade and present a well-supported species-level phylogeny for two-thirds of all turtle species based on a ∼50 kb supermatrix consisting of 93% missing data. Finally,we discuss some of the remaining pitfalls and concerns associated with supermatrix analyses, provide comparisons to su-pertree approaches, and suggest areas for future research. [Alignment; GenBank; phyloinformatics; rogue taxa; supermatrix;taxonomy; Testudines; turtle phylogeny.]
As sequence data for a wide variety of organismshave become easier to acquire, interest in inferringlarge-scale phylogenies has increased dramatically(Bininda-Emonds 2004; Cracraft and Donoghue 2004;Hodkinson and Parnell 2006). The growth of phyloge-nomic studies that amass data sets to infer phylogenybased on tens to thousands of markers has dramati-cally increased character sampling, although typicallyfor a limited number of model taxa (Rokas et al. 2003;Wildman et al. 2007; Dunn et al. 2008). Supertree andsupermatrix approaches, on the other hand, have em-phasized increased taxon sampling, usually with moremodest gains in character sampling (Driskell et al. 2004;McMahon and Sanderson 2006; Bininda-Emonds et al.2007). All of these approaches have spurred method-ological advances for dealing with large amounts ofcharacter data (reviewed by de Queiroz and Gatesy2007) as well as handling large numbers of taxa (Roshanet al. 2004; Stamatakis 2006; Zwickl 2006). Althoughsome controversy concerning the relative merits ofalternative approaches has arisen (particularly for su-permatrix vs. supertree approaches; Gatesy et al. 2002,2004; Bininda-Emonds et al. 2003), analyses based onhundreds to thousands of taxa and genes are an impor-tant element of phylogenetic analyses that have alreadyresulted in substantial phylogenetic synthesis.
As we move toward a true tree of life utilizing ge-nomic data, a number of methodological and technicalchallenges remain to be solved. The gold standard forsuch analyses remains the “complete-matrix” approachto data set construction, with the aim of scoring all char-acters for all taxa. Such studies provide information onboth character and clade evolution, are free from poten-tial biases imposed by missing data, and are well suitedto existing phylogenetic methods. However, large data
sets also present inherent difficulties; primers cease towork across distantly related taxa, accurate alignmentbecomes more difficult, and genes or gene regions aregained and lost.
As databases grow both with respect to numbersof sequences (Benson et al. 2007) and taxa (Sanderson2007), recent efforts have focused on mining the in-formation contained in GenBank and similar large se-quence databases (Driskell et al. 2004; McMahon andSanderson 2006). These “sparse supermatrix” studieshave not only met with substantial success but also en-countered significant challenges. The problem is thatthe heterogeneous nature of the data can mask the phy-logenetic information contained in these data sets andgive the misleading appearance of great uncertainty.The difficulty, then, is that we must separate this ap-parent uncertainty, caused by heterogeneity in the data,from the true lack of phylogenetic signal.
Two general issues are at the forefront of efforts tocombine disparate, often sparse data sets together forsupermatrix analyses. The first centres on so-called“rogue taxa” (Sanderson and Shaffer 2002) loosely de-fined as phylogenetically unstable taxa that can movewidely across trees with little or no effect on the tree’sscore. The diverse and complex patterns of taxonomicand data overlap that lead to rogue taxa make a pri-ori screening difficult, although post-analysis mea-sures of “rogue-iness” provide a possible strategy foridentifying (and eliminating) rogues and their effects.Taxonomic instability and errors are one common facetof supermatrix construction that can lead to rogue taxa.When taxonomic names change, the result is often thatisolated names represented by few sequences accumu-late in GenBank. In a sparse supermatrix, this increasesdata fragmentation and can lead to one or both of these
42

2010 THOMSON AND SHAFFER—SUPERMATRICES FOR TURTLES 43
“pseudotaxa” behaving as rogues in the resulting tree.Such taxonomic changes can masquerade as phyloge-netic uncertainty when none actually exists.
The difficulty associated with accurate alignmentforms a second major challenge for supermatrix ap-proaches. The sheer amount of data in GenBank makehighly automated approaches necessary; however, thedegree of heterogeneity present in the data makesautomation difficult for at least 2 reasons. First, se-quences in databases vary widely in length for thesame gene region. Because most alignment strategies as-sume homology along the length of the entire sequence,they handle extreme length heterogeneity poorly. Sec-ond, the large evolutionary distances involved in manysupermatrix-level analyses suggest that large moleculardivergences must be managed. Strategies for dealingwith this heterogeneity have involved working at theprotein level (Driskell et al. 2004), controlling the hetero-geneity allowed in clusters by controlling the criteria un-der which clustering occurs (McMahon and Sanderson2006), or extracting only complete or nearly completematrices with little or no missing data (Sanderson et al.2003; Yan et al. 2005).
In this study, we have 2 primary goals. First, we ex-amine several of the methodological issues involvedin going from a large sequence database to a useablephylogeny. In particular, we integrate (semi) automatedsolutions to rogue taxon identification, nomenclaturalchanges, and alignment challenges into a single studyto examine the phylogenetic signal contained in largesparse supermatrices. Second, we provide an empiricalcase study by summarizing the available phylogeneticdata for turtles. Turtles are a relatively ancient clade andthe living crown group captures a long period (∼210million years) of evolutionary history (Gaffney 1990).Thus, the molecular divergence observed in turtles(which leads to many of the difficulties in supermatrixconstruction) is substantial enough to provide a reason-able test case for our methods. With 321 species, turtlesencompass a modest level of species diversity, allowingfor a more thorough examination of issues relating todata combinability and practical issues of taxonomicstandardization than is possible in much larger clades.Although the resulting data matrix is quite sparse, wereport a well-resolved well-supported species-level treefor crown-group turtles containing two-thirds of alldescribed turtle species. More generally, our results in-dicate that sparse supermatrices constructed from largeDNA databases can be a valuable tool for many groupsif appropriate strategies are used to deal with the frag-mented and heterogeneous nature of these data.
MATERIALS AND METHODS
Informatics and Matrix assembly
The process of going from raw GenBank sequencedata to a polished supermatrix involves several infor-matic challenges; some of these are easily automated,others require more direct data manipulation. Through-
out the data-handling pipeline, we sought to maxi-mize automation and build in checks that would callfor human involvement only when necessary. Mostof the pipeline was implemented in a series of Perlscripts (available from http://www.eve.ucdavis.edu/rcthomson) and the general strategy is outlined inFigure 1.
Starting data.—We downloaded all clusters for rootnode “Testudines” that contained at least 4 species-level taxon IDs from the PhyLoTA GenBank browser(http://loco.biosci.arizona.edu/pb/) to use as prelim-inary clusters in our analysis (Sanderson et al. 2008).PhyLoTA assembles these clusters via single linkageBLAST clustering for all sequences in the GenBankflat files (release 159). Thus, each cluster contains se-quences that exhibit a specified degree of BLAST simi-larity to at least one other sequence within that cluster.These clusters contain sequences from a wide rangeof mitochondrial genes, nuclear genes that are com-monly used in phylogenetic analysis (e.g., RAG-1,R35), as well as SINE flanking region sequences.We added several additional turtle sequences that werereleased since release 159 of GenBank (Praschag et al.2007; Thomson et al. 2008; Spinks et al. 2009).
Taxonomy.—The first step in the analysis pipeline wasto standardize taxon names across all clusters. Thisis typically a slow and error prone process but is es-sential to correctly assemble existing data into super-matrices and supertrees. Typical problems that mustbe corrected include the numerous errors present inGenBank submissions (largely misspellings and incor-rect suffixes on Latin names), updating names wheretaxonomy has changed between submissions, dealingwith “name duplications” where single species are rep-resented by multiple names (usually when unstabletaxonomy leads multiple workers to attribute a singlespecies to different genera) and ensuring that terminaltaxa (usually species vs. subspecies) used in the analysisare entered at the same taxonomic level. Because theseissues are widespread, it is not possible to simply ex-tract the genus and species name or taxon ID from eachsequence record and use these for subsequent analyseswithout introducing a large number of errors.
To proceed, we downloaded the NCBI XML taxon-omy file for Testudines and extracted all names of rankspecies or subspecies and their corresponding taxonIDs. This list contains all names that workers have usedto submit sequences to GenBank for turtles, includingmisspellings, names denoting hybrids (e.g., “Carettacaretta × Lepidochelys kempii”), and names for whichthe species had not yet been named or unknown (e.g.,“Elseya sp. Albagula”). We then created a second “up-dated” list of species binomials only based on the mostrecent complete checklist produced for turtles (TurtleTaxonomy Working Group 2007). Where species bino-mials in the updated list exactly matched a name in theNCBI list, we mapped the taxon ID from the NCBI list tothe corresponding name in the updated list. For species

44 SYSTEMATIC BIOLOGY VOL. 59
FIGURE 1. A flowchart outlining the informatic pipeline developed for this study.
that appeared in the updated list but not in the NCBIlist, we created new unique taxon IDs.
We extracted the taxon name from the definition lineof each sequence record and replaced it with the appro-priate taxon ID from the NCBI list. For each record, wethen asked if that taxon ID appeared in the updated list;if so, no further action was taken on that sequence. If itdid not, the name was returned to the user for directionon how to proceed. In most cases, the correction neededwas obvious (e.g., change Pelea to Palea). The user inputsthe correction, which causes that taxon ID to be associ-ated with the correct name in the updated list. The nexttime that particular error is encountered, the taxon ID isrecognized in the updated list and the correction takesplace automatically. At the end of this process, the re-searcher has dealt with each “correction” exactly once,all clusters contain the correct names, and the resultingupdated list contains all synonymies needed to rectify
the NCBI list with the updated list. If each correctiontends to be unique, this approach contributes relativelylittle to the automation of the process. In practice, be-cause the majority of changes are the result of eitherchanging taxonomy or very common misspellings, eachchange was necessary many times and the automationprocess was quite efficient.
Alignment and secondary clustering.—Most commonlyused alignment approaches are geared toward globalalignment problems (those where sequences are similarin length and homologous across the entire sequence)and are poorly suited to dealing with sequences thatvary widely in length and overlap (Morgenstern 2004;McMahon and Sanderson 2006). For these more prob-lematic sequences, local alignments may improve over-all alignment quality (Pearson and Lipman 1988; Huang

2010 THOMSON AND SHAFFER—SUPERMATRICES FOR TURTLES 45
and Miller 1991; Morgenstern 2004). We experimentedextensively with several methods and eventually de-cided on a combined approach using a local alignmentalgorithm (implemented in DIALIGN2, Morgenstern1999) to bring together broad regions of homologyfollowed by the refinement algorithm from MUSCLE(Edgar 2004) to clean up the small unaligned regionsthat DIALIGN2 can leave behind (personal observation;McMahon and Sanderson 2006).
To further identify problematic alignments, we per-formed independent alignments of all clusters usingDIALIGN2 alone, MUSCLE alone (doing full align-ments, rather than the refinement-only algorithm), andMUSCLE-refined DIALIGN2 alignments and comparedthe results using the multiple overlap score (MOS) im-plemented in MUMSA (Lassmann and Sonnhammer2005). This score is a measure of consistency betweenalignments produced under a set of methods. If thescore for all 3 alignments is uniform and high, we caninfer that all methods agreed and that the alignmentfor that cluster was not problematic. When MOS scoresdid not agree, we targeted that cluster for additional ef-fort including realignment using different settings andmanual adjustments.
Because the initial PhyLoTA screen used relativelystringent BLAST criteria to determine cluster member-ship, sequences from a single gene were sometimesparsed into multiple clusters (e.g., there were 4 pre-liminary clusters for the mitochondrial DNA (mtDNA)control region in our data set). Often, these multipleclusters consisted of different segments of a single genethat overlapped only slightly or not at all; other timesthey consisted of different taxonomic groups for thesame gene that were separated because of great se-quence divergence. Combining these clusters into singlealignments can, in principal, increase the density of thedata set. We therefore conducted a round of secondaryclustering aimed at forcing these separate clusters to-gether. We combined clusters based on gene identityinformation contained in the definition line for eachsequence and attempted to align them using our align-ment pipeline. These alignments were then evaluatedusing MOS scores and checked by eye. We performedadjustments where necessary, and in some cases decidedthat the data did not support secondary clustering be-cause of limited overlap between sequences with deepmolecular divergences. In these cases, we left the se-quences as separate clusters. Finally, to examine whateffects any remaining poorly aligned regions of the dataset might have on our analyses, we produced a sec-ond set of alignments that had been pruned of poorlyaligned and very sparse regions by the Gblocks program(Castresana 2000). By comparing the pruned versionsof the alignments to the nonpruned alignments (Fig. 1),we were able to gauge the effect of the most difficult-to-align parts of the data set on the overall results.
Matrix construction.—Clusters were combined into sev-eral different supermatrices that allowed us to explore
issues of taxonomic overlap, efficacy of Gblocks, andmitochondrial versus nuclear data composition. Wefirst assembled the aligned clusters produced by theDIALIGN2 + MUSCLE into 4 concatenated supermatri-ces such that each cluster overlapped with one or moreother clusters by at least 3, 4, 5, or 6 taxa, respectively.McMahon and Sanderson (2006) found that even witha minimum 4-taxon overlap, many problematic taxawere included in the data set; we attempted to bracketthis by increasing and decreasing the stringency of thetaxon overlap requirement. Next, we assembled 2 othercomparative matrices based on 4-taxon overlap only.The first used the Gblocks clusters to examine the gainor loss in phylogenetic precision when the most diffi-cult parts of an alignment were eliminated. The secondconsisted of the nuclear DNA (nuDNA) data only tocompare with that based on mtDNA + nuDNA. Super-matrices were assembled by concatenating sequencesfrom each cluster for individual species and filling inthe rest of the matrix with missing data.
Phylogenetic Analysis
We employed a 2-step analysis procedure aimed atfirst identifying rogue taxa and then performing a morethorough set of analyses after rogue taxa had been re-moved from a given data set. Because the best methodsfor analysing sparse supermatrices are not well under-stood, we employed several and compared the results.
Rogue taxa.—To identify rogues, we searched 100 par-simony bootstrap replicates of each supermatrix usingheuristic searches in PAUP*4.0b10 with a single randomsequence addition starting tree and limiting each repli-cate to 30 min. We used the resulting collection of treesto calculate a taxonomic instability index (I) for eachtaxon (i) in the set of trees using the following, imple-mented in Mesquite (Maddison W.P. and Maddison D.R.2007):
I =∑
(x,y),j 6=i
|Dijx −Dijy|
(Dijx −Dijy)2,
where Dijx is the patristic distance between taxa i and jin tree x and Dijy is the same distance for tree y. Theirdifference is summed across all taxa and tree pairs. Be-cause rogue taxa, by definition, have many divergentplacements in the tree, this summation will be largerfor rogue taxa than for taxa whose placement in thetree is relatively consistent. Based on instability scores,we experimented with pruning apparent rogues fromthe collection of initial bootstrap trees and recalculatingreduced consensus trees after each taxon was deleted. Ifremoval of a taxon led to a large increase in resolution inthe reduced consensus, we pruned that taxon from thedata set as a rogue; if its removal caused no, or modest,changes, the taxon was left in the data set. This processwas carried out starting with the most unstable taxonand proceeded down the list. Pruning was conservativein that only clearly rogue taxa were removed from the
46 SYSTEMATIC BIOLOGY VOL. 59
data set. Our goal was to include the maximum numberof taxa in the tree, with the sacrifice that we might haveincluded somewhat “rogue-y” taxa that contributed tolow support values. This criterion is clearly arbitrary;an alternative would be to employ a fixed cutoff (e.g.,prune the 5% or 10% least stable taxa). There is relativelylittle risk associated with overpruning because the re-moval of nonrogue taxa has little effect on the overalltree resolution (though support values should increaseslightly in the vicinity of taxa that are unnecessarilypruned).
Tree searches.—Optimal phylogenetic analysis strategiesfor sparse supermatrices are not well understood. Previ-ous studies have focused on maximum parsimony (MP)for computational speed and simplicity (McMahon andSanderson 2006) and we follow this here. For the 4-taxon overlap matrix, we also carried out maximumlikelihood (ML) analyses and attempted a Bayesiananalysis to investigate the feasibility of model-basedapproaches for sparse matrices. We also employed ma-trix representation using parsimony (MRP; Baum 1992;Ragan 1992) and gene tree parsimony (GTP; Slowinskiand Page 1999) supertree approaches to allow variationin gene trees among clusters and to provide a compari-son between supermatrix and the supertree approaches.
Parsimony searches were implemented using stan-dard heuristic searches, parsimony ratchet searches(Nixon 1999), and Rec-I-DCM3 boosted parsimonysearches (Roshan et al. 2004). The heuristic searcheswere carried out in PAUP*4.0b10 using tree bisectionand reconnection (TBR) branch swapping with step-wise addition starting trees and 10 random sequenceaddition replicates. Searches were allowed to swap tocompletion. Parsimony ratchets were implemented inPAUP* with 10 replicates of 200 iterations each, up-weighting alternatively 10% or 25% of the matrix byweight 1 in each iteration followed by a final heuristicsearch using the best parsimony ratchet trees as start-ing trees. We then filtered the best trees found fromall phases of the ratchet search. Finally, we employedRec-I-DCM3 boosted parsimony searches in PAUP*using the CIPRES portal. These searches used a 50%maximum taxon subset and 50 iterations of the search,performing TBR branch swapping for both small andlarge tree inferences. Allowing large numbers of treesto be saved at each step of the search had little effect onthe results, greatly increased the duration of searches,and sometimes crashed the run and/or the machineit was being carried out on due to excessive memorydemands. This was a much larger problem when at-tempting to analyse data sets that we knew containedrogue taxa than in the pruned data set. We thereforelimited most searches between 10 and 10,000 trees. Wetook the shortest trees found with each search strategyand used them to construct both strict and majority ruleconsensus trees. We assessed phylogenetic support vianonparametric bootstrapping in PAUP*. We performed100 bootstrap replicates using TBR branch swapping
with stepwise addition starting trees and 10 randomsequence addition replicates holding 10 trees at eachreplicate.
Although recent work has suggested that model-based phylogenetic methods may be quite sensitive tomissing data (Lemmon et al. 2009), we felt that it wasimportant to examine our data in ML and Bayesianframeworks. We ran analyses under a GTR + I + Γmodel of molecular evolution, which was selected asthe best-fitting model using DTModSel (Minin et al.2003). We carried out maximum likelihood analysesand bootstrapping in RAxML version 7.0.4 (Stamatakis2006) using the combined bootstrapping and ML searchalgorithm. Bayesian analyses were carried out underMrBayes version 3.1.2 (Ronquist and Huelsenbeck 2003)with 4 independent runs, each with 4 chains. Wesampled from the chains for every 1000 generationsand assessed convergence using the average standarddeviation of split frequencies.
We carried out MRP supertree analysis by first in-ferring a parsimony tree for each cluster by itself (afterrogue taxa had been pruned) and using those trees toassemble a single MRP matrix in Mesquite. We analysedthe matrix in PAUP* using 10 random addition sequencereplicates, allowing up to 1000 trees to be stored for eachreplicate, and constructed a strict consensus of the re-sulting trees. GTP analyses are more difficult to carryout on a tree of this size. The only existing algorithm,to our knowledge, that can carry out GTP on a tree thislarge is implemented in the program DupTree (Wehe etal. 2008). The method requires fully bifurcating trees,which are not attainable with confidence for most ofour clusters (or for most phylogenetic data sets). Wefollowed the methods used by the developers of thealgorithm, employing neighbor joining trees as approx-imations for each cluster’s fully resolved tree (Bansalet al. 2007). We carried out a batch of analyses alterna-tively supplying no starting tree (using the leaf addingheuristic to generate a starting tree) and supplying themajority rule consensus tree from the MP search asa starting tree. We allowed the algorithm to attemptall gene tree rerootings and used the full queue-basedheuristic. We replicated the no starting tree analyses10 times and kept the overall best scoring tree.
RESULTS
Informatics and Matrix Assembly
Starting data.—We downloaded the 79 clusters from thePhyLoTA GenBank browser release 1.01 (which usesdata from GenBank release 159). To these, we added14 additional clusters of newly released data (Praschaget al. 2007; Thomson et al. 2008; Spinks et al. 2009). Weopted not to include the 19 existing turtle mitochon-drial genome sequences because they largely duplicateexisting GenBank data, adding little new information.Combining all the mitochondrial clusters into one largercluster (that included the mtDNA genomes) would al-leviate this data duplication problem at the expense

2010 THOMSON AND SHAFFER—SUPERMATRICES FOR TURTLES 47
of greatly increased data heterogeneity, a decrease inalignment quality, and several technical problems as-sociated with handling extremely long sequences. Inaddition, the length of the sequences was problematicfor much of the automation and the local alignmentalgorithm, primarily by causing excessive memory de-mands. For similar reasons, we also removed 1 clusterfrom the analysis that was composed of a large pieceof the mitochondrial genome including cytochrome b,the mtDNA control region, and several transfer RNAs.The 93 clusters contained 6331 sequences. We filteredsequences so that each cluster contained only 1 se-quence per species, keeping the longest sequence foreach species when duplicates existed. After filtering, theclusters contained 1096 sequences. Most of the duplica-tion was due to the presence of large population-levelsampling for a few species.
Taxon and character sampling was heterogeneousamong higher level turtle clades (Table 1). Overall, thetortoises (Testudinidae) and Old World pond turtles(Geoemydidae) had the most complete taxon sampling,whereas the New World pond turtles (Emydidae) hadthe most extensive character sampling. The side-neckedturtles (Pleurodira) and the mud turtles (Kinosternidae)were characterized by both poor taxon and charactersampling.
Taxonomy.—Overall, 50 unique corrections were re-quired to standardize the NCBI names with the updatednames, and most corrections were applied several times.If we think of this as the number of unique changesrequired to bring the NCBI taxonomy into line withthe current taxonomy, then 15.6% of species labels (50changes/321 species) are incorrect in GenBank. Of these,37 were the result of taxonomic changes at the speciesor genus level, 7 were the result of spelling errors whensequences were submitted to GenBank, and 6 were
attributable to the submission of sequences for “species”that are currently viewed as invalid hybrids (Parhamet al. 2001; Stuart and Parham 2007). In total, 187 of the1096 sequences (17.1%) required changes to standardizethem with the current taxonomy.
Alignment and secondary clustering.—MOS scores com-paring the DIALIGN-only, MUSCLE-only, and theMUSCLE-refined DIALIGN alignments gave the samescore for all 3 alignments in 48 of the 93 clusters, in-dicating no alignment problems. These scores ranged(on a 0–1 scale) from 0.67 (in a single cluster) to 1.00(in 44 clusters) and were higher than 0.80 (the recom-mended cutoff for reasonable alignment quality) for allbut one cluster. When clusters received different scores,they were usually very similar (within 0.01 or 0.02),only 6 clusters showed differences between alignmentmethods >0.02. In all cases, the MUSCLE-refined DI-ALIGN alignments were the best, or one of the best,alignments, so this strategy was used for the remainderof the study. Gblocking the primary clusters resulted inthe removal of between 0% and 84% of the alignmentdepending on the cluster. Eight clusters had no data re-moved, whereas 9 had >50% of the alignment removed(mean = 24%; median = 13%). In a few cases, Gblocksremoved what appeared to be well-aligned informativedata, though this tended to occur in smaller clusters orwhere sequences only partially overlapped; such clus-ters tend to contribute little phylogenetic information.
Secondary clustering yielded 5 secondary clustersresulting from the combination of 12 total primary clus-ters (1 secondary cluster composed of 4 primaries and4 composed of 2 primaries). We attempted to combinea few more clusters based on information containedin the definition line but rejected these alignments asunreasonable. The most problematic case was the mito-chondrial control region clusters, where high molecular
TABLE 1. Taxon and character sampling for each family of turtles in the supermatrix
Family (total no. of species) Taxon samplinga Character samplingb
Nuclear Mitochondrial Total Nuclear Mitochondrial TotalCryptodira (235)
Carettochelyidae (1) 1.00 1.00 1.00 6009 2260 8269Cheloniidae (6) 0.33 1.00 1.00 3673 2624 6297Chelydridae (4) 0.50 0.50 0.50 3647 2398 6045Dermochelyidae (1) 1.00 1.00 1.00 3720 1973 5693Dermatemydidae (1) 1.00 1.00 1.00 3733 1521 5254Emydidae (48) 0.48 0.56 0.67 6275 1627 7902Geoemydidae (64) 0.67 0.91 0.92 3297 2080 5377Kinosternidae (25) 0.20 0.40 0.36 1669 1164 2833Platysternidae (1) 1.00 1.00 1.00 7202 1279 8481Testudinidae (54) 0.63 0.93 0.93 2444 2222 4666Trionychidae (30) 0.77 0.80 0.80 1720 1965 3685
Pleurodira (86)Chelidae (59) 0.27 0.41 0.44 1739 1348 3087Pelomedusidae (19) 0.21 0.16 0.26 2498 1777 4275Podocnemidae (8) 0.50 0.50 0.63 2263 1287 3550
Total (321) 0.50 0.66 0.69
Note: The highest nontrivial value is highlighted in bold in each column.aProportion of species sampled for each family. Includes rogue taxa that were pruned from the final tree.bTotal base pairs per family divided by number of taxa sampled per family. This removes the effect of varying taxon sampling between families.

48 SYSTEMATIC BIOLOGY VOL. 59
divergence made alignments problematic. We only com-bined clusters when the alignments appeared reason-able across the length of the sequence included. Forprotein-coding regions of the genome, it may be pos-sible to increase the accuracy of alignments further byemploying a translation/amino acid alignment step.
As a final quality control, we examined all primaryand secondary alignments by eye to ensure that ourautomated strategy was working as expected. We mademinor adjustments to 9 of the 84 total clusters, and moresubstantial adjustment to a single length heterogeneouscluster, where the misaligned region was associatedwith the end of a single short sequence.
Matrices.—Changing the degree of taxonomic overlapbetween clusters had little effect on the resulting su-permatrices. The minimum 3-taxon overlap allowed allclusters to be included in the matrix, including an ad-ditional 3 taxa that were excluded with greater overlaplevels. However, these 3 extra taxa behaved as some ofthe worst rogues in the resulting trees and were eventu-ally pruned from the matrix. Requiring 4-, 5-, or 6-taxonoverlap included the same set of 223 taxa. Requiringgreater taxon overlap excluded an increasing number ofthe smaller clusters, reducing both the total amountof data and the overall proportion of missing data(Table 2). Because the 4-taxon overlap matrix includedthe most data and performed well, we used it for the restof this study. All matrices were very sparse (between7.5% and 10% full; Fig. 2 and Table 2). The matricesconstructed from Gblocks clusters and the nuDNA-onlyclusters contained fewer taxa and characters than thematrix based on all the data (Table 2). The matrices weredeposited in TreeBASE (accession #S2504).
Phylogenetic Analysis
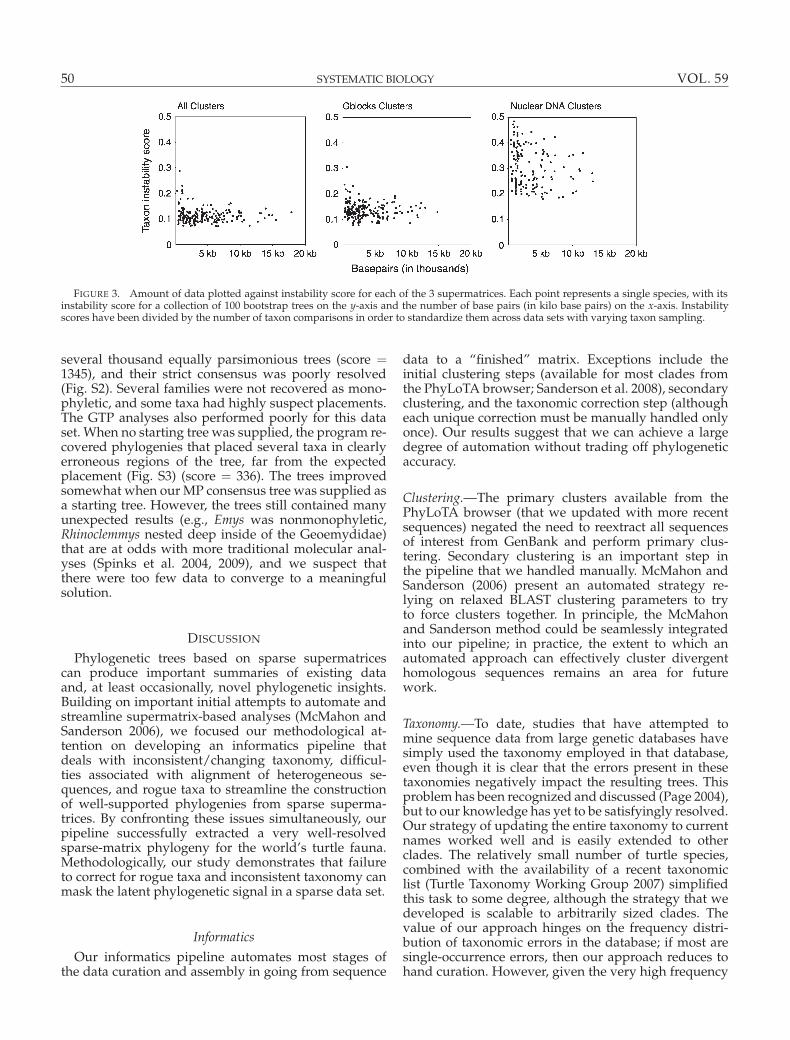
Rogue taxa.—Our first parsimony ratchet and bootstrapruns produced unresolved consensus trees (Table 3). Us-ing the taxon instability index, we identified the leaststable (rogue) taxa and found that these were generallytaxa with very little data (Fig. 3). We pruned the topscoring rogues from each of the collections of trees (allclusters/4-taxon overlap, Gblocks/4-taxon overlap, andnuDNA-only/4-taxon overlap) and recalculated the re-duced consensus trees after each taxon was removedto examine the improvement in tree topology. In the 4-taxon overlap supermatrix containing all data, pruningthe 9 least stable taxa resulted in substantial increasesin resolution outside of their local placement in the tree.
For the 10th and 11th scoring taxa, although their place-ment in the tree seemed erroneous, removing them didnot result in improvements to the topology and so theywere left in the trees. We continued this procedure, ex-cluding taxa and checking the effect on the reduced con-sensus tree and found one more taxon after the 10thand 11th that behaved as a rogue (Cylindraspis triserrata,whose removal brings several genera of tortoises intomonophyly). In all, we pruned 10 taxa from the super-matrix containing all data and the Gblocks supermatrix(9 of 10 of which were the same taxa in both matrices).Pruning the 5% least stable taxa in the data set wouldhave resulted in the removal of 12 taxa, including the10 taxa that we removed and the 10th and 11th scoringtaxa (Pseudemys peninsularis and Kinosternon subrubrum,respectively) that we opted not to remove.
Identifying rogue taxa in the nuDNA-only super-matrix was more problematic because there was noclear demarcation between rogues and nonrogues. ThenuDNA-only data set had a broader distribution andhigher average instability scores than the other 2 matri-ces (Fig. 3). Most of the taxa that were pruned in the first2 data sets were not present in this data set (because theyonly had mtDNA data) but those that were remainedrogues. The rest of the taxa were less obvious. Withouta clear tail in the distribution of instability scores, wesequentially pruned species, eventually pruning 20% ofthe total taxa.
Tree searches.—After identifying rogue taxa with the re-duced consensus trees, we removed them from the datasets and ran a more thorough set of tree searches. Parsi-mony ratchet and heuristic searches all produced iden-tically scoring trees (parsimony score for all clusters,Gblocks clusters, and nuDNA clusters: 30117, 21533,and 6955, respectively), suggesting that the parsimonysearches were effective in finding optimal trees.
These searches produced strikingly better resolvedconsensus trees than the analyses including rogue taxa(Table 3 and Fig. 4). The nuDNA-only matrix performedrelatively poorly, suggesting that either rogue taxa stillexist in the data set that we failed to remove (specifi-cally, in the clade of tortoises and geoemydids, Fig. 4c)or too little nuclear data exist for this approach to beeffective. Overall, the matrix using all data performedbest, as measured by its ability to unambiguously sup-port a reasonable topology and its higher consensusfork index (Colless 1980) compared with the Gblocks ornuDNA-only data set.
TABLE 2. Summary of each of the 3 main supermatrix data sets
3-Taxon overlap 4-Taxon overlap 5-Taxon overlap 6-Taxon overlap
All clusters Gblocks clusters nuDNA clusters
Taxa 226 223 217 160 223 223Base pairs 53,898 53,406 40,891 41,845 51,212 37,686Total clusters 91 90 90 76 85 66Secondary clusters 84 83 84 72 78 59% missing data 92.56 92.41 91.6 92.53 92.14 90.06

2010 THOMSON AND SHAFFER—SUPERMATRICES FOR TURTLES 49
FIGURE 2. A schematic overview of data density in the all data/4-taxon overlap supermatrix. Taxa are ordered vertically (1 taxon per row)from highest data density to lowest and clusters ordered left to right from highest taxon sampling to lowest. Each pixel in the chart represents a100 bp bin for a single taxon. Filled pixels have data for that bin. White areas are missing data.
The ML analysis recovered a tree that was broadlycongruent with our MP tree (Fig. S1, available fromhttp://www.sysbio.oxfordjournals.org/) but differedin important respects. First, the bootstrap values forthe ML tree were far higher than for the MP tree, with116 nodes receiving >95% support for ML analysisversus only 66 nodes for the MP. Both strategies recov-ered all families as monophyletic and essentially agreedon interfamilial relationships (the placement of Chely-dridae was the sole exception). The topological differ-ences that did exist tended to be relatively deep withinfamilies, particularly within the Testudinidae and theGeoemydidae.
After 30 million generations, the Bayesian runs hadnot converged using default settings for the Markovchain Monte Carlo (MCMC). This has been observedin other data sets, particularly those containing largeamounts of missing data (Smith and Donaghue 2008).Though this lack of convergence could likely be sur-mounted by tuning the parameters for the MCMC, wewere concerned that bias due to missing data was par-ticularly problematic for Bayesian analyses (more sothan for ML, see Discussion section) and—given theseconcerns—we did not pursue these analyses further.
We also compared our MP and ML trees with MRPand GTP supertrees. Our MRP tree search recovered
TABLE 3. Summary of trees reconstructed from each of 3 main supermatrix data sets
All clusters Gblocks clusters nuDNA clustersWith rogues After pruning With rogues After pruning With rogues After pruningc
Treesa
CFIb strict 0.00 0.819 0.093 0.765 0.089 0.408CFI 95% MJR 0.695 0.848 0.738 0.819 0.713 0.720
Bootstrap supportCFI 95% MJR 0.241 0.319 0.187 0.230 0.057 0.056CFI 70% MJR 0.491 0.629 0.411 0.490 0.325 0.408CFI 50% MJR 0.714 0.805 0.603 0.686 0.497 0.664
Notes: CFI = consensus fork index; MJR =majority rule consensus.aTrees used were a set of 10,000 maximum parsimony trees found during parsimony ratchet runs followed by TBR branch swapping.bCalculated as the number of resolved nodes divided by the total number of nodes possible.cThe 32 most unstable taxa were pruned from this set of trees, and 10 taxa were pruned in the other 2 cases.
50 SYSTEMATIC BIOLOGY VOL. 59
FIGURE 3. Amount of data plotted against instability score for each of the 3 supermatrices. Each point represents a single species, with itsinstability score for a collection of 100 bootstrap trees on the y-axis and the number of base pairs (in kilo base pairs) on the x-axis. Instabilityscores have been divided by the number of taxon comparisons in order to standardize them across data sets with varying taxon sampling.
several thousand equally parsimonious trees (score =1345), and their strict consensus was poorly resolved(Fig. S2). Several families were not recovered as mono-phyletic, and some taxa had highly suspect placements.The GTP analyses also performed poorly for this dataset. When no starting tree was supplied, the program re-covered phylogenies that placed several taxa in clearlyerroneous regions of the tree, far from the expectedplacement (Fig. S3) (score = 336). The trees improvedsomewhat when our MP consensus tree was supplied asa starting tree. However, the trees still contained manyunexpected results (e.g., Emys was nonmonophyletic,Rhinoclemmys nested deep inside of the Geoemydidae)that are at odds with more traditional molecular anal-yses (Spinks et al. 2004, 2009), and we suspect thatthere were too few data to converge to a meaningfulsolution.
DISCUSSION
Phylogenetic trees based on sparse supermatricescan produce important summaries of existing dataand, at least occasionally, novel phylogenetic insights.Building on important initial attempts to automate andstreamline supermatrix-based analyses (McMahon andSanderson 2006), we focused our methodological at-tention on developing an informatics pipeline thatdeals with inconsistent/changing taxonomy, difficul-ties associated with alignment of heterogeneous se-quences, and rogue taxa to streamline the constructionof well-supported phylogenies from sparse superma-trices. By confronting these issues simultaneously, ourpipeline successfully extracted a very well-resolvedsparse-matrix phylogeny for the world’s turtle fauna.Methodologically, our study demonstrates that failureto correct for rogue taxa and inconsistent taxonomy canmask the latent phylogenetic signal in a sparse data set.
Informatics
Our informatics pipeline automates most stages ofthe data curation and assembly in going from sequence
data to a “finished” matrix. Exceptions include theinitial clustering steps (available for most clades fromthe PhyLoTA browser; Sanderson et al. 2008), secondaryclustering, and the taxonomic correction step (althougheach unique correction must be manually handled onlyonce). Our results suggest that we can achieve a largedegree of automation without trading off phylogeneticaccuracy.
Clustering.—The primary clusters available from thePhyLoTA browser (that we updated with more recentsequences) negated the need to reextract all sequencesof interest from GenBank and perform primary clus-tering. Secondary clustering is an important step inthe pipeline that we handled manually. McMahon andSanderson (2006) present an automated strategy re-lying on relaxed BLAST clustering parameters to tryto force clusters together. In principle, the McMahonand Sanderson method could be seamlessly integratedinto our pipeline; in practice, the extent to which anautomated approach can effectively cluster divergenthomologous sequences remains an area for futurework.
Taxonomy.—To date, studies that have attempted tomine sequence data from large genetic databases havesimply used the taxonomy employed in that database,even though it is clear that the errors present in thesetaxonomies negatively impact the resulting trees. Thisproblem has been recognized and discussed (Page 2004),but to our knowledge has yet to be satisfyingly resolved.Our strategy of updating the entire taxonomy to currentnames worked well and is easily extended to otherclades. The relatively small number of turtle species,combined with the availability of a recent taxonomiclist (Turtle Taxonomy Working Group 2007) simplifiedthis task to some degree, although the strategy that wedeveloped is scalable to arbitrarily sized clades. Thevalue of our approach hinges on the frequency distri-bution of taxonomic errors in the database; if most aresingle-occurrence errors, then our approach reduces tohand curation. However, given the very high frequency

2010 THOMSON AND SHAFFER—SUPERMATRICES FOR TURTLES 51
FIGURE 4. Strict consensus trees of all maximally parsimonious topologies from parsimony ratchet runs comparing pre-rogue-pruning datasets (left column) to post-rogue-pruning data sets (right column). a) supermatrix constructed from all data, b) supermatrix constructed fromGblocks clusters, c) supermatrix constructed from nuDNA only. Major clades of turtle denoted with bars if they appear in the trees; Co—Cheloniidae, Cy—Chelydridae, E—Emydidae, G—Geoemydidae, K—Kinosternidae, P— Pleurodira, T—Testudinidae, and Tr—Trionychidae.K + Cy + Co clade also contains the monotypic Dermatemydidae and Dermochelyidae.
(15–20%) of taxonomic errors that we discovered, evenfor a well-known vertebrate clade like turtles, our ap-proach is a reasonable compromise between automationand hand curation.
As efforts to build linkages among the many largebiological databases continue, we expect nomenclat-ural inconsistency to become an increasingly largeproblem faced by the biodiversity informatics com-munity. This is particularly true for clades in whichtaxonomy itself is changing rapidly in the face of newphylogenetic data and conflicting views on taxonomic
philosophies. An invaluable tool would be a maturedatabase of taxonomic synonymies that could automat-ically update and synonymize such taxonomic inconsis-tencies (e.g., http://www.ubio.org).
Alignment.—Accurate alignment of length heteroge-neous sequences is clearly a significant challenge for thesupermatrix approach. We outlined a novel strategy thatattempts to account for both local and global alignmentproblems, eliminating some of the manual adjustments

52 SYSTEMATIC BIOLOGY VOL. 59
that have previously been required (McMahon andSanderson 2006).
In practice, our strategy appeared to work well. Weperformed manual adjustments in only 10 of the 83total clusters, and in most cases, these were minor ad-justments involving only a handful of misaligned basepairs (the largest involved ∼30 bp). In a 50,000+ bpdata matrix, this seems unlikely to cause significantproblems, and comparisons of output trees based onmatrices without manual corrections to the postedit-ing trees show no apparent differences. Similarly, theGblocks alignments produced a reasonable tree thatclosely matched the topology found using the entiredata set, particularly after rogue taxa were removed(cf. Fig. 4a,b).
Our alignment results argue that a useful startingpoint for this type of study is an automated initial align-ment, incorporating local and global algorithms, andusing MOS scores for consistency checks. These auto-mated alignments will likely contain some small mis-aligned regions that could be corrected by hand, thoughthe potential for improvement to the resulting topologyfrom these corrections is likely to be small.
Cluster combinability.—Our results suggest that the de-gree of taxonomic overlap between clusters is not acritical factor in supermatrix construction. We excludedover a third of the least overlapping clusters in our moststringent, 6-taxon overlap matrices, and the resultingtrees were similar in resolution to those based on 4 and5-taxon overlap. Although this result may not be a gen-eral feature of all data sets, it appears that the 4-taxonoverlap suggested by McMahon and Sanderson (2006)is a reasonable starting point for cluster combinability.
Rogue taxa.—Rogue taxa probably represent the most in-sidious problem for supermatrix phylogenetics. Even afew rogue taxa can lead to the complete collapse of atree, obscuring the otherwise considerable phylogeneticcontent of a data set (compare the left and right columnsof Fig. 4). Ideally, we would like to be able to identifyand eliminate the rogue problem before, rather than af-ter, phylogenetic analysis. However, doing so requiresidentifying unique nonphylogenetic features of rogues,and we have thus far been unable to do so. Rogues ap-pear to be unstable because of the absolute amount ofdata and their specific pattern of data overlap withinand between clusters. For example, 2 taxa that are dis-tantly related and overlap by a certain number of basepairs in a certain set of clusters may be well behaved be-cause they have sufficient overlap with closer relativesthat control their appropriate placement in the tree. Onthe other hand, 2 taxa with the exact same pattern ofoverlap that are closely related may be much more prob-lematic because fewer closely related taxa are likely toexist that can “pull” them into the correct placement onthe tree. Without reference to overlap between “closelyrelated” individuals (which requires some prior knowl-
edge of phylogeny), it is difficult to decide which taxawill behave as rogues, leading us to the less efficient,but operational approach that we developed for rogueidentification. Visually checking the effect of each poten-tial rogue’s removal on the tree was a time-consumingstep. In hindsight, inspecting the distribution of insta-bility scores (Fig. 3) and drawing a cutoff for rogue re-moval would have resulted in essentially the same tree,allowing for essentially complete automation of this im-portant step. A histogram of instability scores could becompiled, allowing the user to choose a cutoff based ona gap in the distribution, as occurred for our full set ofclusters at about a score of 0.175 (Fig. 3).
Tree searches.—Because analysis strategies for sparsesupermatrices are still poorly studied, we employedseveral approaches to infer a phylogeny from our su-permatrices. Concerns over missing data have been dis-cussed extensively in the literature, with some authorsadvocating the inclusion of all available data (Wiens2006) and others finding that the negative consequencesof extensive missing data should be avoided (Dunnet al. 2003). Recent work clarifies and highlights sev-eral issues that can arise as a result of missing data,particularly as they relate to ML and Bayesian phyloge-netics (Lemmon et al. 2009). For phylogenetic analysesof complete matrices, the attractive statistical proper-ties of ML and Bayesian approaches makes them themethod of choice. However, these properties depend ona reasonably accurate model of the data. When miss-ing data are introduced into the data set, obtainingaccurate parameter estimates for the model becomesincreasingly problematic (Lemmon et al. 2009). Be-cause the implicit model employed by parsimony isfixed (not parameterized based on the data), it does notsuffer from this inability to correctly parameterize themodel.
Here, we have focused primarily on parsimony. Al-though we acknowledge that the parsimony model of-ten does not fit molecular data particularly well, thereare no other models that fit these data particular well ei-ther. In most ways, the topologies produced by MP andML were similar, differing primarily in regions of thetree that were poorly supported by both (cf. Figs. 5 andS1). However, MP returned generally more conservativebootstrap values (66 vs. 116 nodes supported at 95% orgreater). It is possible that introducing complex parti-tioning schemes could lessen the effect of a missing databias, although this would need to be balanced againstthe paucity of data available for each partition. In thiscase, we favour the more conservative parsimony esti-mates, at least until more work is done on the impact ofextreme levels of missing data on phylogeny estimation.
Our supertree-based approaches met with limitedsuccess. The MRP analysis produced a largely unre-solved strict consensus of many thousands of equallyparsimonious supertrees. These results are in line witha previous supertree analysis of turtles (Iverson et al.2007), although that study was missing some heavily

2010 THOMSON AND SHAFFER—SUPERMATRICES FOR TURTLES 53
FIGURE 5. (Continued)

54 SYSTEMATIC BIOLOGY VOL. 59
FIGURE 5. (Continued)

2010 THOMSON AND SHAFFER—SUPERMATRICES FOR TURTLES 55
sampled phylogenies that have recently become avail-able. Bininda-Emonds and Sanderson (2001) showedthat when large sets of highly nonoverlapping trees arecombined, the performance of MRP degrades relativeto the supermatrix approach. Our analysis, and that ofIverson et al. (2007), both use more trees that share fewertaxa than the cases simulated by Bininda-Emonds andSanderson (2001), suggesting that the poor supertreeperformance we observed may stem from this problem.Alternative MRP approaches, such as weighted MRP,may improve resolution by more heavily weighting theportions of the source trees that are strongly supported(Bininda-Emonds and Sanderson 2001), although theIverson et al. (2007) study attempted this and still re-covered an unresolved supertree. Our GTP analysis alsofailed to produce a well-resolved supertree (Fig. S3),suggesting that GTP does not perform well in the faceof large amounts of missing data. An attractive prop-erty of GTP is that it attempts to deal with incongruityamong gene trees. For data sets where this is a concern,an alternative strategy would be to implement a par-alogy test in the early data filtering stages of the anal-ysis as was done in McMahon and Sanderson (2006).Although GTP always produces a fully resolved tree,we found the topology of the best species tree to be rid-dled with obviously erroneous placements of some taxacompared with the supermatrix results and with thepublished literature on turtle phylogenetics (Fig. S3).As in the MRP case, we expect that this effect is largelydue to nonoverlapping taxa among the input trees.Edwards (2009) argues that species tree approaches arelikely to be affected by missing data more strongly thansupermatrix approaches because in the former, miss-ing data implies that the genealogy for certain taxais entirely unknown for certain “genes” (in our case,clusters). However, in supermatrix analyses, the signalpresent in other genes provides at least some estimateof the genealogy and can help make up for the missingdata. Taken together, our results suggest that super-matrix approaches are potentially more powerful forextracting phylogenetic information from very sparsedata sets.
Turtle Phylogeny
Because this analysis essentially synthesizes datafrom existing studies, we should reasonably expectthat the tree recovered here (Fig. 5) closely matches thetrees in those previous studies. This appears to be thecase. At the deepest levels, both Pleurodira and Cryp-todira are well supported, and with the one exceptionof the poorly sampled Pelomedusidae, all currently rec-
ognized families are monophyletic. These results havebeen found in several previous studies on different fam-ilies, though few studies include enough outgroups torigorously test monophyly (Dutton et al. 1996; Spinkset al. 2004; Le et al. 2006). In addition, the relationshipsbetween families are consistent with current under-standing (Shaffer et al. 1997; Fujita et al. 2004; Krenz etal. 2005; Parham et al. 2006; Thomson et al. 2008). Withinfamilies, many genera are monophyletic. In turtles,generic-level taxonomy is undergoing many changes asnonmonophyletic groups continue to be discovered andrevised (Turtle Taxonomy Working Group 2007). Thus,some of the nonmonophyly is likely real and reflectsinappropriate taxonomy (the tortoise genus Testudois a potential case), whereas much of it is likely dueto insufficient data and/or a history of hybridization(e.g., the emydid genus Pseudemys).
The most problematic parts of our tree are also thoserelationships that have never been convincingly re-solved in the literature. For instance, the relationshipsbetween the snapping turtles (Chelydridae), sea turtles(Chelonoidea), and mud turtles (Kinosternoidea) areunresolved in our MP tree and in other recent analyses(Krenz et al. 2005). Other poorly resolved parts of ourtree include the relationships among the 3 most diversegenera of the Emydidae (Pseudemys, Trachemys, Grapte-mys) and those among the Australian “short-necked”chelids (particularly Emydura and Elseya). In these cases,the existing data (Lamb et al. 1994; Stephens and Wiens2003) suggest that these may be rapid recent radiationsthat will be difficult to resolve using standard phyloge-netic methods.
One of the key controversies in turtle systematicsis the phylogenetic position of the big-headed turtle,Platysternon megacephalum. Initial morphological andmtDNA assessments tentatively placed it sister to thesnapping turtles (family Chelydridae) and found thatits phylogenetic placement depended on the specificcombination of data sets employed (Shaffer et al. 2008).Later studies using nuDNA and larger pieces of mtDNAunambiguously place Platysternon in, or sister to, theTestudinoidea (Emydidae + Geoemydidae + Testu-dinidae), though the specific position varied dependingon the study. Cervelli et al. (2003) and Krenz et al. (2005)placed Platysternon in a polytomy with the other majorclades of Testudinoidea using U17 snoRNA and RAG-1,respectively. Parham (2006) employed whole mtDNAgenomes to examine the relationship of Platysternonand found a sister relationship between Emydidae andPlatysternon with strong support. Our study recoveredthis same relationship with weak support (Figs. 5 andS1), but only for the full supermatrix after pruningrogues (Platysternon was pruned in both the Gblocks
FIGURE 5. Majority rule consensus of 100 bootstrap replicates for the full supermatrix after pruning rogues. Open circles denote bootstrapproportion >95 and closed circles represent bootstrap proportions >70. Histograms denote the total amount of data in kilo base pairs for eachtaxon, with each bar coloured proportional to the amount of each data type; black—nuDNA, gray—mitochondrial DNA. Numerals on nodesrefer to nonmonotypic families: 1—Pelomedusidae, 2—Podocnemidae, 3—Chelidae, 4—Trionychidae, 5—Chelydridae, 6—Kinosternidae,7—Cheloniidae, 8—Emydidae, 9—Testudinidae, and 10—Geoemydidae.

56 SYSTEMATIC BIOLOGY VOL. 59
and the nuclear-only trees due to instability and is notincluded in Fig. 4b,c). Because we avoided including themtDNA genomes in our study, this resolution does notsimply reflect an overwhelming influence of a singlelarge mitochondrial data set and so can be viewed asan independent confirmation of this result. This con-clusion is bolstered by the strong taxon and charactersampling present across the Testudinoidea (Table 1). Wedo, however, note that the internal branches resolvingthe major lineages of the Testudinoidea are short, andthus, incongruity among genes and anomalous genetrees may remain a concern (Degnan and Rosenberg2006).
The fact that the nuDNA-only supermatrix producedvery little resolution despite our aggressive efforts toremove rogue taxa suggest that there are not yet enoughnuclear data to recover a well-supported tree for tur-tles. This implies that much of what we know aboutthe turtle tree of life depends on mitochondrial data.The problems associated with inferring phylogeny fromsingle genes are well known (Funk and Omland 2003;Ballard and Rand 2005) and argues that we need moreextensive nuclear gene sampling for turtles. It also em-phasizes that even “multilocus” datasets are often dom-inated by mitochondrial (or chloroplast) effects, as acomparison of Figure 4a,c shows. Given the extremelydire conservation status of the world’s turtle and tor-toise fauna (Shaffer et al. 2007; IUCN 2008) and thepotential for sound phylogenies to contribute to conser-vation prioritization strategies, there is a strong need fordeveloping a comprehensive multilocus phylogeny forTestudines.
CONCLUSIONS
Whether viewed as comprehensive summaries ofavailable information or as a distinct phylogenetic strat-egy, sparse supermatrices clearly have a role to play inhelping guide large multimarker projects on the tree oflife. Certain informatic challenges, including taxonomicerrors and identification of rogue taxa, will plague anyattempts to use large multi-user databases in the con-struction of phylogenies; and automated solutions tothese challenges are necessary to streamline the use ofthese data.
Eventually, we hope that sufficient data will be avail-able that phylogenies based on nearly complete matricesfor large sets of taxa will be possible. In the meantime,it does seem that even extremely sparse supermatricesperform well. These approaches have the potential toallow for the identification of key sequencing to be per-formed to reduce fragmentation and produce increas-ingly dense data matrices. Likewise, supermatrices canhelp make clear where taxon sampling is most deficient.Finally, certain parts of a tree may have strong characterand taxon sampling and yet remain largely unresolved,indicating that traditional phylogenetic efforts are fail-ing. By examining characteristics of both the data setsand the trees, supermatrix approaches will likely serve
as useful guides for maximizing the benefit of futureresearch efforts.
SUPPLEMENTARY MATERIAL
Supplementary material can be found at http://www.sysbio.oxfordjournals.org/.
FUNDING
This work was supported by a National ScienceFoundation Doctoral Dissertation Improvement Grant(DEB-0710380), a Society of Systematic Biologists Grad-uate Student Research Award and funding from the UCDavis Center for Population Biology (to R.C.T.), grantsfrom the National Science Foundation (DEB-0507916,DEB-0213155, and DEB-0817042 to H.B.S.), and the UCDavis Agricultural Experiment Station.
ACKNOWLEDGMENTS
We thank Phil Spinks, Mike Sanderson, and anony-mous reviewers for comments on an earlier versionof this manuscript. The study was substantially im-proved through discussions with Levi Gray, Ian Wang,the members of a Monte Carlo discussion group at UCDavis, and the Shaffer Lab discussion group.
REFERENCES
Ballard J.W.O., Rand D.M. 2005. The population biology of mitochon-drial DNA and its phylogenetic implications. Annu. Rev. Ecol. Evol.Syst. 36:621–642.
Bansal M.S., Burleigh J.G., Eulenstein O., Wehe A. 2007. Heuristics forthe gene-duplication problem: aΘ(n) speed-up for the local search?Lect. Notes Comput. Sci. 4453:238–252.
Baum B.R. 1992. Combining trees as a way of combining data setsfor phylogenetic inference, and the desirability of combining genetrees. Taxon. 41:3–10.
Benson D., Karsch-Mizrachi I., Lipman D., Ostell J., Wheeler D. 2007.GenBank. Nucleic Acids Res. 35:D21.
Bininda-Emonds O.R.P., editor. 2004. Phylogenetic supertrees: com-bining information to reveal the tree of life. Dordrecht (The Nether-lands): Kluwer Academic Publishing.
Bininda-Emonds O.R.P., Cardillo M., Jones K.E., MacPhee R.D.E., BeckR.M.D., Grenyer R., Price S.A., Vos R.A., Gittleman J.L., PurvisA. 2007. The delayed rise of present-day mammals. Nature. 446:507–512.
Bininda-Emonds O.R.P., Jones K.E., Price S.A., Grenyer R., Cardillo M.,Habib M., Purvis A., Gittleman J.L. 2003. Supertrees are a necessarynot-so-evil: a comment on Gatesy et al. Syst. Biol. 52:724–729.
Bininda-Emonds O.R.P., Sanderson M. 2001. Assessment of the accu-racy of matrix representation with parsimony analysis supertreeconstruction. Syst. Biol. 50:565–579.
Castresana J. 2000. Selection of conserved blocks from multiple align-ments for their use in phylogenetic analysis. Mol. Biol. Evol. 17:540–552.
Cervelli M., Oliverio M., Bellini A., Bologna M., Cecconi F., MariottiniP. 2003. Structural and sequence evolution of U17 small nucleolarRNA (snoRNA) and its phylogenetic congruence in chelonians.J. Mol. Evol. 57:73–84.
Colless D.H. 1980. Congruence between morphometric and allozymedata for Menidia species: a reappraisal. Syst. Zool. 29:288–299.
Cracraft J., Donoghue M.J., editors. 2004. Assembling the tree of life.Oxford: Oxford University Press.

2010 THOMSON AND SHAFFER—SUPERMATRICES FOR TURTLES 57
de Queiroz A., Gatesy J. 2007. The supermatrix approach to systemat-ics. Trends Ecol. Evol. 22:34–41.
Degnan J.H., Rosenberg N.A. 2006. Discordance of species treeswith their most likely gene trees. PLoS Genet. 2. Available from:http://www.plosgenetics.org/article/info:doi/10.1371/journal.pgen.0020068
Driskell A.C., Ane C., Burleigh J.G., McMahon M.M., O’Meara B.C.,Sanderson M.J. 2004. Prospects for building the tree of life fromlarge sequence databases. Science. 306:1172–1174.
Dunn C.W., Hejnol A., Matus D.Q., Pang K., Browne W.E., SmithS.A., Seaver E., Rouse G.W., Obst M., Edgecombe G.D., SorensenM.V., Haddock S.H.D., Schmidt-Rhaesa A., Okusu A., KristensenR.M., Wheeler W.C., Martindale M.Q., Giribet G. 2008. Broad phy-logenomic sampling improves resolution of the animal tree of life.Nature. 452:745–749.
Dunn K., McEachran J., Honeycutt R. 2003. Molecular phylogeneticsof myliobatiform fishes (Chondrichthyes: Myliobatiformes), withcomments on the effects of missing data on parsimony and like-lihood. Mol. Phylogenet. Evol. 27:259–270.
Dutton P.H., Davis S.K., Guerra T., Owens D. 1996. Molecular phy-logeny for marine turtles based on sequences of the ND4-LeucinetRNA and control regions of mitochondrial DNA. Mol. Phylogenet.Evol. 5:511–521.
Edgar R.C. 2004. MUSCLE: multiple sequence alignment with highaccuracy and high throughput. Nucleic Acids Res. 32:1792–1797.
Edwards S.V. 2009. Is a new and general theory of molecular system-atics emerging? Evolution. 63:1–19.
Fujita M.K., Engstrom T.N., Starkey D.E., Shaffer H.B. 2004. Turtle phy-logeny: insights from a novel nuclear intron. Mol. Phylogenet. Evol.31:1031–1040.
Funk D.J., Omland K.E. 2003. Species-level paraphyly and polyphyly:frequency, causes, and consequences, with insights from animalmitochondrial DNA. Annu. Rev. Ecol. Evol. Syst. 34:397–423.
Gaffney E.S. 1990. The comparative osteology of the triassic turtleProganochelys. Bull. Am. Mus. Nat. Hist. 194:1–263.
Gatesy J., Baker R.H., Hayashi C. 2004. Inconsistencies in argumentsfor the supertree approach: supermatrices versus supertrees ofCrocodylia. Syst. Biol. 53:342–355.
Gatesy J., Matthee C., DeSalle R., Hayashi C. 2002. Resolution of asupertree/supermatrix paradox. Syst. Biol. 51:652–664.
Hodkinson T.R., Parnell J.A.N., editors. 2006. Reconstructing the treeof life: taxonomy and systematics of species rich taxa. Boca Raton(FL): CRC Press.
Huang X., Miller W. 1991. A time-efficient linear-space local similarityalgorithm. Adv. Appl. Math. 12:337–357.
IUCN 2008. IUCN Red List of Threatened Species. Version 2008.1.Available from: http://www.iucnredlist.org.
Iverson J.B., Brown R.M., Akre T.M., Near T.J., Le M., ThomsonR.C., Starkey D.E. 2007. In search of the tree of life of turtles.In: Shaffer H.B., FitzSimmons N.N., Georges A., Rhodin A.G.J.,editors. Defining Turtle Diversity: Proceedings of a Workshop onGenetics, Ethics, and Taxonomy of Freshwater Turtles and Tor-toises. Cambridge (MA). Lunenburg (MA): Chelonian ResearchFoundation. p. 85–106 (Chelonian research monographs).
Krenz J.G., Naylor G.J.P., Shaffer H.B., Janzen F.J. 2005. Molecularphylogenetics and evolution of turtles. Mol. Phylogenet. Evol. 37:178–191.
Lamb T., Lydeard C., Walker R.B., Gibbons J.W. 1994. Molecular sys-tematics of map turtles: a comparison of mitochondrial restrictionsite versus sequence data. Syst. Biol. 43:543–559.
Lassmann T., Sonnhammer E.L.L. 2005. Automatic assessment ofalignment quality. Nucleic Acids Res. 33:7120–7128.
Le M., Raxworthy C.J., McCord W.P., Mertz L. 2006. A molecu-lar phylogeny of tortoises (Testudines: Testudinidae) based onmitochondrial and nuclear genes. Mol. Phylogenet. Evol. 40:517–531.
Lemmon A.R., Brown J.M., Stanger-Hall K., Moriarty Lemmon E. 2009.The effect of ambiguous data on phylogenetic estimates obtainedby maximum likelihood and Bayesian inference. Syst. Biol. 58:130–145.
Maddison W.P., Maddison D.R. 2007. Mesquite: a modular systemfor evolutionary analysis [Internet]. Version 2.01. Available from:http://mesquiteproject.org.
McMahon M.M., Sanderson M.J. 2006. Phylogenetic supermatrix anal-ysis of GenBank sequences from 2228 papilionoid legumes. Syst.Biol. 55:818–836.
Minin V., Abdo Z., Joyce P., Sullivan J. 2003. Performance-based se-lection of likelihood models for phylogeny estimation. Syst. Biol.52:674–683.
Morgenstern B. 1999. DIALIGN 2: improvement of the segment-to-segment approach to multiple sequence alignment. Bioinformatics.15:211–218.
Morgenstern B. 2004. DIALIGN: multiple DNA and protein sequencealignment. Nucleic Acids Res. 32:W33–W36.
Nixon K. 1999. The parsimony ratchet, a new method for rapid parsi-mony analysis. Cladistics. 15:407–414.
Page R. 2004. Taxonomy, supertrees, and the tree of life. In: Bininda-Emonds O.R.P., editor. Phylogenetic supertrees: combining infor-mation to reveal the tree of life. Dordrecht (The Netherlands):Kluwer Academic Publishing. p. 247–266.
Parham J.F., Feldman C.R., Boore J.L. 2006. The complete mitochon-drial genome of the enigmatic bigheaded turtle (Platysternon):description of unusual genomic features and the reconciliationof phylogenetic hypotheses based on mitochondrial and nuclearDNA. BMC Evol. Biol. 6:11.
Parham J.F., Simison W.B., Kozak K.H., Feldman C.R., Shi H. 2001.New Chinese turtles: endangered or invalid? A reassessment of twospecies using mitochondrial DNA, allozyme electrophoresis andknown-locality specimens. Anim. Conserv. 4:357–367.
Pearson W.R., Lipman D.J. 1988. Improved tools for biological se-quence comparison. Proc. Natl. Acad. Sci. USA. 85:2444–2448.
Praschag P., Hundsdorfer A.K., Fritz U. 2007. Phylogeny and taxon-omy of endangered South and South-east Asian freshwater turtleselucidated by mtDNA sequence variation (Testudines: Geoemydi-dae: Batagur, Callagur, Hardella, Kachuga, Pangshura). Zool. Scr.36:429–442.
Ragan M. 1992. Phylogenetic inference based on matrix representationof trees. Mol. Phylogenet. Evol. 1:53–58.
Rokas A., Williams B.L., King N., Carroll S.B. 2003. Genome-scaleapproaches to resolving incongruence in molecular phylogenies.Nature. 425:798–804.
Ronquist F., Huelsenbeck J.P. 2003. MrBayes 3: Bayesian phylogeneticinference under mixed models. Bioinformatics. 19:1572–1574.
Roshan U.W, Moret B.M.E., Williams T.L., Warnow T. 2004. Rec-I-DCM3: a fast algorithmic technique for reconstructing largephylogenetic trees. Proceedings 3rd IEEE Computational SystemsBioinformatics Conference (CSB 2004). 98–109.
Sanderson M.J. 2007. Construction and annotation of large phyloge-netic trees. Aust. Syst. Bot. 20:287–301.
Sanderson M.J., Boss D., Chen D., Cranston K.A., Wehe A. 2008. ThePhyLoTA browser: processing GenBank for molecular phylogenet-ics research. Syst. Biol. 57:335–346.
Sanderson M.J., Driskell A.C., Ree R.H., Eulenstein O., Langley S. 2003.Obtaining maximal concatenated phylogenetic data sets from largesequence databases. Mol. Biol. Evol. 20:1036–1042.
Sanderson M.J., Shaffer H.B. 2002. Troubleshooting molecular phylo-genetic analyses. Annu. Rev. Ecol. Syst. 33:49–72.
Shaffer H.B., FitzSimmons N.N., Georges A., Rhodin A.G.J., editors.2007. Defining Turtle Diversity: Proceedings of a Workshop on Ge-netics, Ethics, and Taxonomy of Freshwater Turtles and Tortoises;2005 August 8–12; Cambridge (MA). Lunenburg (MA): ChelonianResearch Foundation.
Shaffer H.B., Meylan P., McKnight M.L. 1997. Tests of turtle phy-logeny: molecular, morphological, and paleontological approaches.Syst. Biol. 46:235–268.
Shaffer H.B., Starkey D.E., Fujita M.K. 2008. Molecular insights intothe systematics of the snapping turtles. In: Steyermark A.C., FinklerM.S., Brooks R.J., editors. Biology of the snapping turtle. Baltimore(MD): Johns-Hopkins University Press. p. 44–49.
Slowinski J.B., Page R.D.M. 1999. How should species phylogenies beinferred from sequence data? Syst. Biol. 48:814–825.
Smith S.A., Donaghue M.J. 2008. Rates of molecular evolution arelinked to life history in flowering plants. Science. 322:86–89.
Spinks P.Q., Shaffer H.B., Iverson J.B., McCord W.P. 2004. Phylogenetichypotheses for the turtle family Geoemydidae. Mol. Phylogenet.Evol. 32:164–182.

58 SYSTEMATIC BIOLOGY VOL. 59
Spinks P.Q., Thomson R.C., Lovely G.A., Shaffer H.B. 2009. Assessingwhat is needed to resolve a molecular phylogeny: simulations andempirical data from Emydid turtles. BMC Evol. Biol. 9:56.
Stamatakis A. 2006. RAxML-VI-HPC: maximum likelihood-basedphylogenetic analyses with thousands of taxa and mixed models.Bioinformatics. 22:2688.
Stephens P.R., Wiens J.J. 2003. Ecological diversification and phy-logeny of emydid turtles. Biol. J. Linn. Soc. 79:577–610.
Stuart B.L., Parham J.F. 2007. Recent hybrid origin of three rareChinese turtles. Conserv. Genet. 8:169–175.
Thomson R.C., Shedlock A.M., Edwards S.V., Shaffer H.B. 2008. Devel-oping markers for multilocus phylogenetics in non-model organ-isms: a test case with turtles. Mol. Phylogenet. Evol. 49:514–525.
Turtle Taxonomy Working Group. 2007. An annotated list of modernturtle terminal taxa with comments on areas of taxonomic insta-bility and recent change. In: Shaffer H.B., Georges A., FitzSimmonsN.N., Rhodin A.G.J., editors. Defining Turtle Diversity: Proceedingsof a Workshop on Genetics, Ethics, and Taxonomy of Freshwater
Turtles and Tortoises. Lunenburg (MA): Chelonian Research Foun-dation. p. 173–199 (Chelonian research monographs).
Wehe A., Bansal M.S., Burleigh J.G., Eulenstein O. 2008. DupTree:a program for large-scale phylogenetic analyses using gene treeparsimony. Bioinformatics. 24:1540–1541.
Wiens J. 2006. Missing data and the design of phylogenetic analyses. J.Biomed. Inform. 39:34–42.
Wildman D.E., Uddin M., Opazo J.C., Liu G., Lefort V., GuindonS., Gascuel O., Grossman L.I., Romero R., Goodman M. 2007.Genomics, biogeography, and the diversification of placentalmammals. Proc. Natl. Acad. Sci. USA. 104:14395.
Yan C., Burleigh J.G., Eulenstein O. 2005. Identifying optimal incom-plete phylogenetic data sets from sequence databases. Mol. Phylo-genet. Evol. 35:528–535.
Zwickl D.J. 2006. Genetic algorithm approaches for the phylogeneticanalysis of large biological sequence datasets under the maximumlikelihood criterion [PhD thesis]. Austin (TX): University of Texasat Austin.