Embed Size (px)
Citation preview
ECSS-Q-HB-30-01A 14 January 2011
Space product assurance Worst case analysis
ECSS Secretariat ESA-ESTEC
Requirements & Standards Division Noordwijk, The Netherlands

ECSS‐Q‐HB‐30‐01A
14 January 2011
Foreword
This Handbook is one document of the series of ECSS Documents intended to be used as supporting
material for ECSS Standards in space projects and applications. ECSS is a cooperative effort of the
European Space Agency, national space agencies and European industry associations for the purpose
of developing and maintaining common standards.
This handbook has been prepared by the ECSS‐Q‐HB‐30‐01 Working Group, reviewed by the ECSS
Executive Secretariat and approved by the ECSS Technical Authority.
Disclaimer
ECSS does not provide any warranty whatsoever, whether expressed, implied, or statutory, including,
but not limited to, any warranty of merchantability or fitness for a particular purpose or any warranty
that the contents of the item are error‐free. In no respect shall ECSS incur any liability for any
damages, including, but not limited to, direct, indirect, special, or consequential damages arising out
of, resulting from, or in any way connected to the use of this document, whether or not based upon
warranty, business agreement, tort, or otherwise; whether or not injury was sustained by persons or
property or otherwise; and whether or not loss was sustained from, or arose out of, the results of, the
item, or any services that may be provided by ECSS.
Published by: ESA Requirements and Standards Division
ESTEC, P.O. Box 299,
2200 AG Noordwijk
The Netherlands
Copyright: 2011© by the European Space Agency for the members of ECSS
2
ECSS‐Q‐HB‐30‐01A
14 January 2011
Change log
ECSS‐Q‐HB‐30‐01A
14 January 2011
First issue
3

ECSS‐Q‐HB‐30‐01A
14 January 2011
Table of contents
Change log .................................................................................................................3
1 Scope.......................................................................................................................6
2 References ..............................................................................................................7
3 Terms, definitions and abbreviated terms............................................................8
3.1 Terms from other documents .....................................................................................8
3.2 Terms specific to the present document ....................................................................8
3.2.1 ambient temperature ....................................................................................8
3.2.2 biased variation value...................................................................................8
3.2.3 component parameters.................................................................................8
3.2.4 component specification ...............................................................................8
3.2.5 design lifetime...............................................................................................8
3.2.6 effective ageing data ....................................................................................8
3.2.7 lifetime assumed in database .......................................................................8
3.2.8 radiation........................................................................................................9
3.2.9 random variation value .................................................................................9
3.2.10 reference condition .......................................................................................9
3.2.11 temperature assumed in database ...............................................................9
3.2.12 variation factors ............................................................................................9
3.2.13 worst case ....................................................................................................9
3.2.14 worst case analysis (WCA)...........................................................................9
3.2.15 functional block.............................................................................................9
3.3 Abbreviated terms ....................................................................................................10
4 General methodology...........................................................................................11
4.1 Introduction...............................................................................................................11
4.2 Flow diagram of WCA ..............................................................................................11
4.3 Identification of the critical aspects w.r.t. worst case performance...........................13
4.4 Evaluation of worst case performance .....................................................................13
4.5 Comparison of WCA with requirements ...................................................................14
4

ECSS‐Q‐HB‐30‐01A
14 January 2011
5 Analysis parameters and technical issues.........................................................15
5.1 Definition of worst case parameters within parts database ......................................15
5.1.1 Variation factors..........................................................................................15
5.1.2 Summary on deviations ..............................................................................19
5.2 Phase and timing considerations within the WCA....................................................20
5.2.1 Introduction.................................................................................................20
5.2.2 Timing of transient pulses...........................................................................20
5.3 Numerical analysis techniques.................................................................................20
5.3.1 Approach ....................................................................................................20
5.3.2 Extreme value analysis...............................................................................21
5.3.3 Extreme value analysis combined approach ..............................................21
5.3.4 Root-sum-squared analysis........................................................................21
5.3.5 Monte Carlo analysis ..................................................................................21
6 WCA and project phases .....................................................................................23
Figures
Figure4-1: Flow diagram of WCA ...........................................................................................12
Tables
Table 5-1: Deviations and attributes summary.......................................................................19
Table 5-2Numerical techniques and value summary .............................................................22
5
ECSS‐Q‐HB‐30‐01A
14 January 2011
1 Scope
This handbook provides guidelines to perform the worst case analysis. It applies to all electrical and
electronic equipment. This worst case analysis (WCA) method can also be applied at subsystem level
to justify electrical interface specifications and design margins for equipment. It applies to all project
phases where electrical interface requirements are established and circuit design is carried out.
The worst case analysis is generally carried out when designing the circuit. For selected circuitry,
worst case analysis (WCA) can be used to validate a conceptual design approach.
6
ECSS‐Q‐HB‐30‐01A
14 January 2011
2 References
ECSS‐ST‐00‐01 ECSS system ‐ Glossary of terms
ECSS‐E‐ST‐10‐02 Space engineering ‐Verification
ECSS‐Q‐ST‐30 Space product assurance ‐ Dependability
ECSS‐Q‐ST‐30‐11 Space product assurance ‐ Derating ‐ EEE
components
ECSS‐Q‐TM‐30‐12 Space product assurance – End‐of‐life parameters
drifts ‐ EEE components
ECSS‐Q‐ST‐30‐02 Space product assurance ‐ Failure modes, effects and
criticality analysis
ECSS‐Q‐ST‐40‐02 Space product assurance ‐ Hazard analysis
ECSS‐Q‐TM‐40‐04 Space product assurance ‐ Sneak analysis
ECSS‐Q‐ST‐40‐12 Space product assurance ‐ Fault tree analysis –
Adoption notice ECSS / IEC61025
CRTAWCCA Worst Case Circuit Analysis Application Guidelines,
1993 Reliability Analysis Center, Rome NY, U.S.A
JPL D‐5703 Jet Propulsion Laboratory Reliability Analyses
Handbook
7

ECSS‐Q‐HB‐30‐01A
14 January 2011
3 Terms, definitions and abbreviated terms
3.1 Terms from other documents For the purpose of this document, the terms and definitions from ECSS‐S‐ST‐00‐01 apply and the
terms specific to the present document.
3.2 Terms specific to the present document
3.2.1 ambient temperature temperature of a medium surrounding the component
3.2.2 biased variation value value with a deterministic direction or sign whose amplitude and direction of variation are known
3.2.3 component parameters electrical performance parameters of EEE parts
3.2.4 component specification specification of the EEE part used for procurement of the EEE part
3.2.5 design lifetime
duration for which the circuit is designed to work within a particular mission
3.2.6 effective ageing data
ageing data extrapolated from the lifetime assumed in database to the design lifetime
3.2.7 lifetime assumed in database lifetime for which the parameter variation due to ageing and environmental effects is valid
8
ECSS‐Q‐HB‐30‐01A
14 January 2011
3.2.8 radiation phenomenon by which energy, in form of waves or particles, emanates from a source into space
Example Trapped electrons, trapped protons and solar protons.
3.2.9 random variation value
value with no preferred direction or sign whose amplitude alone is known
3.2.10 reference condition
relative condition where the parameter variation is assumed to be zero
3.2.11 temperature assumed in database temperature for which the parameter variation is given in the database
3.2.12 variation factors factors which affect component parameters over its lifetime
NOTE For details see subclause 5.1.1.
3.2.13 worst case
highest or lowest boundary value of a given control parameter established in a validation or
qualification exercise
NOTE Failures or single event effects are not covered by the worst case.
3.2.14 worst case analysis (WCA)
performance prediction of the circuit in the worst case condition
3.2.15 functional block within a circuit, set of components which perform a specific function
9
ECSS‐Q‐HB‐30‐01A
14 January 2011
3.3 Abbreviated terms For the purpose of this document, the abbreviated terms from ECSS‐S‐ST‐00‐01 and the following
apply:
Abbreviation Meaning
CDR critical design review
EEE electrical, electronic, electromechanical
EMC electromagnetic compatibility
EOL end‐of‐life
EVA extreme value analysis
EA activation energy
k Boltzmann constant
MCA Monte‐Carlo analysis
PCB printed circuit board
PDF probability density function
PDR preliminary design review
RF radio frequency
RSS root‐sum‐square
SEE single event effect
Tj junction temperature
WCA worst case analysis
10
ECSS‐Q‐HB‐30‐01A
14 January 2011
4 General methodology
4.1 Introduction The worst case analysis (WCA) is performed on electronic and electrical equipment to demonstrate
that it performs within specification despite particular variations in its constituent part parameters
and the imposed environment, at the end of overall lifetime (EOL).
A good survey of worst case circuit analysis can be found in CRTAWCCA “Worst Case Circuit
Analysis Application Guidelines, 1993 Reliability Analysis Center, Rome NY, U.S.A.”.
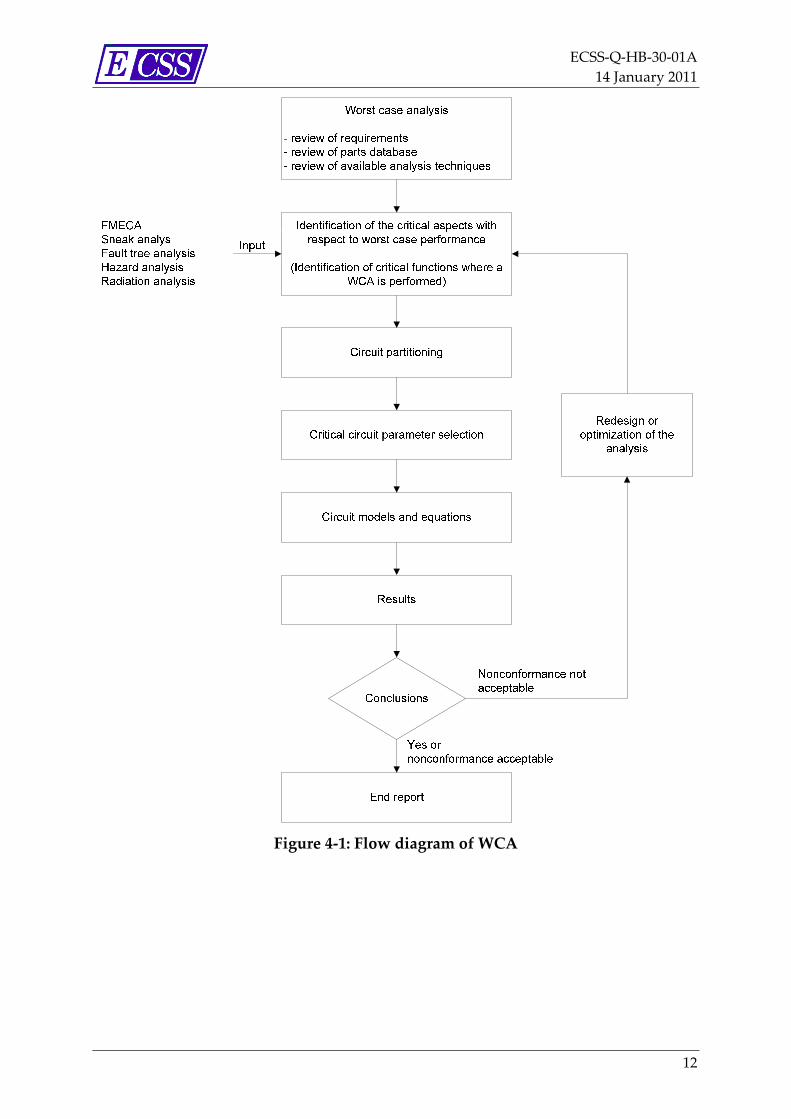
4.2 Flow diagram of WCA The worst case analysis is used to demonstrate sufficient operating margins for all operating
conditions in electronic circuits.
A flow diagram of WCA is shown in Figure 4‐1.
11
ECSS‐Q‐HB‐30‐01A
14 January 2011
Figure 4‐1: Flow diagram of WCA
12
ECSS‐Q‐HB‐30‐01A
14 January 2011
4.3 Identification of the critical aspects w.r.t. worst case performance
The critical aspects with respect to worst case performance and the critical circuit parameters should
be identified. These critical aspects can be identified from results of other analyses:
FMECA,
sneak analysis,
fault tree analysis,,
hazard analysis,
radiation analysis.
The sources of parameter variation are in general:
initial tolerances,
ageing,
temperature,
electrical interfaces,
radiation, and
EMC.
However, in some cases the effects of the above sources can be negligible.
To justify which effects influence the result and which can be neglected, a sensitivity analysis or
appropriate other method can be carried out.
4.4 Evaluation of worst case performance The following basic tasks should be performed:
partitioning of large circuits into smaller circuits which are better manageable (functional
blocks);
selection of critical circuit attributes;
mathematical simulations of circuit behaviour;
application of a worst case numerical analysis technique.
To facilitate the performance of the WCA, the analyst can reduce complex circuits into smaller
functional blocks. When a circuit is reduced to these functional blocks, performance requirements for
the inputs and outputs of each functional block can be established. These requirements serve as the
evaluation criteria for the WCA results for the functional blocks. If such criteria exists in another
document (e.g. design verification requirements document), reference to the source document should
be made. Some of the requirements for the functional blocks derive from higher level specification
requirements. In that case, the method of deriving these requirements should be clearly shown.
Non‐linear effects: Within the process of splitting up the unit circuit into functional blocks the
contractor should consider non‐linear effects resulting either from components intrinsic non‐linearity
(according to the components specification), or effects resulting from reciprocal interaction of the
functional blocks (e.g. power supply variations induced by load changes, and load effects of the
13

ECSS‐Q‐HB‐30‐01A
14 January 2011
power supply drifts). Otherwise the WCA should justify the absence of such effects, or should
quantify such effects as negligible, in comparison to other error sources.
A combination of testing and analysis may be employed to obtain results through actual
measurements.
4.5 Comparison of WCA with requirements The WCA should conform to all requirements, both on the functional block level and at the circuit
level. Variations from these requirements should be noted explicitly and any proposed solutions
outlined as part of the report. Proof of conformance to certain less significant requirements may be
omitted provided that adequate justification for the specific omission is given in the WCA report. As a
summary the analysis results should be compared with the requirement specification.
14
ECSS‐Q‐HB‐30‐01A
14 January 2011
5 Analysis parameters and technical issues
5.1 Definition of worst case parameters within parts database
5.1.1 Variation factors
5.1.1.1 General
For each physical parameter of the component affecting the worst case parameter analysed, the value
of the variation linked to each environment or interface stimulus should be determined. Sources of
variation include:
the reference value (e.g. typical and adjusted),
the initial tolerance,
sensitivity to electrical interfaces (e.g. power supply, shared mode on inputs and output loads),
and
sensitivity to ageing and environmental conditions (e.g. temperature, radiation and EMC).
5.1.1.2 Selection of reference condition
The variations of a component parameter due to radiation, ageing, temperature and tolerance are
applied to the reference condition. The reference condition should be chosen such that data is
available. This is usually room temperature (223) C at beginning‐of‐life.
5.1.1.3 Compensation
If the circuit compensates initial tolerance or environmental variations (such as temperature) the
analysis report should include a justification for the residual variation.
5.1.1.4 Radiation
5.1.1.4.1 Radiation total dose effect
Under the influence of total dose radiation parametric degradations or variations can be expected in
particular for active electronic components. The electrical parametric changes can either be of a
permanent or temporary nature, depending upon the component technology. Radiation affects
parameter variations of active components only (those that have a semiconductor junction).
15
ECSS‐Q‐HB‐30‐01A
14 January 2011
These parametric changes are related to the influence of the accumulated total dose radiation received
throughout the mission lifetime.
5.1.1.4.2 Assessment of the radiation total dose
Using dedicated shielding and radiation analysis tools (radiation sector analysis), the local
accumulated total dose on each single individual component level can be assessed and calculated. The
accumulated total dose received on individual parts depends on the mission lifetime, the radiation
environment (usually a function of the spacecraft orbit) and the shielding. For this document, the
shielding and total dose radiation analysis is an input to the worst case analysis even though in
practice it may be incorporated into the WCA.
5.1.1.4.3 Assessment of the component parameters drift
Given the assessed and calculated accumulated local total dose level, the associated parameter drift
values of each of the components should be derived. The applicable parameter drift values, which
depend on the accumulated total dose received, can only be determined by performing radiation
testing on components from the parts lots used on the spacecraft. The parameter drift is linked to the
technology of the component and can vary from one manufacturer to another and from one lot to
another. The following methods are available for the determination of the parameter drift values.
a. The parameter drift values can be taken from radiation tests that were performed under
appropriate conditions on parts lots used on the spacecraft. In this case the reference of the
document containing the test results should be included in the list of normative documents.
b. If the parameter drift values are derived from component radiation test data (not within the lot
of the parts used on the spacecraft), an appropriate margin should be considered for a
difference in parameter performance variations between the tested lot and the actual lot of the
components used on the spacecraft.
1. If the component to be used on the spacecraft is from the same manufacturer and the
same established manufacturing process as the tested part, a 20 % margin is considered
sufficient for parameters such as gain, threshold voltage, resistance or conductance.
2. If the component to be used on the spacecraft is from a different manufacturer or process
than the tested sample, a margin of more than 100% should be considered. Thus, three or
more sample components from the manufacturer should be tested to the expected
radiation level with the same process used for the other parts of the spacecraft to confirm
the correctness of the assumptions for the WCA.
c. The component specification can also be used as the information source. In this case the
specification usually contains and specifies the parameter drift of total dose radiation up to
given accumulated levels (including initial tolerance).
5.1.1.4.4 Radiation dose testing and verification
Within the WCA and, if applicable, the assumed component parameter drift (due to total dose
radiation) should be verified to correlate to the performance drift specified in the component
specification for the assessed and calculated accumulated total dose level.
The component radiation test results should show that the associated parameter drift values of the
tested components are within the parameter drift limits assumed in the WCA.
During total dose testing, the bias condition should be adopted such as to simulate the electrical
properties on the spacecraft.
The parameter drifts due to radiation are biased variation values.
16
ECSS‐Q‐HB‐30‐01A
14 January 2011
5.1.1.4.5 Single event effects
Single event effects (SEE) are anomalies and thus not a variation factor to be considered in the scope of
the WCA. If the SEE assessment of the circuit requires countermeasures for SEE, these should be
described in a design justification document. If, as a result of SEE assessment, a protection circuit is
included to prevent circuit failures or degradation during SEE events, certainly for nominal operation,
this circuit should be considered in the WCA.
5.1.1.5 Temperature
a. Parameter variations due to temperature variations are applicable to all passive and active
components.
b. The parameter variations are taken from the component specification, manufacturer’s
specifications, data sheet or test results. These parameter variations generally have biased
values and are expressed as a delta per degree Celsius (in % or in value) with respect to the
value within the component specification at the reference condition. There can also be a random
part with respect to the bias value. For passive parts the parameter variation over temperature
is usually a fixed value.
c. Often the component specification does not contain the parameter variation in the necessary
parametric form required for the evaluation of the worst case performance of the circuit. In this
case, the parameter variations should be derived considering, for instance, measurement data
and component physics.
d. In the component specification these variations generally apply over the complete temperature
range of the component (‐55 C to +125 C). The thermal analysis of the equipment is provided
as an input with the actual temperature range of each component, which is usually lower than
this complete temperature range. The thermal analysis considers the temperature rise between
the PCB temperature, the case temperature and the junction temperature.
e. Within the WCA the temperature of the component is the ambient temperature when the
equipment thermal interface varies over the acceptance temperature range. In the worst case
analysis, the minimum temperature of each component is the minimum acceptance
environmental temperature of the equipment. The maximum temperature is the temperature
determined within the thermal analysis for the extreme acceptance temperature of the
equipment. As long as the results from the thermal analysis are not available, the component
can be assumed to operate at the maximum operating temperature.
5.1.1.6 Initial tolerance
Parameter variations due to initial tolerance concern all passive and active components.
If the circuit compensates initial tolerance variations, the WCA should include an analysis of the
residual variation.
The variations are taken from the applicable component specifications and have a random
distribution.
5.1.1.7 Ageing
5.1.1.7.1 Introduction
Parameter variations due to ageing concern all passive and all active components.
This variation is a function of time and temperature, junction temperature for active components, and
case temperature for passive components.
17
ECSS‐Q‐HB‐30‐01A
14 January 2011
The ageing effects are specific to each family of components.
The variations are taken from the component specifications, life test data or worst case parameter
database.
5.1.1.7.2 Extrapolation of ageing data from the lifetime assumed in database to the design lifetime
If the design lifetime is different from the lifetime assumed in the database, the effective ageing data
should be extrapolated from the data available in the database:
The linear extrapolation (conservative approach) should be applied. The use of other extrapolations
may be adopted with adequate justification.
For a design lifetime shorter than the database, the database value for the next longer time interval
should be assumed. The parameter variation data should not be interpolated between database values
without justification, as the ageing process cannot be assumed a priori to be linear.
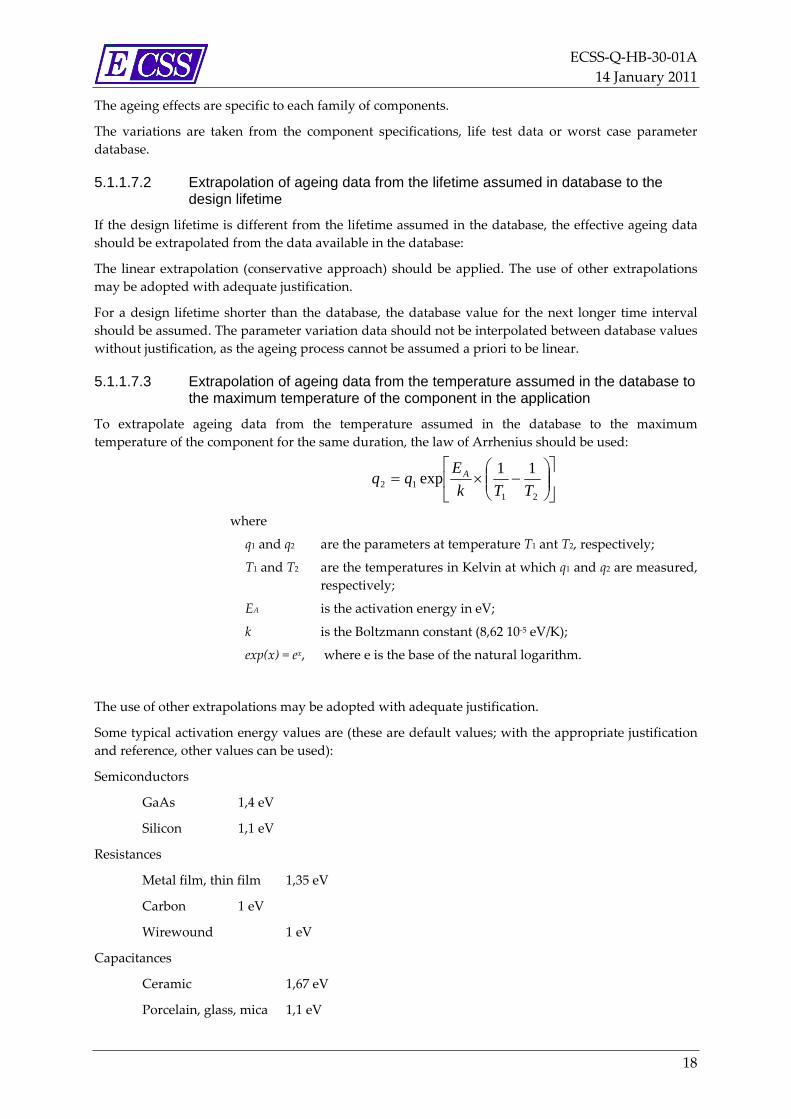
5.1.1.7.3 Extrapolation of ageing data from the temperature assumed in the database to the maximum temperature of the component in the application
To extrapolate ageing data from the temperature assumed in the database to the maximum
temperature of the component for the same duration, the law of Arrhenius should be used:
2112
11exp
TTk
Eqq A
where
q1 and q2 are the parameters at temperature T1 ant T2, respectively;
T1 and T2 are the temperatures in Kelvin at which q1 and q2 are measured,
respectively;
EA is the activation energy in eV;
k is the Boltzmann constant (8,62 10‐5 eV/K);
exp(x) = ex, where e is the base of the natural logarithm.
The use of other extrapolations may be adopted with adequate justification.
Some typical activation energy values are (these are default values; with the appropriate justification
and reference, other values can be used):
Semiconductors
GaAs 1,4 eV
Silicon 1,1 eV
Resistances
Metal film, thin film 1,35 eV
Carbon 1 eV
Wirewound 1 eV
Capacitances
Ceramic 1,67 eV
Porcelain, glass, mica 1,1 eV
18
ECSS‐Q‐HB‐30‐01A
14 January 2011
Film, plastic 3,4 eV
Tantalum 0,43 eV
NOTE For a mission duration of 10 years, we want the drift in ageing of
VZ at T2 = 85 C. We take an activation energy of 1,1 eV
(semiconductors).
We know that q1 = 2 % at T1 = 110 C, what is the value of q2 ?
85273
1
110273
1
1062,8
1,1exp2
52q => %195,02 q
At Tj = 85C, the voltage VZ varies by 0,195 % in 10 years.
5.1.1.8 EMC and variation of electrical signals
Worst case variations of the signal at the electrical interfaces (including conducted EMC) should be
considered. These variations depend on the design of the equipment and are generally random in
nature.
The extreme values are taken from the interface specification and the EMC requirements.
The interest of the worst case is to verify that the parameter variations of the components selected for
conducted EMC reduction and the components that generate conducted EMC allow the EMC
requirements to be satisfied.
The circuit behaviour for the EMC aspects can be determined either by simulation , or by tests or by
combination of both.
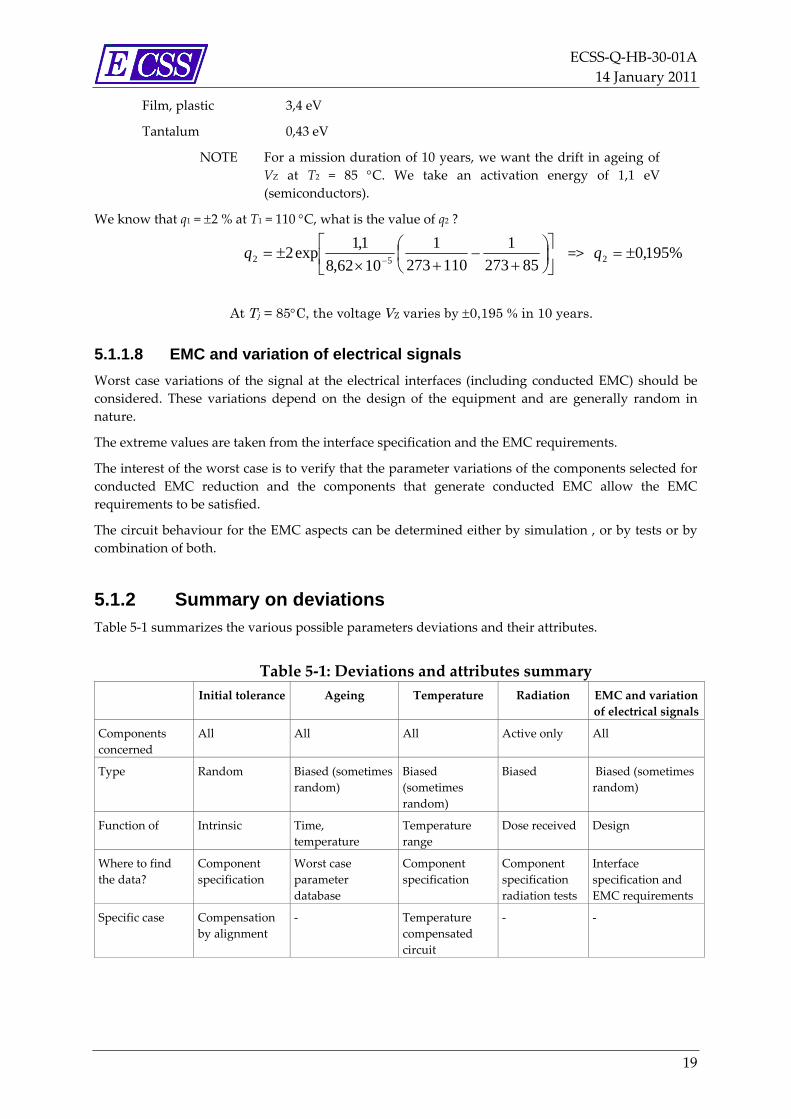
5.1.2 Summary on deviations Table 5‐1 summarizes the various possible parameters deviations and their attributes.
Table 5‐1: Deviations and attributes summary
Initial tolerance Ageing Temperature Radiation EMC and variation
of electrical signals
Components
concerned
All All All Active only All
Type Random Biased (sometimes
random)
Biased
(sometimes
random)
Biased Biased (sometimes
random)
Function of Intrinsic Time,
temperature
Temperature
range
Dose received Design
Where to find
the data?
Component
specification
Worst case
parameter
database
Component
specification
Component
specification
radiation tests
Interface
specification and
EMC requirements
Specific case Compensation
by alignment
‐ Temperature
compensated
circuit
‐ ‐
19
ECSS‐Q‐HB‐30‐01A
14 January 2011
5.2 Phase and timing considerations within the WCA
5.2.1 Introduction This clause provides inputs to take into account the phase and timing problems. Some specific
problems are detailed in this clause. Nevertheless, other timing problems (such as reset duration and
voltage level) should be analysed in the WCA.
Within the WCA it should also be demonstrated that the timing conditions of the signals are such that
the circuit operates properly together under simultaneous worst case source and load conditions. It is
suggested that particular attention be paid to noise margin at the interface when performing the worst
case analysis.
5.2.2 Timing of transient pulses
5.2.2.1 General
All sequential circuits should have a worst case timing diagram made to determine the effects of
variation in switching times of the installed circuits. There are many factors that affect timing. They
include supply voltage, capacitive loading, clock or oscillator instability, and slope of clock rising and
falling edge.
5.2.2.2 Signal delays (and response times in digital circuits)
The limits of the propagation delays for the circuit being analysed should also be shown in the WCA.
For example, response times in digital circuits should conform to the required response times
identified in the requirements. For circuits that have no specific delay or response times at the unit
level, the worst case response times should be explored in further detail during the system level worst
case analysis to determine if design constraints should be levied “from the top down”. The total delay
of a circuit is the sum of its propagation delay and a transition time effect.
5.2.2.3 Phasing of repeating waveforms (such as sinusoidal signals)
In circuits such as DC/DC converters or RF circuits, the timing of the signal waveforms can be critical.
In this case, the WCA should include an evaluation of the required phase and gain margins.
5.3 Numerical analysis techniques
5.3.1 Approach The worst case analysis can be performed using four different approaches:
extreme value analysis;
extreme value analysis combined approach;
root‐sum‐squared analysis;
Monte Carlo analysis.
20
ECSS‐Q‐HB‐30‐01A
14 January 2011
5.3.2 Extreme value analysis The extreme value analysis (EVA) technique is the best initial approach to worst case analysis. The
extreme value analysis assesses circuit performance when each component exhibits its most extreme
variation; if the circuit passes an EVA, it always functions properly. If the circuit fails, the circuit can
be modified to meet the performance. Alternatively, a less conservative approach can be applied, such
as the extreme value analysis combined approach, the root‐sum‐squared analysis or the Monte Carlo
analysis. EVA uses the limits of variability and the circuit directional sensitivities to determine the
worst case results.
5.3.3 Extreme value analysis combined approach This method uses as an initial approach when the minimum and maximum values of the variables are
not available, but only their nominal values and their deviations. This method is based on the fact that
some variations are random (the variation has no preferred direction or sign) and others are biased
(with a deterministic direction or sign). This approach is valid for standard deviations (moment
methods), but is not always valid for maximum values.
5.3.4 Root-sum-squared analysis
The root‐sum‐squared (RSS) approach to the worst case analysis provides a more realistic evaluation
technique by employing a statistical approach. An RSS analysis provides a probability that
manufactured circuits work within specification (the manufacturing yield). The results are in the form
of parameter bias and standard deviation, so that the three‐sigma limits of performance can be
determined.
5.3.5 Monte Carlo analysis The Monte Carlo analysis (MCA) technique is a computer simulation of circuit performance to
provide statistically significant results that estimate the percentage of circuits that operates
successfully under expected field conditions.
This method uses actual part tolerance distributions, if available. If these distributions can be utilized,
then this approach is the most realistic of the three.
If the circuit parameter probability distribution is unknown or if it is difficult to select the reference
one appropriately, a binomial process can be used. But this process requires a higher number of
iterations than the normal distribution.
The working hypothesis on the applicable distribution significantly reduces the effort.
The simulations should be performed to assure, at least, P = 99,5% (in line with the three‐sigma limits
– P = 99,73% ‐ of the RSS approach) with a confidence level of 95%, where P is the probability that the
circuit operates successfully.
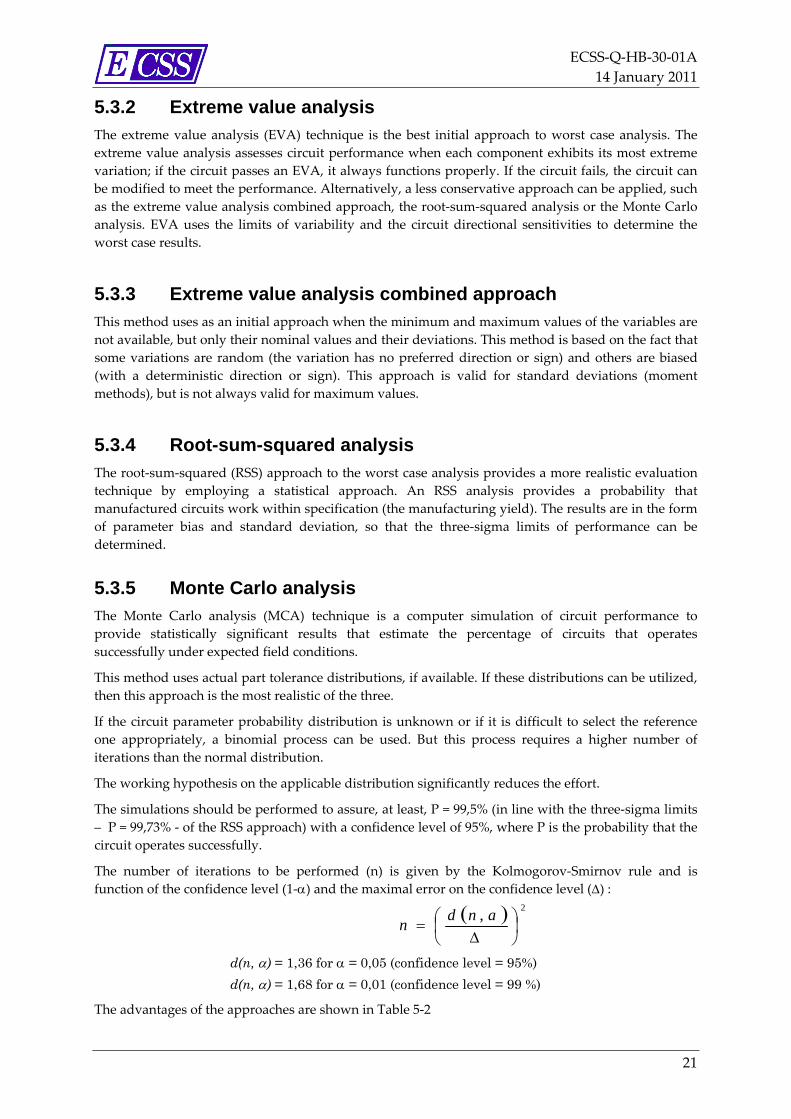
The number of iterations to be performed (n) is given by the Kolmogorov‐Smirnov rule and is
function of the confidence level (1‐) and the maximal error on the confidence level () :
2,
andn
d(n, ) = 1,36 for = 0,05 (confidence level = 95%)
d(n, ) = 1,68 for = 0,01 (confidence level = 99 %)
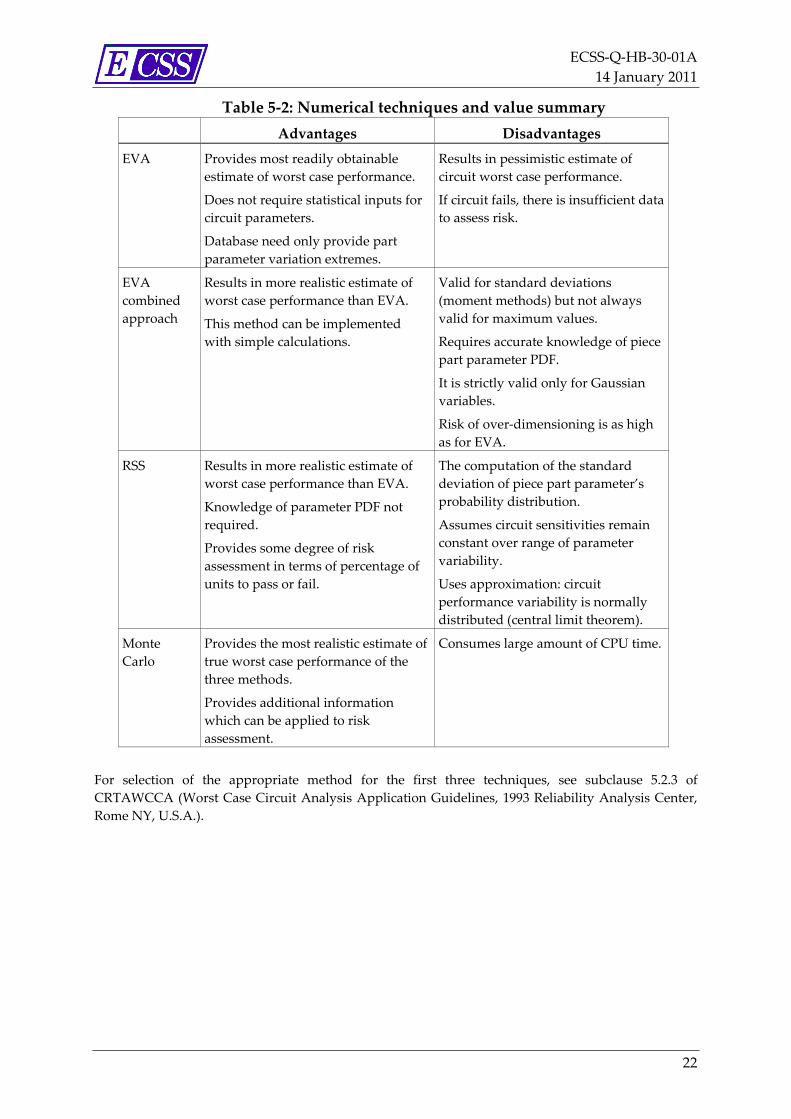
The advantages of the approaches are shown in Table 5‐2
21
ECSS‐Q‐HB‐30‐01A
14 January 2011
Table 5‐2: Numerical techniques and value summary
Advantages Disadvantages
EVA Provides most readily obtainable
estimate of worst case performance.
Does not require statistical inputs for
circuit parameters.
Database need only provide part
parameter variation extremes.
Results in pessimistic estimate of
circuit worst case performance.
If circuit fails, there is insufficient data
to assess risk.
EVA
combined
approach
Results in more realistic estimate of
worst case performance than EVA.
This method can be implemented
with simple calculations.
Valid for standard deviations
(moment methods) but not always
valid for maximum values.
Requires accurate knowledge of piece
part parameter PDF.
It is strictly valid only for Gaussian
variables.
Risk of over‐dimensioning is as high
as for EVA.
RSS Results in more realistic estimate of
worst case performance than EVA.
Knowledge of parameter PDF not
required.
Provides some degree of risk
assessment in terms of percentage of
units to pass or fail.
The computation of the standard
deviation of piece part parameter’s
probability distribution.
Assumes circuit sensitivities remain
constant over range of parameter
variability.
Uses approximation: circuit
performance variability is normally
distributed (central limit theorem).
Monte
Carlo
Provides the most realistic estimate of
true worst case performance of the
three methods.
Provides additional information
which can be applied to risk
assessment.
Consumes large amount of CPU time.
For selection of the appropriate method for the first three techniques, see subclause 5.2.3 of
CRTAWCCA (Worst Case Circuit Analysis Application Guidelines, 1993 Reliability Analysis Center,
Rome NY, U.S.A.).
22
ECSS‐Q‐HB‐30‐01A
14 January 2011
23
6 WCA and project phases
A detailed WCA during the design phase can be used to find design problems that were not found
during the test phase due to temperature extremes, age or radiation.
For selected circuitry, a preliminary WCA should be available to validate a conceptual design
approach at PDR.
The assumptions and approach to be used in the analyses should be checked against reliability
assessments prior to the performance of the analyses.
The critical aspects with respect to worst case performance and the critical circuit parameters should
be identified. These critical aspects can be identified from results of other analyses (e.g. FMECA, sneak
analysis). The circuits models and equations should be defined. If a nonconformance is identified, a
redesign of the circuit can be proposed to achieve conformance or an optimization of the analysis can
be investigated.
If design changes are made, either as a result of the WCA or for other reasons, the WCA should be
updated using the new circuit.
Results of such an analysis are generally presented in the frame of the circuit CDR.