Embed Size (px)
Citation preview
November 22, 2007
Industry SurveysAirlines
THIS ISSUE REPLACES THE ONE DATED MAY 24 , 2007 .THE NEXT UPDATE OF THIS SURVEY IS SCHEDULED FOR MAY 2008 .
CCoonnttaaccttss::
Inquiries &Client [email protected]
MediaMichael [email protected]
Replacement copies800.852.1641
Jim CorridoreAirlines Analyst
CURRENT ENVIRONMENT..................................................................1Chronic delays prompt increased government scrutiny
Delays unlikely to ground profitability Profitability seen for 2007 and 2008 Fares, yields have risen Open skies ahead? Where are the mergers? Labor costs down sharply, but still too high Pressure to “go green”
INDUSTRY PROFILE...............................................................................9Airlines still face extreme challenges
INDUSTRY TRENDS ...............................................................................10The impact of five years of multibillion-dollar losses Airlines struggle to survive Security costs rise Start-ups: many fail, a few thrive Small jets create opportunities in regional markets Embracing the Internet... International markets provide growth
HOW THE INDUSTRY OPERATES .............................................................17Providing transportation Industry structure Competitors on all sides Airline costs Operations overview Distribution changing with technology Regulation under deregulation Feds take jurisdiction over airport security
KEY INDUSTRY RATIOS AND STATISTICS ...................................................25HOW TO ANALYZE AN AIRLINE .............................................................27
Revenue-related factors Costs Profitability and load factor Balance sheet stability and cash burn Service and safety record Equity valuation
GLOSSARY .............................................................................................32
INDUSTRY REFERENCES.....................................................................33
COMPARATIVE COMPANY ANALYSIS .............................................36

Executive Editor: Eileen M. Bossong-MartinesAssociate Editor: Joseph M. CodaCopy Editor: Brandon WilkersonStatistician: Sally Kathryn NuttallProduction: GraphMedia
Client Support: 1-800-523-4534Copyright © 2007 by Standard & Poor’sAll rights reserved.ISSN 0196-4666USPS No. 517-780Visit the Standard & Poor’s Web site:http://www.standardandpoors.com
STANDARD & POOR’S INDUSTRY SURVEYS is published weekly. Annualsubscription: $10,500. Please call for special pricing: 1-800-523-4534,option 2. Reproduction in whole or in part (including inputting into acomputer) prohibited except by permission of Standard & Poor’s.Executive and Editorial Office: Standard & Poor’s, 55 Water Street, NewYork, NY 10041. Standard & Poor’s is a division of The McGraw-HillCompanies. Officers of The McGraw-Hill Companies, Inc.: Harold McGrawIII, Chairman, President, and Chief Executive Officer; Kenneth M. Vittor,Executive Vice President and General Counsel; Robert J. Bahash,Executive Vice President and Chief Financial Officer; John Weisenseel,Senior Vice President, Treasury Operations. Periodicals postage paid atNew York, NY 10004 and additional mailing offices. POSTMASTER: Sendaddress changes to Standard & Poor’s, INDUSTRY SURVEYS, Attn: MailPrep, 55 Water Street, New York, NY 10041. Information has beenobtained by Standard & Poor’s INDUSTRY SURVEYS from sourcesbelieved to be reliable. However, because of the possibility of human ormechanical error by our sources, INDUSTRY SURVEYS, or others,INDUSTRY SURVEYS does not guarantee the accuracy, adequacy, orcompleteness of any information and is not responsible for any errors oromissions or for the results obtained from the use of such information.
VOLUME 175, NO. 47, SECTION 1 THIS ISSUE OF INDUSTRY SURVEYS INCLUDES 2 SECTIONS.
Standard & Poor’s Industry Surveys
If 2006 was known as the year the industry re-covered from five years of billion-dollar losses,2007 will surely be known as a year of frus-trating delays, cancellations, and poor cus-tomer service. The year started out with poorwinter weather, which led to numerous flightdelays and cancellations, as well as severalhighly publicized incidents of passengersstranded on planes for hours. Summer travelbrought severe airport congestion, the returnof long security lines, flight delays and cancel-lations even during good weather, and terribleon-time performance industrywide.
Standard & Poor’s does not believe there isan easy short-term solution to the complexgridlock and congestion problems plaguing theindustry. Nevertheless, there are several fixesthat we think could alleviate the pressure onthe system in the short term until a new airtraffic control system can be deployed, whichwould go a long way toward easing airportdelays and congestion. If the carriers them-selves are unable or unwilling to take somesteps, we think the US government, particular-ly heading into an election year, could step inand force some corrective action.
In fact, on September 20, 2007, the USHouse of Representatives passed an FAAfunding bill (H.R. 2881), which, along with
funding for the Federal Aviation Administra-tion (FAA), included demands that airlinesand airports come up with plans to providepassengers stranded by long delays withfood, water, and other basic amenities, andto allow passengers to deplane following ex-cessive delays. The White House was threat-ening a veto under the belief that thismeasure does not go far enough and wants abill that includes solutions to improve delaysas well. This bill could be the start of somere-regulation of the airline industry in orderto ease customer service problems.
The issue of overcrowded skies eased withthe airline industry downturn that started in2001. By 2006, however, industry trafficreached pre-2001 levels and delays againreared their ugly head, primarily during peaktravel periods. In the summer of 2007, thelevel of delays ratcheted up further. Year todate through August, the US airline indus-try’s on-time arrival rate was 72%, versus76% for the first eight months of 2006, ac-cording to the Bureau of Transportation Sta-tistics. For the month of August alone, theon-time arrival rate was 71.7%, versus75.8% a year earlier. Though sharply worsethan a year earlier, this was an improvementover July 2007’s on-time rate of 69.8%. Alsoin August 2007, complaints about airline ser-vice nearly doubled to 1,634, versus 864 inAugust 2006.
Standard & Poor’s believes that possibleshort-term solutions could include the FAAimposing restrictions on US carriers to flyfewer flights during peak periods, whichwould force airlines to spread more flightsout to off-peak periods. In addition, wethink that smaller regional and corporate jetscould be given less priority for take-off thanbigger legacy planes carrying more passen-gers. The FAA is already implementingchanges to flight paths in some major mar-kets including the New York metropolitanarea, which is partly intended to allow air
CURRENT ENVIRONMENT
Chronic delays prompt increased government scrutiny
NO
VEM
BER
22,
200
7 /
AIR
LIN
ES I
ND
US
TRY
SU
RV
EY
1
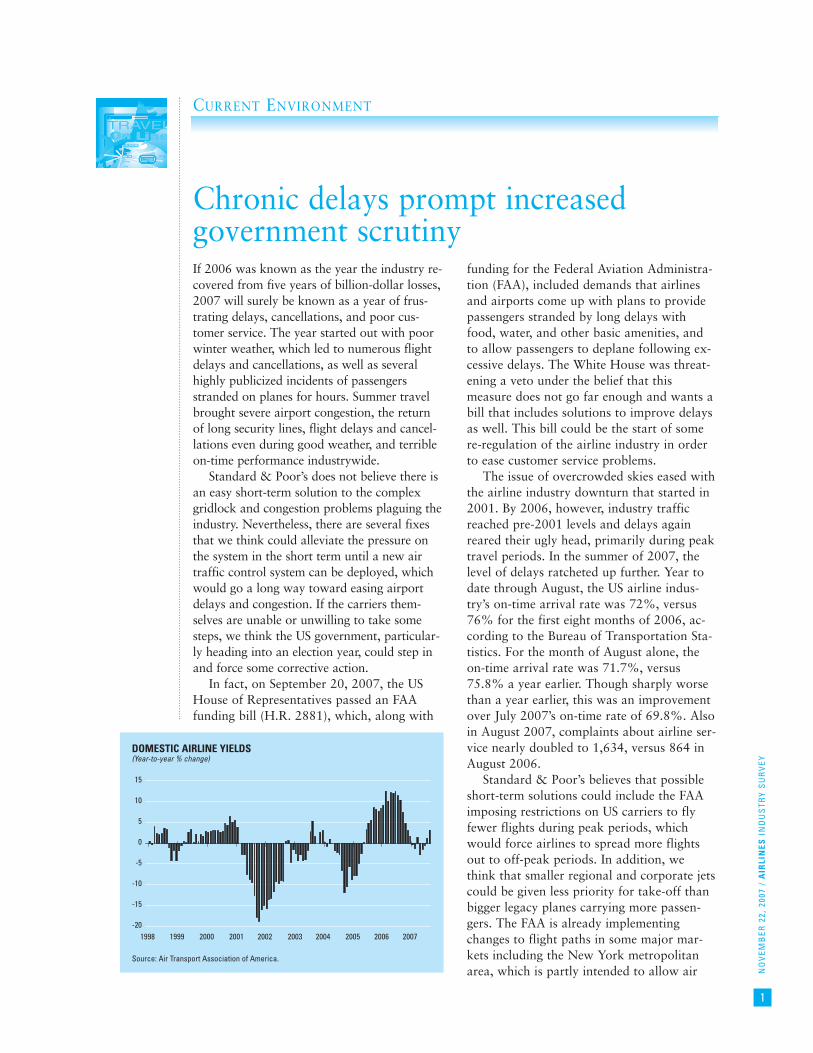
DOMESTIC AIRLINE YIELDS(Year-to-year % change)
Source: Air Transport Association of America.
15
10
5
0
-5
-10
-15
-201998 1999 2000 2001 2002 2003 2004 2005 2006 2007

NO
VEM
BER
22,
200
7 /
AIR
LIN
ES I
ND
US
TRY
SU
RV
EY
2
traffic controllers to spread flights out over agreater geographic area to increase air trafficdensity. Restrictions on the number of re-gional jets flown in congested markets couldalso be a partial solution, since regional jetscarry far fewer passengers than large jets, yettake up just as much time taxiing, taking off,and landing as other planes. If airlines wereforced to “upgauge” their fleets (flying big-ger jets rather than smaller planes that neces-sitate more take-offs), we think this couldalso help cut delays.
In the long term, the replacement of theoutdated air traffic control (ATC) system willbe necessary to ease congestion. This anti-quated system uses radar rather than themore sophisticated satellite-based GPS (glob-al positioning system) technology largelyavailable in passenger vehicles. In otherwords, the plane in which you are flyingdoesn’t have the same level of tracking so-phistication that you have available in yourcar. Though better technology is available,it will take many years and billions of dol-lars in spending to implement a new sys-tem, so Standard & Poor’s feels that flightdelays will be here for some time to come.
Delays unlikely to ground profitability
Standard & Poor’s believes that 2007 willbe looked back on as a year of sharp financialimprovement and profitability for the US air-line industry, following an improved year in2006. We also think that 2008 is likely to re-main profitable, though we are worried aboutthe impact of a slowing US economy and highoil prices. This follows 2006, when the US air-line industry saw sharp improvement in rev-enues, earnings, and passenger traffic, taking alarge step in the right direction after five yearsof multibillion-dollar losses.
Part of the reason for the industry’s recov-ery is reflected in the large number of airlinebankruptcies that took place in 2005. Atsome point between September 14, 2005,and September 27, 2006, five of the 11 ma-jor US airlines were operating under Chapter11 bankruptcy protection. All five of theseairlines — US Airways Group Inc., UALCorp. (parent of United Airlines), GlobalAero Logistics Inc. (formerly ATA Holdings,parent of ATA Airlines), Delta Air Lines Inc.,and Northwest Airlines — have emergedfrom bankruptcy.
Standard & Poor’s believes that the indus-try is now in the midst of a recovery, but onethat is somewhat fragile. The risks are numer-ous: a potential spike in oil prices, the effectsof a resurgence of concern over terrorism andincreased security impositions, and a slowingof the US economy. In addition, any sharp risein capacity plans at one or more of the carri-ers could put the industry recovery at risk bysparking a fare war. We believe that it is stilltoo soon to say that the industry is out of thewoods, especially given the still-shaky state ofmany airline balance sheets.
Profitability seen for 2007 and 2008
The 10 largest airlines in the US reported anet profit in 2006 of $1.6 billion excluding re-organization items at bankrupt carriers DeltaAir Lines (a loss of $7.2 billion) and North-west Airlines (a loss of $3.2 billion), and alsoexcluding reorganization items at UAL Corp.(gain of $22.9 billion upon emerging frombankruptcy). This net profit came on totalrevenues of $112.4 billion, an increase of11% over revenues of $101.4 billion in 2005.Excluding these reorganization items, the in-dustry returned to profitability for the firsttime since 2000. Also excluding reorganiza-tion items, seven of the 10 largest US airlineswere profitable in 2006, with only UALCorp., Alaska Air Group Inc., and JetBlueAirways Corp. unprofitable for the year.
Standard & Poor’s expects improving in-dustry fundamentals to lead to increasedprofitability in 2007. Standard & Poor’s cur-rently forecasts profits at all of the 10 largestUS carriers, with their aggregate profit hit-ting $3.1 billion in 2007. For 2008, we cur-rently forecast a profit of $4.1 billion for thetop ten US carriers.
Excluding reorganization items, the top10 US carriers lost about $4.0 billion in2005, on revenues of $101.4 billion. Accord-ing to our calculations, the net loss incurredby the top 10 carriers totaled $8.2 billion in2004 (on revenues of $85.8 billion), follow-ing losses of $4.5 billion ($81.6 billion) in2003, $11.1 billion ($80.9 billion) in 2002,and $7.6 billion ($87.2 billion) in 2001.
Airline equities have been a difficult placefor investors to make money. In 2006, theS&P Airlines subindex fell 7.7%, significant-ly underperforming the S&P 500 CompositeStock index, which rose 13.6% over the
NO
VEM
BER
22,
200
7 /
AIR
LIN
ES I
ND
US
TRY
SU
RV
EY
3
same period. In 2005, the S&P Airlinessubindex rose a meager 1.4%, comparedwith a 3.0% rise in the S&P 500. Through2006, the five-year compound annual growthrate in the S&P Airlines subindex was–13.4%, compared with a 4.4% increase inthe S&P 500 over the same period. We be-lieve that the poor performance of the S&PAirlines subindex for the past few years re-flects high oil prices, airline bankruptcies,and serious questions as to when the indus-try will return to sustained profitability. Yearto date through October 19, 2007, the S&PAirlines subindex declined a further 15.0%,versus a 5.8% rise in the S&P 500.
Fuel costs near historic highsOn October 25, 2007, oil prices hit a
record $92.22. As they have risen over thepast few years, oil prices have become in-creasingly volatile, reacting to geopoliticaluncertainties such as the war in Iraq; worriesabout the nuclear ambitions of Iran andNorth Korea, and about how the UnitedStates and the rest of the world will addressthose ambitions; high oil consumption in theUnited States, India, and China; worriesabout supply disruptions in Russia, Nigeria,Venezuela, and the Middle East; and a rela-tively weak US dollar versus other currencies.
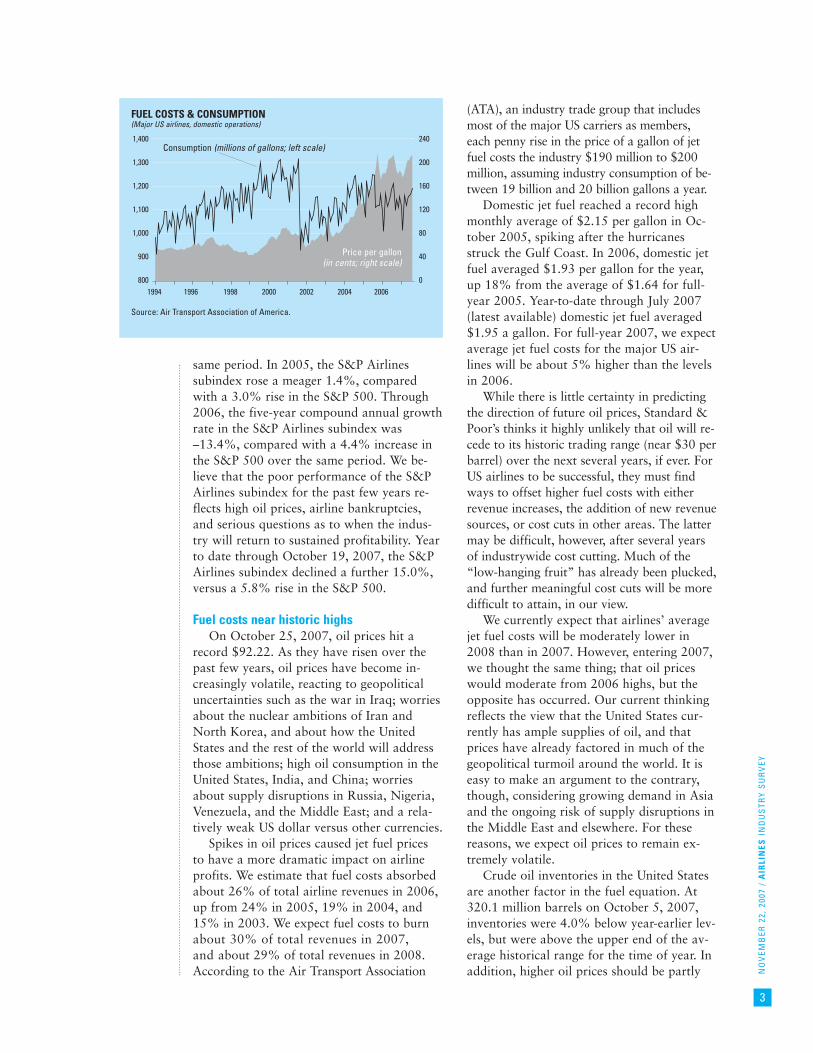
Spikes in oil prices caused jet fuel pricesto have a more dramatic impact on airlineprofits. We estimate that fuel costs absorbedabout 26% of total airline revenues in 2006,up from 24% in 2005, 19% in 2004, and15% in 2003. We expect fuel costs to burnabout 30% of total revenues in 2007,and about 29% of total revenues in 2008.According to the Air Transport Association
(ATA), an industry trade group that includesmost of the major US carriers as members,each penny rise in the price of a gallon of jetfuel costs the industry $190 million to $200million, assuming industry consumption of be-tween 19 billion and 20 billion gallons a year.
Domestic jet fuel reached a record highmonthly average of $2.15 per gallon in Oc-tober 2005, spiking after the hurricanesstruck the Gulf Coast. In 2006, domestic jetfuel averaged $1.93 per gallon for the year,up 18% from the average of $1.64 for full-year 2005. Year-to-date through July 2007(latest available) domestic jet fuel averaged$1.95 a gallon. For full-year 2007, we expectaverage jet fuel costs for the major US air-lines will be about 5% higher than the levelsin 2006.
While there is little certainty in predictingthe direction of future oil prices, Standard &Poor’s thinks it highly unlikely that oil will re-cede to its historic trading range (near $30 perbarrel) over the next several years, if ever. ForUS airlines to be successful, they must findways to offset higher fuel costs with eitherrevenue increases, the addition of new revenuesources, or cost cuts in other areas. The lattermay be difficult, however, after several yearsof industrywide cost cutting. Much of the“low-hanging fruit” has already been plucked,and further meaningful cost cuts will be moredifficult to attain, in our view.
We currently expect that airlines’ averagejet fuel costs will be moderately lower in2008 than in 2007. However, entering 2007,we thought the same thing; that oil priceswould moderate from 2006 highs, but theopposite has occurred. Our current thinkingreflects the view that the United States cur-rently has ample supplies of oil, and thatprices have already factored in much of thegeopolitical turmoil around the world. It iseasy to make an argument to the contrary,though, considering growing demand in Asiaand the ongoing risk of supply disruptions inthe Middle East and elsewhere. For thesereasons, we expect oil prices to remain ex-tremely volatile.
Crude oil inventories in the United Statesare another factor in the fuel equation. At320.1 million barrels on October 5, 2007,inventories were 4.0% below year-earlier lev-els, but were above the upper end of the av-erage historical range for the time of year. Inaddition, higher oil prices should be partly
FUEL COSTS & CONSUMPTION(Major US airlines, domestic operations)
Source: Air Transport Association of America.
1,400
1,300
1,200
1,100
1,000
900
800
240
200
160
120
80
40
01994 1996 1998 2000 2002 2004 2006
Consumption (millions of gallons; left scale)
Price per gallon(in cents; right scale)
NO
VEM
BER
22,
200
7 /
AIR
LIN
ES I
ND
US
TRY
SU
RV
EY
4
offset by the use of more efficient fleets, ascarriers have retired their oldest, most fuel-guzzling planes. Some of the financiallystronger airlines are also at least partly pro-tected from price escalations by hedging con-tracts put in place when prices were lower.Even this, however, will not be nearlyenough to fully protect them from high jetfuel costs.
“Crack spread” exacerbates the pain of highoil prices
Even as crude oil prices hover aroundrecord levels, something else is hurting theUS airline industry: the “crack spread.” Thismeasure — the cost difference between a bar-rel of oil and a barrel of refined jet fuel — hastraditionally hovered somewhere between $5and $10 a barrel; that is, jet fuel could costanywhere between $5 and $10 a barrel morethan crude oil. In the initial aftermath ofHurricanes Katrina and Rita, however, thatspread widened to about $60 a barrel, exac-erbating the difficulties the industry was al-ready facing. For full-year 2006, the crackspread averaged $16.64 a barrel, up 5%from the average of $15.84 for 2005 andwell above historical levels.
Fares, yields have risen
Starting in April 2005 and continuingsince then, US airlines have successfully im-plemented numerous fare increases, many ofwhich have stuck. As a result, passengers arepaying sharply higher fares on some routes
than they have in several years, although theprice increases have been lower in marketswhere the major carriers face significantcompetition from discount airlines.
Though this trend has been in place fortwo years, Standard & Poor’s believes thatfuture airfare hikes will depend on the levelof industry capacity and passenger travel de-mand in the wake of a slowing US economy.We think that passengers are likely to contin-ue to see high fares during peak periods suchas holidays and traditional vacation months,but that discounting is likely to reemerge atother, less seasonally strong times. Still, withload factors at or near record levels, airlinesmay opt to continue to try raising faresrather than attracting additional passengers.
Higher fares are a prerequisite for higheryields, which, in turn, are essential for in-dustry profitability. Yield, a measure of farelevels, is defined as revenue per revenue pas-senger-mile (RPM). RPMs are a measure oftraffic volume: one RPM indicates that onepassenger has flown one mile.
In 2006, yields strengthened, continuing arebound that began in 2005. According tothe ATA, the average domestic yield increased8.9% in 2006 to 12.78 cents per RPM, upfrom 11.74 cents per RPM in 2005. Totalsystem (domestic and international) yields in-creased 9.0% to 13.62 cents per RPM, from12.5 cents per RPM. This came on the heelsof a 4.1% dip in domestic yield and a 1.5%drop in system yield in 2004. By comparison,in 2000 — prior to the last industry down-turn — domestic yields averaged 14.49 centsper RPM. Year to date through July 2007,domestic yields averaged 12.9 cents per RPM,down fractionally from 12.91% for the sameperiod in 2006, and total system yields aver-aged 13.95 cents per RPM, up 1.8% yearover year.
Standard & Poor’s does not believe thatthe industry needs to get back to the 2000yield level to return to profitability, since costlevels have dropped sharply at all of the ma-jor carriers, albeit to varying extents. Cer-tainly, however, with oil prices still at highlevels, the industry needs to see continuedyield improvement from current levels beforeit can achieve sustained profitability.
Higher fares limit travel demand somewhatTravel demand weakened in 2006, due in
part to rising airfares, yield management ef-
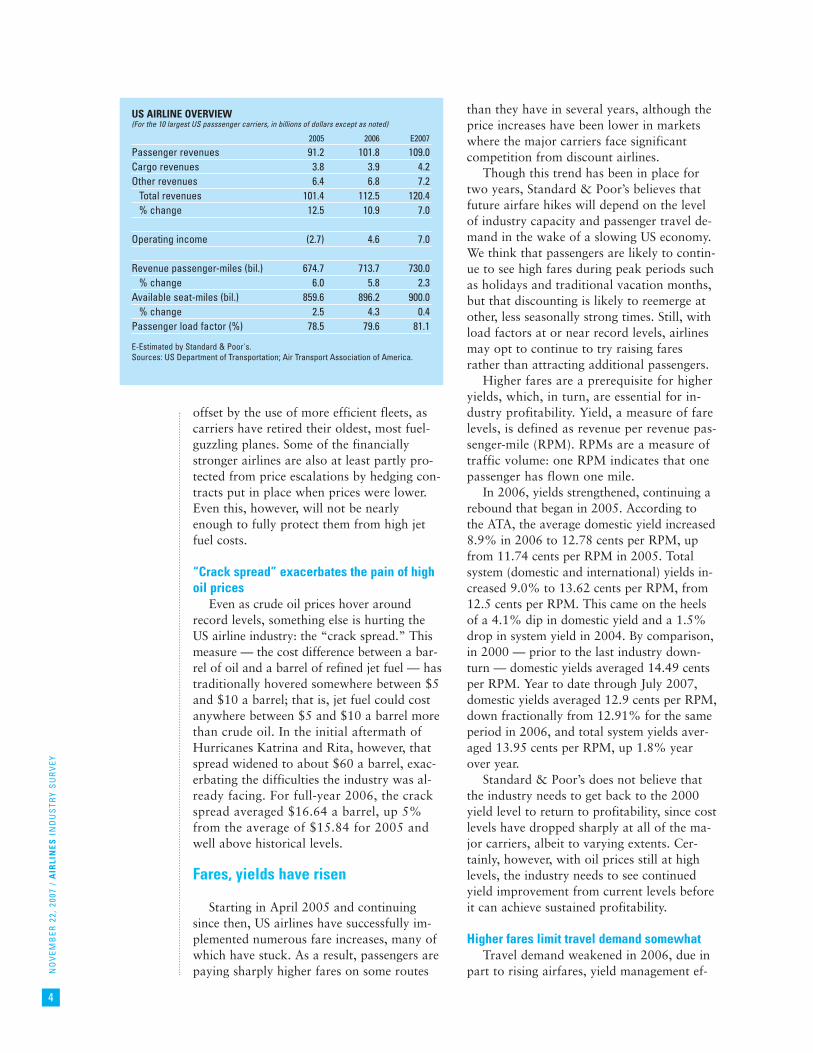
US AIRLINE OVERVIEW(For the 10 largest US passsenger carriers, in billions of dollars except as noted)
2005 2006 E2007
Passenger revenues 91.2 101.8 109.0 Cargo revenues 3.8 3.9 4.2 Other revenues 6.4 6.8 7.2
Total revenues 101.4 112.5 120.4 % change 12.5 10.9 7.0
Operating income (2.7) 4.6 7.0
Revenue passenger-miles (bil.) 674.7 713.7 730.0 % change 6.0 5.8 2.3
Available seat-miles (bil.) 859.6 896.2 900.0 % change 2.5 4.3 0.4
Passenger load factor (%) 78.5 79.6 81.1
E-Estimated by Standard & Poor's.Sources: US Department of Transportation; Air Transport Association of America.

NO
VEM
BER
22,
200
7 /
AIR
LIN
ES I
ND
US
TRY
SU
RV
EY
5
forts at the carriers (they successfully restrict-ed the number of seats offered at sale prices),and lower industry capacity that made fewerseats available. According to the Air Trans-port Association, total domestic airline traf-fic fell 2.2% in 2006 to 379.4 billion RPMs.Still, with airfares rising and flights relativelyfull, domestic passenger revenues increased6.5% in 2006 after rising 3.2% in 2005.Standard & Poor’s currently expects flat do-mestic airline traffic for 2007.
Domestic capacity, as measured by avail-able seat-miles (ASMs, the total number ofseats multiplied by the total number of milesflown), declined 4.6% in 2006 to 468.3 bil-lion, after falling 2.8% in 2005. Standard &Poor’s is forecasting a 1.0% drop in capacityfor 2007. Domestic passenger load factor im-proved by 2.0 percentage points in 2006, hit-ting a record average of 81.0% for the year,after improving by 3.2 percentage points in2005, when it averaged 79.06%.
Terror fears to remain with usOn August 10, 2006, numerous individu-
als were arrested in relation to an alleged ter-rorist plot to mix liquids on board airlinersbound for the United States from Europe, inorder to create and then detonate explosivedevices while these planes were in flight. Inthe immediate aftermath of these arrests, air-ports instituted new security rules.
While the reemergence of worries aboutairline-related terrorist acts and the increasedhassle factor at airports have the potential toderail the nascent industry recovery, Stan-dard & Poor’s currently expects the overalleffect to be relatively minimal. We believethat these problems likely shaved about twopercentage points from unit revenue growthin the third quarter of 2006, but that theshort-term financial penalty was probablymore than offset by the positive impact ofthe recent drop in fuel prices.
Open skies ahead?
The European Union voted on and ap-proved an “open skies” aviation deal inMarch 2007. This two-year deal, which be-comes effective on March 28, 2008, will es-sentially open up restricted trans-Atlanticroutes and allow US airlines to fly anywherein the 27-nation European Union to anypoint in the United States. US carriers will
now be able to fly within Europe withoutgiving up similar domestic rights to interna-tional carriers. The deal is likely to open upthe London market to more competition, asmore carriers are likely to be awarded land-ing slots at Heathrow airport.
We think the deal could be beneficial forconsumers, as increased competition in someEuropean markets is likely to lead to lowerairfares. US carriers that do not currently en-joy landing slots at Heathrow, includingContinental Airlines Inc. and Delta, are likelyto benefit as well. Carriers such as United,American, and British Airways PLC, though,are likely to see increased competition andcould lose some coveted Heathrow landingslots. In addition, the deal could ultimatelyforce international airline industry consolida-tion, as the increased competition forces in-dustry consolidation. All of this is likely toplay out over several years: landing slotshave to be awarded, and the deal goes intoeffect a year from now.
Where are the mergers?
On November 15, 2006, US Airways pro-posed a merger with Delta Air Lines in a dealthat set the industry ablaze with merger spec-ulation. The proposed Delta–US Airwayscombination would have created the world’slargest airline. Delta successfully fought offthe merger, arguing to regulators, creditorsand employees that the airline was worthmore than the $8.0 billion original offer priceand the subsequently increased offer price of$10.2 billion. On January 31, 2007, US Air-ways rescinded its merger proposal.
Standard & Poor’s believes that themerger would have created a strong globalcompetitor, stronger than either of the car-riers on a standalone basis. In addition, wethink that the merger could have set up aseries of competing mergers as remainingcarriers could have potentially combined toincrease their ability to combat a combinedDelta–US Airways. We think Delta ulti-mately was worried that one of these po-tential mergers could have created astronger competitor. Despite rampant in-dustry speculation, no major deals have oc-curred as of October 2007. In fact, theonly other deal of recent note — the pro-posed merger of small regional player Mid-west Air Group Inc. by AirTran — was
NO
VEM
BER
22,
200
7 /
AIR
LIN
ES I
ND
US
TRY
SU
RV
EY
6
fought off by MidWest by agreeing to beacquired in a private leveraged buyout.
Standard & Poor’s feels that it will take an-other industry downturn, with the return ofbillion-dollar losses, before any major industryconsolidation is to take place. We do thinkthat other leveraged private equity deals couldoccur, but the tightening of the US credit mar-ket in the aftermath of the subprime mortgagecrisis and housing slowdown should make itmore difficult to raise the necessary debt to fi-nance any prospective deal.
Airline industry restructuresIn general, Standard & Poor’s feels that sev-
eral factors — restrained industry capacity lev-els, a record percentage of seats filled onaverage, strong passenger demand, and risingprices — should drive improved revenuegrowth in 2007 and 2008. Oil prices remain asignificant worry, but any stabilization ormoderation could drive strong profit levels forthe first time in many years for much of the in-dustry. Nevertheless, the industry remains influx. In the midst of bankruptcies, restructur-ings, recoveries, mergers, and growth amongdiscounters, the changing shape of the airlineindustry is another dynamic variable thatcould sway results.
◆ Delta and Northwest. After strugglingfor some time, Delta and Northwest filed forChapter 11 bankruptcy protection on thesame day, September 14, 2005. Both carriersemerged from bankruptcy in the first half of2007 with sharply lower operating costs,lower debt levels, and streamlined opera-tions. So far the emergence of these carriershas not instigated another painful round ofcapacity hikes, airfare price cuts, and de-structive competition; they have so far beenmore restrained in how they have chosen tocompete, which could bode well for futureindustry prospects.
In bankruptcy, Delta has forced pay cutson its employees, eliminated its pilots’ pen-sion plan, and shrunk domestic capacitywhile increasing international capacity. Theairline also restructured aircraft operatingleases and debt obligations.
We believe that Northwest’s decision tofile for bankruptcy was influenced by thechanges in US bankruptcy laws that wentinto effect on October 17, 2005. Among oth-er changes, the revised law gave companies in
bankruptcy only 18 months to file a plan ofreorganization with the court; the previouslaw, in contrast, gave companies an almostunlimited amount of time (as highlighted byUnited spending more than three years underChapter 11 protection). Before its bankruptcyfiling, Northwest was battling a strike by itsmechanics union, as well as experiencing dif-ficult negotiations with flight attendants andpilots. In our view, once Northwest decidedthat it needed to file before October 17,2005, the company probably decided to fileeven sooner to protect as much of its cash aspossible.
In our view, Northwest was even more ag-gressive than Delta in pursuing cost cutsfrom labor groups, and the company under-went brutal negotiations with its mechanicsand flight attendants. In October 2006, aftera 14-month strike, mechanics agreed toterms with the company. Flight attendantshad a pay cut of 21% forced on them by thebankruptcy court.
◆ UAL out of bankruptcy. UAL — parentof United Airlines, the second largest airline inthe United States in terms of both revenuesand RPMs — filed for Chapter 11 bankruptcyprotection on December 9, 2002. This was amonumental event in the industry, given thatUnited accounted for about 25% of all RPMsflown by US scheduled airlines in 2002 andabout 24% of the US airline industry’s capaci-ty, as measured in ASMs.
On February 1, 2006, the bankruptcycourt confirmed UAL’s plan of reorganiza-tion, and the company emerged from Chap-ter 11 after operating for more than threeyears under bankruptcy protection. UALemerged with sharply lower operating costsand lower debt levels, and without the bur-den of a hugely underfunded pension plan,which was passed on to the US Pension Ben-efit Guarantee Corp. (PBGC), a governmentagency that insures the pensions of US cor-porations. In bankruptcy, United cut annualcosts by $7.0 billion, cut capacity by about20%, and sharply reduced debt and otherobligations. The company emerged frombankruptcy with about $3.0 billion in cash.
The company’s restructuring plan was cre-ated without long-term oil prices of over $60a barrel in mind, and may not have fully tak-en into account the extent to which discountcarriers have been driving pricing in the US
NO
VEM
BER
22,
200
7 /
AIR
LIN
ES I
ND
US
TRY
SU
RV
EY
7
airline industry. Still, the company has afresh chance with lower debt, new capitaliza-tion, and no large underfunded pensionmake-up payments due.
Standard & Poor’s believes that United sub-stantially improved its competitive positionwhile in bankruptcy, but we also believe thatthe company still has higher operating coststhan most of its competitors. United’s strongbusiness travel market share and strong inter-national network could allow it to get a yieldpremium to peers in an industry upcycle,which is what we believe we currently are see-ing. If the company’s unit costs remain abovethose of its peers, though, we think that Unit-ed will remain susceptible to large losses dur-ing a future industry downturn.
◆ AMR: looking to cut debt. AMR Corp.,parent of American Airlines, posted net in-come of $231 million in 2006, following loss-es of $861 million in 2005, $761 million in2004, $1.3 billion in 2003, and $3.5 billionin 2002. In 2003, the airline was successful incoaxing $1.8 billion in annual cost reductionsfrom its unions. Labor concessions and othercost-cutting initiatives, including about $200million in givebacks by vendors and suppliers,were targeted to reduce AMR’s annual costsby about $4 billion.
Cost cuts, revenue increases, and sharpreductions in capital expenditures over thepast few years have led to a large increasein the company’s cash balances, which to-taled $5.2 billion at the end of 2006. Thesehigh cash levels, along with improving in-dustry prospects, lead us to believe thatAMR is not likely to file for bankruptcy atleast through the end of 2008.
If AMR is to survive in the longer term, itwill need to expand its cost-cutting and see asustained improvement in the industry envi-ronment. As of December 31, 2006, thecompany was saddled with $18.4 billion inlong-term debt and capital lease obligations,including current maturities and the presentvalue of operating leases. This was downfrom $20.1 billion a year earlier. Stockhold-ers’ equity was a negative $606 million, butthat had risen from a negative $1.4 billion ayear earlier. The company’s ability to staveoff bankruptcy has had a strong effect onAMR’s stock price since 2003. Since closingon December 31, 2002, at $6.60 a share, theshares increased more than six fold and
reached a high of $41.00 on January 17,2007, before the price settled to $23.76 onOctober 11.
◆ Continental: focus on Newark and in-ternational growth. Continental Airlines, thefourth largest US carrier, has been focused onusing its hub in Newark, New Jersey, as aninternational gateway. To this end, the com-pany has sharply increased international ca-pacity over the past year and a half, addingfrequencies and entering new European andAsian markets. Continental hopes to leverageits leading position in Newark to attractmore business travelers, an area in which italready leads most of its peers.
While many carriers have been cutting ca-pacity, Continental has been adding domesticcapacity, which has helped the carrier duringthe recent period of increasing fares. Stan-dard & Poor’s expects strong earnings forContinental in 2007 and 2008, following a$389 million net profit in 2006, which werethe carrier’s first profits from operationssince before September 11, 2001.
Low-cost carriers feel the heatAlthough the airline industry operating
environment was brutal from 2001 to 2005,carriers that operated with low costs and lowfares were generally able to cope better thantheir higher-cost counterparts. Notably,Southwest posted its 34th consecutive year ofnet income in 2006 — an amazing feat, giventhe cyclical nature of the business.
Two other low-cost carriers, JetBlue andAirTran, both performed better in 2006 thanin 2005, but both these carriers’ results aredisappointing when compared with prioryears. JetBlue posted a net loss of $1.0 mil-lion, which equates to $0.00 per share, onrevenues of $2.3 billion — better than the$20.2 million ($0.13 per share) loss that thecarrier experienced in 2005 on revenues of$1.7 billion, but sharply worse than net in-come of $0.29 per share and $0.65 per sharein 2004 and 2003, respectively. AirTran post-ed a $15.5 million net profit in 2006 ($0.17a share), on revenues of $1.9 billion — betterthan the $1.7 million net profit in 2005($0.02) on revenues of $1.5 billion. AirTran’snet profit in 2006 equates to a net margin ofjust 0.8%, sharply lower than the net profitof 10.9% that the carrier reported in 2003.The sharp rise in fuel costs over the past two
NO
VEM
BER
22,
200
7 /
AIR
LIN
ES I
ND
US
TRY
SU
RV
EY
8
years has hurt both JetBlue and AirTran,while a successful fuel-hedging program hasprotected Southwest.
Southwest earned $499 million in 2006($0.61 a share), down from $548 million($0.67) in 2005. Although profits have re-mained below the levels of 2000, Southwesthas maintained its balance sheet health with-out cutting staff or capacity. In our opinion,Southwest is extremely well positioned relativeto its peers. We believe that Southwest will re-main profitable in 2007 and 2008 and willoutperform the industry financially over thenext few years.
Standard & Poor’s believes that the low-cost carriers are likely to continue to growrevenues at a much faster rate than the lega-cy carriers. Eventually, such carriers couldtake the lion’s share of the US air travel mar-ket, though such a shift would likely play outover many years.
Labor costs down sharply, but still too high
Standard & Poor’s estimated that laborcosts absorbed 24.5% of revenues at the 10largest US airlines in 2006, down from28.2% in 2005. While many of the majorairlines have succeeded in getting their workforces to give back a substantial portion oftheir wages, this percentage must come downfurther for the industry to return to sustain-able financial health. Pension and healthcarecosts, which have increased sharply in recentyears, are major contributors to the high per-centage of revenues absorbed by labor costs,and have partly offset increases in productiv-ity and pay cuts at many of the carriers.
We estimate that labor costs will experi-ence healthy declines in 2007, both on an ab-solute basis and as a percentage of revenues.We base this prediction largely on our expec-tation of wage and benefit cuts at Northwestand Delta, as well as likely lower pensioncosts on average, as a rise in the stock mar-ket could help underfunded pension plans.Higher interest rates, which we also expect,could allow airlines to raise their pension re-turn assumptions, thus decreasing theamount of pension underfunding (thoughthis will of course be partly offset by higherinterest expense at many airlines). In addi-tion, an increase in industry revenues shouldhelp lower labor costs as a percentage of rev-
enues. Finally, we expect continued pressureby most carriers on labor costs, both interms of absolute pay levels and through at-tempts to increase employee productivity.
For 2008, Standard & Poor’s thinks theindustry will need to see higher average faresand strong passenger travel to help laborcosts fall as a percentage of total revenues.We believe much of the benefit of airlinebankruptcies to be in place and see somepressure on rates as unions attempt to regainsome of what they lost in wages and benefitsover the past five years.
Pressure to “go green”
Recently, some environmental activistshave voiced displeasure over the carbondioxide emissions (“carbon footprint”) ofairlines. This issue, in the face of the ongoingdebate on how to fight global warming,could become a public relations problem foran industry that scarcely needs another issue.
Airlines are currently fighting the percep-tion that they are a major cause of green-house gasses by listing all the ways they havereduced jet fuel usage over the past 10 years:modernizing their fleets to more fuel efficientplanes, efforts to control fuel use, and modi-fications to existing planes to increase fuelefficiency, to name a few. Though the airlinesmay have undertaken these initiatives to cutcosts in the wake of high oil prices, they areusing their accomplishments as a way to easeconcerns. However, Standard & Poor’s feelsthat this issue is only starting to gain atten-tion in the industry, and we expect airlines toface increasing pressure on this front overthe next few years. ■
As of January 2007, the US commercial avia-tion industry consisted of 20 major air carri-ers (annual revenues of more than $1billion), 33 national airlines (revenues be-tween $100 million and $999 million), 31large and medium regionals (annual operat-ing revenues less than $100 million), and 55small commuter and other air carriers, ac-cording to the Air Transport Association(ATA), an industry group whose members in-clude most of the large US airlines and aircargo companies. The Federal Aviation Ad-ministration (FAA) estimates that the totalnumber of aircraft in the US commercialfleet, including regional carriers, was 7,626at the end of 2006. This includes 3,886mainline air carrier passenger aircraft (jetswith more than 90 seats), 997 mainline aircarrier cargo aircraft, and 2,743 regional air-craft (smaller jets, turboprops, and pistons).
Based on carrier revenues, the largest do-mestic airline in 2006 was American Airlines,a unit of AMR Corp., which is also the largest
carrier in the world. American reported rev-enues for 2006 of $22.6 billion (which includ-ed its American Eagle unit). United Airlines, aunit of UAL Corp., took second place withrevenues of $19.3 billion. Delta Air Lines Inc.was in third place with $17.2 billion.
According to the US Department ofTransportation (DOT), the US airline indus-try (the majors, nationals, and regionals)generated total revenues of $163.8 billionin 2006, up 8.3% from $151.25 billion in2005. In terms of traffic, DOT statisticsshow that the US airline industry logged arecord 797.4 billion revenue passenger-miles(RPMs, the number of passengers multipliedby the number of miles flown) in 2006, sur-passing by 2.4% the prior year’s record of779.0 billion. Also setting records in 2006were enplanements (the total number of pas-sengers) at 744.5 billion and available seat-miles at 1,006.4 billion. Enplanements rose0.8% over 2005, while available seat-miles(ASMs, the number of seats in the active fleetmultiplied by the number of miles flown)were 0.3% higher than the prior year. Ameri-can (excluding its regional affiliates) tallied139.5 billion RPMs in 2006, followed byUnited with 117.5 billion RPMs and Deltawith 116.1 billion RPMs.
While the US industry has incurred theheaviest losses in recent years, airlinesaround the world have also faced a difficultenvironment. In 2006, the global airline in-dustry lost an estimated $500 million, asharp reduction from $6.0 billion in losses in2005 and a loss of $4.8 billion in 2004, ac-cording to the International Air TransportAssociation (IATA), a coalition made up ofsome 260 airlines throughout the world.From 2001 to 2003, the industry lost an esti-mated $37.6 billion, including a record lossof $18 billion in 2001, according to theIATA. For 2007, the IATA estimated on Sep-tember 17, 2007, that the industry wouldpost a profit of $5.6 billion.
INDUSTRY PROFILE
Airlines still face extreme challenges
NO
VEM
BER
22,
200
7 /
AIR
LIN
ES I
ND
US
TRY
SU
RV
EY
9
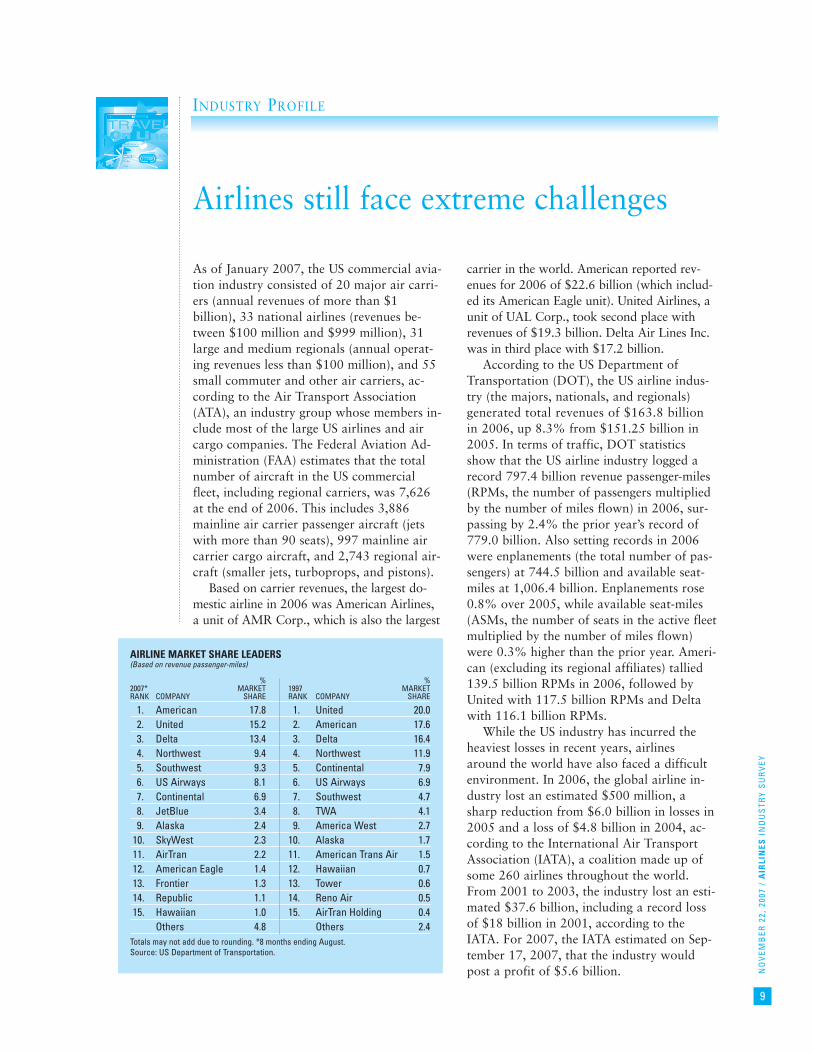
AIRLINE MARKET SHARE LEADERS(Based on revenue passenger-miles)
% % 2007* MARKET 1997 MARKETRANK COMPANY SHARE RANK COMPANY SHARE
1. American 17.8 1. United 20.0 2. United 15.2 2. American 17.6 3. Delta 13.4 3. Delta 16.4 4. Northwest 9.4 4. Northwest 11.9 5. Southwest 9.3 5. Continental 7.9 6. US Airways 8.1 6. US Airways 6.9 7. Continental 6.9 7. Southwest 4.7 8. JetBlue 3.4 8. TWA 4.1 9. Alaska 2.4 9. America West 2.7
10. SkyWest 2.3 10. Alaska 1.7 11. AirTran 2.2 11. American Trans Air 1.5 12. American Eagle 1.4 12. Hawaiian 0.7 13. Frontier 1.3 13. Tower 0.6 14. Republic 1.1 14. Reno Air 0.5 15. Hawaiian 1.0 15. AirTran Holding 0.4
Others 4.8 Others 2.4 Totals may not add due to rounding. *8 months ending August.Source: US Department of Transportation.
NO
VEM
BER
22,
200
7 /
AIR
LIN
ES I
ND
US
TRY
SU
RV
EY
10
INDUSTRY TRENDS
The US airline industry’s operating envi-ronment has finally recovered from five yearsof multibillion-dollar losses that began afterthe events of September 11, 2001, when fourUS commercial jetliners were hijacked for usein terrorist attacks on America. Passengerrevenues and passenger traffic have recov-ered from the sustained industry downturn,and the US industry returned to profitabilityin 2006. The impact of the high level of sus-tained losses on the US airline industry, alongwith the changes necessitated in how an air-line operates in the wake of 9/11, have hadlingering effects on the US airline industry. Inthe past, economic downturns have led tolarge industry losses, but none of those peri-ods posed as severe a threat to the industry’ssurvival as did the aftermath of the 9/11 at-tacks. In addition to the near-term disruptionto revenues and the large industry losses, theindustry has faced longer-term problems, in-cluding a liquidity crunch and a severelyweakened financial condition.
The impact of five years of multibillion-dollar losses
In the first few months after September2001, air travel dropped off dramatically. Asthe airlines’ losses mounted and availablecash was rapidly depleted, most carriers wereforced to shoulder new debt by tapping theircredit lines and/or issuing bonds. These ac-tions were vital to help the carriers survivethe dramatic decline in passenger levels andfares, as well as the sharp increase in losses,but they left most of the major airlines bur-dened with huge debt loads. Five years ofmultibillion-dollar losses led to the bankrupt-cy of five of the 10 largest major airlines andan increased debt burden for many of theothers.
The higher interest expense and the lowerinterest and investment income that resultedweakened the airlines’ earnings power. In ad-dition, weakened balance sheets limited car-riers’ ability to increase capital expenditures,add to their networks, and survive anotherdownturn. Thus, the effects of the recent fi-nancial deterioration are still playing out.One side effect of this has been the carriers’insistence on carrying sharply higher cashlevels than at anytime in the past in order to
allow it to survive any future shocks to thesystem. For example, AMR Corp. had a cashbalance of $5.9 billion, including restrictedcash, at the end of the second quarter of2007, versus cash levels of $1.3 billion at theend of the second quarter of 2001. Similarly,Continental Airlines had second quarter2007 cash levels of $3.2 billion, including re-stricted cash, versus $1.0 billion at the end ofthe second quarter of 2001.
Today, when investors are increasinglyworried about balance sheet stability afterthe collapse of such companies as EnronCorp., WorldCom Inc., and others, many air-lines have extremely high debt levels. For ex-ample, AMR Corp., parent company ofAmerican Airlines, ended 2006 with totaldebt (including current maturities) of $18.4billion and negative stockholders’ equity of$606 million. Delta Air Lines Inc. ended2004 with debt of $13.9 billion and a nega-tive stockholders’ equity of $5.8 billion; thecompany subsequently filed for bankruptcyon September 14, 2005. Before it filed forbankruptcy, Northwest Airlines Corp. alsohad negative stockholders’ equity. In con-trast, Southwest Airlines Co. — which Stan-dard & Poor’s believes has the healthiestbalance sheet among all US airlines — had$1.7 billion in debt (including current matu-rities) and $6.4 billion in stockholders’ equi-ty at year-end 2006, for a debt-to-totalcapital ratio of 21% (excluding operatingleases).
Airlines struggle to survive
In today’s environment, the legacy majorcarriers face intense pressure to changecost structures and operational strategies.Delta and Northwest both filed for bank-ruptcy in September 2005. Delta emerged onApril 30, 2007, and Northwest emerged on May 31, 2007. UAL Corp., the parentcompany of United Airlines, filed for bank-ruptcy in December 2002, marking thelargest bankruptcy filing in the history of theUS aviation industry. UAL emerged frombankruptcy in February 2006. UAL was thesecond major US airline company to file forChapter 11 protection in 2002, following USAirways Group Inc. US Airways subsequent-ly emerged from bankruptcy, reentered it,and finally emerged again in September2005, after merging with America West
NO
VEM
BER
22,
200
7 /
AIR
LIN
ES I
ND
US
TRY
SU
RV
EY
11
Holdings Corp. ATA Holdings Corp., parentof ATA Airlines (the tenth largest US airlineat the time), filed for bankruptcy protectionin October 2004; the company emerged frombankruptcy in February 2006. (See the “Cur-rent Environment” section of this Survey forfurther discussion of this topic.)
Federal grants, loan guarantees bailed out industry
After fierce lobbying by the airline indus-try, which contended that costs of the war inIraq and government-mandated security mea-sures were harming the industry, PresidentGeorge W. Bush signed the EmergencyWartime Supplemental Appropriations Act onApril 16, 2003. Under the law, the Trans-portation Security Administration (TSA) dis-bursed pretax payments totaling $2.29 billionin May 2003. This money was intended to re-imburse carriers for the security fees that theyhad paid to the TSA since February 2002.Congress set aside an additional $100 millionto compensate airlines for reinforcing airlinecockpit doors. Because of the cash grants,most of the top 10 carriers reported a profitin the second quarter of 2003 and were ableto sharply curtail net losses for the full year.
The cash grants in May 2003 representedthe second round of bailouts to the airline in-dustry. On September 22, 2001, PresidentBush signed into law the Air TransportationSafety and System Stabilization Act, whichwas intended to compensate the airlines fordirect and indirect losses associated with theterrorist attacks in September 2001. Includedin the plan was $5 billion in direct cashgrants to be distributed to carriers based ontraffic and the possible granting of $10 bil-lion in industry loan guarantees.
Will merger activity pick up?The merger in September 2005 of bank-
rupt US Airways with America West Hold-ings Corp., which created the new USAirways, could have been the start of a newfocus on mergers in the US airline industry.However, US Airways’ subsequent attempt tomerge with Delta Air Lines was blocked byDelta, which successfully argued to its credi-tors that Delta’s own standalone plan wouldcreate more value for creditors and otherstakeholders. (See the “Current Environ-ment” section of this Survey for further dis-cussion of this topic.)
Before the US Airways merger, there hadbeen no significant merger and acquisitionactivity in the US airline industry since theUS Department of Justice (DOJ) blocked theproposed combination of US Airways andUnited Airlines in July 2001. That deal wasblocked because the DOJ felt it would havegiven United too large a share in too manymarkets. Both carriers eventually ended up inbankruptcy court.
Standard & Poor’s thinks that the mergerof America West and US Airways, in con-junction with the increase of private equityleveraged buyout deals in the US over thepast two years, is likely to have led to in-creased interest in potential mergers in theairline industry. Whether this translates intoany actual consolidation, however, remainsto be seen. The industry’s overcapacity, com-bined with many carriers’ weakened balancesheets and high debt levels, remain as signifi-cant barriers to major airline mergers.
Indeed, many of the carriers that wouldtraditionally do the acquiring are not in aposition to finance mergers. We expect thelargest carriers to continue to shrink capaci-ty, conserve cash, and try to restore prof-itability before chasing market share gains.Still, we no longer think it is out of the ques-tion for one of the smaller carriers to besnapped up by Southwest or another lower-cost carrier with the financial resources tomake a deal. We also think a combination ofmajor airlines that includes one of the carri-ers in bankruptcy, or one that recentlyemerged from bankruptcy, like UAL Corp., isa possibility.
US Airways merger with America West creates the fifth largest US carrier
On September 27, 2005, US Airways,then the seventh largest US carrier, completedits merger with America West Holdings, theparent company of America West Airlines(eighth largest). America West was the sur-viving company in the merger, but it adoptedthe corporate name US Airways Group Inc.
The combined company, now the fifthlargest US airline, started out with about$2.5 billion in cash, 38,000 employees, and anetwork that offers about 2,700 flights, serv-ing 233 destinations from major hubs inPhoenix, Charlotte, and Philadelphia, withsecondary hubs in Las Vegas, Pittsburgh,Boston, New York (LaGuardia), and Wash-
NO
VEM
BER
22,
200
7 /
AIR
LIN
ES I
ND
US
TRY
SU
RV
EY
12
ington, D.C. (Reagan National). Under Fed-eral Aviation Administration safety and otherregulations, the two companies have contin-ued to fly separately (for a period of abouttwo years), but they immediately combinedscheduling and other operations.
Standard & Poor’s thinks that the mergerhas been a success, as the new US Airways hassharply cut costs and has achieved many of itsrevenue and cost synergy targets. We think thecombined carrier is financially stronger theneither carrier was on a standalone basis, andit should be better equipped to handle thenext industry downturn, when it occurs.
In our view, it is favorable that the mergercombined a carrier with too much of its routenetwork locked on the East Coast (US Air-ways) with a highly West Coast–centric airline(America West) to form an airline with a
more diversified geographic footprint acrossthe United States. In addition, US Airways, inbankruptcy, had already done a lot of thehard work of cutting costs and eliminating itspension plan; as a result, its overall cost struc-ture was close to that of America West. Final-ly, the merger attracted more capital — bothnew equity and new debt financing — thanthe company had expected.
US Airways originally filed for bankrupt-cy protection on August 11, 2002, despitehaving gained concessions from its workforce and conditional approval of a loanguarantee of $900 million from the AirTransportation Stabilization Board (ATSB).After emerging from that bankruptcy filingon March 18, 2003, the carrier continued tohave a higher cost structure than its peers,and it experienced large losses. External fac-
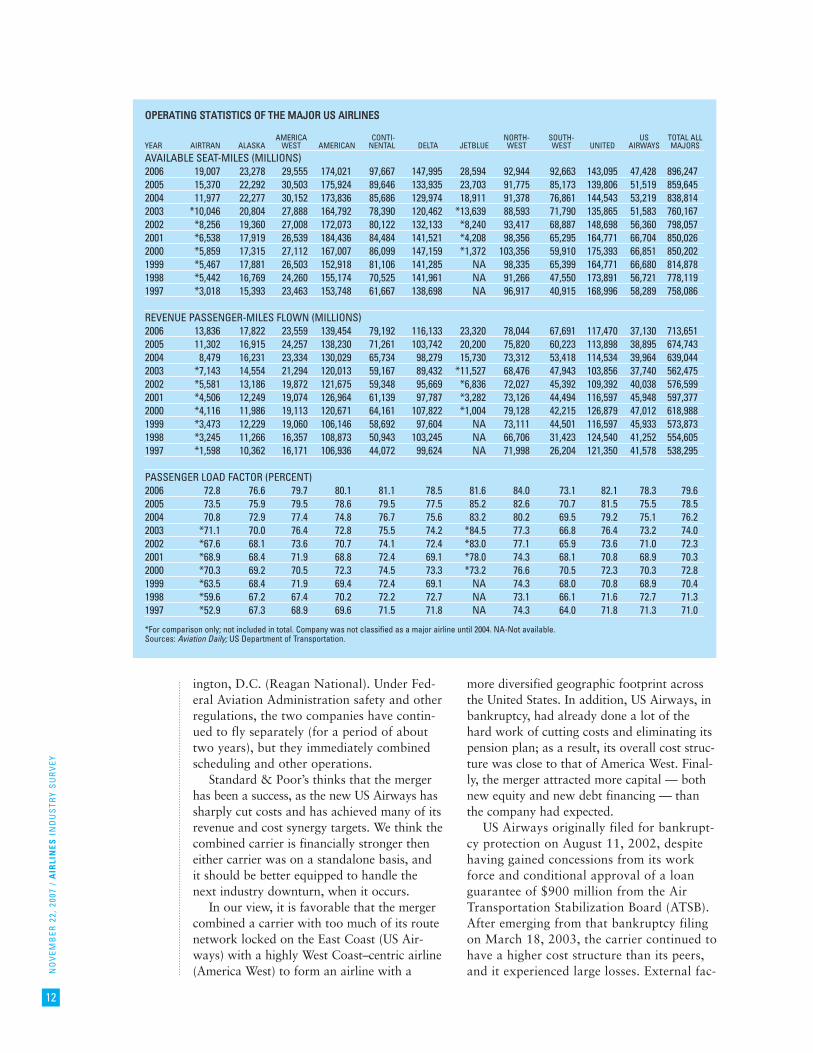
OOPPEERRAATTIINNGG SSTTAATTIISSTTIICCSS OOFF TTHHEE MMAAJJOORR UUSS AAIIRRLLIINNEESS
AMERICA CONTI- NORTH- SOUTH- US TOTAL ALL YEAR AIRTRAN ALASKA WEST AMERICAN NENTAL DELTA JETBLUE WEST WEST UNITED AIRWAYS MAJORS
AVAILABLE SEAT-MILES (MILLIONS)2006 19,007 23,278 29,555 174,021 97,667 147,995 28,594 92,944 92,663 143,095 47,428 896,247 2005 15,370 22,292 30,503 175,924 89,646 133,935 23,703 91,775 85,173 139,806 51,519 859,645 2004 11,977 22,277 30,152 173,836 85,686 129,974 18,911 91,378 76,861 144,543 53,219 838,814 2003 *10,046 20,804 27,888 164,792 78,390 120,462 *13,639 88,593 71,790 135,865 51,583 760,167 2002 *8,256 19,360 27,008 172,073 80,122 132,133 *8,240 93,417 68,887 148,698 56,360 798,057 2001 *6,538 17,919 26,539 184,436 84,484 141,521 *4,208 98,356 65,295 164,771 66,704 850,026 2000 *5,859 17,315 27,112 167,007 86,099 147,159 *1,372 103,356 59,910 175,393 66,851 850,202 1999 *5,467 17,881 26,503 152,918 81,106 141,285 NA 98,335 65,399 164,771 66,680 814,878 1998 *5,442 16,769 24,260 155,174 70,525 141,961 NA 91,266 47,550 173,891 56,721 778,119 1997 *3,018 15,393 23,463 153,748 61,667 138,698 NA 96,917 40,915 168,996 58,289 758,086
REVENUE PASSENGER-MILES FLOWN (MILLIONS)2006 13,836 17,822 23,559 139,454 79,192 116,133 23,320 78,044 67,691 117,470 37,130 713,651 2005 11,302 16,915 24,257 138,230 71,261 103,742 20,200 75,820 60,223 113,898 38,895 674,743 2004 8,479 16,231 23,334 130,029 65,734 98,279 15,730 73,312 53,418 114,534 39,964 639,044 2003 *7,143 14,554 21,294 120,013 59,167 89,432 *11,527 68,476 47,943 103,856 37,740 562,475 2002 *5,581 13,186 19,872 121,675 59,348 95,669 *6,836 72,027 45,392 109,392 40,038 576,599 2001 *4,506 12,249 19,074 126,964 61,139 97,787 *3,282 73,126 44,494 116,597 45,948 597,377 2000 *4,116 11,986 19,113 120,671 64,161 107,822 *1,004 79,128 42,215 126,879 47,012 618,988 1999 *3,473 12,229 19,060 106,146 58,692 97,604 NA 73,111 44,501 116,597 45,933 573,873 1998 *3,245 11,266 16,357 108,873 50,943 103,245 NA 66,706 31,423 124,540 41,252 554,605 1997 *1,598 10,362 16,171 106,936 44,072 99,624 NA 71,998 26,204 121,350 41,578 538,295
PASSENGER LOAD FACTOR (PERCENT)2006 72.8 76.6 79.7 80.1 81.1 78.5 81.6 84.0 73.1 82.1 78.3 79.6 2005 73.5 75.9 79.5 78.6 79.5 77.5 85.2 82.6 70.7 81.5 75.5 78.5 2004 70.8 72.9 77.4 74.8 76.7 75.6 83.2 80.2 69.5 79.2 75.1 76.2 2003 *71.1 70.0 76.4 72.8 75.5 74.2 *84.5 77.3 66.8 76.4 73.2 74.0 2002 *67.6 68.1 73.6 70.7 74.1 72.4 *83.0 77.1 65.9 73.6 71.0 72.3 2001 *68.9 68.4 71.9 68.8 72.4 69.1 *78.0 74.3 68.1 70.8 68.9 70.3 2000 *70.3 69.2 70.5 72.3 74.5 73.3 *73.2 76.6 70.5 72.3 70.3 72.8 1999 *63.5 68.4 71.9 69.4 72.4 69.1 NA 74.3 68.0 70.8 68.9 70.4 1998 *59.6 67.2 67.4 70.2 72.2 72.7 NA 73.1 66.1 71.6 72.7 71.3 1997 *52.9 67.3 68.9 69.6 71.5 71.8 NA 74.3 64.0 71.8 71.3 71.0
*For comparison only; not included in total. Company was not classified as a major airline until 2004. NA-Not available.Sources: Aviation Daily; US Department of Transportation.
NO
VEM
BER
22,
200
7 /
AIR
LIN
ES I
ND
US
TRY
SU
RV
EY
13
tors exacerbated the company’s difficulties:the industry environment worsened further,with high oil prices, overcapacity, and de-pressed airfares. On September 14, 2004,US Airways filed for bankruptcy for thesecond time in three years, where it stayeduntil the merger with America West wascompleted.
Security costs rise
Since the terrorist strikes in 2001, a num-ber of federally mandated security measureshave been put into effect — both to reassurethe flying public and to prevent future occur-rences. Although the government has subsi-dized the added security costs and provided a$2.3 billion cash grant in 2003, the industrywill continue to bear significant ongoing se-curity costs.
Airlines are now required to either screenall bags for explosives or make sure each bagis matched to a passenger seated on thatflight. Both are time-consuming and expen-sive initiatives.
The new security measures have made flyingless convenient for travelers. The increased se-curity measures and new baggage checking re-quirements mean longer lines at airports, bothto check in and to pass through security. Mostairlines, though, have done a good job of re-ducing wait times by adding security lanes.
Start-ups: many fail, a few thrive
The US airline industry historically hasseemed to attract funding for new start-ups,even though the failure rate for these compa-nies is high. The airline business is notoriousfor profit volatility, and the problems facedby start-ups have been exacerbated in the af-termath of September 2001, as large lossesand lower traffic levels have tested their stay-ing power.
New carriers are more likely to pursueniche markets or regional service agreementsthan to go head-to-head against a major air-line, since they cannot offer the same fre-quency of flights. If start-ups offer deeplydiscounted fares, the major airlines willmatch the fares, while maintaining high fareson all noncompeting flights.
Overall, the current crop of low-fare,start-up carriers has not proven to be bettermanaged or capitalized than its predecessors.
One major exception is JetBlue AirwaysCorp., which we think is the biggest threat toindustry price stability since Southwest Air-lines entered the business in 1971. JetBlue
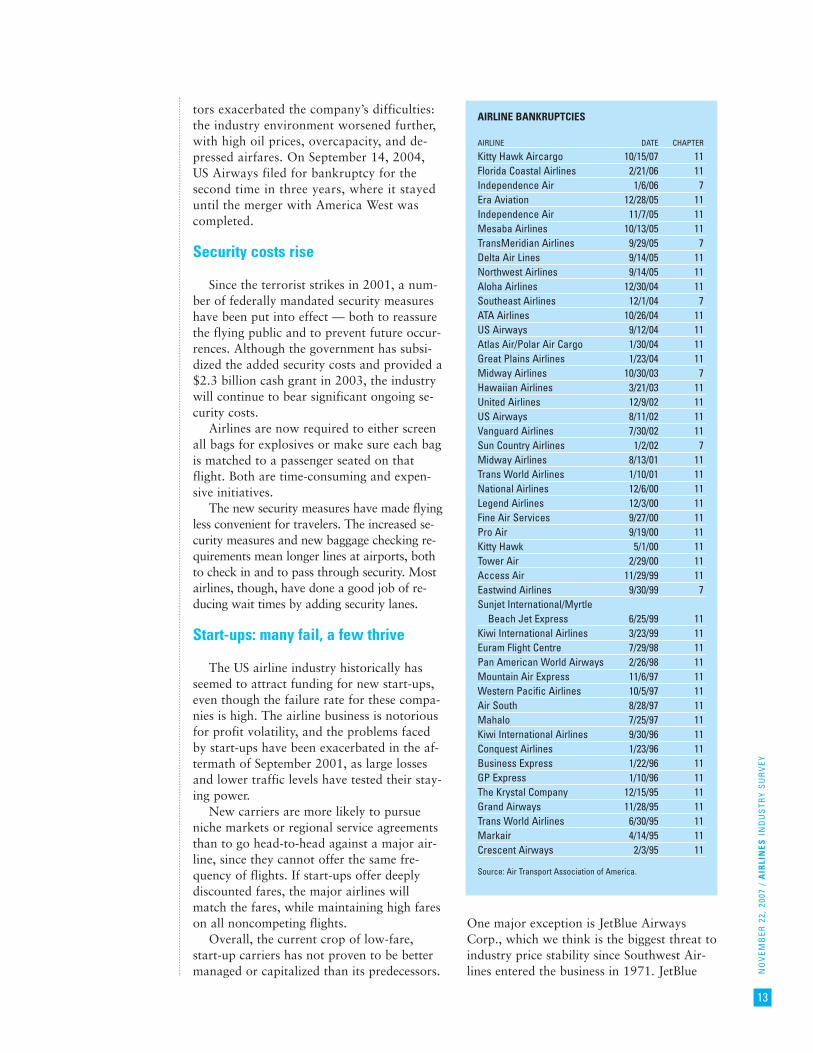
AIRLINE BANKRUPTCIES
AIRLINE DATE CHAPTER
Kitty Hawk Aircargo 10/15/07 11Florida Coastal Airlines 2/21/06 11Independence Air 1/6/06 7Era Aviation 12/28/05 11Independence Air 11/7/05 11Mesaba Airlines 10/13/05 11 TransMeridian Airlines 9/29/05 7 Delta Air Lines 9/14/05 11 Northwest Airlines 9/14/05 11 Aloha Airlines 12/30/04 11 Southeast Airlines 12/1/04 7 ATA Airlines 10/26/04 11 US Airways 9/12/04 11 Atlas Air/Polar Air Cargo 1/30/04 11 Great Plains Airlines 1/23/04 11 Midway Airlines 10/30/03 7 Hawaiian Airlines 3/21/03 11 United Airlines 12/9/02 11 US Airways 8/11/02 11 Vanguard Airlines 7/30/02 11 Sun Country Airlines 1/2/02 7 Midway Airlines 8/13/01 11 Trans World Airlines 1/10/01 11 National Airlines 12/6/00 11 Legend Airlines 12/3/00 11 Fine Air Services 9/27/00 11 Pro Air 9/19/00 11 Kitty Hawk 5/1/00 11 Tower Air 2/29/00 11 Access Air 11/29/99 11 Eastwind Airlines 9/30/99 7 Sunjet International/Myrtle
Beach Jet Express 6/25/99 11 Kiwi International Airlines 3/23/99 11 Euram Flight Centre 7/29/98 11 Pan American World Airways 2/26/98 11 Mountain Air Express 11/6/97 11 Western Pacific Airlines 10/5/97 11 Air South 8/28/97 11 Mahalo 7/25/97 11 Kiwi International Airlines 9/30/96 11 Conquest Airlines 1/23/96 11 Business Express 1/22/96 11 GP Express 1/10/96 11 The Krystal Company 12/15/95 11 Grand Airways 11/28/95 11 Trans World Airlines 6/30/95 11 Markair 4/14/95 11 Crescent Airways 2/3/95 11
Source: Air Transport Association of America.
NO
VEM
BER
22,
200
7 /
AIR
LIN
ES I
ND
US
TRY
SU
RV
EY
14
initiated service out of New York City’s JohnF. Kennedy International Airport in February2000. The carrier is well capitalized, usesbrand-new jets, and, since its launch, hasgenerated high load factors on its point-to-point route structure. However, rising fuelprices and intense price competition led to aloss for the carrier in 2005 and 2006, thoughStandard & Poor’s predicts a modest returnto profitability for the carrier in 2007.
Recent failuresAmong recent airline failures, Indepen-
dence Airlines — a regional airline that wasoriginally a regional partner of United Air-lines before trying to compete against Unit-ed and the other majors — filed for Chapter 7liquidation on January 6, 2006, after aprevious Chapter 11 filing on November 7,2005. Mesaba Airlines, a regional airlinethat operates as a Northwest connectioncarrier, filed for bankruptcy on October 13,2005, shortly after Northwest failed tomake certain financial payments to Mesabaand announced severe cutbacks in its con-tract with the company. Transmeridian Air-lines, a small charter airline operating outof about a dozen cities, filed for Chapter 7liquidation on September 29, 2005.
Aloha Airlines filed for Chapter 11 pro-tection on December 30, 2004, but emergedon February 17, 2006. ATA Holdings, parentcompany of ATA Airlines, filed for Chapter11 protection on October 26, 2004; at thetime, ATA was the tenth largest US airline.The carrier emerged from Chapter 11 protec-tion on February 28, 2005. Hawaiian Air-lines Inc., a subsidiary of Hawaiian HoldingsInc., filed for Chapter 11 bankruptcy protec-tion on March 21, 2003; the carrier emergedfrom bankruptcy on June 2, 2005. (See the“Airline bankruptcies” table for a larger list.)
Small jets create opportunities in regional markets
Regional jets — small jet planes that flyshorter distances and have fewer seats than dolarge mainline jets — were first introduced inthe late 1980s. The first airline to embrace theregional jet was Comair Inc. (now whollyowned by Delta). Demand for these planes be-gan to take off about 1995, when Brazil’s Em-braer-Empresa Brasileira de Aeronáutica SAand Canada’s Bombardier Inc. introduced low-
cost jet planes, with 50 to 70 seats, for $15million to $20 million each.
Regional jets open new marketsThe regional jet has stimulated air travel
over shorter segments by getting people outof cars, buses, and trains and onto planes.With its low purchase price and operatingcosts, the regional jet has transformed short-haul markets, previously abandoned by ma-jor airlines, into viable destinations. Theregional jet also offers greater range and pas-senger comfort than does the turbopropplane. It can handle routes of 1,300 miles —up to 2,300 nautical miles in some cases —while most propeller planes are confined toflights of 350 miles or less.
Major airlines’ regional affiliates use thesesmall jets to provide off-peak service when de-mand is insufficient to warrant a standard100-plus seat aircraft. Regional jets can beprofitable for such service because theirbreak-even can approach a 50% level, versusa much higher load factor — historicallyabout 65%, but in the past few years, closerto 85% — needed for large jets in a normalindustry environment. By offering round-the-clock service in this manner, an airline gainsappeal among business travelers, who accountfor some 70% of regional jet passengers.
With regional jets gaining in range, theyare increasingly being used not only to feedpassengers into hub airports, but also to pro-vide point-to-point competition against carri-ers employing full-sized jets.
Regional airlines and majors have a symbiotic relationship
Given the severe financial trouble thatthe US airline industry has faced in the pastfew years, many of the major carriers havebeen forced to sell or reduce their invest-ments in regional airlines in order to raisecash. Notably, in September 2005, Deltasold its regional subsidiary, Atlantic South-east Airlines, to SkyWest Airlines in orderto raise cash. Continental Airlines Inc.gradually sold its stake in ExpressJet Hold-ings Inc., which was once wholly owned byContinental. In 2003, Northwest con-tributed the stock of one of its regional air-line subsidiaries, Pinnacle Airlines, to itspension plan to offset plan liabilities.
The relationship between the major andregional airlines is reciprocal. The majors

NO
VEM
BER
22,
200
7 /
AIR
LIN
ES I
ND
US
TRY
SU
RV
EY
15
cannot rely solely on their own expensiveaircraft and crews to gather passengers tofeed into their hubs. The regionals dependon major carriers to provide connectingflights at central hub airports for up to60% of their passengers. The major airlinesalso provide credibility, worldwide market-ing power, and the all-important designatorcode in the computer reservation system(CRS). To be successful, regional and majorairlines must work as a seamless operationusing a single system for booking andboarding.
According to the Regional Airline Associ-ation, a trade group representing smaller air-lines, about 70 regional airlines were inoperation in 2005 (latest available). BackAviation Solutions, a provider of consultingand data information services to the aviationindustry, predicts that no more than 50 re-gional carriers will exist by 2010.
At the same time, the overall number ofregional jets in operation should continue torise sharply. The Federal Aviation Adminis-tration (FAA) predicts that the US regionalaircraft fleet (both jets and turboprops) willreach 3,851 by 2017, up from 2,862 as ofDecember 31, 2005. Although many of thenew regional jets on order are intended to re-place older turboprops, the large number ofincoming jets should lead to an overall in-crease in the number of regional aircraft inservice.
Labor contracts restrict use of regional jetsAll pilot contracts have “scope” clauses,
which establish the definition (or scope) ofpilots’ jobs, and dictate who may or may notperform those jobs. Scope clauses in manyexisting labor contracts severely limit theability of some airlines to participate in theregional jet market boom. American Airlines,for instance, can fly an unlimited number ofregional jets with 45 seats or less, but can flya maximum of 67 jets with 45 to 70 seats.
Many observers see the biggest emergingsegment of the regional jet market in 70- to100-seat aircraft, which began rolling off theassembly lines in 2002. Bombardier and Em-braer are the two main manufacturers ofthese regional jets. Pilots at mainline carriers,who make substantially higher salaries thanthose at regional operators, have seen manyof their routes displaced by regional affiliatesoperating these larger jets.
Embracing the Internet...
The Internet has had a profound effect onthe way airlines price and distribute theirproduct. By selling tickets online, airlineshave dramatically cut distribution costs byeliminating paper shuffling, bypassing agents,and reducing airline staff. On the otherhand, the Internet has led to more competi-tive pricing.
Since 1995, carriers have had home pageson the World Wide Web. Initially, these sitesdisplayed schedule and fleet information, aswell as promotional material. Today, travel-ers can use these sites to check the status oftheir frequent-flyer accounts, and more im-portantly, to book flights and select seats.
Online travel operations, such as ExpediaInc., Travelocity.com LP, and Orbitz Inc.,have taken significant market share from tra-ditional travel agents. Despite the Internet’scommercial success in this market, accuratemeasurements of the amount of air travel be-ing booked online are hard to come by. Ac-cording to PhoCusWright, an independenttravel tourism and hospitality industry re-search firm, online travel sales will accountfor about 52% of all bookings in 2007, sur-passing offline bookings for the first time. In2007, according to eMarketer, an Internetmarket research and trend analysis firm, USonline travel sales will total $94 billion, ris-ing 19% over 2006.
...to help cut costsIn 1995, Alaska Airlines (a unit of Alaska
Air Group Inc.) became the first airline to al-low tickets to be booked via the Internet.Alaska booked about 39% of its tickets on itsown Web site in 2006. The company hassince been surpassed by many of its competi-tors, particularly discounters like JetBlue,whose strategy is to keep costs low throughextensive use of its own Web site and reserva-tion agents. JetBlue, which is now considereda major airline, leads all majors in bookingsover the Internet. In 2006, JetBlue booked79% of its sales on its own Web site.
Most US airlines now get a significantportion of revenues from online bookings.Southwest Airlines obtained 70% of its rev-enues from sales through its own Web site in2006. Continental Airlines, a former laggardin online bookings, got about 24% of its rev-enues in 2006 from its own Web site.
NO
VEM
BER
22,
200
7 /
AIR
LIN
ES I
ND
US
TRY
SU
RV
EY
16
The Internet’s appeal for airlines is appar-ent. A commercial Web site can be kept openfor business 24 hours a day, seven days aweek. It allows an airline to reduce the num-ber of customer service agents, since fewersuch employees are needed to answer flightinformation questions. Southwest Airlines re-ported in 2002 that its Internet bookingscost about one dollar to make, while its costto book with a travel agent was between $6and $8. Tickets booked through Southwest’sown agents cost several dollars.
Indeed, a big incentive for airlines to dis-tribute tickets via the Internet is to reducetravel agent commissions. In 2002, US air-lines cut base commission rates entirely ondomestic flights (as discussed in the “Howthe Industry Operates” section of this Sur-vey). Recent cuts in commission rates and in-creased Internet sales are the major reasonsfor the trend toward lower commission costs.
On the down side, however, the Internetmay ultimately hurt airline profitability bymaking travelers too price-sensitive. Withairfares changing at lightning speed and theInternet keeping customers apprised of thesechanges, airlines must respond quickly tomatch rivals’ fare cuts. Consequently, therange of fares that competing airlines cancharge on a point-to-point route will tend tobe extremely compressed. In addition, thepremium charged for travel booked on shortnotice has eroded. Airlines cannot use busi-ness travel as effectively to subsidize dis-counted pleasure travel, now that businesstravelers can make low-price, near-term trav-el arrangements online.
E-tickets reduce costsEver on the lookout to cut costs, airlines
have enthusiastically embraced “ticketlesstravel” — the practice of issuing electronictickets (e-tickets) to customers. E-tickets arebooked in the usual manner — online,through a travel agent, or directly throughthe airline — but no paper ticket is issued.Instead, passengers are issued an e-ticketnumber. They can print boarding passes athome, obtain boarding passes at the airportcheck-in counter, or get them from an auto-mated dispensing machine, which is activatedwith a credit card, frequent-flyer card, or e-ticket number.
According to United Airlines, electronicticketing eliminates 14 accounting and pro-
cessing procedures and thus costs just 50cents per ticket, versus $8 for paper. Much ofthe savings comes from not having to mailactual tickets. Travelers can get a receipt anditinerary via fax or e-mail, or at the airport.E-tickets are now the norm: Standard &Poor’s estimates that they accounted forabout 96% of tickets sold in 2006.
Improving serviceMany travelers appreciate the speed of air
travel. However, the process leaves much tobe desired, with long lines to check in andobtain boarding passes, and frequent delaysor cancellations of flights. Conditions wors-ened when the airlines had to instituteheightened security measures.
Technology has helped with some of theseproblems. For example, many airlines’ pas-sengers can skip the boarding pass counterby printing their own documents throughtheir personal computers. In addition, agrowing number of airlines have installedhundreds of self-service kiosks that allowpassengers to check in luggage, obtain board-ing passes, and check their frequent-flyercredits. Such kiosks have been around in oneform or another since 1995.
International markets provide growth
Particularly in light of the brutal competi-tion in the US domestic market, many USairlines see international markets as an av-enue for profitable growth. For US-based air-lines, international revenue passenger-miles(RPMs) and enplanements climbed at com-pound annual growth rates of 4.3% and2.7%, respectively, between 1993 and 2000,versus 5.3% and 4.5% growth for domestictravel. However, along with the domestic USmarket, international travel slowed after Sep-tember 11, 2001.
International enplanements declined 6.3%in 2001, then another 0.2% in 2002 and1.8% in 2003. In 2004, however, internationalenplanements increased 13.9%, breaking thedownward trend and outpacing domesticgrowth (domestic enplanements rose 4.8% thatyear). International enplanements increased9.4% in 2005 and 6.8% in 2006; in both 2005and 2006, international enplanements out-paced growth in domestic enplanements.
To compete effectively for internationaltraffic, airlines need a level playing field.

NO
VEM
BER
22,
200
7 /
AIR
LIN
ES I
ND
US
TRY
SU
RV
EY
17
This requires the enactment of “open skies”aviation treaties: bilateral agreements that re-duce economic regulation of airlines and al-low code sharing, alliances, and partialownership deals among international carri-ers. However, domestic routes in the UnitedStates and overseas remain closed to foreigncompetition. The practice of “cabotage” —the transport of passengers by a foreign car-rier for purely domestic flights — is illegal inall nations.
Since the late 1970s, the US governmenthas favored deregulation of international avi-ation markets. Because domestic carriers suf-fered heavy losses following US deregulation,the government did not pursue open skiespolicies until the early 1990s. In the past fewyears, the government has been pursuingopen skies treaties aggressively. Most no-tably, on March 23, 2007, the US signed anopen skies agreement with the EuropeanUnion; this agreement, scheduled to go intoeffect in March 2008, supersedes individualopen skies treaties with individual Europeannations. (For more details, see the “CurrentEnvironment” section of this Survey.)
The world’s first open skies pact wasreached in 1992 between the United Statesand the Netherlands. By November 2006,some 77 nations had signed agreements withthe United States. Not all of these aviationpacts provide for unfettered competition, butall move strongly in that direction, providingfor phased-in deregulation.
Global partneringInternational alliances are crucial to
achieving profits on many internationalroutes. Having a global partner that feedstraffic through a hub generates numerousbenefits. By facilitating smoother connectionsand stimulating traffic, an alliance can help acarrier to dramatically lower its costs, cutfares, and increase flight frequency, withoutrequiring substantial investment in additionalaircraft, airport facilities, or route authority.
Alliance partners realize cost savings inseveral ways: by sharing cargo and passengerterminal facilities; integrating frequent-flyerprograms; consolidating sales, maintenance,and administrative operations; combining in-formation technologies; coordinating adver-tising; and engaging in joint procurementwhere feasible. Alliances are currently struc-tured so that partners remain independent
entities, but with coordinated schedules andcombined frequent-flyer programs.
Alliances aid airlines abroadThere are currently three major global
airline alliances: Star Alliance, anchored byUnited Airlines and Deutsche LufthansaAG (which also includes US Airways);OneWorld, with American Airlines andBritish Airways PLC; and SkyTeam, withDelta, Continental, Northwest, Air France-KLM SA, and Royal Dutch Airlines. Eachalliance also involves several secondarycarriers. For now, Star remains the biggestalliance, with over 16,000 daily departuresto 855 airports as of May 2007.
HOW THE INDUSTRY OPERATES
Few inventions have had as profound aninfluence on the way people live, work, andexperience the world as the airplane. Byshortening travel time from weeks to hours,air travel has altered our concept of distance.The world has become smaller, as people canvisit and conduct business in places onceconsidered far-flung.
The transformation of the Wright broth-ers’ early twentieth-century invention from anovelty to a commercial industry requiredconsiderable technological refinements andgovernment assistance. Until the 1920s, theairplane was envisioned principally as a mili-tary tool. That view broadened in 1925,when airplanes began carrying mail. Withthe passage of the Air Commerce Act of1926, the US airport and air traffic controlinfrastructure began to take shape.
To promote the then-fledgling passengertravel industry, the Watres Act of 1930changed the airmail fee structure: fees paidto air carriers to move mail were increasedexpressly to subsidize passenger service. Fur-thering the cause of air travel was the intro-duction in the United States of the jet aircraftfor passenger service in 1958. With greaterseating capacity and faster speeds, the jetdramatically cut operating costs and thus fa-cilitated lower fares.
The industry was deregulated in 1978,freeing it from government control of fares,routes, merger and acquisition activity, andalliances. This step helped to complete thetransformation of air travel from a luxury to
NO
VEM
BER
22,
200
7 /
AIR
LIN
ES I
ND
US
TRY
SU
RV
EY
18
a mass-market service. Government involve-ment is still evident in controls over interna-tional routes, however, and the US Depart-ment of Justice (DOJ) has halted some merg-er attempts, as discussed in the “IndustryTrends” section of this Survey.
Providing transportation
Airlines today derive most of their rev-enues from the fares charged to passengers,but they also generate revenues by carryingmail and cargo, selling alcoholic beverages,and offering in-flight entertainment and ser-vices to passengers. Additionally, airlines sellfrequent-flyer credits to hotels, auto rentalagencies, credit card issuers, and other orga-nizations, which in turn offer these credits aspremiums or as a way to build goodwill.Some airlines have begun selling food tocoach customers on board the plane, replac-ing the long-time custom of supplying it free.The latest revenue-generating attempt by somecarriers has been charging an extra fee for aisleseats or exit row seats with extra legroom.
Business travelers: less willing to pay upThe airline industry has promoted the
globalization of commerce, making theworld into one big marketplace. Many busi-ness people use air travel to conduct salestrips, visit remote factories, and attend indus-try conventions. Business trips are oftenscheduled within seven days of the flight, sobusiness fares have historically been the high-est, whether for coach or first-class seats. Be-cause their firms pick up the tab, businesstravelers long tended to be relatively price-insensitive.
Business fares climbed significantly fasterthan leisure fares; in recent years, however,corporations became more cost-conscious.The economic slowdown that began in 2001led to significant cuts in corporate travel bud-gets. In addition, corporate downsizing hasleft leaner organizations, with fewer managersand executives authorized to travel. As part oftheir cost-cutting efforts, some companies aredirecting employees to travel coach or to pa-tronize low-fare carriers. To reduce travelcosts further, many companies enter into ne-gotiated travel deals, under which theypromise to do most of their travel with a cer-tain airline in exchange for sharp fare dis-counts. In addition, the rising prominence of
online ticket distribution has made it far easi-er to obtain a lower fare for travel — even onshort notice.
Airlines actively solicit the business travel-er. Many larger aircraft contain designatedbusiness sections, which offer roomier seatsand premium food service. Recently, someairlines have expanded their business-classsections. Airlines compete for business pas-sengers by offering priority check-in, expedit-ed baggage handling, luxurious airportlounges, and in-flight amenities such as fax-es, telephones, and power outlets forrecharging laptop computers. To appeal tothis class of traveler, airlines must providefrequent flights, reliable on-time perfor-mance, and top safety records.
Leisure travelers look for price breaksCompared with the business traveler, the
leisure traveler is highly price-sensitive. Thecheaper fares resulting from deregulationhave allowed people from all walks of life totravel by air to visit distant friends and rela-tives or take vacations more frequently.
Leisure travelers can secure discount faresin two ways. First, low fares are available toindividuals who book flights at least 14 daysin advance. Second, deeply discounted faresare also available, mainly via the Internet, afew days before departure. Many leisuretravelers defer making trip arrangements un-til a fare sale is offered.
The upshot of these patterns is that overshort periods, leisure travel can be erratic.Over the longer term, leisure travel is morecyclical than business travel; it waxes andwanes together with consumer sentiment anddisposable income levels.
Small world, big bucksInternational travel (defined here as
flights between the United States and a sec-ond nation) encompasses both business andleisure travel. In 2006, international travelaccounted for 9.8% of enplanements for USairlines, versus 9.2% in 2005, according tothe US Department of Transportation. Be-cause the average stage (or flight) length isnearly four times longer for internationalthan for domestic flights, international trav-el generates a disproportionately high levelof revenue passenger-miles: 26.6% of totalrevenue passenger-miles in 2006, comparedwith 25.6% in 2005.
NO
VEM
BER
22,
200
7 /
AIR
LIN
ES I
ND
US
TRY
SU
RV
EY
19
Cargo and cocktailsAll passenger aircraft are capable of carry-
ing cargo, but most freight moves on wide-body jets on long stage lengths. Major airlinescarry significantly more mail and cargo in thebelly space under the passenger cabin than doregional and commuter airlines.
Passenger airlines view freight transport asa sideline to their main business. They garnerfreight business by offering discounted ratescompared with those charged by specializedair freight carriers, and do not rely on largesales forces to pursue this business. Airlinesoften accept freight from only a few air for-warders.
Among passenger airlines, NorthwestAirlines Corp. generated the most revenuefrom cargo in 2006: $946 million, or 7.5%of its revenues that year. In second placewas AMR Corp. with $827 million (3.7%).For the 10 largest US airlines, cargo andmail together accounted for just 3.4% oftotal revenues in 2006. In addition, airlinesgenerate revenues from the sale of in-flightalcoholic beverages and various amenitiesand services, accounted for as “other rev-enue.” This category may also include in-come from international code-sharingprograms. On long-haul flights, most carri-ers provide telephone, automated tellermachine (ATM), fax, and television and en-tertainment services for a fee. Some interna-tional flights even offer video gambling.Although such supplementary sales carryhigh margins, they account for a relativelysmall portion of industry revenues.
Industry structure
The airline industry is an imperfect oli-gopoly. A few carriers dominate long-haulpassenger traffic, while several dozen smallcarriers compete for short-haul flights.
Size categoriesThe US Department of Transportation
(DOT) classifies airlines as major, national, orregional carriers, according to revenue base.
◆ Major airlines. To be classified as a ma-jor airline, a carrier must have annual rev-enues of more than $1 billion. Major airlinestypically operate jet aircraft that have 130 to450 seats and average stage lengths of about1,000 miles. The large aircraft used for inter-
national flights can travel 5,000 miles beforerefueling.
◆ National airlines. Carriers whose rev-enues fall between $100 million and $1 bil-lion are classified as national airlines. Despitethis designation, some of these carriers limittheir service to regional markets, while oth-ers offer international service. Their aircraft,with about 100 to 150 seats, are usuallysmaller than those of the majors. Nationalcarriers may operate more short-haul flightsthan the majors do; they typically specializein point-to-point service.
◆ Regional airlines. Regional airlines(those with revenues of less than $100 mil-lion) comprise two distinct types of carrier:short-haul/commuter airlines and start-ups.
Commuter airlines primarily serve low-density, short-haul markets that are, strictlyspeaking, regional in scope. Their averagestage length is about 245 miles, but they of-ten provide point-to-point service for flightsof up to 400 miles.
Most commuter airlines are partners withmajor airlines, sharing the majors’ gate spaceat hub airports and their computer reserva-tion system (CRS) codes. They shuttle pas-sengers to and from the secondary cities onmajor airlines’ hub-and-spoke systems, some-times using turboprop aircraft that seat 20 to40 persons (though they have recently begunusing jets with up to 100 seats). A few smallcommuter airlines, however, operate indepen-dently of the majors and provide service onlow-density rural routes.
Start-up carriers often are classified asregional airlines based on their revenues.With an average stage length of 400 to 600miles, they may initially serve a single re-gion, although their ultimate goal is typical-ly to offer broad coverage. Indeed, fewstart-ups stay in the regional category forlong; either they quickly grow into the na-tional and/or major classification, as didAirTran Holdings Inc. and JetBlue AirwaysCorp., or they fail.
Start-up airlines often either cannot obtainor cannot afford gate space during peakbusiness travel hours at the major airlines’hub airports — a significant disadvantage.Moreover, even if they do get the space, thebig carriers frequently match their discount-ed fares. Consequently, successful start-up
NO
VEM
BER
22,
200
7 /
AIR
LIN
ES I
ND
US
TRY
SU
RV
EY
20
airlines have chosen to fill niche marketsoverlooked by the larger carriers.
Charter airlinesCharter or unscheduled service is another
form of airline operation. It consists of trans-porting passengers on call — an irregularservice like that of a taxicab. Charter serviceis popular with tour operators, the military,and professional sports teams. Major airlinessometimes book charter space on other air-lines when they have a capacity shortfall.
Most airlines provide some charter ser-vice, but only a few specialize in this line;those that do may be classified as major, na-tional, or regional carriers. Charters’ aircrafttypes and stage lengths are similar to thoseof other airlines.
Two-tier operatorsA relatively new breed of airline is the
two-tier operator. Typically, these carriers aremajor airlines that service long-haul marketsvia a hub-and-spoke system, but which alsooperate a fully independent, point-to-pointair service in the discount excursion market.Most routes served by low-fare affiliates areshorter haul and consequently use smaller ca-pacity aircraft. These affiliates also typicallyoperate with separate wage scales.
Some examples are AMR Corp.’s Ameri-can Eagle and Continental Airlines Inc.’sContinental Express. Delta Air Lines Inc. dis-continued its own Delta Express service andnow operates through a network of regionalaffiliates operating under the Delta Expressname. In 2003, Delta launched a new low-fare service named Song, in an attempt tocompete with JetBlue and other discount car-riers that had been gaining market share. Aspart of its restructuring in bankruptcy, Deltadiscontinued Song service in May 2006.
Competitors on all sides
Airlines confront a variety of competitors.In some markets, major airlines face compe-tition from other majors, and from nationaland regional airlines as well. All airlinescompete with other transportation modes,such as automobiles, railroads, and buses.
Before 1978, the Civil Aeronautics Boardregulated the fares that airlines could chargeand which routes they could fly, severely lim-iting new entrants into the industry. Following
deregulation in 1978, competition in the air-line industry intensified. As regulatory barriersto entry were dismantled and risk capitalpoured in, established carriers faced an un-ending parade of aggressive start-up airlinesthat targeted the larger carriers’ high-marginbusiness. In recent years, competitive pres-sures have eased as risk capital has becomescarcer for start-ups and as established carri-ers have limited their geographic horizons.
The automobile is the airline industry’schief competitor. For short trips, airline trav-el is neither practical nor economical. Forlong distances, however, travelers prefer fly-ing to driving.
Airlines face competition from intercityrailroads (specifically Amtrak), which havefares that have been partly subsidized by theUS government. While Amtrak operatessome long-distance routes, its passengers useit for an average journey length of about 280miles. Intercity bus travel, although muchmore popular than railroads, rarely competesdirectly with air travel, because the typicalbus journey is just 140 miles.
Airlines compete with each other on bothservice and price. For business travelers, thefrequency and reliability of flights are criticalfactors; frequent-flyer programs, cuisine, andother amenities are also influential. Small air-lines that cannot obtain gate space duringpeak travel periods have difficulty attractingbusiness travelers.
Service information is disseminated by theDOT’s Office of Consumer Affairs, whicheach month reports the on-time performancefor the larger airlines. The DOT also collectsand disseminates information about airlines’performance in baggage handling, passengerbumping, and overall complaint record statis-tics that can influence business travelers’ carri-er selection. Such reports have less effect onleisure travelers; aside from the few first-classnonbusiness passengers, price is the leisuretraveler’s main criterion for carrier selection.
To differentiate themselves from theircompetitors, airlines may strive to buildbrand loyalty through frequent-flyer pro-grams. Targeting mainly business travelers,frequent-flyer programs let travelers chalk upbonus miles by booking flights or by con-ducting business with other organizationsthat have tie-ins with the airlines. Bonusmiles can be redeemed for free air tickets orservice upgrades. Frequent-flyer programs
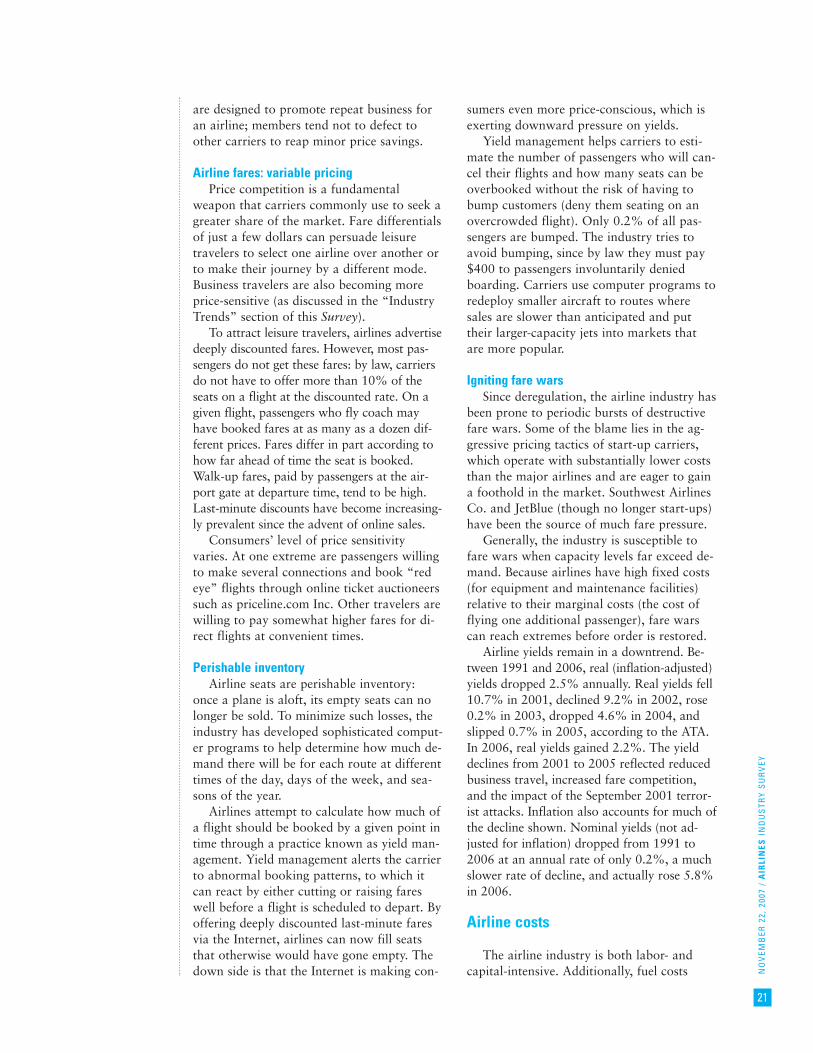
NO
VEM
BER
22,
200
7 /
AIR
LIN
ES I
ND
US
TRY
SU
RV
EY
21
are designed to promote repeat business foran airline; members tend not to defect toother carriers to reap minor price savings.
Airline fares: variable pricingPrice competition is a fundamental
weapon that carriers commonly use to seek agreater share of the market. Fare differentialsof just a few dollars can persuade leisuretravelers to select one airline over another orto make their journey by a different mode.Business travelers are also becoming moreprice-sensitive (as discussed in the “IndustryTrends” section of this Survey).
To attract leisure travelers, airlines advertisedeeply discounted fares. However, most pas-sengers do not get these fares: by law, carriersdo not have to offer more than 10% of theseats on a flight at the discounted rate. On agiven flight, passengers who fly coach mayhave booked fares at as many as a dozen dif-ferent prices. Fares differ in part according tohow far ahead of time the seat is booked.Walk-up fares, paid by passengers at the air-port gate at departure time, tend to be high.Last-minute discounts have become increasing-ly prevalent since the advent of online sales.
Consumers’ level of price sensitivityvaries. At one extreme are passengers willingto make several connections and book “redeye” flights through online ticket auctioneerssuch as priceline.com Inc. Other travelers arewilling to pay somewhat higher fares for di-rect flights at convenient times.
Perishable inventoryAirline seats are perishable inventory:
once a plane is aloft, its empty seats can nolonger be sold. To minimize such losses, theindustry has developed sophisticated comput-er programs to help determine how much de-mand there will be for each route at differenttimes of the day, days of the week, and sea-sons of the year.
Airlines attempt to calculate how much ofa flight should be booked by a given point intime through a practice known as yield man-agement. Yield management alerts the carrierto abnormal booking patterns, to which itcan react by either cutting or raising fareswell before a flight is scheduled to depart. Byoffering deeply discounted last-minute faresvia the Internet, airlines can now fill seatsthat otherwise would have gone empty. Thedown side is that the Internet is making con-
sumers even more price-conscious, which isexerting downward pressure on yields.
Yield management helps carriers to esti-mate the number of passengers who will can-cel their flights and how many seats can beoverbooked without the risk of having tobump customers (deny them seating on anovercrowded flight). Only 0.2% of all pas-sengers are bumped. The industry tries toavoid bumping, since by law they must pay$400 to passengers involuntarily deniedboarding. Carriers use computer programs toredeploy smaller aircraft to routes wheresales are slower than anticipated and puttheir larger-capacity jets into markets thatare more popular.
Igniting fare warsSince deregulation, the airline industry has
been prone to periodic bursts of destructivefare wars. Some of the blame lies in the ag-gressive pricing tactics of start-up carriers,which operate with substantially lower coststhan the major airlines and are eager to gaina foothold in the market. Southwest AirlinesCo. and JetBlue (though no longer start-ups)have been the source of much fare pressure.
Generally, the industry is susceptible tofare wars when capacity levels far exceed de-mand. Because airlines have high fixed costs(for equipment and maintenance facilities)relative to their marginal costs (the cost offlying one additional passenger), fare warscan reach extremes before order is restored.
Airline yields remain in a downtrend. Be-tween 1991 and 2006, real (inflation-adjusted)yields dropped 2.5% annually. Real yields fell10.7% in 2001, declined 9.2% in 2002, rose0.2% in 2003, dropped 4.6% in 2004, andslipped 0.7% in 2005, according to the ATA.In 2006, real yields gained 2.2%. The yielddeclines from 2001 to 2005 reflected reducedbusiness travel, increased fare competition,and the impact of the September 2001 terror-ist attacks. Inflation also accounts for much ofthe decline shown. Nominal yields (not ad-justed for inflation) dropped from 1991 to2006 at an annual rate of only 0.2%, a muchslower rate of decline, and actually rose 5.8%in 2006.
Airline costs
The airline industry is both labor- andcapital-intensive. Additionally, fuel costs
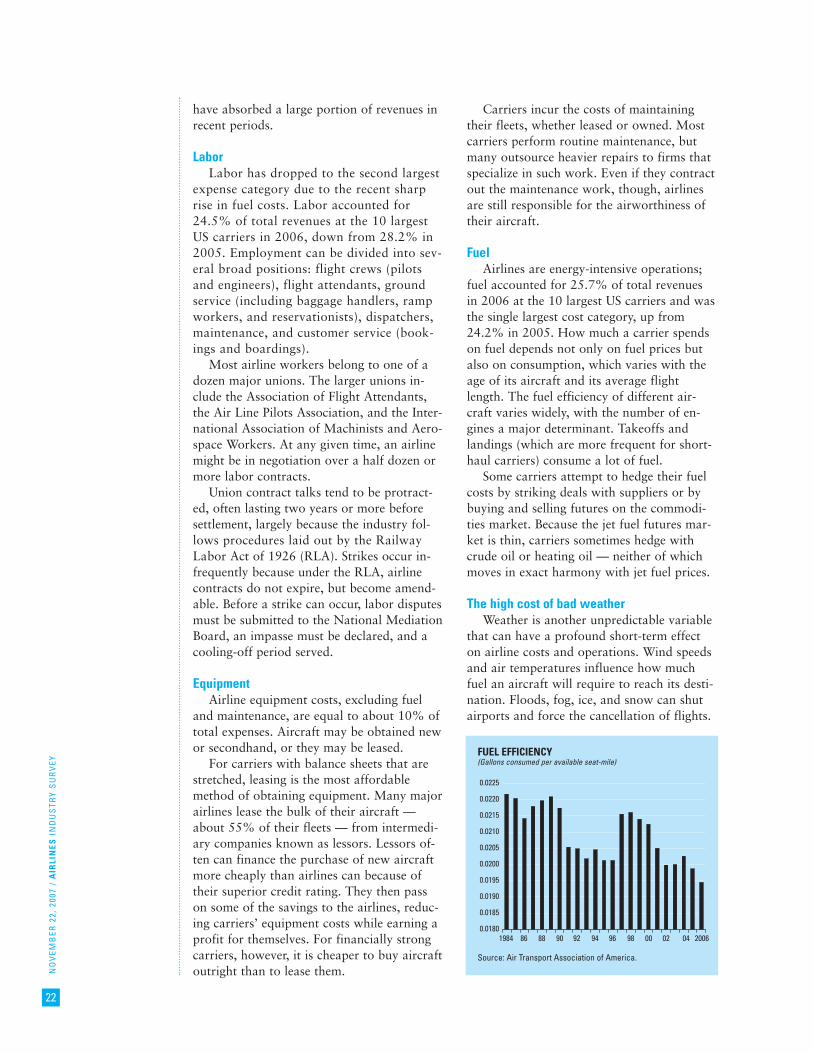
NO
VEM
BER
22,
200
7 /
AIR
LIN
ES I
ND
US
TRY
SU
RV
EY
22
have absorbed a large portion of revenues inrecent periods.
LaborLabor has dropped to the second largest
expense category due to the recent sharprise in fuel costs. Labor accounted for24.5% of total revenues at the 10 largestUS carriers in 2006, down from 28.2% in2005. Employment can be divided into sev-eral broad positions: flight crews (pilotsand engineers), flight attendants, groundservice (including baggage handlers, rampworkers, and reservationists), dispatchers,maintenance, and customer service (book-ings and boardings).
Most airline workers belong to one of adozen major unions. The larger unions in-clude the Association of Flight Attendants,the Air Line Pilots Association, and the Inter-national Association of Machinists and Aero-space Workers. At any given time, an airlinemight be in negotiation over a half dozen ormore labor contracts.
Union contract talks tend to be protract-ed, often lasting two years or more beforesettlement, largely because the industry fol-lows procedures laid out by the RailwayLabor Act of 1926 (RLA). Strikes occur in-frequently because under the RLA, airlinecontracts do not expire, but become amend-able. Before a strike can occur, labor disputesmust be submitted to the National MediationBoard, an impasse must be declared, and acooling-off period served.
EquipmentAirline equipment costs, excluding fuel
and maintenance, are equal to about 10% oftotal expenses. Aircraft may be obtained newor secondhand, or they may be leased.
For carriers with balance sheets that arestretched, leasing is the most affordablemethod of obtaining equipment. Many majorairlines lease the bulk of their aircraft —about 55% of their fleets — from intermedi-ary companies known as lessors. Lessors of-ten can finance the purchase of new aircraftmore cheaply than airlines can because oftheir superior credit rating. They then passon some of the savings to the airlines, reduc-ing carriers’ equipment costs while earning aprofit for themselves. For financially strongcarriers, however, it is cheaper to buy aircraftoutright than to lease them.
Carriers incur the costs of maintainingtheir fleets, whether leased or owned. Mostcarriers perform routine maintenance, butmany outsource heavier repairs to firms thatspecialize in such work. Even if they contractout the maintenance work, though, airlinesare still responsible for the airworthiness oftheir aircraft.
FuelAirlines are energy-intensive operations;
fuel accounted for 25.7% of total revenuesin 2006 at the 10 largest US carriers and wasthe single largest cost category, up from24.2% in 2005. How much a carrier spendson fuel depends not only on fuel prices butalso on consumption, which varies with theage of its aircraft and its average flightlength. The fuel efficiency of different air-craft varies widely, with the number of en-gines a major determinant. Takeoffs andlandings (which are more frequent for short-haul carriers) consume a lot of fuel.
Some carriers attempt to hedge their fuelcosts by striking deals with suppliers or bybuying and selling futures on the commodi-ties market. Because the jet fuel futures mar-ket is thin, carriers sometimes hedge withcrude oil or heating oil — neither of whichmoves in exact harmony with jet fuel prices.
The high cost of bad weatherWeather is another unpredictable variable
that can have a profound short-term effecton airline costs and operations. Wind speedsand air temperatures influence how muchfuel an aircraft will require to reach its desti-nation. Floods, fog, ice, and snow can shutairports and force the cancellation of flights.
FUEL EFFICIENCY(Gallons consumed per available seat-mile)
Source: Air Transport Association of America.
0.0225
0.0220
0.0215
0.0210
0.0205
0.0200
0.0195
0.0190
0.0185
0.01801984 86 88 90 92 94 96 98 00 02 04 2006
NO
VEM
BER
22,
200
7 /
AIR
LIN
ES I
ND
US
TRY
SU
RV
EY
23
Weather is the second largest cause of airlineaccidents, after pilot error.
The industry must obtain detailed weatherforecasts that include cloud height, horizon-tal visibility, and wind speeds and direction.Some airlines have their own meteorologydepartments to provide this information, al-though most rely on government agenciesand pilot reports.
Operations overview
Airline flights are either nonstop or con-necting. A nonstop flight has a “point-to-point” itinerary, in which the aircraft fliesfrom origin to destination without interrup-tion. A connecting flight is one that involvesat least two legs and passes through at leastone hub.
Short flights typically have no intermedi-ate stops, while flights covering longer dis-tances tend to be routed through a hub. Thehub-and-spoke system lets airlines gatherpassengers from lightly traveled markets to asingle point to build up densities for thelonger leg of a flight. To bring passengers tothe hub, the hub carrier will use either itsown smaller capacity aircraft or the servicesof a regional airline, which the major airlineoften owns wholly or in part. Until recently,the regionals typically employed only turbo-prop aircraft, but they are aggressively phas-ing out these small, noisy aircraft in favor ofcomparatively larger jets. On the longer legof the route, larger capacity jets are used.
To connect flights from central hubs tolow-density destinations or vice versa, largeairlines and small regional carriers oftencomplete different portions of a trip — apractice known as “interlining” passengers.Such joint flights are typically scheduledthrough a code-sharing arrangement.
Through code sharing, a carrier sells seatsfor flights on joint routes. Although two car-riers are to provide the service, the customerreceives a single ticket. Typically in thesearrangements, the regional airline operatesunder the major airline’s code, and flights arebooked as such in computer reservation sys-tems. Federal regulations require airlines toinform passengers when they are booking aflight that involves code sharing.
Another technique, used mainly for shortduration, is a “wet lease” arrangement, inuse both in the United States and overseas.
A larger airline leases an aircraft accompa-nied by a full crew to provide service on aroute that it cannot or does not choose tooperate directly. Once traffic on the newroute reaches a level where the carrier canuse its own aircraft and crew, it often dropsthe wet lease.
Distribution changing with technology
The airline industry historically distrib-uted tickets primarily through travel agents.However, it also books flights directlythrough company clerks and via the Internet.In addition, online travel sites are gainingmarket share.
According to the American Society of Trav-el Agents (ASTA), travel agents generatedabout 51% of total airline bookings in 2004(latest available), down from 70% in 2003.Approximately 88,590 travel agents operatedin the United States as of May 2005; 19,393travel agencies were in operation at the end of2006. These numbers have been declining dueto a more difficult operating environment, inwhich airlines are reducing commissions whileInternet competition is growing.
In April 2002, most of the major US air-lines eliminated the payment of base com-missions to travel agents on domestictickets. Many airlines substituted incentivecommissions to travel agents that booked apredetermined volume of tickets for thatairline. Total commissions paid in 2003 bythe 10 major US airlines averaged 3.9% ofrevenues, down from 4.6% in 2002. Thatpercentage fell further in 2004, to thepoint where most major airlines no longerbreak out the expense category separatelyin their financial statements. According toStandard & Poor’s estimates, commissionsin 2005 averaged about 1% of revenues forthe top 10 major airlines. Many travelagents have responded to these cuts bycharging customers a service fee to bookair travel, which means that the airlineshave essentially passed much of the cost ofbooking tickets on to the consumer.
Airlines try to encourage travel agents tosteer customers their way by offering “com-mission overrides.” A commission override is an incentive whereby an airline agrees tocompensate an agent at a higher-than-customary rate once the agent’s bookings exceed a predetermined level.

NO
VEM
BER
22,
200
7 /
AIR
LIN
ES I
ND
US
TRY
SU
RV
EY
24
To book a flight, the travel agent harness-es one of several major CRSs. Nearly allairlines now supply their flight and fare in-formation to CRS operators, though mostcarriers hold back special fares for their ownInternet sites. When a flight is booked, theairline pays the CRS operator a fee of be-tween $2.50 and $3.00 per ticket. In addi-tion to offering real-time airfare and routeinformation, the CRS can be used to bookhotels and cruises and to rent cars.
The leading CRS is Sabre HoldingsCorp., which began as the internal reserva-tions system for American Airlines beforeit was opened to other airlines in 1976. Aircarriers have recently sold or spun off con-trolling stakes in Sabre and other CRS op-erators such as Amadeus Global TravelDistribution SA, Galileo International Inc.,and Worldspan Technologies Inc. In March2007, Sabre was acquired by private equitygroups Silver Lake Partners and Texas Pacific Group.
After deregulation, CRSs became indis-pensable, as air carriers began offering amultitude of fares per flight and making fre-quent changes in their fare offerings. Thesesystems contribute to a more efficient marketin airfare pricing, because they provide cus-tomers and carriers with full knowledge ofexisting fares.
Air travelers can book flights and securefare information via the Internet. Airlines al-low flights to be booked through their homepages on the World Wide Web. Another op-tion for passengers is to book flights via theInternet by utilizing cyber-travel agents — intermediaries that pull together all airlineschedules into a synthetic variant of a CRS.The Internet version of the CRS is accessibleto all PC owners and is in a format that ismore user-friendly than a traditional CRS.
Regulation under deregulation
Federal regulation of domestic airlinefares and markets ended with the AirlineDeregulation Act of 1978. However, theDOT and its affiliated agency, the FederalAviation Administration (FAA), continue toregulate the industry with regard to safety,labor, operating procedures, aircraft fitness,and emission levels. The International CivilAviation Organization (ICAO), an entity af-filiated with the United Nations, proposes
noise standards, though the standards arenot legally binding in a given country unlessthe country has formally agreed to them.
The FAA, established in 1958, primarilypromotes safe air travel. It does this by mon-itoring the industry’s maintenance and oper-ating practices. The FAA certifies aircraft andairlines and establishes age and medical re-quirements for pilots. One of the agency’schief functions is to operate the nation’s airtraffic control system at some 288 airports.Another 161 airports are operated undercontract from the FAA.
The DOT levies civil penalties against air-lines that engage in fraudulent marketingpractices or that violate code-sharing rules. Italso oversees compliance with denied board-ing (bumping) compensation rules and ren-ders decisions on airline ownership andcontrol issues. The DOT plays an importantrole in negotiating bilateral aviation treatieswith foreign nations.
When US airlines operate in internationalmarkets, they are subject to economic regula-tion by individual foreign governments andcollective organizations such as the EuropeanCommission. The degree of regulation variesfrom country to country, and the rules arelaid out through formal bilateral aviationtreaties. These accords govern reciprocallanding rights and typically limit the numberof carriers that can operate in a country, thelevel of rates, the type of aircraft, and thefrequency of flights.
Feds take jurisdiction over airport security
In response to public worries about airtravel security following the terrorist attacksof September 2001, President George W.Bush signed the Aviation and TransportationSecurity Act in November 2001. The lawfederalized the airport security industry andcreated the Transportation Security Agency(TSA). As of March 2005, there were rough-ly 45,000 federal screeners, who were de-ployed at all 429 US commercial airports.
Federal control of airport security is ex-pected to facilitate the use of informationfrom the Federal Bureau of Investigation andother agencies in the screening process. Thegovernment will pay workers’ salaries; theairlines are responsible for some additionalcosts, including equipment expenditures and
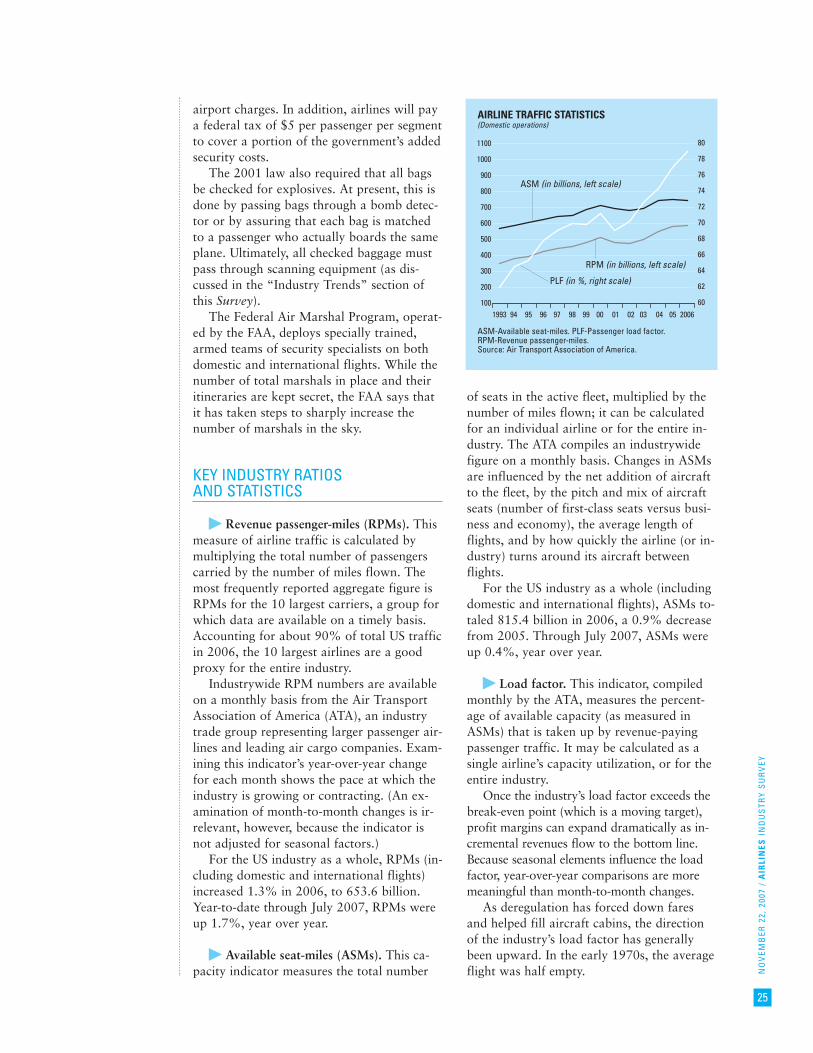
NO
VEM
BER
22,
200
7 /
AIR
LIN
ES I
ND
US
TRY
SU
RV
EY
25
airport charges. In addition, airlines will paya federal tax of $5 per passenger per segmentto cover a portion of the government’s addedsecurity costs.
The 2001 law also required that all bagsbe checked for explosives. At present, this isdone by passing bags through a bomb detec-tor or by assuring that each bag is matchedto a passenger who actually boards the sameplane. Ultimately, all checked baggage mustpass through scanning equipment (as dis-cussed in the “Industry Trends” section ofthis Survey).
The Federal Air Marshal Program, operat-ed by the FAA, deploys specially trained,armed teams of security specialists on bothdomestic and international flights. While thenumber of total marshals in place and theiritineraries are kept secret, the FAA says thatit has taken steps to sharply increase thenumber of marshals in the sky.
KEY INDUSTRY RATIOSAND STATISTICS
� Revenue passenger-miles (RPMs). Thismeasure of airline traffic is calculated bymultiplying the total number of passengerscarried by the number of miles flown. Themost frequently reported aggregate figure isRPMs for the 10 largest carriers, a group forwhich data are available on a timely basis.Accounting for about 90% of total US trafficin 2006, the 10 largest airlines are a goodproxy for the entire industry.
Industrywide RPM numbers are availableon a monthly basis from the Air TransportAssociation of America (ATA), an industrytrade group representing larger passenger air-lines and leading air cargo companies. Exam-ining this indicator’s year-over-year changefor each month shows the pace at which theindustry is growing or contracting. (An ex-amination of month-to-month changes is ir-relevant, however, because the indicator isnot adjusted for seasonal factors.)
For the US industry as a whole, RPMs (in-cluding domestic and international flights)increased 1.3% in 2006, to 653.6 billion.Year-to-date through July 2007, RPMs wereup 1.7%, year over year.
� Available seat-miles (ASMs). This ca-pacity indicator measures the total number
of seats in the active fleet, multiplied by thenumber of miles flown; it can be calculatedfor an individual airline or for the entire in-dustry. The ATA compiles an industrywidefigure on a monthly basis. Changes in ASMsare influenced by the net addition of aircraftto the fleet, by the pitch and mix of aircraftseats (number of first-class seats versus busi-ness and economy), the average length offlights, and by how quickly the airline (or in-dustry) turns around its aircraft betweenflights.
For the US industry as a whole (includingdomestic and international flights), ASMs to-taled 815.4 billion in 2006, a 0.9% decreasefrom 2005. Through July 2007, ASMs wereup 0.4%, year over year.
� Load factor. This indicator, compiledmonthly by the ATA, measures the percent-age of available capacity (as measured inASMs) that is taken up by revenue-payingpassenger traffic. It may be calculated as asingle airline’s capacity utilization, or for theentire industry.
Once the industry’s load factor exceeds thebreak-even point (which is a moving target),profit margins can expand dramatically as in-cremental revenues flow to the bottom line.Because seasonal elements influence the loadfactor, year-over-year comparisons are moremeaningful than month-to-month changes.
As deregulation has forced down faresand helped fill aircraft cabins, the directionof the industry’s load factor has generallybeen upward. In the early 1970s, the averageflight was half empty.
AIRLINE TRAFFIC STATISTICS(Domestic operations)
ASM-Available seat-miles. PLF-Passenger load factor.RPM-Revenue passenger-miles.Source: Air Transport Association of America.
80
78
76
74
72
70
68
66
64
62
60
1100
1000
900
800
700
600
500
400
300
200
1001993 94 95 96 97 98 99 00 01 02 03 04 05 2006
ASM (in billions, left scale)
RPM (in billions, left scale)
PLF (in %, right scale)
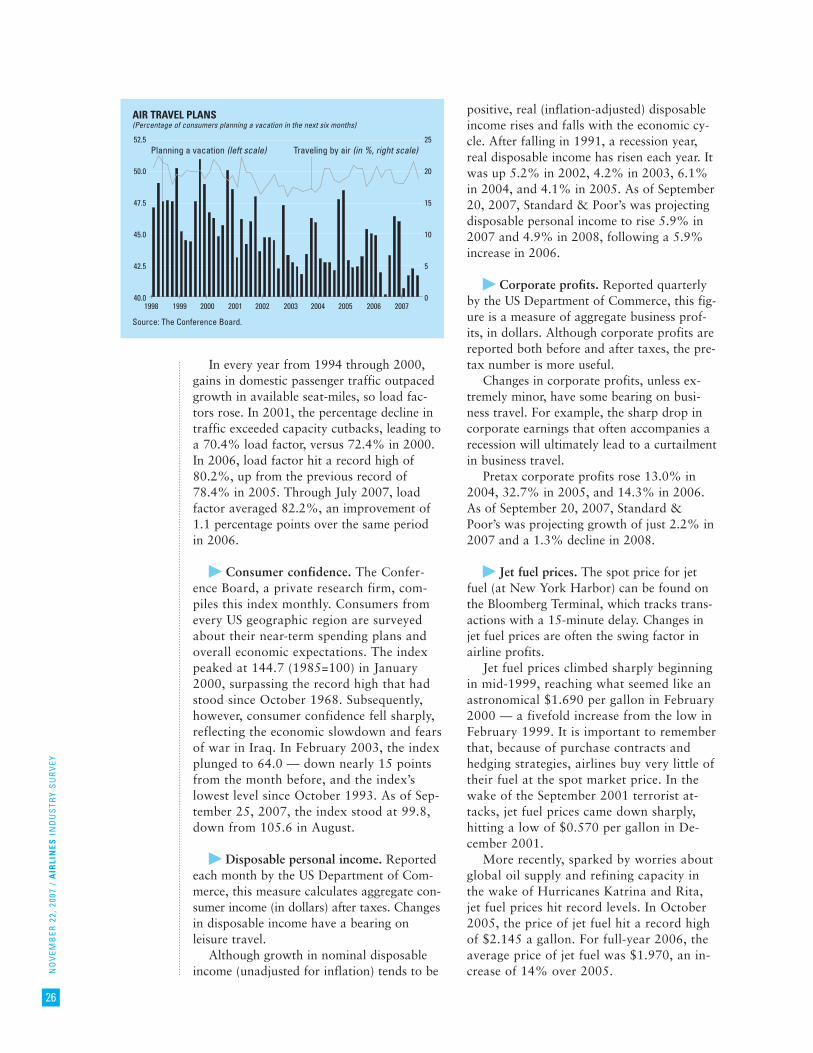
NO
VEM
BER
22,
200
7 /
AIR
LIN
ES I
ND
US
TRY
SU
RV
EY
26
In every year from 1994 through 2000,gains in domestic passenger traffic outpacedgrowth in available seat-miles, so load fac-tors rose. In 2001, the percentage decline intraffic exceeded capacity cutbacks, leading toa 70.4% load factor, versus 72.4% in 2000.In 2006, load factor hit a record high of80.2%, up from the previous record of78.4% in 2005. Through July 2007, loadfactor averaged 82.2%, an improvement of1.1 percentage points over the same periodin 2006.
� Consumer confidence. The Confer-ence Board, a private research firm, com-piles this index monthly. Consumers fromevery US geographic region are surveyedabout their near-term spending plans andoverall economic expectations. The indexpeaked at 144.7 (1985=100) in January2000, surpassing the record high that hadstood since October 1968. Subsequently,however, consumer confidence fell sharply,reflecting the economic slowdown and fearsof war in Iraq. In February 2003, the indexplunged to 64.0 — down nearly 15 pointsfrom the month before, and the index’slowest level since October 1993. As of Sep-tember 25, 2007, the index stood at 99.8,down from 105.6 in August.
� Disposable personal income. Reportedeach month by the US Department of Com-merce, this measure calculates aggregate con-sumer income (in dollars) after taxes. Changesin disposable income have a bearing onleisure travel.
Although growth in nominal disposableincome (unadjusted for inflation) tends to be
positive, real (inflation-adjusted) disposableincome rises and falls with the economic cy-cle. After falling in 1991, a recession year,real disposable income has risen each year. Itwas up 5.2% in 2002, 4.2% in 2003, 6.1%in 2004, and 4.1% in 2005. As of September20, 2007, Standard & Poor’s was projectingdisposable personal income to rise 5.9% in2007 and 4.9% in 2008, following a 5.9%increase in 2006.
� Corporate profits. Reported quarterlyby the US Department of Commerce, this fig-ure is a measure of aggregate business prof-its, in dollars. Although corporate profits arereported both before and after taxes, the pre-tax number is more useful.
Changes in corporate profits, unless ex-tremely minor, have some bearing on busi-ness travel. For example, the sharp drop incorporate earnings that often accompanies arecession will ultimately lead to a curtailmentin business travel.
Pretax corporate profits rose 13.0% in2004, 32.7% in 2005, and 14.3% in 2006.As of September 20, 2007, Standard &Poor’s was projecting growth of just 2.2% in2007 and a 1.3% decline in 2008.
� Jet fuel prices. The spot price for jetfuel (at New York Harbor) can be found onthe Bloomberg Terminal, which tracks trans-actions with a 15-minute delay. Changes injet fuel prices are often the swing factor inairline profits.
Jet fuel prices climbed sharply beginningin mid-1999, reaching what seemed like anastronomical $1.690 per gallon in February2000 — a fivefold increase from the low inFebruary 1999. It is important to rememberthat, because of purchase contracts andhedging strategies, airlines buy very little oftheir fuel at the spot market price. In thewake of the September 2001 terrorist at-tacks, jet fuel prices came down sharply,hitting a low of $0.570 per gallon in De-cember 2001.
More recently, sparked by worries aboutglobal oil supply and refining capacity inthe wake of Hurricanes Katrina and Rita,jet fuel prices hit record levels. In October2005, the price of jet fuel hit a record highof $2.145 a gallon. For full-year 2006, theaverage price of jet fuel was $1.970, an in-crease of 14% over 2005.
AIR TRAVEL PLANS(Percentage of consumers planning a vacation in the next six months)
Source: The Conference Board.
25
20
15
10
5
0
52.5
50.0
47.5
45.0
42.5
40.0
Planning a vacation (left scale) Traveling by air (in %, right scale)
1998 1999 2000 2001 2002 2003 2004 2005 2006 2007
NO
VEM
BER
22,
200
7 /
AIR
LIN
ES I
ND
US
TRY
SU
RV
EY
27
HOW TO ANALYZE AN AIRLINE
Factors to examine when analyzing an air-line include traffic, pricing, costs, profitabili-ty, route structure, fleet planning, serviceperformance, various financial measures, andequity valuation, as discussed following.
Other important factors are managerialstrength and employee morale. Although dif-ficult to quantify, these characteristics aretypically reflected in cost and asset perfor-mance measures.
Revenue-related factors
Traffic is the starting point in analyzing apassenger airline. It can be measured interms of revenue passenger-miles (RPMs) orenplanements (the total number of peoplecarried). Both provide useful measures of acarrier’s market share. Traffic levels andyield, a measure of pricing trends, are thetwo determinants of revenues.
Traffic: revenue passenger-milesFor any given period, revenue passenger-
miles (RPMs) equal the total number of pas-sengers enplaned, multiplied by the averagedistance flown. This measure is superior toenplanements as an analytical tool, becauseairline revenues closely correspond to RPMlevels. Short-haul carriers sometimes rankhigh based on total enplanements, but ap-pear smaller when measured by RPMs orrevenues.
Changes in RPMs should be comparedwith industry averages to determine whethera carrier is gaining or losing market share.Traffic performance must be viewed in con-junction with yield analysis to determinewhether a carrier is “buying” market shareat the cost of profits. Each month, scheduledairlines report their traffic data to the US De-partment of Transportation (DOT). Start-upcarriers and regional and charter airlines typ-ically outperform the majors in RPM growthbecause their traffic base is much smaller.Again, growth rates should not be confusedwith profitability.
A comparative analysis of different carri-ers’ RPM performance over a short periodcan yield a distorted picture. Vacation traveltends to be concentrated during the summermonths, creating uneven seasonal traffic pat-terns. For small regional airlines with a high
proportion of business travelers, these sea-sonal swings may be largely absent. Conse-quently, using data for the off-season wintertravel period might lead one to conclude er-roneously that small, business-oriented air-lines were outperforming their largercompetitors.
Yield: a look at pricing trendsThe other component of revenues is pric-
ing, or fare levels. The passenger revenuegenerated per RPM is commonly referred toas the yield. It is useful to compare the trendin a carrier’s yield with the trend in yield forother airlines; however, comparing the yieldlevels for different carriers is useful only ifthe carriers provide a similar mix of flights.Yields for international flights tend to belower than those for domestic routes, yetthey also may be more profitable. Thus, oneshould take into consideration the percentageof domestic versus international travel in acarrier’s mix. In addition, airlines that have alarger mix of business or first-class seats willreport higher yields than carriers flying theleisure trade on identical routes. While short-haul flights tend to have higher yields, theircosts are also higher, and their load factorstend to be lower.
Market share and geographic mixThe best method for determining a carri-
er’s relative market performance is to look atthe specific city pairs that it serves — itsshare of total enplanements at the airportswhere it operates. An analysis of city-pairtraffic can pinpoint exactly where a carrier isfacing the greatest degree of competitivepressure. In today’s environment, it is not un-usual to find major airports where a singleairline accounts for 75% or more of total en-planements. Carriers that have low marketshare — or that serve cities where no singleairline dominates — will face greater com-petitive pressure on fares.
An airline’s geographic mix is important.Economic growth and the level of discre-tionary spending — and, hence, air travel —vary from region to region and nation to na-tion. Airlines that serve a limited market cansee their traffic diverge from overall nationaltrends. A carrier that primarily servesHawaii, the Florida tourist market, or theoil-patch states could beat or underperformother carriers at times. Likewise, carriers that
NO
VEM
BER
22,
200
7 /
AIR
LIN
ES I
ND
US
TRY
SU
RV
EY
28
derive a high percentage of their total RPMsfrom international travel may see their trafficoccasionally out of step with those that servedomestic markets exclusively.
Whatever markets an airline serves, how-ever, it is not locked into them in the sameway that a railroad is because airlines canreposition their assets depending on wherethe best growth opportunities lie. Airlinescan shift resources out of weaker internation-al locations and into stronger ones, or out ofweak, underperforming, or money-losing do-mestic markets into those with better growthpotential. Not all aircraft types can be oper-ated profitably in every market, though. Forexample, jumbo jets need dense, long-haulroutes, and can be accommodated only byairports with long runways.
Costs
When evaluating an airline, it is oftenmore important to analyze its cost perfor-mance than its traffic. Among start-up air-lines, the aggressive, high-growth carrier isfrequently the one to suffer defeat. In con-trast, carriers that pursue a manageable levelof growth while controlling costs tend tothrive.
LaborLabor has historically been the industry’s
largest cost item, though in 2005 and againin 2006, fuel surpassed labor as the largestcost category for some carriers. According todata compiled by Standard & Poor’s, laborcosts at the 10 major US airlines averaged24.5% of total revenues in 2006 (comparedwith 28.2% in 2005), ranging from a low of18.0% (US Airways Group Inc.) to a high of 34.0% (Southwest Airlines Co., surpris-ingly to many).
How much an airline spends on labor de-pends on its efficiency and the labor-intensityof its routes. For example, short routes onwhich meals are not served have lower per-sonnel and cleaning costs than those that re-quire meal service. They also have lower gaterental fees. Aircraft can be turned aroundquickly because they do not require cateringentrances and other facilities needed by long-haul flights; also, they do not need to refuelas often. Thus, short-haul operators typicallyincur lower labor costs than do the majornational airlines.
Outsourcing certain functions, such asmaintenance or reservation services, re-duces labor costs as a percentage of the to-tal and can cut total costs as well. Similarly,a technology-intensive airline — one with ahigh percentage of sales booked over theInternet, for example, and/or electronicticketing and self-service check-in kiosks —will enjoy high labor productivity.
While most airline employees are unionmembers, wages and work rules differ fromcarrier to carrier. Aircraft type and designwill determine the size of the flight crew:some aircraft require two copilots, while oth-ers need only one. Nonunion airlines instructflight attendants to perform tasks that are re-stricted to fleet service operators in unionairlines.
Some airlines offer sizable profit-sharingprograms or may have employee stock own-ership programs (ESOPs) in addition tosalaries and benefits. Although these may notbe recognized as an expense category on theincome statement, such airlines will record acharge to earnings to cover distributions un-der the ESOP plan — equaling as much as5% of revenues.
Labor efficiency should be measured rela-tive to output; in the airline industry, thistranslates into RPMs per worker. Labor pro-ductivity averages about 1.4 million RPMsannually per worker, with major carriersrecording between 1.1 million and 1.6 mil-lion RPMs per worker per year.
FuelAirlines are energy-intensive operations,
but carriers have different levels of exposureto changes in fuel prices. In the past, fuelcosts at the major airlines ranged from as lit-tle as 10% of their revenues to as much as18%. Rising oil prices have hit all the majorcarriers, however. In 2006, fuel costs aver-aged 26% of revenues among the 10 majorUS airlines, with costs ranging from 22.5%to 37.0% of revenues. Along with the num-ber of engines, the age of a carrier’s aircraftgreatly influences fuel consumption rates, asnewer planes are more fuel-efficient than old-er models.
Carriers specializing in short hauls, whichinvolve frequent departures, consume morefuel than do long-haul airlines, because a dis-proportionate amount of fuel is burned duringtakeoff and landing. In addition, short-haul
NO
VEM
BER
22,
200
7 /
AIR
LIN
ES I
ND
US
TRY
SU
RV
EY
29
carriers operating turboprop aircraft consumeless fuel than those employing jets. Mean-while, carriers based in the western UnitedStates typically pay more per gallon than doother US airlines.
Under normal conditions, the averageprice per gallon of jet fuel may vary by10% to 15% from carrier to carrier, as air-lines engage in fuel hedging to varying de-grees. Most airline managers now see thevalue of using futures and swaps to hedge amajority of their fuel price exposure; but,given the recent weakness in many airline’sbalance sheets, many carriers have been un-able to hedge against rising oil prices to theextent that they would like. In addition,with oil prices recently near record highs,many carriers have been unwilling to enterinto new hedge positions as older ones ex-pire; they are afraid to lock in high oilprices, which could lead to hedging losses ifoil prices recede.
MaintenanceThe average carrier spent about 4.9% of
its revenues on maintenance in 2006; the in-dustry’s range was 3.6% to 7.9%. Mainte-nance spending per carrier varies materiallywith the amount of work outsourced.
Aircraft age greatly influences the level ofmaintenance required. Just as important,however, is the spacing of fleet ages. Everysix to eight years (or 20,000 flight hours),each aircraft must undergo an intensivemaintenance program known as the D-check.Airlines that fail to space orders evenly, orthat buy secondhand aircraft of the sameage, will face a bunched-up maintenance pro-gram at some point. If this happens, it willdistort the results of a comparative analysis.
Financing aircraft purchasesFor major airlines, interest expense (net of
interest income and capitalized interest), av-eraged about 2.7% of revenues in 2006,compared with 3.4% in 2005. The revenuesconsumed by interest expense in 2006 rangedfrom 1.6% (AirTran Holdings Inc.) to 7.4%(Delta Air Lines Inc.). Many airlines leasesome portion of their fleets from equipmentlessors. Aircraft rental costs averaged about3.5% of revenues in 2006, down from 4.1%in 2005; the costs in 2006 ranged from a lowof 1.7% (Southwest Airlines) to a high of12.2% (AirTran).
Profitability and load factor
A key determinant of profitability is ca-pacity utilization, as measured by load factor(a carrier’s RPMs divided by its availableseat-miles, or ASMs). ASMs are calculated asaircraft miles flown, multiplied by the num-ber of seats available for revenue passengeruse. Given airlines’ high fixed costs, the morepassengers that can be boarded before eachdeparture, the more profitable the flight willbe, provided variable costs are covered.
In late 2000 and early 2001, load factorsrose at UAL Corp. (United Airlines) andAMR Corp. (American Airlines), reflecting adecrease in capacity as the airlines removedthousands of seats to expand legroom. Im-mediately after September 11, 2001, loadfactors dropped sharply — to well below50% — but they have since risen above his-torical averages as low fares have spurred de-mand, albeit at the cost of lower industryyields. It is important to realize, however,that rising load factors show only that capac-ity utilization is increasing, not necessarilythat passenger volumes or profitability areimproving.
Carriers’ load factors are always highestduring the peak summer travel season, usual-ly as high as 80.00%; in July 2006, passen-ger load factor averaged 86.67%, which webelieve is a record for any month. During theoff-season, load factors may be closer to60%. Short-haul commuter airlines, whichtypically operate small turboprop aircraft,often sustain load factors well below those ofthe majors. However, they can operate prof-itably at load factors of 50% or less, becausethey turn their planes around more frequent-ly. For longer-haul flights, break-even loadfactors would likely be above 60% undernormal conditions. For the legacy majors,they have been much higher in recent periodsdue to reductions in capacity and sharp dis-counting, which has filled planes but at be-low break-even revenue levels. A carrier’sbreak-even load factor depends on its rev-enue per passenger-mile and the cost of pro-viding each available seat-mile.
RASM versus CASMComparing passenger revenues per avail-
able seat-mile (RASM) with costs per ASM(CASM) is a common way of measuring air-line profitability. RASM is the indicator most

NO
VEM
BER
22,
200
7 /
AIR
LIN
ES I
ND
US
TRY
SU
RV
EY
30
closely watched by financial analysts, but bothmeasures are crucial. In past years, United Air-lines and American Airlines demonstrated thatsimply removing seats could increase RASM.This increase, however, clearly was not enoughto make them profitable.
Since airlines often earn an additional10% of their income from other sources,Standard & Poor’s also likes to consider atotal RASM measure, including cargo opera-tions, sales of frequent-flyer miles, in-flightliquor, entertainment, or telephone services,and other amenities. These nonpassenger rev-enue sources can make the difference be-tween an operating loss and a profit.
Balance sheet stability and cash burn
Given the high debt levels carried bymany airlines, and the frequency of large op-erating losses, it is important to assess thestrength of an airline’s balance sheet. Metricssuch as debt-to-equity and debt-to-total-capitalization should be examined, as shouldcash on hand to cover interest payments andother liquidity needs.
During times of industry losses, it is impor-tant to determine how quickly an airline maybe using its available cash (its cash burn rate).For example, in the case of UAL Corp. beforeits bankruptcy filing in December 2002 —and, more recently, in Delta Air Lines’ precar-ious financial state in late September 2004and again in March 2005 — these airlineswere burning through millions of dollars incash each day. In such cases, it is important togauge how long an airline can withstand adownturn and remain solvent.
Service and safety record
One way to measure an airline’s serviceperformance is by the percentage of itsflights that arrive on time, as published inthe DOT’s Air Travel Consumer Report.Typically, 75% to 80% of all flights arrivewithin 15 minutes of their scheduled time.Carriers that route passengers through hubsinto connecting flights are more likely tohave a lower on-time performance than thoseoffering direct point-to-point flights.
On-time performance is generally worseduring the winter, when weather can wreakhavoc with schedules. This is especially vex-ing for carriers that serve more northern
than southern states in the United States.Airlines serving congested metropolitan mar-kets often suffer from poor on-time perfor-mance caused by air traffic control-relateddelays. The on-time numbers must be takenwith a grain of salt, though, because someairlines lengthen their estimated flight timesto allow for delays.
The DOT collects and disseminates infor-mation about consumer complaints, which isusually a relatively reliable indicator of ser-vice levels. Sometimes a poor service perfor-mance reflects low employee morale,particularly if a carrier’s labor talks havereached a stalemate.
One also can look at the bumping ratio —the percentage of passengers denied board-ing. Airlines that overbook flights will havehigh bumping ratios. Some 0.2% of all pas-sengers are bumped; of that total, however,only 5% are bumped involuntarily — therest take an offer from the airline to be “vol-untarily” bumped. Bumped passengers arecompensated for their inconvenience, oftenwith as much as $400 in cash, vouchers, orfrequent-flyer credits. Consequently, airlineswith high levels of overbooking still mayhave high levels of consumer satisfaction. Acase could even be made that high bumpingratios coincide with wider profit margins, be-cause it indicates that flights are fully loadedwith passengers.
A carrier’s safety performance can some-times play an important role in determiningconsumers’ choice of airline. The FederalAviation Administration measures carriers’accident rates per 100,000 departures. Mostcarriers have low accident rates, and theirsafety records tend not to vary significantly. Ingeneral, airline safety has been on the rise. In2004, the National Transportation SafetyBoard reported one fatal accident in morethan 10 million scheduled departures, ac-cording to the Air Transport Association ofAmerica, a trade group that represents thelarger passenger airlines and leading air car-go companies. Between 2002 and 2004, air-lines in the United States provided 31 millionscheduled commercial flights, carrying nearlytwo billion passengers, while recording a to-tal of 34 fatalities.
Fleet planning and managementAn analysis of an airline’s asset perfor-
mance determines how well it manages its
NO
VEM
BER
22,
200
7 /
AIR
LIN
ES I
ND
US
TRY
SU
RV
EY
31
fleet. The faster a carrier can get its aircraftback into revenue service, the more prof-itable it will be.
Jet utilization is measured by the numberof hours the average aircraft is in service.The most efficient (and usually the mostprofitable) carriers tend to have their aircraftup for 11 to 12 hours per day.
Fleet age is an important statistic becauseit provides an early warning of when a carri-er’s capital spending may have to be rampedup to replace equipment. The age of an air-craft is less important than the number oftakeoff and landing cycles, which puts stresson the fuselage. In addition, the age of theaircraft’s engines and number of hours flownis a better gauge for the condition of the air-craft. While many start-up airlines operatewith older planes, established regional andcommuter airlines tend to own fairly newfleets, even those operating primarily withturboprops.
Equity valuation
Airline stocks are among the most volatileshares on the market. Investors tend to bidup shares of airlines when they are incurringsubstantial losses and things look bleakest,although the downturn in the industry —which began after September 11, 2001, andpersisted through 2005 — seems to haveshaken that historical pattern due to thesheer size of the losses and the extreme diffi-culties the carriers are facing. Once profitsare fat, investors normally move on, racingto lighten their airline holdings before thenext downturn. In light of this volatility,many airline stocks have historically beenviewed as trading vehicles.
Speculators tend to trade airlines as playson falling oil prices or the expectation offalling prices. The stock movements can ex-aggerate the effect that changes in fuel costshave on an airline company’s bottom line.For example, while a 10% jump in crude oilmay increase airline fuel costs 10%, totalcosts might rise only 1.5%, affecting profitssomewhere in between. Yet, driven by specu-lators’ response to the change in oil prices,an airline’s shares may rise or fall 20% ormore.
Furthermore, the “best” airlines may nothave the richest valuations. A strong serviceperformance and a young fleet are of sec-
ondary consideration in this regard; investorstend to favor growth airlines with wide prof-it margins. During a rally in airline equities,however, the biggest percentage gain in stockprice may go to the “worst” airline, becauseinvestors anticipate a greater gain (off a de-pressed base) in that carrier’s bottom line.Thus, in the perverse logic of Wall Street, anairline’s quality may have an inverse relation-ship with its stock performance — at leastduring a bull market. In a bear market, how-ever, quality usually shines through. ■
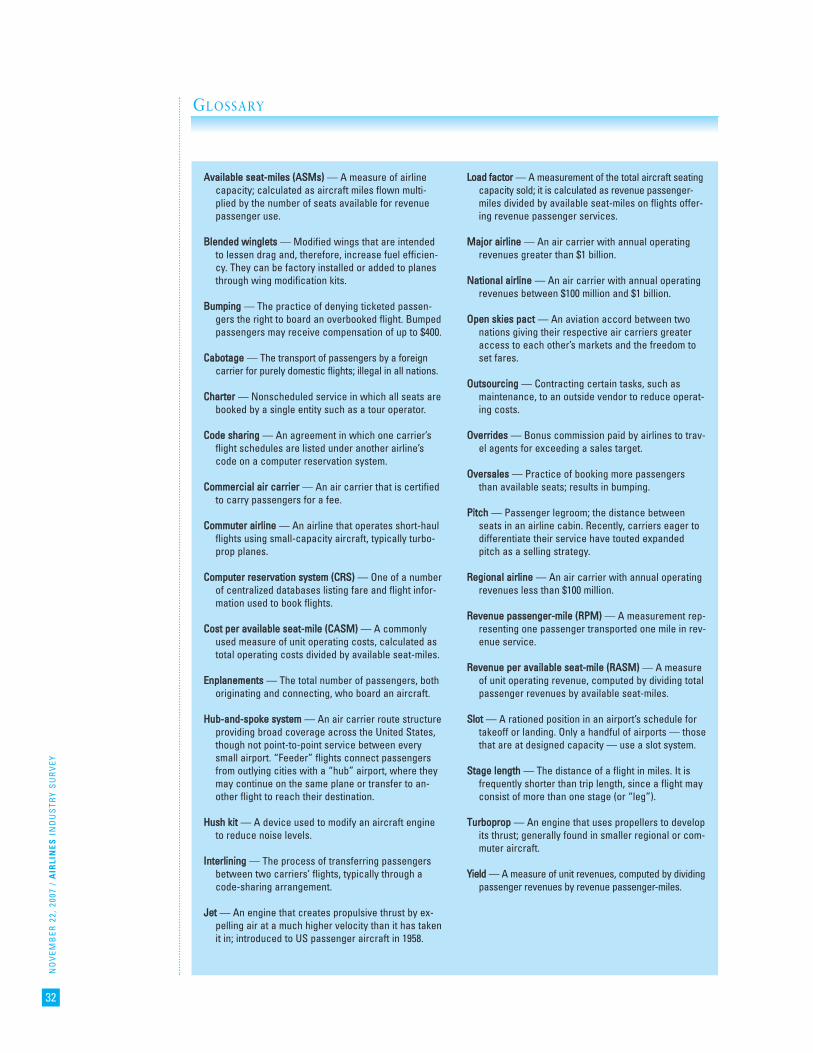
AAvvaaiillaabbllee sseeaatt--mmiilleess ((AASSMMss)) — A measure of airlinecapacity; calculated as aircraft miles flown multi-plied by the number of seats available for revenuepassenger use.
BBlleennddeedd wwiinngglleettss — Modified wings that are intendedto lessen drag and, therefore, increase fuel efficien-cy. They can be factory installed or added to planesthrough wing modification kits.
BBuummppiinngg — The practice of denying ticketed passen-gers the right to board an overbooked flight. Bumpedpassengers may receive compensation of up to $400.
CCaabboottaaggee — The transport of passengers by a foreigncarrier for purely domestic flights; illegal in all nations.
CChhaarrtteerr — Nonscheduled service in which all seats arebooked by a single entity such as a tour operator.
CCooddee sshhaarriinngg — An agreement in which one carrier’sflight schedules are listed under another airline’scode on a computer reservation system.
CCoommmmeerrcciiaall aaiirr ccaarrrriieerr — An air carrier that is certifiedto carry passengers for a fee.
CCoommmmuutteerr aaiirrlliinnee — An airline that operates short-haulflights using small-capacity aircraft, typically turbo-prop planes.
CCoommppuutteerr rreesseerrvvaattiioonn ssyysstteemm ((CCRRSS)) — One of a numberof centralized databases listing fare and flight infor-mation used to book flights.
CCoosstt ppeerr aavvaaiillaabbllee sseeaatt--mmiillee ((CCAASSMM)) — A commonlyused measure of unit operating costs, calculated astotal operating costs divided by available seat-miles.
EEnnppllaanneemmeennttss — The total number of passengers, bothoriginating and connecting, who board an aircraft.
HHuubb--aanndd--ssppookkee ssyysstteemm — An air carrier route structureproviding broad coverage across the United States,though not point-to-point service between everysmall airport. “Feeder” flights connect passengersfrom outlying cities with a “hub” airport, where theymay continue on the same plane or transfer to an-other flight to reach their destination.
HHuusshh kkiitt — A device used to modify an aircraft engineto reduce noise levels.
IInntteerrlliinniinngg — The process of transferring passengersbetween two carriers’ flights, typically through acode-sharing arrangement.
JJeett — An engine that creates propulsive thrust by ex-pelling air at a much higher velocity than it has takenit in; introduced to US passenger aircraft in 1958.
LLooaadd ffaaccttoorr — A measurement of the total aircraft seatingcapacity sold; it is calculated as revenue passenger-miles divided by available seat-miles on flights offer-ing revenue passenger services.
MMaajjoorr aaiirrlliinnee — An air carrier with annual operatingrevenues greater than $1 billion.
NNaattiioonnaall aaiirrlliinnee — An air carrier with annual operatingrevenues between $100 million and $1 billion.
OOppeenn sskkiieess ppaacctt — An aviation accord between twonations giving their respective air carriers greateraccess to each other’s markets and the freedom toset fares.
OOuuttssoouurrcciinngg — Contracting certain tasks, such asmaintenance, to an outside vendor to reduce operat-ing costs.
OOvveerrrriiddeess — Bonus commission paid by airlines to trav-el agents for exceeding a sales target.
OOvveerrssaalleess — Practice of booking more passengersthan available seats; results in bumping.
PPiittcchh — Passenger legroom; the distance betweenseats in an airline cabin. Recently, carriers eager todifferentiate their service have touted expandedpitch as a selling strategy.
RReeggiioonnaall aaiirrlliinnee — An air carrier with annual operatingrevenues less than $100 million.
RReevveennuuee ppaasssseennggeerr--mmiillee ((RRPPMM)) — A measurement rep-resenting one passenger transported one mile in rev-enue service.
RReevveennuuee ppeerr aavvaaiillaabbllee sseeaatt--mmiillee ((RRAASSMM)) — A measureof unit operating revenue, computed by dividing totalpassenger revenues by available seat-miles.
SSlloott — A rationed position in an airport’s schedule fortakeoff or landing. Only a handful of airports — thosethat are at designed capacity — use a slot system.
SSttaaggee lleennggtthh — The distance of a flight in miles. It isfrequently shorter than trip length, since a flight mayconsist of more than one stage (or “leg”).
TTuurrbboopprroopp — An engine that uses propellers to developits thrust; generally found in smaller regional or com-muter aircraft.
YYiieelldd — A measure of unit revenues, computed by dividingpassenger revenues by revenue passenger-miles.
GLOSSARY
NO
VEM
BER
22,
200
7 /
AIR
LIN
ES I
ND
US
TRY
SU
RV
EY
32
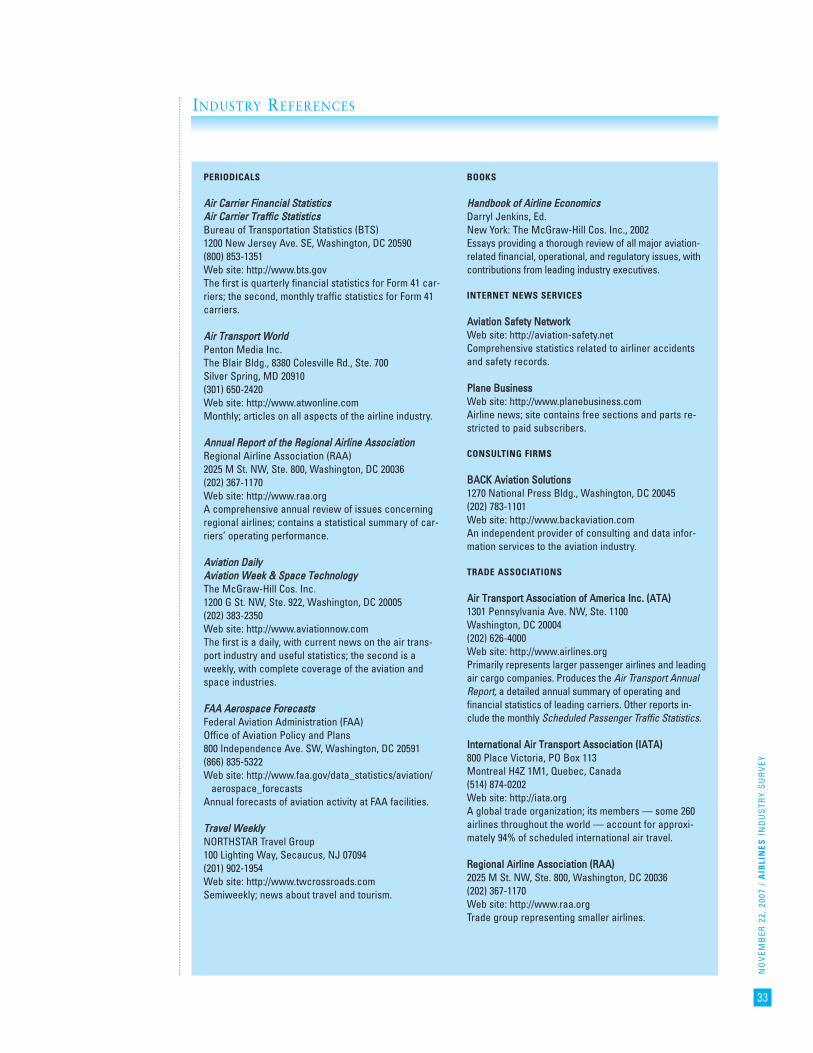
INDUSTRY REFERENCES
NO
VEM
BER
22,
200
7 /
AIR
LIN
ES I
ND
US
TRY
SU
RV
EY
33
PERIODICALS
AAiirr CCaarrrriieerr FFiinnaanncciiaall SSttaattiissttiiccssAAiirr CCaarrrriieerr TTrraaffffiicc SSttaattiissttiiccssBureau of Transportation Statistics (BTS)1200 New Jersey Ave. SE, Washington, DC 20590(800) 853-1351Web site: http://www.bts.govThe first is quarterly financial statistics for Form 41 car-riers; the second, monthly traffic statistics for Form 41carriers.
AAiirr TTrraannssppoorrtt WWoorrllddPenton Media Inc.The Blair Bldg., 8380 Colesville Rd., Ste. 700Silver Spring, MD 20910(301) 650-2420Web site: http://www.atwonline.comMonthly; articles on all aspects of the airline industry.
AAnnnnuuaall RReeppoorrtt ooff tthhee RReeggiioonnaall AAiirrlliinnee AAssssoocciiaattiioonnRegional Airline Association (RAA)2025 M St. NW, Ste. 800, Washington, DC 20036(202) 367-1170Web site: http://www.raa.orgA comprehensive annual review of issues concerningregional airlines; contains a statistical summary of car-riers’ operating performance.
AAvviiaattiioonn DDaaiillyyAAvviiaattiioonn WWeeeekk && SSppaaccee TTeecchhnnoollooggyyThe McGraw-Hill Cos. Inc.1200 G St. NW, Ste. 922, Washington, DC 20005(202) 383-2350Web site: http://www.aviationnow.comThe first is a daily, with current news on the air trans-port industry and useful statistics; the second is aweekly, with complete coverage of the aviation andspace industries.
FFAAAA AAeerroossppaaccee FFoorreeccaassttssFederal Aviation Administration (FAA)Office of Aviation Policy and Plans800 Independence Ave. SW, Washington, DC 20591(866) 835-5322Web site: http://www.faa.gov/data_statistics/aviation/
aerospace_forecastsAnnual forecasts of aviation activity at FAA facilities.
TTrraavveell WWeeeekkllyyNORTHSTAR Travel Group100 Lighting Way, Secaucus, NJ 07094(201) 902-1954Web site: http://www.twcrossroads.comSemiweekly; news about travel and tourism.
BOOKS
HHaannddbbooookk ooff AAiirrlliinnee EEccoonnoommiiccssDarryl Jenkins, Ed.New York: The McGraw-Hill Cos. Inc., 2002Essays providing a thorough review of all major aviation-related financial, operational, and regulatory issues, withcontributions from leading industry executives.
INTERNET NEWS SERVICES
AAvviiaattiioonn SSaaffeettyy NNeettwwoorrkkWeb site: http://aviation-safety.netComprehensive statistics related to airliner accidentsand safety records.
PPllaannee BBuussiinneessssWeb site: http://www.planebusiness.comAirline news; site contains free sections and parts re-stricted to paid subscribers.
CONSULTING FIRMS
BBAACCKK AAvviiaattiioonn SSoolluuttiioonnss1270 National Press Bldg., Washington, DC 20045(202) 783-1101Web site: http://www.backaviation.comAn independent provider of consulting and data infor-mation services to the aviation industry.
TRADE ASSOCIATIONS
AAiirr TTrraannssppoorrtt AAssssoocciiaattiioonn ooff AAmmeerriiccaa IInncc.. ((AATTAA))1301 Pennsylvania Ave. NW, Ste. 1100Washington, DC 20004(202) 626-4000Web site: http://www.airlines.orgPrimarily represents larger passenger airlines and leadingair cargo companies. Produces the Air Transport AnnualReport, a detailed annual summary of operating and financial statistics of leading carriers. Other reports in-clude the monthly Scheduled Passenger Traffic Statistics.
IInntteerrnnaattiioonnaall AAiirr TTrraannssppoorrtt AAssssoocciiaattiioonn ((IIAATTAA))800 Place Victoria, PO Box 113Montreal H4Z 1M1, Quebec, Canada(514) 874-0202Web site: http://iata.orgA global trade organization; its members — some 260airlines throughout the world — account for approxi-mately 94% of scheduled international air travel.
RReeggiioonnaall AAiirrlliinnee AAssssoocciiaattiioonn ((RRAAAA))2025 M St. NW, Ste. 800, Washington, DC 20036(202) 367-1170Web site: http://www.raa.orgTrade group representing smaller airlines.
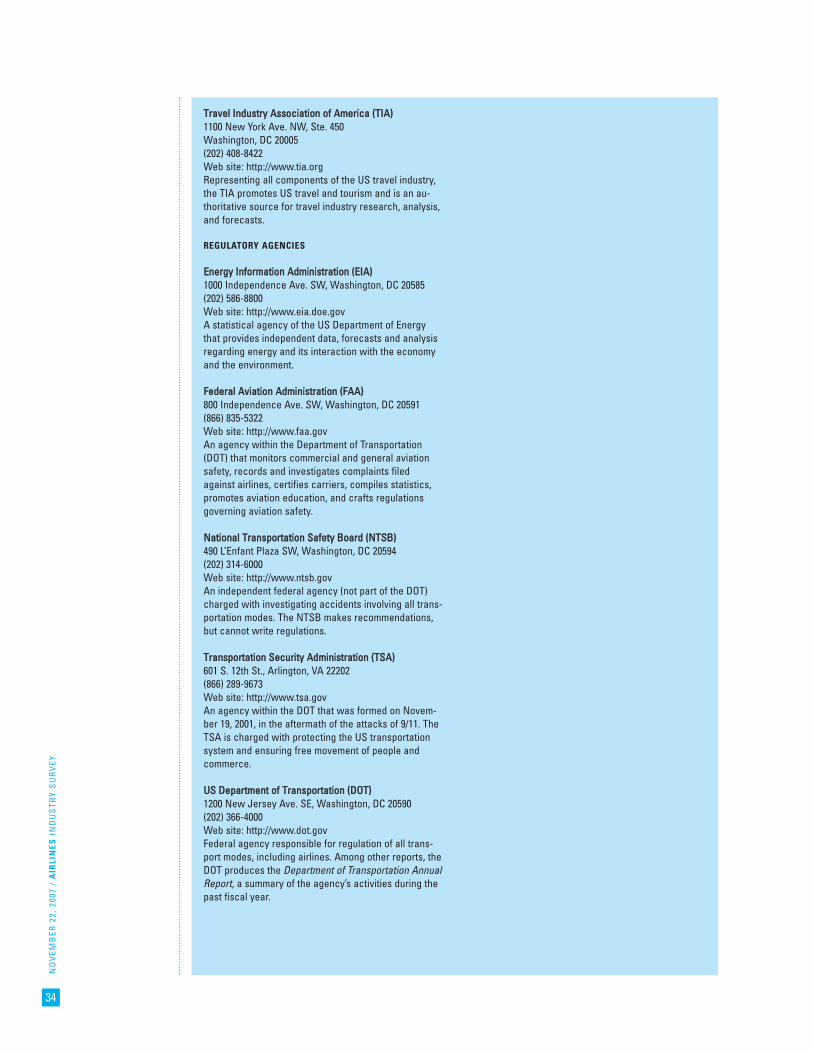
NO
VEM
BER
22,
200
7 /
AIR
LIN
ES I
ND
US
TRY
SU
RV
EY
34
TTrraavveell IInndduussttrryy AAssssoocciiaattiioonn ooff AAmmeerriiccaa ((TTIIAA))1100 New York Ave. NW, Ste. 450Washington, DC 20005(202) 408-8422Web site: http://www.tia.orgRepresenting all components of the US travel industry,the TIA promotes US travel and tourism and is an au-thoritative source for travel industry research, analysis,and forecasts.
REGULATORY AGENCIES
EEnneerrggyy IInnffoorrmmaattiioonn AAddmmiinniissttrraattiioonn ((EEIIAA))1000 Independence Ave. SW, Washington, DC 20585(202) 586-8800Web site: http://www.eia.doe.govA statistical agency of the US Department of Energythat provides independent data, forecasts and analysisregarding energy and its interaction with the economyand the environment.
FFeeddeerraall AAvviiaattiioonn AAddmmiinniissttrraattiioonn ((FFAAAA))800 Independence Ave. SW, Washington, DC 20591(866) 835-5322Web site: http://www.faa.govAn agency within the Department of Transportation(DOT) that monitors commercial and general aviationsafety, records and investigates complaints filedagainst airlines, certifies carriers, compiles statistics,promotes aviation education, and crafts regulationsgoverning aviation safety.
NNaattiioonnaall TTrraannssppoorrttaattiioonn SSaaffeettyy BBooaarrdd ((NNTTSSBB))490 L’Enfant Plaza SW, Washington, DC 20594(202) 314-6000Web site: http://www.ntsb.govAn independent federal agency (not part of the DOT)charged with investigating accidents involving all trans-portation modes. The NTSB makes recommendations,but cannot write regulations.
TTrraannssppoorrttaattiioonn SSeeccuurriittyy AAddmmiinniissttrraattiioonn ((TTSSAA))601 S. 12th St., Arlington, VA 22202(866) 289-9673Web site: http://www.tsa.govAn agency within the DOT that was formed on Novem-ber 19, 2001, in the aftermath of the attacks of 9/11. TheTSA is charged with protecting the US transportationsystem and ensuring free movement of people andcommerce.
UUSS DDeeppaarrttmmeenntt ooff TTrraannssppoorrttaattiioonn ((DDOOTT))1200 New Jersey Ave. SE, Washington, DC 20590(202) 366-4000Web site: http://www.dot.govFederal agency responsible for regulation of all trans-port modes, including airlines. Among other reports, theDOT produces the Department of Transportation AnnualReport, a summary of the agency’s activities during thepast fiscal year.

Operating revenuesNet sales and other operating revenues. Excludesinterest income if such income is “nonoperating.”Includes franchised/leased department income forretailers and royalties for publishers and oil and miningcompanies. Excludes excise taxes for tobacco, liquor,and oil companies.
Net incomeProfits derived from all sources, after deductions ofexpenses, taxes, and fixed charges, but before anydiscontinued operations, extraordinary items, anddividend payments (preferred and common).
Return on revenues Net income divided by operating revenues.
Return on assets Net income divided by average total assets. Used inindustry analysis and as a measure of asset-use efficiency.
Return on equity Net income, less preferred dividend requirements,divided by average common shareholder‘s equity.Generally used to measure performance and to makeindustry comparisons.
Current ratioCurrent assets divided by current liabilities. It is ameasure of liquidity. Current assets are those assetsexpected to be realized in cash or used up in theproduction of revenue within one year. Current liabilitiesgenerally include all debts/obligations falling due withinone year.
Debt/capital ratioLong-term debt (excluding current portion) divided bytotal invested capital. It indicates how highly “leveraged”a company might be. Long-term debt includes thosedebts/obligations due after one year, including bonds,notes payable, mortgages, lease obligations, andindustrial revenue bonds. Other long-term debt, whenreported as a separate account, is excluded; this accountgenerally includes pension and retirement benefits. Totalinvested capital is the sum of stockholders’ equity, long-term debt, capital lease obligations, deferred incometaxes, investment credits, and minority interest.
Debt as a percent of net working capitalLong-term debt (excluding current portion) divided by thedifference between current assets and current liabilities.It is an indicator of a company’s liquidity.
Price/earnings ratio The ratio of market price to earnings, obtained bydividing the stock’s high and low market price for theyear by earnings per share (before extraordinary items).It essentially indicates the value investors place on acompany’s earnings.
Dividend payout ratioThis is the percentage of earnings paid out in dividends.It is calculated by dividing the annual dividend by theearnings. Dividends are generally total cash paymentsper share over a 12-month period. Although payments areusually calculated from the ex-dividend dates, they mayalso be reported on a declared basis where this has beenestablished to be a company’s payout policy.
Dividend yield The total cash dividend payments divided by the year’shigh and low market prices for the stock.
Earnings per shareThe amount a company reports as having been earnedfor the year (based on generally accepted accountingstandards), divided by the number of shares outstanding.Amounts reported in Industry Surveys excludeextraordinary items.
Tangible book value per shareThis measure indicates the theoretical dollar amount per common share one might expect to receive shouldliquidation take place. Generally, book value isdetermined by adding the stated (or par) value of thecommon stock, paid-in capital, and retained earnings,then subtracting intangible assets, preferred stock atliquidating value, and unamortized debt discount. Thisamount is divided by the number of outstanding shares to get book value per common share.
Share price This shows the calendar-year high and low of a stock’smarket price.
In addition to the footnotes that appear at the bottom ofeach page, you will notice some or all of the following:NA—Not available.NM—Not meaningful.NR—Not reported.AF—Annual figure. Data are presented on an annualbasis.CF—Combined figure. In this case, data are not availablebecause one or more components are combined withother items.
DEFINITIONS FOR COMPARATIVE COMPANY ANALYSIS TABLES
NO
VEM
BER
22,
200
7 /
AIR
LIN
ES I
ND
US
TRY
SU
RV
EY
35
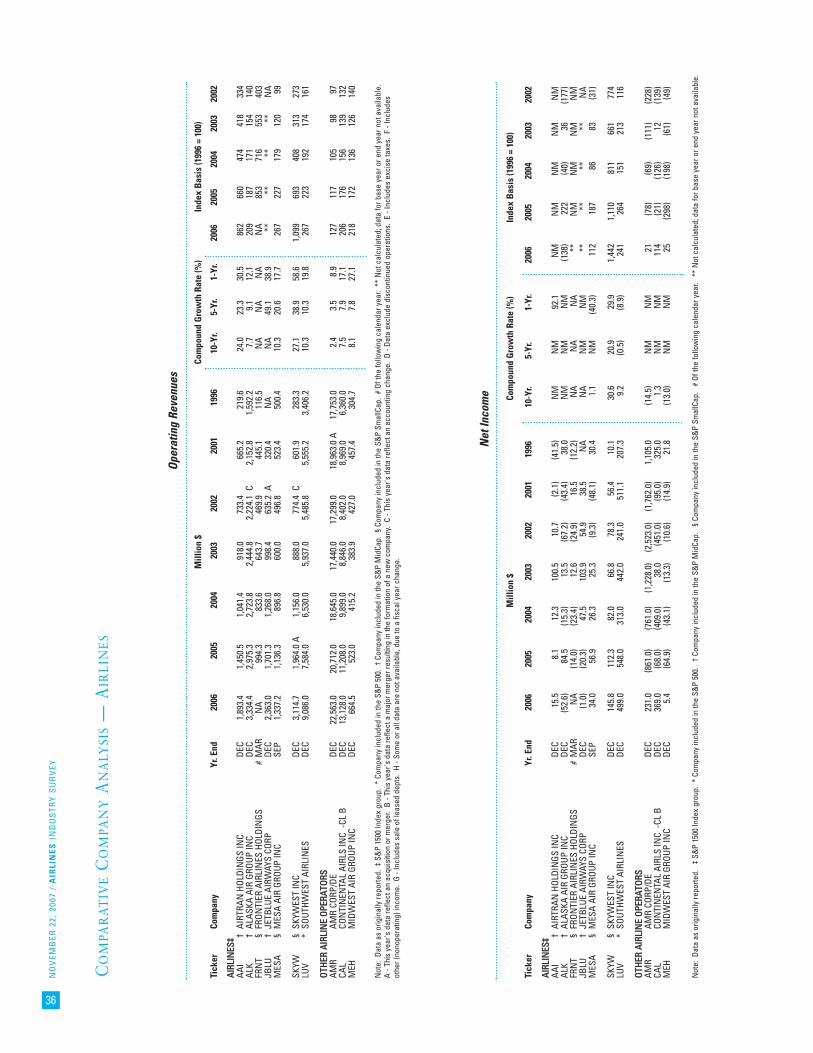
NO
VEM
BER
22,
200
7 /
AIR
LIN
ES I
ND
US
TRY
SU
RV
EY
36
CO
MPA
RA
TIV
EC
OM
PAN
YA
NA
LYSI
S—
AIR
LIN
ES
AAIIRRLL
IINNEESS
‡‡AA
I†
AIRT
RAN
HOL
DIN
GS IN
CDE
C1,
893.
4 1,
450.
5 1,
041.
4 91
8.0
733.
4
665.
2 21
9.6
24.0
23
.3
30.5
86
2 66
0 47
4 41
8 33
4 AL
K†
ALAS
KA A
IR G
ROUP
INC
DEC
3,33
4.4
2,97
5.3
2,72
3.8
2,44
4.8
2,22
4.1
C2,
152.
8 1,
592.
2 7.
7 9.
1 12
.1
209
187
171
154
140
FRN
T§
FRON
TIER
AIR
LIN
ES H
OLDI
NGS
#M
ARN
A99
4.3
833.
6 64
3.7
469.
9
445.
1 11
6.5
NA
NA
NA
NA
853
716
553
403
JBLU
†JE
TBLU
E AI
RWAY
S CO
RPDE
C2,
363.
0 1,
701.
3 1,
268.
0 99
8.4
635.
2 A
320.
4 N
AN
A49
.1
38.9
**
****
**N
AM
ESA
§M
ESA
AIR
GROU
P IN
CSE
P1,
337.
2 1,
136.
3 89
6.8
600.
0 49
6.8
52
3.4
500.
4 10
.3
20.6
17
.7
267
227
179
120
99
SKYW
§SK
YWES
T IN
CDE
C3,
114.
7 1,
964.
0 A
1,15
6.0
888.
0 77
4.4
C60
1.9
283.
3 27
.1
38.9
58
.6
1,09
9 69
3 40
8 31
3 27
3 LU
V*
SOUT
HWES
T AI
RLIN
ESDE
C9,
086.
0 7,
584.
0 6,
530.
0 5,
937.
0 5,
485.
8
5,55
5.2
3,40
6.2
10.3
10
.3
19.8
26
7 22
3 19
2 17
4 16
1
OOTTHHEE
RR AAII
RRLLIINN
EE OOPP
EERRAATT
OORRSS
AMR
AMR
CORP
/DE
DEC
22,5
63.0
20
,712
.0
18,6
45.0
17
,440
.0
17,2
99.0
18
,963
.0 A
17,7
53.0
2.
4 3.
5 8.
9 12
7 11
7 10
5 98
97
CA
LCO
NTI
NEN
TAL
AIRL
S IN
C -C
L B
DEC
13,1
28.0
11
,208
.0
9,89
9.0
8,84
6.0
8,40
2.0
8,
969.
0 6,
360.
0 7.
5 7.
9 17
.1
206
176
156
139
132
MEH
MID
WES
T AI
R GR
OUP
INC
DEC
664.
5 52
3.0
415.
2 38
3.9
427.
0
457.
4 30
4.7
8.1
7.8
27.1
21
8 17
2 13
6 12
6 14
0
Oper
atin
g Re
venu
es
Mill
ion
$Co
mpo
und
Gro
wth
Rat
e (%
)In
dex
Bas
is (1
996
= 10
0)
Not
e: D
ata
as o
rigin
ally
repo
rted.
‡ S
&P
1500
Inde
x gr
oup.
* C
ompa
ny in
clud
ed in
the
S&P
500.
† C
ompa
ny in
clud
ed in
the
S&P
Mid
Cap.
§ C
ompa
ny in
clud
ed in
the
S&P
Smal
lCap
. #
Of th
e fo
llow
ing
cale
ndar
yea
r. *
* N
ot c
alcu
late
d; d
ata
for b
ase
year
or e
nd y
ear n
ot a
vaila
ble.
A - T
his
year
's d
ata
refle
ct a
n ac
quis
ition
or m
erge
r. B
- Th
is y
ear's
dat
a re
flect
a m
ajor
mer
ger r
esul
ting
in th
e fo
rmat
ion
of a
new
com
pany
. C
- Thi
s ye
ar's
dat
a re
flect
an
acco
untin
g ch
ange
. D
- Dat
a ex
clud
e di
scon
tinue
d op
erat
ions
. E
- Inc
lude
s ex
cise
taxe
s. F
- In
clud
esot
her (
nono
pera
ting)
inco
me.
G -
Incl
udes
sal
e of
leas
ed d
epts
. H
- Som
e or
all
data
are
not
ava
ilabl
e, d
ue to
a fi
scal
yea
r cha
nge.
Tick
erCo
mpa
nyYr
. End
2006
2005
2004
2003
2002
2001
1996
10-Y
r.5-
Yr.
1-Yr
.20
0620
0520
0420
0320
02
AAIIRRLL
IINNEESS
‡‡AA
I†
AIRT
RAN
HOL
DIN
GS IN
CDE
C15
.5
8.1
12.3
10
0.5
10.7
(2
.1)
(41.
5)N
MN
M92
.1
NM
NM
NM
NM
NM
ALK
†AL
ASKA
AIR
GRO
UP IN
CDE
C(5
2.6)
84.5
(1
5.3)
13.5
(6
7.2)
(43.
4)38
.0
NM
NM
NM
(138
)22
2 (4
0)36
(1
77)
FRN
T§
FRON
TIER
AIR
LIN
ES H
OLDI
NGS
#M
ARN
A(1
4.0)
(23.
4)12
.6
(24.
9)16
.5
(12.
2)N
AN
AN
A**
NM
NM
NM
NM
JBLU
†JE
TBLU
E AI
RWAY
S CO
RPDE
C(1
.0)
(20.
3)47
.5
103.
9 54
.9
38.5
N
AN
AN
MN
M**
****
**N
AM
ESA
§M
ESA
AIR
GROU
P IN
CSE
P34
.0
56.9
26
.3
25.3
(9
.3)
(48.
1)30
.4
1.1
NM
(40.
3)11
2 18
7 86
83
(3
1)
SKYW
§SK
YWES
T IN
CDE
C14
5.8
112.
3 82
.0
66.8
78
.3
56.4
10
.1
30.6
20
.9
29.9
1,
442
1,11
0 81
1 66
1 77
4 LU
V*
SOUT
HWES
T AI
RLIN
ESDE
C49
9.0
548.
0 31
3.0
442.
0 24
1.0
511.
1 20
7.3
9.2
(0.5
)(8
.9)
241
264
151
213
116
OOTTHHEE
RR AAII
RRLLIINN
EE OOPP
EERRAATT
OORRSS
AMR
AMR
CORP
/DE
DEC
231.
0 (8
61.0
)(7
61.0
)(1
,228
.0)
(2,5
23.0
)(1
,762
.0)
1,10
5.0
(14.
5)N
MN
M21
(7
8)(6
9)(1
11)
(228
)CA
LCO
NTI
NEN
TAL
AIRL
S IN
C -C
L B
DEC
369.
0 (6
8.0)
(409
.0)
38.0
(4
51.0
)(9
5.0)
325.
0 1.
3 N
MN
M11
4 (2
1)(1
26)
12
(139
)M
EHM
IDW
EST
AIR
GROU
P IN
CDE
C5.
4 (6
4.9)
(43.
1)(1
3.3)
(10.
6)(1
4.9)
21.8
(1
3.0)
NM
NM
25
(298
)(1
98)
(61)
(49)
Net
Inco
me
Mill
ion
$Co
mpo
und
Gro
wth
Rat
e (%
)In
dex
Bas
is (1
996
= 10
0)
Tick
erCo
mpa
nyYr
. End
2006
2005
2004
2003
2002
2001
1996
10-Y
r.5-
Yr.
1-Yr
.20
0620
0520
0420
0320
02
Not
e: D
ata
as o
rigin
ally
repo
rted.
‡
S&P
1500
Inde
x gr
oup.
* C
ompa
ny in
clud
ed in
the
S&P
500.
†
Com
pany
incl
uded
in th
e S&
P M
idCa
p.
§ Co
mpa
ny in
clud
ed in
the
S&P
Smal
lCap
. #
Of t
he fo
llow
ing
cale
ndar
yea
r. *
* N
ot c
alcu
late
d; d
ata
for b
ase
year
or e
nd y
ear n
ot a
vaila
ble.
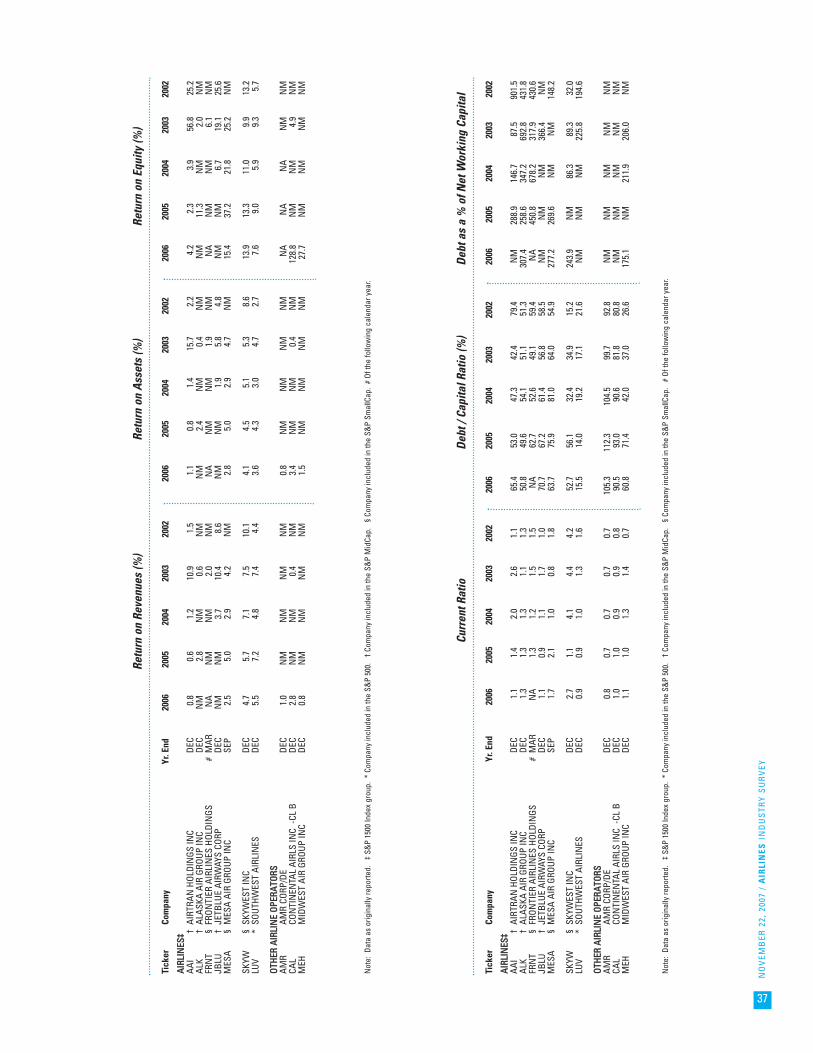
NO
VEM
BER
22,
200
7 /
AIR
LIN
ES I
ND
US
TRY
SU
RV
EY
37
Retu
rn o
n Re
venu
es (%
)Re
turn
on
Asse
ts (%
)Re
turn
on
Equi
ty (%
)
Tick
erCo
mpa
nyYr
. End
2006
2005
2004
2003
2002
2006
2005
2004
2003
2002
2006
2005
2004
2003
2002
AAIIRRLL
IINNEESS
‡‡AA
I†
AIRT
RAN
HOL
DIN
GS IN
CDE
C0.
80.
61.
210
.91.
51.
10.
81.
415
.72.
24.
22.
33.
956
.825
.2AL
K†
ALAS
KA A
IR G
ROUP
INC
DEC
NM
2.8
NM
0.6
NM
NM
2.4
NM
0.4
NM
NM
11.3
NM
2.0
NM
FRN
T§
FRON
TIER
AIR
LIN
ES H
OLDI
NGS
#M
ARN
AN
MN
M2.
0N
MN
AN
MN
M1.
9N
MN
AN
MN
M6.
1N
MJB
LU†
JETB
LUE
AIRW
AYS
CORP
DEC
NM
NM
3.7
10.4
8.6
NM
NM
1.9
5.8
4.8
NM
NM
6.7
19.1
25.6
MES
A§
MES
A AI
R GR
OUP
INC
SEP
2.5
5.0
2.9
4.2
NM
2.8
5.0
2.9
4.7
NM
15.4
37.2
21.8
25.2
NM
SKYW
§SK
YWES
T IN
CDE
C4.
75.
77.
17.
510
.14.
14.
55.
15.
38.
613
.913
.311
.09.
913
.2LU
V*
SOUT
HWES
T AI
RLIN
ESDE
C5.
57.
24.
87.
44.
43.
64.
33.
04.
72.
77.
69.
05.
99.
35.
7
OOTTHHEE
RR AAII
RRLLIINN
EE OOPP
EERRAATT
OORRSS
AMR
AMR
CORP
/DE
DEC
1.0
NM
NM
NM
NM
0.8
NM
NM
NM
NM
NA
NA
NA
NM
NM
CAL
CON
TIN
ENTA
L AI
RLS
INC
-CL
BDE
C2.
8N
MN
M0.
4N
M3.
4N
MN
M0.
4N
M12
8.8
NM
NM
4.9
NM
MEH
MID
WES
T AI
R GR
OUP
INC
DEC
0.8
NM
NM
NM
NM
1.5
NM
NM
NM
NM
27.7
NM
NM
NM
NM
Not
e: D
ata
as o
rigin
ally
repo
rted.
‡
S&P
1500
Inde
x gr
oup.
* C
ompa
ny in
clud
ed in
the
S&P
500.
†
Com
pany
incl
uded
in th
e S&
P M
idCa
p.
§ Co
mpa
ny in
clud
ed in
the
S&P
Smal
lCap
. #
Of th
e fo
llow
ing
cale
ndar
yea
r.
Curr
ent R
atio
Debt
/ Ca
pita
l Rat
io (%
)De
bt a
s a
% o
f Net
Wor
king
Cap
ital
Tick
erCo
mpa
nyYr
. End
2006
2005
2004
2003
2002
2006
2005
2004
2003
2002
2006
2005
2004
2003
2002
AAIIRRLL
IINNEESS
‡‡AA
I†
AIRT
RAN
HOL
DIN
GS IN
CDE
C1.
11.
42.
02.
61.
165
.453
.047
.342
.479
.4N
M28
8.9
146.
787
.590
1.5
ALK
†AL
ASKA
AIR
GRO
UP IN
CDE
C1.
31.
31.
31.
11.
350
.849
.654
.151
.151
.330
7.4
258.
634
7.2
692.
843
1.8
FRN
T§
FRON
TIER
AIR
LIN
ES H
OLDI
NGS
#M
ARN
A1.
31.
21.
51.
5N
A62
.752
.649
.159
.4N
A45
0.8
678.
231
7.9
430.
6JB
LU†
JETB
LUE
AIRW
AYS
CORP
DEC
1.1
0.9
1.1
1.7
1.0
70.7
67.2
61.4
56.8
58.5
NM
NM
NM
366.
4N
MM
ESA
§M
ESA
AIR
GROU
P IN
CSE
P1.
72.
11.
00.
81.
863
.775
.981
.064
.054
.927
7.2
269.
6N
MN
M14
8.2
SKYW
§SK
YWES
T IN
CDE
C2.
71.
14.
14.
44.
252
.756
.132
.434
.915
.224
3.9
NM
86.3
89.3
32.0
LUV
*SO
UTHW
EST
AIRL
INES
DEC
0.9
0.9
1.0
1.3
1.6
15.5
14.0
19.2
17.1
21.6
NM
NM
NM
225.
819
4.6
OOTTHHEE
RR AAII
RRLLIINN
EE OOPP
EERRAATT
OORRSS
AMR
AMR
CORP
/DE
DEC
0.8
0.7
0.7
0.7
0.7
105.
311
2.3
104.
599
.792
.8N
MN
MN
MN
MN
MCA
LCO
NTI
NEN
TAL
AIRL
S IN
C -C
L B
DEC
1.0
1.0
0.9
0.9
0.8
90.5
93.0
90.6
81.8
80.8
NM
NM
NM
NM
NM
MEH
MID
WES
T AI
R GR
OUP
INC
DEC
1.1
1.0
1.3
1.4
0.7
60.8
71.4
42.0
37.0
26.6
175.
1N
M21
1.9
206.
0N
M
Not
e: D
ata
as o
rigin
ally
repo
rted.
‡
S&P
1500
Inde
x gr
oup.
* C
ompa
ny in
clud
ed in
the
S&P
500.
†
Com
pany
incl
uded
in th
e S&
P M
idCa
p.
§ Co
mpa
ny in
clud
ed in
the
S&P
Smal
lCap
. #
Of t
he fo
llow
ing
cale
ndar
yea
r.
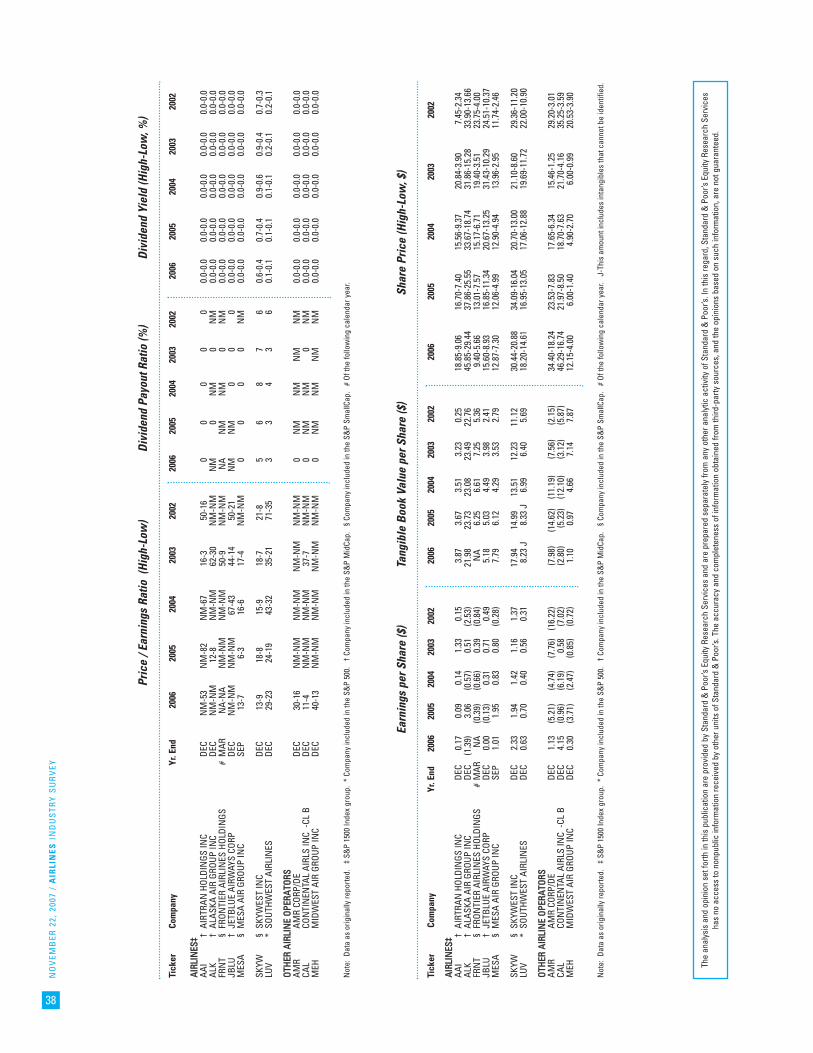
NO
VEM
BER
22,
200
7 /
AIR
LIN
ES I
ND
US
TRY
SU
RV
EY
38
Pric
e / E
arni
ngs
Ratio
(Hi
gh-L
ow)
Divi
dend
Pay
out R
atio
(%)
Divi
dend
Yie
ld (H
igh-
Low
, %)
AAIIRRLL
IINNEESS
‡‡AA
I†
AIRT
RAN
HOL
DIN
GS IN
CDE
CN
M-5
3N
M-8
2N
M-6
716
-350
-16
00
00
00.
0-0.
00.
0-0.
00.
0-0.
00.
0-0.
00.
0-0.
0AL
K†
ALAS
KA A
IR G
ROUP
INC
DEC
NM
-NM
12-8
NM
-NM
62-3
0N
M-N
MN
M0
NM
0N
M0.
0-0.
00.
0-0.
00.
0-0.
00.
0-0.
00.
0-0.
0FR
NT
§FR
ONTI
ER A
IRLI
NES
HOL
DIN
GS#
MAR
NA-
NA
NM
-NM
NM
-NM
50-9
NM
-NM
NA
NM
NM
0N
M0.
0-0.
00.
0-0.
00.
0-0.
00.
0-0.
00.
0-0.
0JB
LU†
JETB
LUE
AIRW
AYS
CORP
DEC
NM
-NM
NM
-NM
67-4
344
-14
50-2
1N
MN
M0
00
0.0-
0.0
0.0-
0.0
0.0-
0.0
0.0-
0.0
0.0-
0.0
MES
A§
MES
A AI
R GR
OUP
INC
SEP
13-7
6-3
16-6
17-4
NM
-NM
00
00
NM
0.0-
0.0
0.0-
0.0
0.0-
0.0
0.0-
0.0
0.0-
0.0
SKYW
§SK
YWES
T IN
CDE
C13
-918
-815
-918
-721
-85
68
76
0.6-
0.4
0.7-
0.4
0.9-
0.6
0.9-
0.4
0.7-
0.3
LUV
*SO
UTHW
EST
AIRL
INES
DEC
29-2
324
-19
43-3
235
-21
71-3
53
34
36
0.1-
0.1
0.1-
0.1
0.1-
0.1
0.2-
0.1
0.2-
0.1
OOTTHHEE
RR AAII
RRLLIINN
EE OOPP
EERRAATT
OORRSS
AMR
AMR
CORP
/DE
DEC
30-1
6N
M-N
MN
M-N
MN
M-N
MN
M-N
M0
NM
NM
NM
NM
0.0-
0.0
0.0-
0.0
0.0-
0.0
0.0-
0.0
0.0-
0.0
CAL
CON
TIN
ENTA
L AI
RLS
INC
-CL
BDE
C11
-4N
M-N
MN
M-N
M37
-7N
M-N
M0
NM
NM
0N
M0.
0-0.
00.
0-0.
00.
0-0.
00.
0-0.
00.
0-0.
0M
EHM
IDW
EST
AIR
GROU
P IN
CDE
C40
-13
NM
-NM
NM
-NM
NM
-NM
NM
-NM
0N
MN
MN
MN
M0.
0-0.
00.
0-0.
00.
0-0.
00.
0-0.
00.
0-0.
0
Tick
erCo
mpa
nyYr
. End
2006
2005
2004
2003
2002
2006
2005
2004
2003
2002
2006
2005
2004
2003
2002
Not
e: D
ata
as o
rigin
ally
repo
rted.
‡
S&P
1500
Inde
x gr
oup.
* C
ompa
ny in
clud
ed in
the
S&P
500.
†
Com
pany
incl
uded
in th
e S&
P M
idCa
p.
§ Co
mpa
ny in
clud
ed in
the
S&P
Smal
lCap
. #
Of t
he fo
llow
ing
cale
ndar
yea
r.
Earn
ings
per
Sha
re ($
)Ta
ngib
le B
ook
Valu
e pe
r Sha
re ($
)Sh
are
Pric
e (H
igh-
Low
, $)
AAIIRRLL
IINNEESS
‡‡AA
I†
AIRT
RAN
HOL
DIN
GS IN
CDE
C0.
17
0.09
0.
14
1.33
0.
15
3.87
3.
67
3.51
3.
23
0.25
18
.85-
9.06
16.7
0-7.
4015
.56-
9.37
20.8
4-3.
907.
45-2
.34
ALK
†AL
ASKA
AIR
GRO
UP IN
CDE
C(1
.39)
3.06
(0
.57)
0.51
(2
.53)
21.9
8 23
.73
23.0
8 23
.49
22.7
6 45
.85-
29.4
437
.86-
25.5
533
.67-
18.7
431
.86-
15.2
833
.90-
13.6
6FR
NT
§FR
ONTI
ER A
IRLI
NES
HOL
DIN
GS#
MAR
NA
(0.3
9)(0
.66)
0.39
(0
.84)
NA
6.25
6.
61
7.25
5.
36
9.40
-5.6
613
.01-
7.57
15.1
7-6.
7119
.40-
3.51
23.7
5-4.
00JB
LU†
JETB
LUE
AIRW
AYS
CORP
DEC
0.00
(0
.13)
0.31
0.
71
0.49
5.
18
5.03
4.
49
3.98
2.
41
15.6
0-8.
9316
.85-
11.3
420
.67-
13.2
531
.43-
10.2
924
.51-
10.3
7M
ESA
§M
ESA
AIR
GROU
P IN
CSE
P1.
01
1.95
0.
83
0.80
(0
.28)
7.79
6.
12
4.29
3.
53
2.79
12
.87-
7.30
12.0
6-4.
9912
.90-
4.94
13.9
6-2.
9511
.74-
2.46
SKYW
§SK
YWES
T IN
CDE
C2.
33
1.94
1.
42
1.16
1.
37
17.9
4 14
.99
13.5
1 12
.23
11.1
2 30
.44-
20.8
834
.09-
16.0
420
.70-
13.0
021
.10-
8.60
29.3
6-11
.20
LUV
*SO
UTHW
EST
AIRL
INES
DEC
0.63
0.
70
0.40
0.
56
0.31
8.
23 J
8.33
J6.
99
6.40
5.
69
18.2
0-14
.61
16.9
5-13
.05
17.0
6-12
.88
19.6
9-11
.72
22.0
0-10
.90
OOTTHHEE
RR AAII
RRLLIINN
EE OOPP
EERRAATT
OORRSS
AMR
AMR
CORP
/DE
DEC
1.13
(5
.21)
(4.7
4)(7
.76)
(16.
22)
(7.9
8)(1
4.62
)(1
1.19
)(7
.56)
(2.1
5)34
.40-
18.2
423
.53-
7.83
17.6
5-6.
3415
.46-
1.25
29.2
0-3.
01CA
LCO
NTI
NEN
TAL
AIRL
S IN
C -C
L B
DEC
4.15
(0
.96)
(6.1
9)0.
58
(7.0
2)(2
.80)
(5.2
3)(1
2.10
)(3
.12)
(5.8
7)46
.29-
16.7
421
.97-
8.50
18.7
0-7.
6321
.70-
4.16
35.2
5-3.
59M
EHM
IDW
EST
AIR
GROU
P IN
CDE
C0.
30
(3.7
1)(2
.47)
(0.8
5)(0
.72)
1.10
0.
97
4.66
7.
14
7.87
12
.15-
4.00
6.00
-1.4
04.
90-2
.70
6.00
-0.9
920
.53-
3.90
Tick
erCo
mpa
nyYr
. End
2006
2005
2004
2003
2002
2006
2005
2004
2003
2002
2006
2005
2004
2003
2002
Not
e: D
ata
as o
rigin
ally
repo
rted.
‡
S&P
1500
Inde
x gr
oup.
* C
ompa
ny in
clud
ed in
the
S&P
500.
†
Com
pany
incl
uded
in th
e S&
P M
idCa
p.
§ Co
mpa
ny in
clud
ed in
the
S&P
Smal
lCap
. #
Of t
he fo
llow
ing
cale
ndar
yea
r. J
-Thi
s am
ount
incl
udes
inta
ngib
les
that
can
not b
e id
entif
ied.
The
anal
ysis
and
opi
nion
set
forth
in th
is p
ublic
atio
n ar
e pr
ovid
ed b
y St
anda
rd &
Poo
r’s E
quity
Res
earc
h Se
rvic
es a
nd a
re p
repa
red
sepa
rate
ly fr
om a
ny o
ther
ana
lytic
act
ivity
of S
tand
ard
& P
oor’s
. In
this
rega
rd, S
tand
ard
& P
oor’s
Equ
ity R
esea
rch
Serv
ices
has
no a
cces
s to
non
publ
ic in
form
atio
n re
ceiv
ed b
y ot
her u
nits
of S
tand
ard
& P
oor’s
. The
acc
urac
y an
d co
mpl
eten
ess
of in
form
atio
n ob
tain
ed fr
om th
ird-p
arty
sou
rces
, and
the
opin
ions
bas
ed o
n su
ch in
form
atio
n, a
re n
ot g
uara
ntee
d.


Standard & Poor’sINDUSTRY SURVEYS
55 Water StreetNew York, NY 10041
Advertising
Aerospace & Defense
Agribusiness
Airlines
Alcoholic Beverages & Tobacco
Apparel & Footwear
Autos & Auto Parts
Banking
Biotechnology
Broadcasting & Cable
Chemicals
Communications Equipment
Computers: Commercial Services
Computers: Consumer Services &
the Internet
Computers: Hardware
Computers: Software
Computers: Storage & Peripherals
Electric Utilities
Environmental & Waste Management
Financial Services: Diversified
Foods & Nonalcoholic Beverages
Healthcare: Facilities
Healthcare: Managed Care
Healthcare: Pharmaceuticals
Healthcare: Products & Supplies
Heavy Equipment & Trucks
Homebuilding
Household Durables
Household Nondurables
Industrial Machinery
Insurance: Life & Health
Insurance: Property-Casualty
Investment Services
Lodging & Gaming
Metals: Industrial
Movies & Home Entertainment
Natural Gas Distribution
Oil & Gas: Equipment & Services
Oil & Gas: Production & Marketing
Paper & Forest Products
Publishing
REITs
Restaurants
Retailing: General
Retailing: Specialty
Savings & Loans
Semiconductor Equipment
Semiconductors
Supermarkets & Drugstores
Telecommunications: Wireless
Telecommunications: Wireline
Transportation: Commercial
Advertising/Asia, Europe
Aerospace & Defense/Europe
Airlines/Asia, Europe
Autos & Auto Parts/Asia, Europe
Banking/Asia, Europe, Latin America
Biotechnology/Asia, Europe
Broadcasting & Cable/Asia, Europe
Chemicals/Asia, Europe
Communications Equipment/Asia, Europe
Computers: Hardware/Asia
Construction & Engineering/Asia, Europe
Consumer Electronics/Asia
Electric Utilities/Asia, Europe
Foods & Nonalcoholic Beverages/Asia, Europe
Healthcare: Pharmaceuticals/Asia, Europe
Healthcare: Products & Supplies/Asia, Europe
Industrial Machinery/Asia, Europe
Insurance: Life & Health/Asia, Europe
Insurance: Property-Casualty/Asia, Europe
Investment Services/Asia, Europe
Oil & Gas: Production & Marketing/Asia, EMEA, Latin America
Publishing/Asia, Europe
Real Estate/Asia, Europe
Retailing: Specialty/Asia, Europe
Supermarkets & Drugstores/Asia, Europe
Telecommunications: Wireless/Asia, Europe, Latin America
Transportation: Commercial/Asia, Europe
Topics Covered by
INDUSTRY SURVEYS
GLOBAL INDUSTRY SURVEYS
Each of the topics listed above is the exclusive subject of an issue of Industry Surveys or Global Industry Surveys. To order an issue or receive subscription information, please call (800) 221-5277.
For information about Industry Surveys and Global Industry Surveys, please call (800) 523-4534.
Industry/Region Industry/Region