Embed Size (px)
Citation preview

8/20/2019 Soyez Et Al 2006 Motivation and Readiness for Therapeutic Community Treatment Psychometric Evaluation of the…
http://slidepdf.com/reader/full/soyez-et-al-2006-motivation-and-readiness-for-therapeutic-community-treatment 1/12
Regular article
Motivation and readiness for therapeutic community treatment:
Psychometric evaluation of the Dutch translation of the Circumstances,
Motivation, Readiness, and Suitability scales
Veerle Soyeza,4, George De Leon b, Yves Rosseelc, Eric Broekaert a
a Department of Orthopedagogics, Ghent University, H. Dunantlaan 2, 9000 Gent, Belgium
bCenter for Therapeutic Community Research (CTCR), National Development and Research Institutes, Inc., 71 West 23rd street, New York, NY 10010, USAc Department of Data Analysis, Ghent University, H. Dunantlaan 1, 9000 Gent, Belgium
Received 15 April 2005; received in revised form 16 January 2006; accepted 8 February 2006
Abstract
There is empirical evidence that treatment motivation and readiness are closely linked to retention. Several instruments have been
developed to measure these concepts; such instruments can reliably assess the stages of motivation and readiness, and predict treatment
retention and outcome. However, limited efforts have been undertaken in Europe to translate those instruments and to determine their
reliability and validity. In this study, the psychometric properties of a Dutch translation of the Circumstances, Motivation, Readiness,
and Suitability (CMRS) scales by De Leon and Jainchill [Journal of Psychoactive Drugs 8 (1986) 203–208] and the shortened CMR
Intake Version are illustrated in a Flemish sample of therapeutic community residents (n = 207). Exploratory factor analyses confirm three
CMR subscales, although confirmatory factor analysis reveals only a moderate fit for both the CMRS and the CMR. In contrast, the
predictive power of the instrument is strong, specifically for 1-year retention. Significant correlations were found between CMRS measures
and age, drug severity, legal referral, and social problems. It is concluded that the Dutch translation of the CMRS and the CMR can be
employed as a valid indicator of treatment motivation and readiness, although additional research concerning factorial structures is needed.
D 2006 Elsevier Inc. All rights reserved.
Keywords: Treatment readiness and motivation; Assessment; Therapeutic communities; Psychometric properties; CMRS
1. Introduction
Retention has always been an important issue in
substance abuse treatment: Longer retention generally
predicts better follow-up results (Simpson, Joe, Broome,
et al., 1997; Simpson, Joe, & Brown, 1997). This is
not different for therapeutic communities (TCs): Severalstudies have illustrated that the effectiveness of TC treat-
ment is highly correlated with retention (Condelli, 1994;
Condelli & De Leon, 1993; Condelli & Hubbard, 1994; De
Leon, 1991; Kooyman, 1993). Parallel to this finding,
numerous researchers started looking for factors influencing
dropout and retention. Since the beginning of the 1980s,
dynamic variables—specifically motivation and readiness
t o change—have been considered crucial in this context
(Condelli & De Leon, 1993). Clients’ motivational status
has been found to be a consistent predictor of retention in
different treatment modalities (Cox & Klinger, 1988; De
Leon, Melnick, Kressel, & Jainchill, 1994; Joe, Simpson, &
Broome, 1998; Ryan, Plant, & O’Malley, 1995; Simpson &Joe, 1993). More recently, the role of motivation in the
treatment process has also been studied (Cox & Klinger,
1988; De Leon et al., 1994; Ryan et al., 1995; Simpson &
Joe, 1993).
In line with the growing acceptance of treatment
motivation and readiness as vital factors for treatment
retention, a number of instruments that are able to measure
these concepts have been developed in research on smoking
and alcoholism, methadone maintenance treatment, and TC
0740-5472/06/$ – see front matter D 2006 Elsevier Inc. All rights reserved.
doi:10.1016/j.jsat.2006.02.007
4 Corresponding author. Tel.: +32 9 264 63 64; fax: +32 9 264 64 91.
E-mail address: [email protected] (V. Soyez).
Journal of Substance Abuse Treatment 30 (2006) 297–308

8/20/2019 Soyez Et Al 2006 Motivation and Readiness for Therapeutic Community Treatment Psychometric Evaluation of the…
http://slidepdf.com/reader/full/soyez-et-al-2006-motivation-and-readiness-for-therapeutic-community-treatment 2/12
treatment (for a more elaborate overview, see NEDTAC,
1999). There is evidence that these instruments can reliably
assess the stages of motivation and readiness, and predict
treatment retention and outcome. One of the first existing
scales is the University of Rhode Island Change Assessment
(URICA) scale (McConnaughy, Prochaska, & Velice, 1983),
a general stages-of-change model that was initially gener-ated for measuring motivation in smokers and alcoholics.
Like the URICA, the Stages of Change Readiness and
Treatment Eagerness Scale (Miller & Toningan, 1996)
focuses on the stages of change developed by Prochaska,
DiClemente, and Norcross (1993); the instrument was
developed for use in alcohol treatment programs, but it
was later adapted for cocaine users and other drug users.
Other well-known instruments that were originally con-
structed to measure motivation in alcohol populations are
t he following: the Readiness to Change Questionnaire
(Heather, Gold, & Rollnick, 1991), the Motivational
Structure Questionnaire (Cox & Klinger, 1988), and theTreatment Motivation Questionnaire (Ryan et al., 1995).
The Circumstances, Motivation, Readiness, and Suitability
(CMRS) scales (De Leon & Jainchill, 1986) and the TCU
Motivation for Treatment scale (Simpson & Joe, 1993),
which have common roots and are conceptually related
(De Leon & Jainchill, 1986; De Leon, Melnick, & Hawke,
2000; Joe et al., 1998), were developed to measure
motivation and treatment readiness in abusers of illegal
substances. Although the CMRS was originally designed for
use in a specific setting (i.e., TCs), it also proved to be
applicable in other settings.
All of the instruments previously mentioned were
developed for and validated in North American populations.Research with those instruments offered empirical evidence
for theoretical and clinical assumptions about treatment
motivation and readiness, and their influences on retention.
This link between motivation and treatment retention was
easily accepted in Europe, although limited efforts have
been undertaken there to formally measure motivational
concepts. Until a few years ago, hardly any new instruments
were developed; existing instruments were only translated
occasionally, and psychometric characteristics were deter-
mined to a limited extent. However, such studies might
be important because the European drug scene clearly
differs from the American scene. For example, problemdrug users in the European Union are still mostly primary
opiate users; the prevalence of cocaine and crack use is
considerably lower than in the United States, except in some
large cities in S pain, Germany, and The Netherlands
(EMCDDA, 2003).
In the last 5 years, there had been some initiatives in
Dutch-speaking countries to translate and validate a number
of existing motivation and readiness instruments (De
Fuentes-Merillas, De Jong, & Schippers, 2002; De Jonge,
Schaap, & Schippers, 2002; De Weert-Van Oene, Schippers,
De Jong, & Schrijvers, 2002; Franken & Hendricks, 1999).
In this study, the psychometric properties (reliability, factor
structure, and validity) of a Dutch translation of the CMRS
scales of De Leon and Jainchill (1986) and the shortened
CMR Intake Version (De Leon et al., 1994; De Leon,
Melnick, Thomas, Kressel, & Wexler, 2000) are illustrated
in a Flemish sample of substance abusers. The CMR is an
18-item factored version derived from the original 42-item
CMRS in which the Suitability (S) scale was eliminatedand the other scales were shortened. Whereas the Circum-
stances (C), Motivation (M), and Readiness (R) scales are
general measures of motivation for t reatment, the S-scale is
specific to long-term TC treatment (Melnick, Hawke, & De
Leon, 2003).
The CMRS and the CMR are self-administered instru-
ments and employ Likert-type items rated on a 5-point scale
ranging from 1 = strongly disagree to 5 = strongly agree .
The items in the C-scale measure external conditions or
reasons that influence people to seek treatment, such as
actual losses and fears regarding negative events. After
factor analysis, it became clear that two C-scales could beidentified: external b pressure to ent er treatment Q and
external b pressure to leave treatment Q (De Leon, Melnick,
Thomas, et al., 2000). Motivational items evaluate a client’s
inner reasons for change. The readiness items assess the
perceived need for treatment as opposed to other self-change
options, such as self-reliance (will power) and use of
external supports (De Leon et al., 1994). Suitability items
(only CMRS) examine the perceived applicability of
residential TC treatment. In studies wherein the 42-item
version of the CMRS was used, a linear relationship
between motivation and both short-term and long-term
retention in a large urban TC was illustrated (De Leon et al.,
1994). The predictive validity of the CMRS was confirmedin additional studies among various ethnic groups (De Leon,
Melnick, Schoket, & Jainchill, 1993), age groups (Melnick,
De Leon, Hawke, Jainchill, & Kressel, 1997), and abusers
of different illegal substances (De Leon, Melnick, &
Kressel, 1997). CMR scales were factor-analyzed and
proved to be unidimensional (motivation and readiness) or
bidimensional (circumstances) for several subgroups of
substance abusers; the scales had good (predictive) validity
(Melnick et al., 2003).
As mentioned before, the CMR(S) had already been
tr anslated into Dutch and used in some research projects
(Franken & Hendricks, 1999; P. Peters, H. Nijman, &T. Schuurmans, personal communication, September 13,
1996). In Franken and Hendricks (1999), it was shown
that clients with negative inpatient detoxification outcome
(i.e., who were not referred to further treatment) were more
likely to perceive (at the start of their detoxification) that
they were less suitable for long-term residential treatment
than clients with a positive outcome. In a second study
(P. Peters, H. Nijman, & T. Schuurmans, personal commu-
nication, September 13, 1996), significant correlations
were found between retention and motivation, readiness,
and the total CMRS score for clients entering detoxification
units. However, the psychometric properties of this Dutch
V. Soyez et al. / Journal of Substance Abuse Treatment 30 (2006) 297–308298

8/20/2019 Soyez Et Al 2006 Motivation and Readiness for Therapeutic Community Treatment Psychometric Evaluation of the…
http://slidepdf.com/reader/full/soyez-et-al-2006-motivation-and-readiness-for-therapeutic-community-treatment 3/12
translation of the CMRS were never established. The
purpose of our study is, therefore, to test if the motivation
and readiness constructs underlying the CMR(S) scales can
be found in a Flemish sample as well, and, consequently, if
the use of those instruments is useful in a European
population. The construct validity of the CMR(S) has never
been the focus of study, even in American populations. It was, therefore, an additional aim to provide data bearing
upon construct validity.
As this study was conducted in a specific long-term
residential TC setting, the CMRS was used as starting point.
2. Materials and methods
2.1. Sample
Data for this study were collected as part of a larger
research project on the influence of social networks ontreatment retention and success. The project was conducted
within four drug-free TCs in the Dutch-speaking part of
Belgium (Flanders). Two hundred sixty-seven people
(261 unique individuals) started treatment between May 1,
2000, and April 30, 2002, in one of those TCs. Thirteen
clients (5.0%) did not provide consent; of the 248 clients
who gave written informed consent to participate, 81.9%
(n = 203) completed all instruments used in this study.
Treatment reentry with more than a 6-month interval was
considered as a new treatment period; based on this line of
reasoning, four clients completed the CMRS twice. Thus,
dat a on 207 cases are reported in this study.
Table 1 gives an overview of the main client character-istics. Significant differences between TCs were found for
age (slightly older residents in TC4), F (3, 201) = 3.20,
p b .05, and sex ratio (more women in TC1 and TC3
compared to TC2 and TC4), v2(3) = 9.29, p b .05. Low
composite scores for alcohol and drugs can be explained by
the fact that most clients were in a drug-free detoxification
unit 30 days before entering the TC, so they did not have the
possibility of using any drugs for some weeks.
The 45 clients who are not included in the study are
mainly early dropouts (dropout within the first 14 days)
(see Table 1).
The four TCs in the study are traditional long-termtreatment modalities with a planned duration of stay
between 12 and 14 months. The mean time in program
(TIP) for our sample was about 8 months (242 days,
SD = 184 days), with a median of about 6 months
(188 days). There were no significant differences between
the four TCs for treatment retention, and neither for the
absolute number of days (TIP), F (3, 203) = 1.88, p = .13,
nor for the logarithm of TIP (LogTIP), F (3, 203) V 1.
Almost 8% of the clients in the study (7.7%) had left
treatment within the first 30 days; 25.6% of them had
dropped out after 3 months. After 1 year, 72.9% of the
clients had left the TC.
Despite some specific program characteristics, all four
centers follow traditional TC principles, as described in the
literature (De Leon, 2000; Kooyman, 1993).
2.2. Instruments
For the purpose of this study, the original CMR(S) wastranslated by three independent translators. The three
versions were compared and integrated into one; this
integrated version was subject to backtranslation.
All items of the original 42-item CMRS and the 18-item
version CMR were initially maintained. For the CMRS, this
means that there are eight items in the C-scale, 12 in the
M-scale, 8 in the R-scale, and 14 in the S-scale. The C-scale
of the CMR contains six items (three in C1 and three in C2),
the M-scale contains five items, and the R-scale contains
seven items.
Correlations between the CMR and the CMRS were
measured. The correlation between the 18-item and the42-item instruments was .92 (total score), with individual
scale score correlations ranging from .83 (motivation) to
.97 (readiness).
Apart from the CMR S, all clients were also interviewed
by means of EuropASI (Kokkevi & Hartgers, 1995), which
is the European adaptation of the fifth edition of the
Addiction Severity Index (McLellan, Luborsky, O’Brien,
& Woody, 1980). The EuropASI is a semistructured
interview producing a multidimensional client profile by
examining problems and their severity in seven areas of
functioning (medical health, employment/support, alcohol
use, drug use, legal problems, family/social relationships,
and psychological problems). Each of the dimensionsincludes lifetime measures, which can serve as predictor
variables, and past 30 days measures, which can serve as
baseline and outcome measures. Scoring is based on two
indices: (1) interviewers’ severity rating, which also
includes client-reported ratings of problem severity and
need for additional treatment; and (2) composite scores
(range, 0–1), which are arithmetically based indicators of
current problem severity.
Information on retention, which was made operational as
the total number of days a client stayed in primary treat-
ment, was gathered directly from treatment programs’ files.
In case of dropout followed by reentry within 30 days or less, the total TIP was the sum of days in treatment during
the respective periods. One of the treatment units in the
study has an induction phase preceding primary TC treat-
ment. As this induction phase is not a treatment phase by
itself (all clients entering this phase are assumed to enter the
TC), it was considered as TC treatment within this study.
2.3. Procedure
It was our intention to administer the CMRS within
2 weeks of admission; EuropASI interviews were adminis-
tered within the first 4 weeks of treatment. Staff members
V. Soyez et al. / Journal of Substance Abuse Treatment 30 (2006) 297–308 299

8/20/2019 Soyez Et Al 2006 Motivation and Readiness for Therapeutic Community Treatment Psychometric Evaluation of the…
http://slidepdf.com/reader/full/soyez-et-al-2006-motivation-and-readiness-for-therapeutic-community-treatment 4/12
(or occasionally a member of the research team) asked the
client, as quickly as possible after admission, for informed
consent for participation in the study and gave them
the CMRS.
The EuropASI was administered in a face-to-face inter-
view by trained staff members. In three of four TCs, the
EuropASI was part of the standard assessment procedure. In
the fourth TC, staff members were specifically trained to
conduct the interviews.
2.4. Data analysis
The analysis addressed the validity and reliability of the
instrument. As it was the aim to replicate earlier American
studies on the CMR(S), it was decided to conduct mainly
the same analyses as in those existing studies.
First, the internal structures of the four CMRS scalesand the three CMR scales were examined. An explorative
factor analysis was used to explore the dimensionality of
the scales. Principal axis extraction was conducted in the
total item pool in the first place and in each of the
dimensions separately in the second place. In addition,
confirmatory factor analysis (CFA; Jfreskog & Sfrbom,
1999) was used to study the factorial validity of the CMRS
and the CMR. In evaluating model fit, the model chi-square
statistic was supplemented with both an absolute and an
incremental fit index (Bollen, 1989; Hu & Bentler, 1998).
Absolute fit indices evaluate how well an a priori model
reproduces sample data. The root mean square error of approximation (RMSEA; Browne & Cudeck, 1993) will be
reported, for which a value of 0.06 or lower indicates a
good fit. Incremental fit indexes evaluate model fit by
comparing a target model to a baseline model. Typically,
the null model in which all the observed variables are
uncorrelated is used as a baseline model. We will report the
comparative fit index (CFI; Bentler, 1990), for which
values of 0.90 and 0.95 or higher indicate a reasonable and
a good fit, respectively (Hu & Bentler, 1999).
Because the inspection of univariate skewness and
kurtosis measures revealed that (multivariate) normality
assumption did not hold for these data, the distribution of
the test statistics to evaluate model fit might be distorted.Therefore, we used the scaled test statistic of Satorra and
Bentler (1994) to correct the normal theory statistics to yield
more accurate behaviors.
Secondly, predictive validity was addressed. Pearson
correlations between the CMR(S) and retention were
assessed ( p b .05 was considered significant). Analyses
utilized two measures of retention: a continuous variable
(the number of days in treatment) and three dichotomous
variables (1-month, 3-month, and 12-month retention as
predictors of early, intermediate, and late dropout, respec-
tively). The predictive power at 1 month, 3 months, and
12 months was analyzed using a Mantel–Haenszel test for linearity.
A number of variables from the EuropASI were also
correlated with CMR(S) scale scores to consider construct
validity. The measures used for validation were EuropASI
severity scores and a number of selected EuropASI
variables, which have been reported in the literature as
influencing motivation and readiness: age (Melnick et al.,
1997), drug severity (De Weert-Van Oene et al., 2002;
Melnick, De Leon, Thomas, Wexler , & Kressel, 2001),
criminal history (Melnick et al., 2001), and social relations
(Gerdner & Holmberg, 2000; Griffith, Knight, Joe, &
Simpson, 1998). Specifically for age, four category groups
Table 1
Client characteristics
Study sample
(n = 207)
Not included
(n = 45)
Sociodemographic data
Sex (% female) 15.1 15.6
Age [mean (SD)] 26.4 (6.32) 26.5 (5.56)
Primary drug used (%)
Opiates 20.8 –
Cocaine 6.4 –
Alcohol + drug 16.3 –
Polydrug use 41.1 –
Ever injected (%) 64.4 –
Highest level of education
(% primary school
degree or lower)
49.5 –
Legal referral (%) 37.7 –
EuropASI severity scores
[mean (SD)]
Medical health 2.47 (2.06) –
Education/employment 3.67 (1.85) –
Alcohol 3.34 (2.63) –
Drug 6.65 (1.39) –
Legal 3.69 (2.31) –
Family/social 5.01 (1.68) –
Psychological 4.35 (2.19) –
EuropASI composite scores
[mean (SD)]
Medical health .30 (0.32) –
Education/employment .92 (0.22) –
Alcohol .14 (0.21) –
Drug .17 (0.09) –
Legal .32 (0.28) –
Family/social
Family .27 (0.26) –
Social .18 (0.21) –
Psychological .13 (0.09) –
Number of days in treatment
(TIP/LogTIP)
[median (mean/ SD)]
Total group (all TCs) 188 (242/184); 2.27
(2.21/0.47)
19 (48/66); 1.28
(1.24/0.68)
TC1 217 (277/214); 2.33
(2.24/0.50) (n = 66)
4 (10/17); 0.60
(0.72/0.49) (n = 15)
TC2 189 (231/178); 2.27
(2.17/0.50) (n = 72)
23 (59/77); 1.36
(1.32/0.76) (n = 13)
TC3 199 (250/172); 2.30
(2.25/0.41) (n = 34)
84 (84/24); 1.91
(1.91/0.13) (n = 2)
TC4 163 (200/131); 2.21
(2.18/0.37) (n = 35)
34 (66/77); 1.53
(1.53/0.54) (n = 15)
V. Soyez et al. / Journal of Substance Abuse Treatment 30 (2006) 297–308300

8/20/2019 Soyez Et Al 2006 Motivation and Readiness for Therapeutic Community Treatment Psychometric Evaluation of the…
http://slidepdf.com/reader/full/soyez-et-al-2006-motivation-and-readiness-for-therapeutic-community-treatment 5/12
were constructed: b18, 19–23, 24–28, and z29 years. It
was expected that both the M-scale and the R-scale of the
CMR(S) would correlate with previously mentioned Euro-
pASI measures.
3. Results
3.1. CMRS
3.1.1. Internal consistency
3.1.1.1. Explorative factor analysis. Exploratory factor
analysis (using principal axis factoring) with Varimax
rotation of the 42 items of the CMRS yielded 11 factors
with eigenvalues greater than 1.0, explaining 55.9% of the
original variance. One factor clearly contained the majority
of suitability items (11 of 14). Three factors contained amajority of circumstances items, four factors contained most
of the motivation items, and two factors contained a
majority of the readiness items. Interpretation of the
remaining factors was less obvious.
Additional factor analyses on each of the subscales
separately yielded similar results: All of the four scales
proved to be divided in subscales. The C-scale was three-
dimensional. The three C-subscales together explained
49.6% of the variance of this scale. Eigenvalues were
3.15, 1.35, and 1.01, respectively. Item C1 (I am sure I
would go to jail if I did not enter treatment) had a negative
loading (0.461) on one of the C-subscales. The M-scale
proved to be four-dimensional; subscales had eigenvaluesof 3.63 (two items), 1.77 (three items), 1.27 (three items),
and 1.09 (two items). In total, 43.3% of the variance of
this scale was explained by those four factors together.
Again, one item (M12: I still have to change a couple of
things about myself) had a negative loading (0.477).
Both the R-scale and the S-scale were two-dimensional.
Eigenvalues were 3.82 and 1.06, and 6.06 and 1.46 on the
R-subscale and the S-subscale, respectively. The two factors
of the R-scale explain together 49.5% of the variance;
46.9% of the variance of the S-scale was explained by the
two main factors. Factor analyses indicated that the differ-
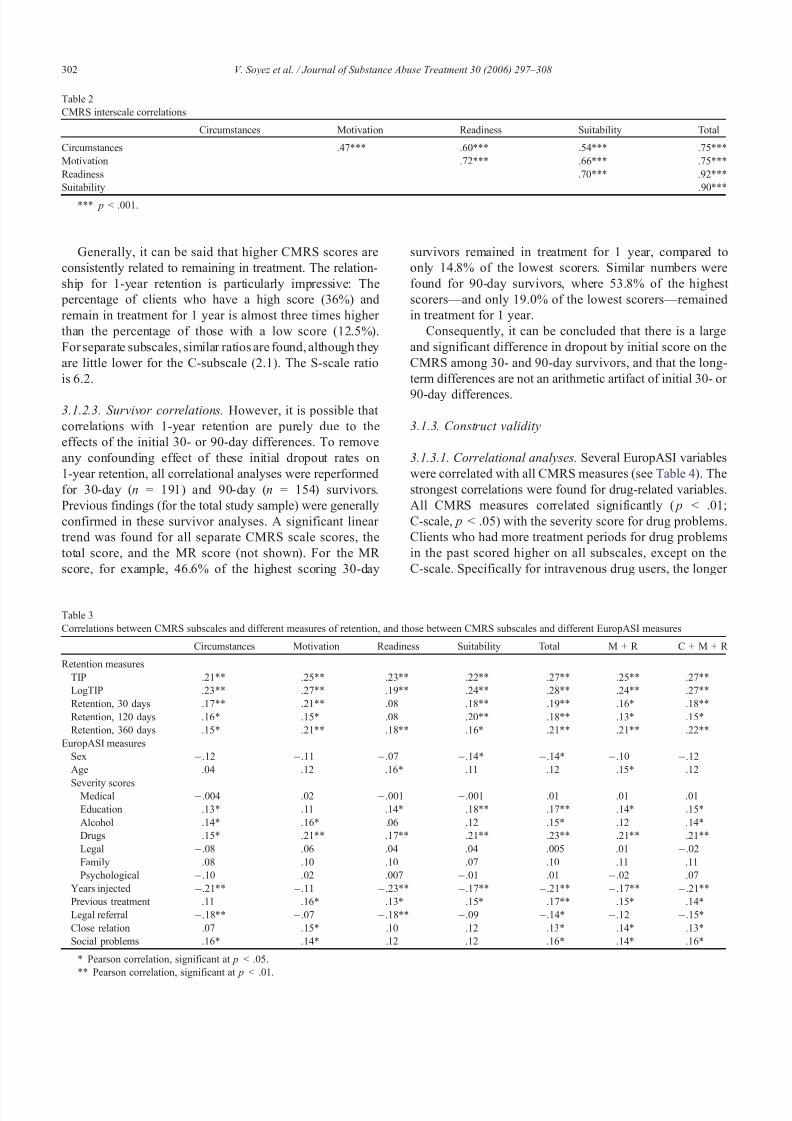
ent scales are adjacent to each other, and interscale Pearsoncorrelations confirmed this. Table 2 gives an overview of
these correlations.
3.1.1.2. Confirmative factor analysis. The factorial structure
of the full 42-item version of the CMRS was examined
using CFA. Only one a priori model was specified and
fitted to the data. This model contained four factors cor-
responding with the C-, M-, R-, and S-subscales. The fac-
tors were assumed to correlate. The fit of this model was
low to moderate, v2{SB} = 1,642, df = 813, CFI = 0.69,
RMSEA = 0.071. As the model assumed that the factors
(i.e., subscales) were homogeneous and one-dimensional,
this low fit was expected given the findings of exploratory
factor analysis, which strongly suggested that the subscales
of the CMRS were rather multidimensional. Additional
analyses in which cross-loadings among factors were
accepted did not improve marginal fit indices.
3.1.1.3. Reliability. Cronbach a coefficients for each of thefour CMRS subscales and for the total score were
calculated. The total a (.92) is high. a Coefficients for the
different subscales are .71 (circumstances), .73 (motivation),
.81 (readiness), and .88 (suitability), respectively.
3.1.2. Predictive validity
3.1.2.1. Correlational analyses. Table 3 contains the
correlations between each of the four subscales, and various
measures of retention.
For continuous retention variables, all of the TIP and
LogTIP correlations with the scores for the separate scales (C,M, R, and S) and with the total score are significant ( p b .01).
Considering the different dichotomous measures for
retention, correlations with long-term retention again
reached significance for all scores for separate scales
and for the total score ( p b .01; S-scale, p b .05).
Correlations with the R-scale were not significant for
1-month and 3-month retention; C-, M-, and S-scales, as
well as the total score, correlated significantly with short
and intermediate retention.
3.1.2.2. CMRS scores and predictive power. Previous
research with the CMRS and the CMR shows that dropout prediction is clinically meaningful when specific cutoff
scores are used (De Leon et al., 1994): The mean and the
variance of the CMRS scale scores and the total score are
utilized to classify four groups in terms of risk for dropout.
The low group (L) is composed of scores that fall 1 SD or
more below the mean. The moderately low group (ML)
consists of scores between the mean and 1 SD below the
mean. The moderately high group (MH) consists of scores
between the mean and 1 SD or more above the mean.
Finally, the high group (H) is composed of scores 1 SD or
more above the mean.
Table 4 summarizes the relationship between CMRSscores (each scale separately, the total score, and the
motivation readiness score) and 1-month, 3-month, and
1-year retention for the four group levels in the study sample
(Mantel–Haenszel test for linearity).
Significant linear relationships are shown for almost all
separate scale scores, the total score, and the motivation
readiness score at 1 month, 3 months, and 1 year. The
relationship for the R-scale is not significant at 1 and
3 months. There are only five cells that do not conform to
the correct direction (circumstances H at 1 month, total
CMRS score H at 3 months, MR score ML at 3 months, and
circumstances ML and H at 1 year).
V. Soyez et al. / Journal of Substance Abuse Treatment 30 (2006) 297–308 301
8/20/2019 Soyez Et Al 2006 Motivation and Readiness for Therapeutic Community Treatment Psychometric Evaluation of the…
http://slidepdf.com/reader/full/soyez-et-al-2006-motivation-and-readiness-for-therapeutic-community-treatment 6/12
Generally, it can be said that higher CMRS scores are
consistently related to remaining in treatment. The relation-
ship for 1-year retention is particularly impressive: The
percentage of clients who have a high score (36%) and
remain in treatment for 1 year is almost three times higher
than the percentage of those with a low score (12.5%).
For separate subscales, similar ratios are found, although they
are little lower for the C-subscale (2.1). The S-scale ratio
is 6.2.
3.1.2.3. Survivor correlations. However, it is possible that
correlations with 1-year retention are purely due to the
effects of the initial 30- or 90-day differences. To remove
any confounding effect of these initial dropout rates on
1-year retention, all correlational analyses were reperformed
for 30-day (n = 191) and 90-day (n = 154) survivors.
Previous findings (for the total study sample) were generally
confirmed in these survivor analyses. A significant linear
trend was found for all separate CMRS scale scores, the
total score, and the MR score (not shown). For the MR
score, for example, 46.6% of the highest scoring 30-day
survivors remained in treatment for 1 year, compared to
only 14.8% of the lowest scorers. Similar numbers were
found for 90-day survivors, where 53.8% of the highest
scorers—and only 19.0% of the lowest scorers—remained
in treatment for 1 year.
Consequently, it can be concluded that there is a large
and significant difference in dropout by initial score on the
CMRS among 30- and 90-day survivors, and that the long-
term differences are not an arithmetic artifact of initial 30- or
90-day differences.
3.1.3. Construct validity
3.1.3.1. Correlational analyses. Several EuropASI variables
were correlated with all CMRS measures (see Table 4). The
strongest correlations were found for drug-related variables.
All CMRS measures correlated significantly ( p b .01;
C-scale, p b .05) with the severity score for drug problems.
Clients who had more treatment periods for drug problems
in the past scored higher on all subscales, except on the
C-scale. Specifically for intravenous drug users, the longer
Table 3
Correlations between CMRS subscales and different measures of retention, and those between CMRS subscales and different EuropASI measures
Circumstances Motivation Readiness Suitability Total M + R C + M + R
Retention measures
TIP .2144 .2544 .2344 .2244 .2744 .2544 .2744
LogTIP .2344 .2744 .1944 .2444 .2844 .2444 .2744
Retention, 30 days .1744 .2144 .08 .1844 .1944 .164 .1844
Retention, 120 days .164 .154 .08 .2044 .1844 .134 .154
Retention, 360 days .154 .2144 .1844 .164 .2144 .2144 .2244
EuropASI measures
Sex .12 .11 .07 .144 .144 .10 .12
Age .04 .12 .164 .11 .12 .154 .12
Severity scoresMedical .004 .02 .001 .001 .01 .01 .01
Education .134 .11 .144 .1844 .1744 .144 .154
Alcohol .144 .164 .06 .12 .154 .12 .144
Drugs .154 .2144 .1744 .2144 .2344 .2144 .2144
Legal .08 .06 .04 .04 .005 .01 .02
Family .08 .10 .10 .07 .10 .11 .11
Psychological .10 .02 .007 .01 .01 .02 .07
Years injected .2144 .11 .2344 .1744 .2144 .1744 .2144
Previous treatment .11 .164 .134 .154 .1744 .154 .144
Legal referral .1844 .07 .1844 .09 .144 .12 .154
Close relation .07 .154 .10 .12 .134 .144 .134
Social problems .164 .144 .12 .12 .164 .144 .164
4 Pearson correlation, significant at p b .05.
44 Pearson correlation, significant at p b .01.
Table 2
CMRS interscale correlations
Circumstances Motivation Readiness Suitability Total
Circumstances .47444 .60444 .54444 .75444
Motivation .72444 .66444 .75444
Readiness .70444 .92444
Suitability .90444
444 p b .001.
V. Soyez et al. / Journal of Substance Abuse Treatment 30 (2006) 297–308302

8/20/2019 Soyez Et Al 2006 Motivation and Readiness for Therapeutic Community Treatment Psychometric Evaluation of the…
http://slidepdf.com/reader/full/soyez-et-al-2006-motivation-and-readiness-for-therapeutic-community-treatment 7/12
they had injected drugs, the lower were their scores on all
subscales (significant correlations at p b .01, except for the
M-scale). A higher severity score for alcohol problems
correlated to higher circumstances and motivation scores,
and a higher total score ( p b .05).
Legally referred clients had significant lower scores on
the C-scale and the R-scale ( p b .01) and their total score,and the C + M + R score was lower as well ( p b .05).
However, there were no significant correlations with the
severity score for legal problems, or with the total number
of lifetime arrests and total number of lifetime convictions
(not shown). Lifetime social problems (with family and
significant others) correlated positively ( p b .05) with all
scales, except with the R-scale and the S-scale. On the
contrary, positive correlations with the M-scale and the
sum scores were found for the total number of close
relations they had. The severity score for family and social
problems did not correlate with any of the CMRS
measures. The severity score for education/employment revealed positive correlations for all measures, except for
the M-scale.
Women assessed themselves as less suitable for TC
treatment and had a lower total CMRS score ( p b .05).
Older clients seemed to be more ready for treatment and had
a significantly higher MR score ( p b .05).
3.2. CMR
As the S-scale was designed to examine the perceived
applicability for residential TC treatment, it was necessary
to eliminate this subscale to make the instrument useful in
other treatment settings. The other three subscales (C, M,
and R) were subject to fact or analysis. This resulted in a
reduced pool of 18 items (De Leon, Melnick, & Hawke,
2000; De Leon, Melnick, Thomas, et al., 2000). The 18-item
factor-based CMR, instead of the CMRS, is now used in
most studies.
3.2.1. Internal consistency
3.2.1.1. Explorative factor analysis. Exploratory factor
analysis (using principal axis factoring) with Varimax
rotation of the 18 items of the CMR yielded four factors
with eigenvalues greater than 1.0, explaining 46.8% of the
original variance.
However, almost all items can be classified under the
first two factors. The first factor (explaining 15% of
the variance) contains all motivation items and a majority
of the readiness items. The second factor (explaining 14% of
the variance) contains mostly circumstances items. Theinterpretation of the last two factors is less obvious.
On the other hand, if the analysis is conducted on each
of the dimensions separately, only the C-scale proves to
Table 5
CMR interscale correlations
Circumstances Motivation Readiness Total
Circumstances .30444 .55444 .77444
Motivation .65444 .75444
Readiness .92444
444 p b .001.
Table 4
One-month, 3-month, and 1-year retention by CMRS scale scores
Low (%) Moderately low (%) Moderately high (%) High (%) Total (%)/significance
1-month retention
Circumstances 82.1 88.9 95.4 92.2 92.34
Motivation 81.3 88.9 96.3 100.0 92.3444
Readiness 85.7 90.8 93.7 97.1 92.3
Suitability 84.6 88.4 95.5 100.0 92.34
Total CMRS score 84.4 84.9 96.9 100.0 92.34
MR score 90.0 84.6 96.3 100.0 92.34
3-month retention
Circumstances 53.8 80.6 79.3 76.2 74.44
Motivation 62.5 66.7 81.7 83.3 74.44
Readiness 67.9 69.2 78.5 80.0 74.4
Suitability 57.7 65.2 83.1 87.0 74.4444
Total CMRS score 62.5 67.9 80.4 80.0 74.44
MR score 70.0 67.7 76.8 85.7 74.44 ( p = .062)
1-year retention
Circumstances 15.4 13.9 34.2 33.3 27.14
Motivation 12.5 17.5 36.6 36.7 27.14
Readiness 14.3 23.1 27.8 42.9 27.14
Suitability 7.7 21.7 31.5 47.8 27.1444
Total CMRS score 12.5 18.9 34.0 36.0 27.14
MR score 13.3 19.6 32.9 46.7 27.1444
Note: The probability value reflects linearity across the low, moderately low, moderately high, and high groups.
4 Mantel–Haenszel, significant at p b .05.
444 Mantel–Haenszel, significant at p b .01.
V. Soyez et al. / Journal of Substance Abuse Treatment 30 (2006) 297–308 303

8/20/2019 Soyez Et Al 2006 Motivation and Readiness for Therapeutic Community Treatment Psychometric Evaluation of the…
http://slidepdf.com/reader/full/soyez-et-al-2006-motivation-and-readiness-for-therapeutic-community-treatment 8/12

8/20/2019 Soyez Et Al 2006 Motivation and Readiness for Therapeutic Community Treatment Psychometric Evaluation of the…
http://slidepdf.com/reader/full/soyez-et-al-2006-motivation-and-readiness-for-therapeutic-community-treatment 9/12
remain in treatment for 1 year is 3.6 and 4.6 times,
respectively, the percentage of low scorers.
3.2.2.3. Survivor correlations. Like for the CMRS, all
correlational analyses were reperformed for 30- and 90-day
survivors to remove the confounding effects of initial
dropout rates. Significant linear trends were found for all
subscale scores, the total score, and the MR score (not
shown). The long-term predictive power of the MR score
was impressive: 50% of the highest scorers among 30-daysurvivors remained in treatment for 1 year, compared to
12.5% of the lowest scorers. Among 90-day survivors, the
difference between the two groups was 57.1% (highest
scorers) compared to 15.0% (lowest scorers).
3.2.3. Construct validity
3.2.3.1. Correlational analyses. The correlations found (see
Table 6) were largely similar to those with the CMRS.
However, less powerful correlations were found for the
education/employment severity score (only the total CMR
score was significantly correlated; p b .05). Lifetime problems with significant others and the severity score for
alcohol problems did not reveal any significant correla-
tions anymore.
Women had lower scores on C- and M-subscales
( p b .05), whereas older clients scored higher on all
subscales, except on the C-scale ( p b .001).
4. Discussion
In this study, the psychometric properties of a Dutch
translation of the CMR(S) were studied. In the first step,
the factorial structure of both the CMRS and the CMR
was addressed. The second step examined the validity of
the Dutch version. The findings for each step are dis-
cussed separately.
4.1. Factor structure
Exploratory and confirmatory factor analyses were
conducted. As the CMR is a factored version of the CMRS,
results for this instrument are of particular interest. Findingsfor exploratory factor analysis were satisfactory and in line
with the results of preliminary American studies. These
studies identified one bidimensional (circumstances) and
two unidimensional (motivation and readiness) scales in a
long-term residential sample (n = 668). This four-factor
structure was tested across other treatment samples (short-
term residential, n = 258; referral agency, n = 672;
correctional facility, n = 503) by means of confirmatory
factor analyses, which revealed f it indices ranging from
0.86 to 0.95 (Melnick et al., 2003).
In this study, exploratory factor analysis clearly sup-
ported the four-factor conceptualization of the CMR. It wasfound that the C-scale was bidimensional. However, these
two dimensions were not in accordance with the pressure-
to-enter-treatment (and pressure-to-leave-treatment) factors
that were found in studies by De Leon et al. This different
finding may probably be explained by the heterogeneity
inherent in the C-scale; although the scale generally refers to
external conditions or reasons that influence people to seek
treatment, some of the items in this scale have little in
common with each other. This may produce different results
on factor analyses in different subpopulations.
The M-scale and the R-scale were unidimensional.
When the total item pool was subject to factor analysis, the
Table 7
One-month-, 3-month, and 1-year retention by CMR scale scores
Low (%) Moderately low (%) Moderately high (%) High (%) Total (%)/significance
1-month retention
Circumstances 82.5 90.2 97.0 92.3 92.34
Motivation 84.8 91.1 95.1 94.4 92.3
Readiness 83.3 96.2 91.8 96.4 92.3
Total CMR score 85.3 88.9 96.1 92.3 92.3
MR score 85.7 80.0 95.9 100.0 92.34
3-month retention
Circumstances 53.8 85.4 80.0 65.4 74.4
Motivation 66.7 78.6 74.4 75.0 74.4
Readiness 66.7 69.2 75.3 89.3 74.44
Total CMR score 67.6 68.9 79.6 72.0 74.4
MR score 71.4 68.4 75.5 87.5 74.4
1-year retention
Circumstances 15.0 22.0 34.0 29.9 27.14 ( p = .052)
Motivation 12.1 30.4 24.4 41.7 27.14
Readiness 13.3 17.3 30.9 46.4 27.1444
Total CMR score 8.8 24.4 33.0 32.0 27.14
MR score 10.7 24.6 27.6 50.0 27.14
Note: The probability value reflects linearity across the low, moderately low, moderately high, and high groups.4 Mantel–Haenszel, significant at p b .05.
444 Mantel–Haenszel, significant at p b .001.
V. Soyez et al. / Journal of Substance Abuse Treatment 30 (2006) 297–308 305

8/20/2019 Soyez Et Al 2006 Motivation and Readiness for Therapeutic Community Treatment Psychometric Evaluation of the…
http://slidepdf.com/reader/full/soyez-et-al-2006-motivation-and-readiness-for-therapeutic-community-treatment 10/12
M-scale and the R-scale were mainly part of one single
factor. This finding suggests multicollinearity and inter-
relation between those two scales—a finding that was
confirmed by significant Pearson correlations between the
different subscales. Furthermore, such a scale correlation
can theoretically be expected (motivation reflects inner
reasons to change, which are precursors to actually seekingtreatment [readiness]) (De Leon & Jainchill, 1986; De Leon
et al., 1994) and was supported in earlier studies (De Leon
et al., 1994). Other authors have stressed the importance
of differ entiating between motivation and readiness
as well (Joe, Broome, Rowan-Szal, & Simpson, 2002).
Thus, our results support the presumption that motivation
and readiness are clearly interrelated, although sepa-
rate, constructs.
In spite of previous findings, in confirmatory factor
analyses, only a moderate fit for the tested models could
be found. The fit of the CMR was better than that of the
CMRS (although still moderate) and was lower than that reported in the literature (Melnick et al., 2003). Chi-square
test statistic was significant ( p b .001) for both models
tested. However, this statistic is extremely sensitive to
sam ple size and minor depart ures from multivariate normal-
ity (Bentler & Bonnett, 1980).
4.2. Construct validity
The present study provided impressive results supporting
the construct validity of the CMR(S) (see Tables 3 and 6).
CMR(S) scores were significantly correlated with a number
of EuropASI variables, which are in accordance with
the conceptualization of the CMR scales, as discussedin the literature (De Leon, Melnick, & Hawke, 2000).
For example, intrinsic motivation (problem recognition
and an expressed wish to change) is higher in those who
have more negative experiences associated with their drug
use. These include older clients, those with severe drug
use histories, those with more social and relational prob-
lems, and those who are not legally coerced into treatment.
Women seem to be slightly less motivated (CMR). They
perceive themselves as less suitable for TC treatment—
a finding that is in line with the conclusion of other
studies that women in TCs have specific characteristics and
treatment needs (De Leon & Jainchill, 1991; De Wilde et al.,2004; Ravndal & Vaglum, 1994). It is important to mention
in this context that suitability is not a motivational variable,
but only a treatment perception variable that can possibly
influence dropout. On the other hand, Joe et al. (2002) found
that programs with a higher concentration of women tended
to have a higher average rating of treatment readiness.
Although such interpretations are speculative in treatment
environments where more attention is given to women’s
needs, their perception of the treatment setting’s suitability
and probably their motivation and readiness may increase.
There is no agreement on the correlation between
motivation and social relations/social situation in the
literature. Although Griffith et al. (1998) suggest that
poor family relations indirectly predict higher motiva-
tion, Gerdner and Holmberg (2000) concluded that social
problems (including social relations) in alcoholics were
related to less motivation to treatment. However, those
differences may be caused by the use of divergent opera-
tional definitions of the social relationship variable. Inour study, lifetime relational problems with family and
significant others were correlated to a higher score on
several CMRS scales, but those correlations were not
confirmed for the CMR. On the other hand, the ability to
have closer relationships was clearly related to higher
motivation scores, although not to higher readiness scores.
Finally, younger clients proved to be less motivated and
r eady for treatment— a finding supported by earlier studies
(Melnick et al., 1997).
Impressive results on construct validity highlight the
potential for multidimensional strategies to understand
motivation. As suggested in the literature (e.g., De Leon,Melnick, & Hawke, 2000), studies on the development of
profiles based on combinations of EuropASI variables,
motivation readiness, and suitability variables as predictors
of retention and outcome are needed.
4.3. Predictive validity
The results in Tables 2 and 4 indicate that both the
CMRS and the CMR have good predictive validity with
respect to retention. Continuous measures of retention
revealed strong correlations with all CMR(S) subscales
and summated scores. However, in contrast to earlier studies
by De Leon et al. (1997), De Leon et al. (1994), De Leon,Melnick, Thomas, et al. (2000), and Melnick et al. (1997) in
which the CMRS and the CMR mainly predicted early
retention (30 and 90 days), in our study, predictive validity,
specifically for the CMR, was strongest for long-term
(1 year) retention.
This contrast with American studies may be partly
explained by time of testing, which yielded spuriously low
early dropout rates. The CMR(S) instrument was adminis-
tered about 2 weeks after admission. Therefore, the study
sample did not include those who left treatment within the
first 14 days, a period of char acteristically high dropout
(De Leon & Schwartz, 1984). Consequently, at 1 and3 months, there was little variance in retention: Only 7.7%
of the study sample left treatment within 1 month; after
3 months, the dropout rate was 25.7%. In American research
studies, the CMR is usually administered within 48 h of
admission, yielding higher early dro pout rates. For example,
in a study by De Leon et al. (1997), 24.7% of the clients had
already dropped out of treatment within the first 30 days,
and over 40% had dropped out by 90 days. The higher
dropout rates within the first 90 days yielded significant
CMR predictions for 3-month and 1-year retention. In this
study, the dropout at 1 year (about 63%) was sufficient to
yield better CMR predictions.
V. Soyez et al. / Journal of Substance Abuse Treatment 30 (2006) 297–308306

8/20/2019 Soyez Et Al 2006 Motivation and Readiness for Therapeutic Community Treatment Psychometric Evaluation of the…
http://slidepdf.com/reader/full/soyez-et-al-2006-motivation-and-readiness-for-therapeutic-community-treatment 11/12
The hypothesis that time of testing weakened early
predictions is supported by the data of nonparticipants (i.e.,
those who did not give consent or those without complete
data; n = 58; see also Table 1). Their inclusion into the total
sample inflates early dropout rates to levels comparable to
American studies. For example, of the total sample, 19.1%
had left treatment within 1 month; 37.5% had left treatment within 3 months. Fifty-five percent of the nonparticipant
group had left treatment in the first month. This group had a
mean retention of only 70 days (median = 19 days,
SD = 106 days) and thus stayed a significantly shorter time
in treatment compared to the study sample, t (266) = 17.98,
p b .001. Although complete CMR data were not obtained
on these early dropouts, a reasonable inference is that they
are less motivated for long-term treatment. The possible
effects of this sizeable proportion of early dropouts who are
not included in the study should be considered when
interpreting the results of the study presented here.
Finally, low variance in early dropout can also explainwhy, in case of the CMR, the C-scale is the only predictor for
early (1 month) retention. This scale reflects external
pressures on retention, which are clearly less relevant at
12 months than are intrinsic motivation and readiness factors.
Overall, psychometric findings indicate that the Dutch
version of the CMR(S) yields moderate factorial structure
and good predictive validity. This distinction deserves
additional investigations. Probably, part of the explanation
can be found in the origin of the instrument: The underlying
concepts of the CMRS and the original item pool were
conceived and developed to predict retention in TC treat-
ment. The different subscales were, in fact, not theoretically
deduced. It has been argued in the literature that such aninductive strategy of test construction renders less optimal
psychometric results than a str ategy where a deductive
approach is used (Burisch, 1984). Thus, predictive validity
could be expected, whereas obtaining confirmed factors
may be more difficult. It seems that such confirmed factors
require other items relating to broader concepts, regardless
of their predictive relevance.
A moderate factorial validity suggests that the subscales
might not be unidimensional—a condition needed for taking
summated scores. It is, therefore, recommended to improve
both time-convergent and time-divergent properties of the
scales by identifying and removing weak/conflicting items.Such analysis was performed and resulted in two revised
scales: one (based on the CMRS) containing 15 items and
another (based on the CMR) containing 12 items. The two
revised scales revealed a better fit, CMRS: v 2{SB} = 92.57,
df = 84, p = .24, CFI = 0.989, RMSEA = 0.022; CMR:
v2{SB} = 75.70, df = 51, p = .014, CFI = 0.946, RMSEA =
0.048, whereas the predictive validity of the scales largely
remained. However, as our study sample was relatively
small, which may have limited the potential for obtaining a
strong factor structure, and as there were no possibilities to
cross-validate the revised scales, it was decided not to
present the results of these analyses here. It may be more
appropriate to use the unchanged CMR scales in clinical
practice, until further study and analysis confirm the strength
of the revised scales. Based on the results of exploratory
factor analysis, the CMR is preferable to the CMRS. The
results of this analysis, together with strong predictive
validity, offer sufficient statistical support for the decision to
maintain the original scales. Specifically for TC settings, theS-scale could be added to the CMR instrument, as this
subscale proved to be powerful in predicting retention.
In conclusion, based on previous findings and in spite of
the difficulties we encountered with obtaining confirmed
factors, our conclusion is that the CMR(S) appears to be a
valid instrument for Flemish Dutch-speaking samples.
Additional research is needed to define the broader Euro-
pean applicability of the instrument. This research should be
guided by the limitations of this study. Revised scales with
better factorial validity need to be constructed and cross-
validated. However, a much larger study sample is needed to
make decisions about such scales. A larger study samplewill also meet the problem of low variance encountered at
present. Furthermore, it is important that the instrument is
administered earlier in treatment to counter low variance in
the early dropout group.
References
Bentler, P. M. (1990). Comparative fit indexes in structural models.
Psychological Bulletin, 107 , 238–246.
Bentler, P. M., & Bonnett, D. G. (1980). Significance tests and goodness-
of-fit in the analysis of covariance structures. Psychological Bulletin,
88, 588–600.
Bollen, K. A. (1989). Structural equations with latent variables. NewYork 7 Wiley.
Browne, M. W., & Cudeck, R. (1993). Alternative ways of assessing model
fit. In K. A. Bollen, & J. S. Long (Eds.), Testing structural equation
models (pp. 136–162). Newbury Park, CA7 Sage.
Burisch, M. (1984). Approaches to personality inventory construction.
American Psychologist , 39, 214–227.
Condelli, W. S. (1994). Domains of variables for understanding and
improving retention in therapeutic communities. International Journal
of the Addictions, 29, 593–607.
Condelli, W. S., & De Leon, G. (1993). Fixed and dynamic predictors of
retention in therapeutic communities. Journal of Substance Abuse
Treatment , 10, 11–16.
Condelli, W. S., & Hubbard, R. L. (1994). Client outcomes from therapeutic
communities. In N. Jainchill (Ed.), Therapeutic community: Advances
in research and application. NIDA research monograph 144 (National Institute on Drug Abuse, NIH Publication No. 94-3633) (pp. 80– 98).
Rockville, MD7 National Institute on Drug Abuse.
Cox, W. M., & Klinger, E. (1988). A motivational model of alcohol use.
Journal of Abnormal Psychology, 97 , 168– 180.
De Fuentes-Merillas, L., De Jong, C. A. J., & Schippers, G. M. (2002).
Reliability and validity of the Dutch version of the Readiness for
Change Questionnaire. Alcohol and Alcoholism, 37 , 93– 99.
De Jonge, J. M., Schaap, C. P. D. R., & Schippers, G. M. (2002). Motivatie
voor verandering: Een Nederlandse versie van de University of Rhode
Island Change Assessment (URICA-NL) [Motivation for change: A
Dutch version of the University of Rhode Island Change Assessment
(URICA-NL)]. Diagnostiek-wijzer , 5, 114– 122.
De Leon, G. (1991). Retention in drug-free therapeutic communities. In
C. R. Schuster (Ed.), Improving drug abuse treatment, NIDA research
V. Soyez et al. / Journal of Substance Abuse Treatment 30 (2006) 297–308 307

8/20/2019 Soyez Et Al 2006 Motivation and Readiness for Therapeutic Community Treatment Psychometric Evaluation of the…
http://slidepdf.com/reader/full/soyez-et-al-2006-motivation-and-readiness-for-therapeutic-community-treatment 12/12
monograph 106 (DHH Publication No. ADM 91-1754) (pp. 218–244).
Washington, DC7 U.S. Government Printing Office.
De Leon, G. (2000). The therapeutic community: Theory, model, and
method . New York 7 Springer Publishers.
De Leon, G., & Jainchill, N. (1986). Circumstances, motivation, readiness
and suitability (CMRS) as correlates of treatment tenure. Journal of
Psychoactive Drugs, 8, 203–208.
De Leon, G., & Jainchill, N. (1991). Residential therapeutic communities for females. Bulletin of the New York Academy of Medicine, 67 , 277– 290.
De Leon, G., Melnick, G., & Hawke, J. (2000). The motivation-readiness
factor in drug treatment: Implications for research and policy. In D.
Mc Bride (Ed.), Emergent issues in the field of drug abuse (vol. 7. pp.
103–129). Stamford, CT7 JAI Press Inc.
De Leon, G., Melnick, G., & Kressel, D. (1997). Motivation and readiness
for therapeutic community treatment among cocaine and other drug
abusers. American Journal of Drug and Alcohol Abuse, 23, 169– 189.
De Leon, G., Melnick, G., Kressel, D., & Jainchill, N. (1994). Circum-
stances, motivation, readiness and suitability (The CMRS scales):
Predicting retention in therapeutic community treatment. American
Journal of Drug and Alcohol Abuse, 20, 495– 515.
De Leon, G., Melnick, G., Schoket, D., & Jainchill, N. (1993). Is the
therapeutic community culturally relevant? Some findings on race/
ethnic differences in retention in treatment. Journal of Psychoactive Drugs, 8, 203– 208.
De Leon, G., Melnick, G., Thomas, G., Kressel, D., & Wexler, H. K.
(2000). Motivation for treatment in a prison-based therapeutic
community. American Journal of Drug and Alcohol Abuse, 26 , 33–46.
De Leon, G., & Schwartz, S. (1984). The therapeutic community: What are
the retention rates? American Journal of Drug and Alcohol Abuse, 10,
267–284.
De Weert-Van Oene, G. H., Schippers, G. M., De Jong, C. A. J., &
Schrijvers, J. P. (2002). Motivation for treatment in substance-
dependent patients. European Addiction Research, 8, 2– 9.
De Wilde, J., Soyez, V., Broekaert, E., Rosseel, Y., Kaplan, C., & Larsson,
J. (2004). Psychiatric profile of substance-abusing women in European
therapeutic communities. Journal of Substance Abuse Treatment , 26 ,
243–251.
European Monitoring Center for Drugs and for Drug Addiction(EMCDDA). (2003). Annual Report 2003: The state of the drug
problem in the European Union and Norway. Luxembourg7 Office for
Official Publications of the European Community.
Franken, I. H. A., & Hendricks, V. M. (1999). Predicting outcome of in
patient detoxification of substance abusers. Psychiatric Services, 50,
813–817.
Gerdner, A., & Holmberg, A. (2000). Factors affecting motivation to
treatment in severely dependent alcoholics. Journal of Studies on
Alcohol , 61, 548–560.
Griffith, J. D., Knight, D. K., Joe, G. W., & Simpson, D. D. (1998).
Implications of family and peer relations for treatment engagement and
follow-up outcomes: An integrative model. Psychology of Addictive
Behaviors, 12, 113– 126.
Heather, N., Gold, R., & Rollnick, S. (1991). Readiness to Change
Questionnaire: User’s manual . Kensington, Australia7 National Drugand Alcohol Research Centre, University of New South Wales.
Hu, L., & Bentler, P. M. (1998). Fit indices in covariance structural
equation modeling: Sensitivity to underparameterized model misspeci-
fication. Psychological Methods, 3, 424–453.
Hu, L., & Bentler, P. M. (1999). Cutoff criteria for fit indexes in covariance
structure analysis: Conventional criteria versus new alternatives.
Structural Equation Modeling , 6 , 1–55.
Joe, G. W., Broome, K. M., Rowan-Szal, G. A., & Simpson, D. D. (2002).
Measuring patient attributes and engagement in treatment. Journal of
Substance Abuse Treatment , 22, 183–196.
Joe, G. W., Simpson, D. D., & Broome, K. M. (1998). Effects of readiness
for drug abuse treatment on client retention and assessment of process.
Addiction, 93, 1177–1190.
Joreskog, K. G., & Sfrbom, D. (1999). LISREL 8 user’s reference guide.
Chicago, IL7 Scientific Software International.
Kokkevi, A., & Hartgers, C. (1995). EuropASI: European adaptation of a
multidimensional assessment instrument for drug and alcohol depen-
dence. European Addiction Research, 1, 194– 198.Kooyman, M. (1993). The therapeutic community for addicts:
Intimacy, parent involvement and treatment outcome. Amsterdam,
The Netherlands7 Swets and Zeitlinger.
McConnaughy, E. N., Prochaska, J. O., & Velice, W. F. (1983). Stages of
change in psychotherapy: Measurement and sample profiles. Psycho-
therapy: Theory, Research and Practice, 20, 368–375.
McLellan, A. T., Luborsky, L., O’Brien, C. P., & Woody, G. E. (1980). An
improved evaluation instrument for substance abuse patients: The
Addiction Severity Index. Journal of Nervous and Mental Disease,
168, 26–33.
Melnick, G., De Leon, G., Hawke, J., Jainchill, N., & Kressel, D. (1997).
Motivation and readiness for therapeutic community treatment among
adolescent and adult substance abusers. American Journal of Drug and
Alcohol Abuse, 23, 485–507.
Melnick, G., De Leon, G., Thomas, G., Wexler, H. K., & Kressel, D.(2001). Treatment process in therapeutic communities: Motivation,
progress and outcomes. American Journal of Drug and Alcohol Abuse,
27 , 633–650.
Melnick, G., Hawke, J., & De Leon, G. (2003). Modality and population
differences in motivation and readiness (Unpublished document).
Miller, W. R., & Toningan, J. S. (1996). Assessing drinkers’ motivation
for change: the Stages of Change Readiness and Treatment Eager-
ness Scale (SOCRATES). Psychology of Addictive Behaviors, 10,
81–89.
National Evaluation Data and Technical Assistance Center (NEDTAC).
(1999). Overview, resources, and reference list on substance abuse
treatment readiness, motivation, and self-efficacy. Center for Substance
Abuse Treatment, Department of Health and Human Services
[Retrieved from the World Wide Web: http://www.icpsr.umich.edu/
SAMHDA/NTIES/NTIES-PDF/BIBLIOS/rmse99.pdf ; last update:April 21, 1999].
Prochaska, J. O., DiClemente, C. C., & Norcross, J. C. (1993). In search of
how people change: Applications to addictive behaviors. American
Psychologist , 47 , 1102–1114.
Ravndal, E., & Vaglum, P. (1994). Treatment of female addicts: The
importance of relationships to parents, partners and peers for the
outcome. International Journal of the Addictions, 29, 115– 125.
Ryan, R. M., Plant, R. W., & O’Malley, S. (1995). Initial
motivations for alcohol treatment: Relations with patient character-
istics, treatment involvement, and dropout. Addictive Behaviors, 20,
279–297.
Satorra, A., & Bentler, P. M. (1994). Corrections to test statistics and
standard errors in covariance structure analysis. In A. von Eye, & C. C.
Clogg (Eds.), Latent variable analysis: Applications for developmental
research (pp. 399–419). Thousand Oaks, CA7 Sage.Simpson, D. D., & Joe, G. W. (1993). Motivation as a predictor of early
dropout from drug abuse treatment. Psychotherapy: Theory, Research
and Practice, 30, 357– 368.
Simpson, D. D., Joe, G. W., Broome, K. M., Hiller, M. L., Knight, D. K., &
Rowan-Szal, G. A. (1997). Program diversity and treatment retention
rates in the Drug Abuse Treatment Outcome Study (DATOS).
Psychology of Addictive Behaviors, 11, 279– 293.
Simpson, D. D., Joe, G. W., & Brown, B. S. (1997). Treatment retention
and follow-up outcomes in the Drug Abuse Treatment Outcome Study
(DATOS). Psychology of Addictive Behaviors, 11, 294–307.
V. Soyez et al. / Journal of Substance Abuse Treatment 30 (2006) 297–308308