Embed Size (px)
Citation preview

SOYBEAN VARIETY PERFORMANCE TESTS IN
TENNESSEE
2013
AGRESEARCH & EDUCATION CENTERS AND COUNTY STANDARD TESTS
Fred L. Allen, Coordinator, Agronomic Crop Variety Testing & Demonstrations Virginia R. Sykes, Research Associate, Agronomic Crop Variety Testing & Demonstrations Robert C. Williams, Jr. Extension Area Specialist, Grain Crops Angela Thompson McClure, Extension Specialist, Corn & Soybeans Heather Young-Kelly, Assistant Professor, Entomology & Plant Pathology Pat Donald, Research Plant Pathologist, USDA-ARS
Agronomic Crop Variety Testing and Demonstrations Department of Plant Sciences
Institute of Agriculture University of Tennessee
Knoxville •Telephone: (865)974-8821 •FAX: (865)974-1947 •email: [email protected]
Variety test results are posted on UT’s website at:
http://varietytrials.tennessee.edu/ and
www.utcrops.com

Acknowledgments
This research was funded by the Tennessee Agricultural Experiment Station and UT Extension with partial funding from participating companies. We gratefully acknowledge the assistance of the following individuals in conducting these experiments: Dept. of Plant Sciences Vince Pantalone, Professor and Soybean Breeder Chris Smallwood, Research Associate, Soybean Breeding Eifion Hughes, Graduate Research Assistant Matthew Bobbitt, Graduate Research Assistant Victoria Knapp, Graduate Research Assistant Ali DeSantis, Graduate Research Assistant Lauren Nixon, Graduate Research Assistant AgResearch & Education Centers: East Tennessee: East Tennessee AgResearch & Education Center, Knoxville Robert Simpson, Center Director BJ DeLozier, Manager Derick Hopkins, Farm Crew Leader Middle Tennessee: Highland Rim AgResearch & Education Center, Springfield Barry Sims, Center Director Brad Fisher, Research Assistant West Tennessee: AgResearch & Education Center at Milan, Milan Blake Brown, Center Director Jason Williams, Research Associate James McClure, Research Associate Chris Bridges, Research Associate AgResearch & Education Center at Ames Plantation, Grand Junction Rick Carlisle, Center Director Marshall Smith, Research Associate Jamie Evans, Research Associate

2013 County Standard Tests -- Soybean Cooperators & Agents Group III Cooperator(s) Agent Coffee L.A. Teal & Mike England Steve Harris Dyer Mike Underwood Tim Campbell Franklin David Denton Ed Burns/Creig Kimbro Henry David & Finis Wilson Ranson Goodman Lake Jon Dickey Greg Allen Madison David Martin Jake Mallard Obion Kenneth & Blake Cheatham Tim Smith Weakley Ronnie Yeargin Jeff Lannom Group IV Early Cannon Johnny & Judy Powell Bruce Steelman Coffee L.A. Teal & Mike England Steve Harris Dyer Mike Underwood Tim Campbell Franklin David Denton Ed Burns/Creig Kimbro Henry David & Finis Wilson Ranson Goodman Hickman Clint & Claude Callicott Troy Dugger Lake Jon Dickey Greg Allen Lawrence Bent Larsen Calvin Bryant Madison David Martin Jake Mallard Obion Kenneth & Blake Cheatham Tim Smith Tipton David Templeton Booker Leigh Weakley Brian Garner Jeff Lannom Group IV Late Ballard, KY Lester & Tracey Sullivan Bob Middleton Calloway, KY Craig Carraway Tim Lax Coffee L.A. Teal & Mike England Steve Harris Decatur Stacy Vise Amanda Mathenia Dyer Mike Underwood Tim Campbell Fayette 1 Ames Plantation Jeff Via Fayette 2 Joseph & Joey McNabb Jeff Via Franklin Steve Dixon Ed Burns/Creig Kimbro Giles Richard Sulcer Kevin Rose Hardin Gerry Lambert Brian White Henry David & Finis Wilson Ranson Goodman Lake Jon Dickey Greg Allen Madison Matt Griggs Jake Mallard Marion Dewey & Randy Gilliam Jared Goad Montgomery Steve Joiner/Michael Suiter Rusty Evans Obion Kenneth & Blake Cheatham Tim Smith

2013 County Standard Tests -- Soybean Cooperators & Agents Group V Early Carlisle, KY Curtsinger Farms Bob Middleton Coffee L.A. Teal & Mike England Steve Harris Crockett Stoney Hargett Richard Buntin Dyer Mike Underwood Tim Campbell Fayette Lee Graves Jeff Via Franklin David Denton Ed Burns/Creig Kimbro Lake John Fields Greg Allen Madison David Martin Jake Mallard Shelby 1 Scott Johnson Becky Muller Shelby 2 Jerry Tolbert Becky Muller Liberty Link MG4 Late (4.6 – 4.9) Dyer Brad Studard Tim Campbell Fayette Joseph & Joey McNabb Jeff Via Franklin David Denton Ed Burns/Creig Kimbro Fulton, Ky 1 Amberg Farms Ben Mullins Fulton, Ky 2 Johnson Linder Ben Mullins Gibson Denton Clay Parkins Philip Shelby Obion Bill Sellers Tim Smith Shelby Scott Johnson Becky Muller

Table of Contents
Experimental Procedures................................................................................................... 6 Interpretation of data.......................................................................................................... 7 Results……………….......................................................................................................... 7 Location information from AgResearch and Education Centers where the soybean variety tests were conducted in 2013………………………………………………………….. 9 Roundup Ready Maturity Group III Soybean Tests………………………………………….. 11 Roundup Ready Early Maturity Group IV Soybean Tests (4.0 – 4.5)………………………. 18 Roundup Ready Late Maturity Group IV Soybean Tests (4.6 – 4.9)………………..…....... 27 Roundup Ready Early Maturity Group V Soybean Tests (5.0 – 5.5)……………..…………40 Roundup Ready Late Maturity Group V Soybean Tests (5.6 – 5.9)………………………... 51 Liberty Link Maturity Group IV Soybean Tests……………….………………………..……... 57 Liberty Link Maturity Group V Soybean Tests……………….………………………..…….... 66 Conventional Maturity Group IV Soybean Tests……………….…………………..….……... 72 Conventional Maturity Group V Soybean Tests…………………………….………..….….... 76 Soybean Characteristics………………………………………………………………………… 82 Seed Company Contact Information…………………………………………………………… 88
PERFORMANCE OF SOYBEAN VARIETIES IN TENNESSEE AGRESEARCH & EDUCATION CENTERS AND COUNTY STANDARD TESTS
Experimental Procedures
AgResearch & Education Center Tests: All soybean variety trials were conducted in each of the physiographic regions of the state. Tests were conducted at the Agricenter International Research Center (Memphis), Ames Plantation (Grand Junction), Highland Rim (Springfield), East Tennessee (Knoxville), and Milan (Milan), AgResearch & Education Centers (REC). Duplicate plantings of all nine tests [Maturity Group 3 Roundup Ready (i.e., RR3), RR4 early (relative maturity 4.0– 4.5), RR4 late (RM 4.6-4.9) RR5 early (RM 5.0-5.5), RR5 late (RM 5.6-5.9), Liberty Link LL4 (RM 4.0 – 4.9), LL5 (RM 5.0 – 5.9), Conventional CV4 (RM 4.0 – 4.9), and CV5 (RM 5.0 – 5.9) were made at the Milan and Highland Rim RECs for performance testing with and without irrigation. The plot size at all REC locations was two rows, 30 feet in length with 30 inch row spacing. All varieties were planted at approximately 8 seeds per foot of row (i.e., approximately 140,000 seed per acre REC tests). Plots were replicated three times at each location in a randomized complete block design. Plots at Milan and Springfield were sprayed with a foliar fungicide approximately one month after planting, and again approximately 21 days later as a preventative treatment for fungal diseases such as soybean rust. Soybean rust was detected in Tennessee in late season planted soybeans, but at low severity. Because of the large number of varieties in some tests and the field variation at each location, an incomplete block design was imposed ex post facto prior to data analysis in order to reduce the within-block field variability and the experimental error. Genetics and Seed Treatments: Seed of all varieties included in the REC tests were treated with one or more fungicides plus an insecticide. Research has shown that seed treatments can influence yield, therefore the yields of varieties reported herein are the combined result of the genetic potential of the varieties plus the seed treatment “packages”. The seed treatments that were included on each variety were determined by the company or organization and are listed in Table 78. Many soybean varieties are now being marketed with combinations of fungicide and insecticides on the seed, similar to corn. A decision was made to test the varieties in the UT soybean performance tests with the seed treatments so the results would be comparable to what producers could expect from seed they purchase. County Standard Tests: The County Standard Soybean Tests were conducted in 18 counties in Tennessee, and three in Western Kentucky. The number of county locations depended on the test (e.g., 8 - 16). The County Standard Tests were divided into RR3, RR4 early (relative maturity 4.0-4.5), RR4 late (RM 4.6-4.9), RR5 early (RM 5.0-5.5) and a Liberty Link (RM 4 late) test. Each variety was evaluated in a large strip-plot at each location, thus each county test was considered as one replication of the test in calculating the overall average yield and in conducting the statistical analysis to determine significant differences. At each location, plots were planted, sprayed, fertilized, and harvested with the equipment used in the cooperating producer’s farming operation. The width and length of strip-plots were different in each county; however, within a location in a county, the strips were trimmed on the ends so that the lengths were the same for each variety, or if the lengths were different then the harvested length was measured for each variety and appropriate harvested area adjustments were made to determine the yield per acre.
Interpretation of Data
The tables on the following pages have been prepared with the entries listed in order of performance, the highest-yielding entry being listed first. All yields presented have been adjusted to 13% moisture. At the bottom of the tables, LSD values stand for Least Significant Difference. The mean yields of any two varieties being compared must differ by at least the amount shown (minimum) to be considered different in yielding ability at the 5% level of probability of significance. For example, given that the LSD for a test is 8.0 bu/a and the mean yield of Variety A was 30 bu/a and the mean yield of Variety B was 35 bu/a, then the two varieties are not statistically different in yield because the difference of 5 bu/a is less than the minimum of 8 bu/a required for them to be significant. On the other hand, if the average yield of Variety C was 43 bu/a then it is significantly higher yielding than both Variety B (43 - 35 = 8 bu/a = LSD of 8) and Variety A (43 - 30 = 13 bu/a > LSD of 8). Also, the coefficient of variation (C.V.) values are shown at the bottom of each table. This value is a measure of the error variability found within each experiment. It is the percentage that the error variation is of the overall test mean yield at that location. For example, a C.V. of 10% indicates that the size of the error variation is about 10% of the size of the test mean. Similarly, a C.V. of 30% indicates that the size of the error variation is nearly one-third as large as the test mean. A goal in conducting each yield test is to keep the C.V. as low as possible, preferably below 20%.
RESULTS Yield and Agronomic Traits. Two hundred and fifty one soybean varieties were evaluated in the 2013 AgResearch & Education Center (REC) tests in Tennessee. There were eight varieties in the RR3, 34 in the RR4E, 75 in the RR4L, 44 in the RR5E, 13 in the RR5L, 29 in the LL4, 15 in the LL5, 16 CV4, and 14 in the CV5 test. The County Standard tests (CST) involved 72 varieties total, consisting of a RR3 test (4 varieties at 8 locations), a RR4E test (14 varieties at 12 locations), a RR4L test (24 varieties at 16 locations), a RR5E test (15 varieties at 10 locations) and a Liberty Link MG4 test (15 varieties at 8 locations). In addition to 22 Tennessee counties, the County Standard Tests involved three counties in Western Kentucky (Carlisle, Fulton, and McCracken). Tables 2-77 contain data on yield and agronomic traits such as maturity, plant height, lodging, shattering, seed quality, seed protein and oil content. Due to favorable rainfall events later in the growing season, yields in the irrigated test were lower than yields in the non-irrigated tests for MG4 LL (Table 49), MG5 LL (Table 59), MG4 Conventional (Table 66), and MG5 Conventional varieties (Table 71). Frogeye leaf spot was observed in plots at the Knoxville location. Ratings were taken on August 26 on a scale of 1 to 9 where a score of 1 = no disease and 9 = heavy disease. Frogeye ratings are included in tables reporting agronomic traits for all locations. SDS symptoms were observed in the Milan non-irrigated plots in late August and, due to heavy infestation of this disease, this location was analyzed separately for yield and SDS ratings (Tables 4, 14, 24, 34, 44, 51, 61, 68, and 73). Early in the growing season, some soybean varieties in both the irrigated and non-irrigated tests at Milan exhibited stunted growth from the effects of LeadOff herbicide being applied at the rate of 1.5 oz/a in the burndown application in late March. Ratings were taken on July 12 for “plant health” on a scoring scale of 1 to 4. A score of 1 = normal plants; 2 = ~ 80% normal; 3 = ~ 60% normal; and 4 = < 60% normal, but no plants approaching death (Tables 4, 14, 24, 34, 44, 51, 61, 68, and 73). However, varieties exhibiting stunting recovered and grew out of the symptoms and appeared normal by the end of the season. Table 78 lists the names and the companies

descriptive characteristics of the varieties included in the REC tests in 2013. Table 79 contains the contact information for each soybean seed company with entries in the 2013 REC tests. Growing Season: The 2013 growing season was characterized by heavy precipitation which delayed planting by about two weeks compared to the five year average. Continued above average rainfall throughout the growing season was beneficial to the state’s soybean crop with 84 percent of the crop rated good to excellent in late September. Soybean harvest was delayed by rainfall; however, yields were well above 2012 averages. According to the Tennessee Agricultural Statistics Service, producers planted 1.56 million acres this year, an increase of 300,000 from 2012. Acreage harvested for grain is projected to be 1.5 million, up 290,000 acres from last season. Soybean production for 2013 is projected to be 72.96 million bushels, an increase of 56 percent from the previous year. The state soybean yield average is projected to be 48.0 bu/a, which is 10 bushels above the 2012 yield. CST Disease & SCN Ratings: Ratings on variety reactions to frogeye leaf spot and SDS are presented in Tables 10, 20, 30, 40, 57 (data provided by Dr. Heather Young-Kelly, Dept. of Entomology and Plant Pathology, UT). Soybean cyst nematode (races 2, 3, and 5) ratings in these tables provided by Dr. Pat Donald, USDA-ARS, Jackson, TN.

Table 1. Location information from AgResearch and Education Centers where the soybean variety tests were conducted in 20Planting Harvest Seeding
Research Center Location Date Date Rate Soil TypeRoundup Ready Maturity Group IIIHighland Rim (Irrigated) Springfield 5/16/2013 10/9/2013 140000 Dickson Silt LoamHighland Rim (Non Irrigated) " 5/16/2013 10/9/2013 140000 Dickson Silt LoamKnoxville Knoxville 5/3/2013 9/24/2013 140000 Sequatchie Fine Sandy LoamMilan (Irrigated) Milan 5/28/2013 10/10/2013 140000 Grenada Silt LoamMilan (Non Irrigated) " 5/20/2013 10/11/2013 140000 Grenada Silt Loam
Roundup Ready Maturity Group Early IV (4.0 - 4.5)Agricenter International Memphis 6/4/2013 12/2/2013 140000 Falaya Silt LoamAmes Grand Junction 4/25/2013 9/26/2013 140000 Lexington Silt LoamHighland Rim (Irrigated) Springfield 5/16/2013 10/9/2013 140000 Dickson Silt LoamHighland Rim (Non Irrigated) " 5/16/2013 10/10/2013 140000 Dickson Silt LoamKnoxville Knoxville 5/3/2013 9/27/2013 140000 Sequatchie Fine Sandy LoamMilan (Irrigated) Milan 5/28/2013 10/10/2013 140000 Grenada Silt LoamMilan (Non Irrigated) " 5/20/2013 10/11/2013 140000 Grenada Silt Loam
Roundup Ready Maturity Group Late IV (4.6 - 4.9)Agricenter International Memphis 6/4/2013 12/2/2013 140000 Falaya Silt LoamAmes Grand Junction 4/25/2013 9/27/2013 140000 Lexington Silt LoamHighland Rim (Irrigated) Springfield 5/16/2013 10/12/2013 140000 Dickson Silt LoamHighland Rim (Non Irrigated) " 5/16/2013 10/15/2013 140000 Dickson Silt LoamKnoxville Knoxville 5/3/2013 9/30/2013 140000 Sequatchie Fine Sandy LoamMilan (Irrigated) Milan 5/28/2013 10/14/2013 140000 Grenada Silt LoamMilan (Non Irrigated) " 5/20/2013 10/11/2013 140000 Grenada Silt Loam
Roundup Ready Maturity Group Early V (5.0 - 5.5)Ames Grand Junction 4/25/2013 10/14/2013 140000 Lexington Silt LoamHighland Rim (Irrigated) Springfield 5/16/2013 10/24/2013 140000 Dickson Silt LoamHighland Rim (Non Irrigated) " 5/16/2013 10/23/2013 140000 Dickson Silt LoamKnoxville Knoxville 5/3/2013 10/11/2013 140000 Sequatchie Fine Sandy LoamMilan (Irrigated) Milan 5/28/2013 10/23/2013 140000 Grenada Silt LoamMilan (Non Irrigated) " 5/28/2013 10/24/2013 140000 Grenada Silt Loam
Roundup Ready Maturity Group Late V (5.6 - 5.9)Ames Grand Junction 4/25/2013 11/12/2013 140000 Lexington Silt LoamHighland Rim (Irrigated) Springfield 5/16/2013 10/24/2013 140000 Dickson Silt LoamHighland Rim (Non Irrigated) " 5/16/2013 10/23/2013 140000 Dickson Silt LoamKnoxville Knoxville 5/3/2013 10/11/2013 140000 Sequatchie Fine Sandy LoamMilan (Irrigated) Milan 5/28/2013 10/23/2013 140000 Grenada Silt LoamMilan (Non Irrigated) " 5/28/2013 10/24/2013 140000 Grenada Silt Loam
Liberty Link Maturity Group IV (4.0 - 4.9)Ames Grand Junction 4/26/2013 10/14/2013 140000 Lexington Silt LoamHighland Rim (Irrigated) Springfield 5/16/2013 10/15/2013 140000 Sango Silt LoamHighland Rim (Non Irrigated) " 5/16/2013 10/23/2013 140000 Dickson Silt LoamKnoxville Knoxville 5/10/2013 10/7/2013 140000 Sequatchie Fine Sandy LoamMilan (Irrigated) Milan 5/28/2013 10/14/2013 140000 Memphis Silt LoamMilan (Non Irrigated) " 5/28/2013 10/11/2013 140000 Grenada Silt Loam
Liberty Link Maturity Group V (5.0 - 5.9)Ames Grand Junction 4/26/2016 11/13/2013 140000 Lexington Silt LoamHighland Rim (Irrigated) Springfield 5/16/2013 10/23/2013 140000 Sango Silt LoamHighland Rim (Non Irrigated) " 5/16/2013 10/24/2013 140000 Dickson Silt LoamKnoxville Knoxville 5/10/2013 10/7/2013 140000 Sequatchie Fine Sandy LoamMilan (Irrigated) Milan 5/28/2013 10/22/2013 140000 Memphis Silt LoamMilan (Non Irrigated) " 5/28/2013 10/21/2013 140000 Grenada Silt Loam
Conventional Maturity Group IV (4.0 - 4.9)Highland Rim (Irrigated) Springfield 5/16/2013 10/9/2013 140000 Sango Silt LoamHighland Rim (Non Irrigated) " 5/16/2013 10/10/2013 140000 Dickson Silt LoamKnoxville Knoxville 5/10/2013 10/2/2013 140000 Sequatchie Fine Sandy LoamMilan (Irrigated) Milan 5/28/2013 10/14/2013 140000 Memphis Silt LoamMilan (Non Irrigated) " 5/28/2013 10/11/2013 140000 Grenada Silt Loam

Table 1. (continued)Conventional Maturity Group V (5.0 - 5.9)Highland Rim (Irrigated) Springfield 5/16/2013 10/15/2013 140000 Sango Silt LoamHighland Rim (Non Irrigated) " 5/16/2013 10/23/2013 140000 Dickson Silt LoamKnoxville Knoxville 5/10/2013 10/7/2013 140000 Sequatchie Fine Sandy LoamMilan (Irrigated) Milan 5/28/2013 10/22/2013 140000 Memphis Silt LoamMilan (Non Irrigated) " 5/28/2013 10/21/2013 140000 Grenada Silt Loam

Table 2. Mean yields † of eight Maturity Group III Roundup Ready soybean varieties evaluated in fourenvironments in Tennessee during 2013.
Avg. Yield± Std Err. Springfield Milan
Brand Variety ‡ (n=4) Knoxville Irr. Non-Irr. Irr.
Armor 39-R16 (RR) 74 ± 1 80 68 75 72Terral-REV Brand 38R10 (RR) 68 ± 1 75 68 73 54Steyer 4203 R2 (RR2Y) (4E CHECK) 67 ± 1 77 69 72 50 Warren Seed DSR-4330/R2Y (4E CHECK) 67 ± 1 74 70 65 57Dyna-Gro S38RY84 (RR2Y) 66 ± 1 77 65 70 53Warren Seed DS4010 (RR) 66 ± 1 78 63 63 59AgBorn Genetics LLC ABx2193 (RR) 57 ± 2 68 57 49 53AgBorn Genetics LLC ABx7648 (RR) 56 ± 1 68 59 50 50Average (bu/a) 65 75 65 65 56L.S.D..05 (bu/a) 4 6 10 10 9C.V. (%) 7.6 4.4 8.2 8.9 9.4
Table 3. Mean yields † and agronomic characteristics of eight Maturity Group III Roundup Ready soybean varieties evaluated in four environments in Tennessee during 2013.
Avg. Yield Seed± Std Err. Moisture § Lodging Height Maturity Shattering Quality Protein Oil Frogeye
Brand Variety ‡ (n=4) (n=4) (n=4) (n=4) (n=4) (n=3) (n=1) (n=1) (n=1) (n=1)bu/a % Score in. DAP -------- Score -------- % % Score
Armor 39-R16 (RR) 74 ± 1 13.9 1.2 36 128 1.0 1.7 34.6 19.5 6.3Terral-REV Brand 38R10 (RR) 68 ± 1 14.0 1.4 35 125 1.2 1.7 34.4 19.6 2.3Steyer 4203 R2 (RR2Y) (4E CHECK) 67 ± 1 13.9 1.5 34 129 1.0 2.2 35.0 19.3 5.7Warren Seed DSR-4330/R2Y (4E CHECK) 67 ± 1 13.9 1.8 33 129 1.0 1.5 33.6 20.2 5.7Dyna-Gro S38RY84 (RR2Y) 66 ± 1 13.8 1.3 33 124 1.0 1.3 34.1 20.1 4.7Warren Seed DS4010 (RR) 66 ± 1 13.9 2.9 35 126 1.0 1.7 34.9 19.6 4.3AgBorn Genetics LLC ABx2193 (RR) 57 ± 2 13.8 1.8 36 127 1.0 1.8 34.6 19.9 6AgBorn Genetics LLC ABx7648 (RR) 56 ± 1 14.8 1.9 35 124 1.2 1.7 34.9 19.8 5
Average 65 14.0 1.7 35 127 1.1 1.7 34.5 19.8 5.0† All yields are adjusted to 13% moisture.‡ If a trait appears inside parentheses i.e. (RR), then it is not part of the variety name.§ Average moisture at harvest.Lodging = 1 to 5 scale; where 1 = 95% of plants erect; 2.5 = ~50% of plants leaning at angle ≥ 45°; 5 = 95+% of plants leaning at an angle ≥ 45°.Maturity = days after planting (DAP).Shattering = 1 to 5 scale; where 1 = no shattering; 5 = 90+% of pods shattered.Seed Quality = 1 to 5 scale; where 1 = < 5% of seeds showing disease or split seed coats; 5=95+% of seed are diseased or have split seed coats.Protein & Oil on dry weight basis.Disease ratings for Frogeye Leaf Spot are from 1-9, where 0=no disease & 10=maximum amount of plant disease or plant death. Ratings taken 8/26/13 in Knoxville, TN
-----------------------------------------bu/a---------------------------------------

Table 4. Yields †, plant health, and disease ratings of eight Maturity Group III Roundup Ready soybean varieties evaluated at Milan, Tennessee during 2013.
Yield Yield Plant SDSMilan Milan Health DI DS DX
Brand Variety ‡ Irr. Non-Irr. (n=2) (n=1) (n=1) (n=1)bu/a bu/a (1-4) % 0 - 9 index
Armor 39-R16 (RR/STS) 72 57 1 50 3.7 270Steyer 4203 R2 (RR2Y) (4E CHECK) 50 50 2 28 3.0 83Warren Seed DSR-4330/R2Y (4E CHECK) 57 51 4 2 2.0 3Dyna-Gro S38RY84 (RR2Y) 53 51 2 19 3.0 72Terral-REV Brand 38R10 (RR) 54 44 2 57 5.3 357Warren Seed DS4010 (RR) 59 42 1 37 3.3 181AgBorn Genetics LLC ABx2193 (RR) 53 46 3 4 2.0 12AgBorn Genetics LLC ABx7648 (RR) 50 43 2 31 3.7 119
Average 56 48 2 29 3.3 137† All yields are adjusted to 13% moisture.‡ If a trait appears inside parentheses i.e. (RR), then it is not part of the variety name.DI = disease incidence = percentage of plants with symptomsDS = disease severity = score of leaf chlorosis and necrosis; 0 = no symptoms; 9 = plant death before normal defoliation due to senescence.DX = disease index = (DI x DS / 9); ratings were made at approximately R6 when green pods with seed have reached full size on 8/28/13.
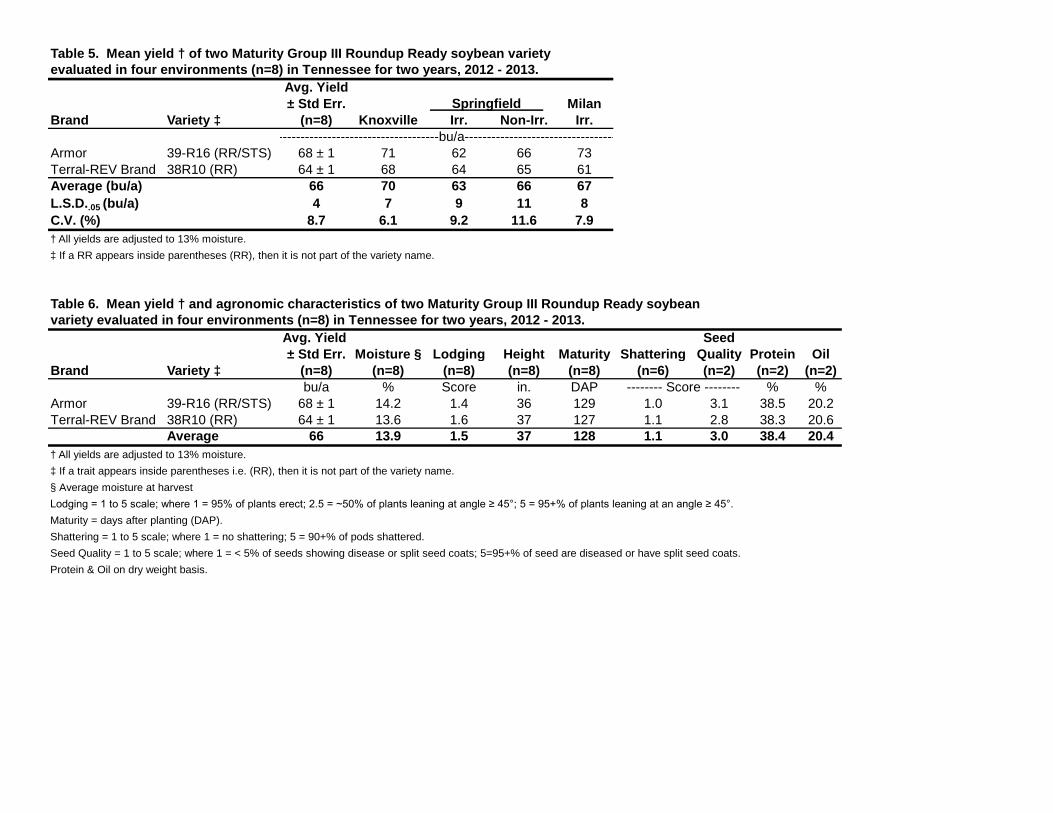
Table 5. Mean yield † of two Maturity Group III Roundup Ready soybean varietyevaluated in four environments (n=8) in Tennessee for two years, 2012 - 2013.
Avg. Yield± Std Err. Springfield Milan
Brand Variety ‡ (n=8) Knoxville Irr. Non-Irr. Irr.
Armor 39-R16 (RR/STS) 68 ± 1 71 62 66 73Terral-REV Brand 38R10 (RR) 64 ± 1 68 64 65 61Average (bu/a) 66 70 63 66 67L.S.D..05 (bu/a) 4 7 9 11 8C.V. (%) 8.7 6.1 9.2 11.6 7.9† All yields are adjusted to 13% moisture.‡ If a RR appears inside parentheses (RR), then it is not part of the variety name.
Table 6. Mean yield † and agronomic characteristics of two Maturity Group III Roundup Ready soybeanvariety evaluated in four environments (n=8) in Tennessee for two years, 2012 - 2013.
Avg. Yield Seed± Std Err. Moisture § Lodging Height Maturity Shattering Quality Protein Oil
Brand Variety ‡ (n=8) (n=8) (n=8) (n=8) (n=8) (n=6) (n=2) (n=2) (n=2)bu/a % Score in. DAP -------- Score -------- % %
Armor 39-R16 (RR/STS) 68 ± 1 14.2 1.4 36 129 1.0 3.1 38.5 20.2Terral-REV Brand 38R10 (RR) 64 ± 1 13.6 1.6 37 127 1.1 2.8 38.3 20.6
Average 66 13.9 1.5 37 128 1.1 3.0 38.4 20.4† All yields are adjusted to 13% moisture.‡ If a trait appears inside parentheses i.e. (RR), then it is not part of the variety name.§ Average moisture at harvestLodging = 1 to 5 scale; where 1 = 95% of plants erect; 2.5 = ~50% of plants leaning at angle ≥ 45°; 5 = 95+% of plants leaning at an angle ≥ 45°.Maturity = days after planting (DAP).Shattering = 1 to 5 scale; where 1 = no shattering; 5 = 90+% of pods shattered.Seed Quality = 1 to 5 scale; where 1 = < 5% of seeds showing disease or split seed coats; 5=95+% of seed are diseased or have split seed coats.Protein & Oil on dry weight basis.
------------------------------------bu/a----------------------------------

Table 7. Mean yield † of one Maturity Group III Roundup Ready soybean varietyevaluated in four environments (n=12) in Tennessee for two years, 2011 - 2013.
Avg. Yield± Std Err. Springfield Milan
Brand Variety ‡ (n=12) Knoxville Irr. Non-Irr. Irr.
Terral-REV Brand 38R10 (RR) 59 ± 1 68 56 52 61Average (bu/a) 59 68 56 52 61L.S.D..05 (bu/a) 4 7 8 10 7C.V. (%) 8.7 6.3 9.3 12.7 7.2† All yields are adjusted to 13% moisture.‡ If a RR appears inside parentheses (RR), then it is not part of the variety name.
Table 8. Mean yield † and agronomic characteristics of one Maturity Group III Roundup Ready soybeanvariety evaluated in four environments (n=12) in Tennessee for two years, 2011 - 2013.
Avg. Yield Seed± Std Err. Moisture § Lodging Height Maturity Shattering Quality Protein Oil
Brand Variety ‡ (n=12) (n=12) (n=12) (n=12) (n=12) (n=9) (n=3) (n=3) (n=3)bu/a % Score in. DAP -------- Score -------- % %
Terral-REV Brand 38R10 (RR) 59 ± 1 13.4 1.6 37 126 1.1 2.4 38.6 21.5Average 59 13.4 1.6 37 126 1.1 2.4 38.6 21.5
† All yields are adjusted to 13% moisture.‡ If a trait appears inside parentheses i.e. (RR), then it is not part of the variety name.§ Average moisture at harvestLodging = 1 to 5 scale; where 1 = 95% of plants erect; 2.5 = ~50% of plants leaning at angle ≥ 45°; 5 = 95+% of plants leaning at an angle ≥ 45°.Maturity = days after planting (DAP).Shattering = 1 to 5 scale; where 1 = no shattering; 5 = 90+% of pods shattered.Seed Quality = 1 to 5 scale; where 1 = < 5% of seeds showing disease or split seed coats; 5=95+% of seed are diseased or have split seed coats.Protein & Oil on dry weight basis.
------------------------------------bu/a----------------------------------

Table 9. Yields † of four Maturity Group III Roundup Ready soybean varieties in eight County Standard Tests in Tennessee during 2013.
Avg. Yld. Moist Coffee Dyer Franklin Henry Lake Madison Obion WeakleyMS Brand/Variety bu/a % 5/2 § 5/28 5/21 6/26 5/16 5/30 5/28 6/28A **Terral REV-38R10 67.0 14.3 73.6 59.9 84.4 62.9 54.2 83.4 63.7 54.1A Asgrow AG3833 GENRR2Y 66.7 14.4 76.2 61.0 74.5 68.7 55.0 95.1 59.7 43.4A Warren Seed DS 4010 66.0 14.3 71.1 65.5 66.1 58.8 54.0 90.7 68.3 53.3A Armor 39-R16 RR2/STS 63.4 14.4 82.3 62.9 71.2 60.6 44.4 78.7 61.5 46.1
Average (bu/a) 65.8 14.3 75.8 62.3 74.1 62.7 51.9 87.0 63.3 49.2† Yields have been adjusted to 13% moisture.‡ Moisture at harvest.§ Planting date.Each variety was evaluated in a large strip-plot at each loction, thus each county test was considered as one replication of the test in calculating the average yield and in conducting the statistical analysis to determine significant differences (MS).Variety marked with an asterisk (**) was in the top performing group in 2013, 2012 and 2011.MS= Varieties with any MS letter in common are not statistically different at the 5% level of probability.Data provided by Robert C. Williams, Ext. Area Specialist, Grain Crops, and the extension agents in the counties shown above.

Table 10. Yields † and disease ratings § of four Maturity Group III Roundup Ready soybean varieties evaluated in 8 Tennesseeand Kentucky County Standard Tests during 2013.
CSTAvg.Yield Treated ¶ Untreated SCN
MS Brand/Variety (n=8) Frogeye Sudden Death Yield Yield Race 2 Race 3 Race 5bu/a bu/a bu/a
A **Terral REV-38R10 67.0 LOW LOW-MOD 39.9 36.7 MS S SA Asgrow AG3833 GENRR2Y 66.7 MOD LOW 37.3 36.9 - - -A Warren Seed DS 4010 66.0 LOW LOW 39.3 33.3 S MR SA Armor 39-R16 RR2/STS 63.4 LOW LOW 45.2 39.1 S MS S
Average (bu/a) 65.8 40.4 36.5YLD= Avg. Yield @ 13% moisture.MS= Varieties that have any MS letter in common are not statistically different in yield at the 5% level of probability.Variety marked with an asterisk (**) was in the top performing group in 2013, 2012 and 2011.County locations include: Coffee, Dyer, Franklin, Henry, Lake, Madison, Obion and Weakley.¶ Treated plots at RECM sprayed with Quadris TOP @ 8 oz./Acre + 1% Induce @ R3 growth stage. RECM varieties planted May 28 Disease ratings (of unsprayed plots) for Frogeye and Sudden Death are LOW (0-10% disease), MOD (11-40% disease), HIGH (41-100%)Disease ratings & yield data compiled by Dr. Heather Kelly from replicated plots at the Research and Education Center at Milan (RECM, which has severe disease pressure)SCN Greenhouse Ratings compiled by Dr. Pat Donald, Research Plant Path., USDA-ARS, WTREC. Race 2 (HG Type 1.2.5.7), Race 3 (HG Type 7) andRace 5 (HG Type 2.5.7), HS = Highly Susceptible, S = Susceptible, MS = Moderately Susceptible, MR = Moderately Resistant, R = Resistant.
---------------------------- Research and Education Center at Milan ----------------------------

Table 11. Overall average yields † and moistures of three Maturity Group III Roundup Ready soybean varietiesevaluated in County Standard Tests (n=8) and AgResearch and Education Centers (n=4) in Tennessee during 2013.
Research and Averages of CST & REC Tests County Standard Trials Education Center Trials
Avg. Avg. Avg.Brand Variety ‡ Yield Moisture Yield Moisture Yield Moisture
bu/a % bu/a % bu/a %Armor 39-R16 (RR) 69 14.1 63 14.4 74 13.9Terral-REV Brand 38R10 (RR) 68 14.1 67 14.3 68 14.0Warren Seed DS4010 (RR) 66 14.1 66 14.3 66 13.9Average (bu/a) 67 14.1 65 14.3 69 13.9† Yields have been adjusted to 13% moisture.‡ If a trait appears inside parentheses i.e. (RR), then it is not part of the variety name.

Table 12. Mean yields † of 34 Early Maturity Group IV (4.0 - 4.5) Roundup Ready soybean varietiesevaluated in six environments in Tennessee during 2013.
Avg. Yield± Std Err. Springfield Milan AgCenter
Brand Variety ‡ (n=6) Knoxville Irr. Non-Irr. Irr. Ames Memphis
Mycogen 5N451R2 64 ± 2 69 83 55 67 59 50AGSouth Genetics AGS 43R212 (RR2Y) 64 ± 2 65 66 66 68 67 50Progeny 4211 RY (RR2Y) 63 ± 2 59 81 66 68 54 51Warren Seed DSR-4633/R2Y 63 ± 2 65 77 59 69 63 44Armor 44-R08 (RR2Y) 63 ± 2 67 83 61 70 47 47Steyer 4501 R2 (RR2Y) 62 ± 2 64 85 57 61 59 47Dyna-Gro 31RY45 (RR2Y) 62 ± 2 56 87 56 67 61 45Croplan RT 47995 (RR) 61 ± 2 64 74 55 63 61 51USG 74F53R (RR2Y/STS) 61 ± 2 55 74 62 66 61 48AGSouth Genetics AGS 45R212 (RR2Y) 61 ± 2 66 79 57 61 56 46USG 74A33R (RR2Y) 61 ± 2 67 69 53 58 44 73LG Seeds C4544R2 60 ± 2 49 80 58 66 55 52Morsoy Xtra R2 44X82 60 ± 2 62 79 58 62 49 52Steyer 4203 R2 (RR2Y) 60 ± 2 64 65 65 71 44 49Steyer 4401R2 60 ± 2 67 75 53 64 55 45Beck's Hybrids 444NR (RR) 59 ± 2 68 71 54 67 53 44Mycogen 5N423R2 (STS) 59 ± 2 60 66 60 64 56 48Dyna-Gro 39RY43 (RR2Y) 59 ± 2 50 77 64 69 45 49Mycogen 5N431R2 58 ± 2 46 75 61 65 51 52Warren Seed DS4330 R2Y 58 ± 2 48 77 59 66 47 54Asgrow AG4534 (RR2Y/STS) 58 ± 2 27 73 58 70 65 51Schillinger Seed 458 RCS 58 ± 2 45 71 58 59 67 45Armor 45-R60 (RR2Y/STS) 57 ± 2 43 74 59 67 54 48Asgrow AG4232 GENRR2Y (STS) 57 ± 2 36 78 62 71 46 50Progeny 4313 RY 57 ± 2 62 70 53 63 41 54Progeny 4510 RY (RR2Y/STS) 57 ± 2 41 69 59 61 58 51Dyna-Gro S44RS93 (RR2Y/STS) 56 ± 2 40 77 51 62 57 49NK S 41-J6 (RR2Y) 55 ± 2 39 82 50 58 56 48Beck's Hybrids 418NR (RR) 55 ± 2 44 72 54 69 52 40AgBorn Genetics LLC ABx71141 (RR) 55 ± 2 38 66 52 65 64 46AgBorn Genetics LLC ABx0448 (RR) 55 ± 2 46 81 51 58 48 43Armor X1401 (RR2) 54 ± 2 27 86 58 58 52 44Asgrow AG4433 GENRR2Y 53 ± 2 21 81 58 59 49 49TN Exp TN09-47,169 (RR2Y) 48 ± 2 25 71 59 55 42 37Average (bu/a) 59 51 76 58 64 54 76L.S.D..05 (bu/a) 4 13 9 7 10 10 10C.V. (%) 10.8 10.0 8.8 6.7 11.2 13.1 13.1† All yields are adjusted to 13% moisture.‡ If a trait appears inside parentheses i.e. (RR), then it is not part of the variety name.
-------------------------------bu/a--------------------------------------

Table 13. Mean yields † and agronomic characteristics of 34 Early Maturity Group IV (4.0 - 4.5) Roundup Ready soybean varietiesevaluated in six environments in Tennessee during 2013.
Avg. Yield Seed± Std Err. Moisture § Lodging Height Maturity Shattering Quality Protein Oil
Brand Variety ‡ (n=6) (n=6) (n=4) (n=4) (n=4) (n=3) (n=1) (n=1) (n=1)bu/a % Score in. DAP -------- Score -------- % %
Mycogen 5N451R2 64 ± 2 14.5 1.6 35 129 1.0 1.5 33.0 20.1AGSouth Genetics AGS 43R212 (RR2Y) 64 ± 2 13.9 1.7 36 131 1.0 3.8 35.3 19.3Progeny 4211 RY (RR2Y) 63 ± 2 14.2 1.7 34 128 1.0 1.8 34.1 19.9Warren Seed DSR-4633/R2Y 63 ± 2 13.7 1.4 36 129 1.0 1.8 32.8 20.2Armor 44-R08 (RR2Y) 63 ± 2 14.7 1.8 33 127 1.0 2.2 34.4 19.8Steyer 4501 R2 (RR2Y) 62 ± 2 14.5 1.7 35 129 1.0 1.8 34.4 19.3Dyna-Gro 31RY45 (RR2Y) 62 ± 2 14.3 1.5 36 129 1.0 2.2 33.1 20.0Croplan RT 47995 (RR) 61 ± 2 14.0 1.5 34 128 1.0 1.5 34.3 19.6USG 74F53R (RR2Y/STS) 61 ± 2 15.7 1.9 36 129 1.0 2.3 35.5 19.7AGSouth Genetics AGS 45R212 (RR2Y) 61 ± 2 14.1 1.7 39 131 1.0 2.2 33.7 19.8USG 74A33R (RR2Y) 61 ± 2 14.6 2.0 32 130 1.0 2.0 35.5 19.1LG Seeds C4544R2 60 ± 2 14.9 1.7 38 129 1.0 2.2 33.0 20.1Morsoy Xtra R2 44X82 60 ± 2 14.3 1.3 34 130 1.0 1.8 35.3 19.1Steyer 4203 R2 (RR2Y) 60 ± 2 14.3 1.6 32 129 1.0 1.8 34.1 20.0Steyer 4401R2 60 ± 2 14.3 1.3 31 127 1.1 2.0 34.2 19.5Beck's Hybrids 444NR (RR) 59 ± 2 14.3 1.7 34 129 1.0 2.7 35.5 19.7Mycogen 5N423R2 (STS) 59 ± 2 14.9 1.4 35 128 1.0 2.2 33.7 20.2Dyna-Gro 39RY43 (RR2Y) 59 ± 2 14.6 1.6 33 128 1.0 1.8 34.5 19.6Mycogen 5N431R2 58 ± 2 14.5 1.7 34 129 1.0 2.5 34.2 20.0Warren Seed DS4330 R2Y 58 ± 2 14.5 2.0 33 130 1.0 1.7 35.4 19.1Asgrow AG4534 (RR2Y/STS) 58 ± 2 13.5 2.0 37 131 1.0 3.2 35.5 19.4Schillinger Seed 458 RCS 58 ± 2 14.1 1.7 38 131 1.0 2.7 36.0 18.8Armor 45-R60 (RR2Y/STS) 57 ± 2 14.5 1.3 31 126 1.0 1.7 34.8 19.7Asgrow AG4232 GENRR2Y (STS) 57 ± 2 14.9 2.0 35 128 1.0 2.5 34.3 19.1Progeny 4313 RY 57 ± 2 14.8 1.9 31 130 1.0 2.5 35.0 19.1Progeny 4510 RY (RR2Y/STS) 57 ± 2 14.2 1.6 34 129 1.0 2.5 34.6 19.1Dyna-Gro S44RS93 (RR2Y/STS) 56 ± 2 14.2 1.2 30 127 1.0 1.5 34.6 19.6NK S 41-J6 (RR2Y) 55 ± 2 14.1 1.7 35 128 1.0 2.5 35.7 19.3Beck's Hybrids 418NR (RR) 55 ± 2 13.7 1.4 34 127 1.0 2.5 33.5 20.4AgBorn Genetics LLC ABx71141 (RR) 55 ± 2 14.8 1.8 39 130 1.0 2.8 34.6 20.0AgBorn Genetics LLC ABx0448 (RR) 55 ± 2 14.4 2.3 37 129 1.0 2.0 34.2 19.8Armor X1401 (RR2) 54 ± 2 14.0 1.3 34 129 1.0 2.5 34.1 19.5Asgrow AG4433 GENRR2Y 53 ± 2 14.4 1.5 37 130 1.0 2.2 34.1 19.5TN Exp TN09-47,169 (RR2Y) 48 ± 2 18.0 1.6 32 132 1.0 2.3 36.1 18.6
Average 59 14.5 1.7 34.5 129.0 1.0 2.2 34.5 19.6† All yields are adjusted to 13% moisture. § Average moisture at harvest Maturity = days after planting (DAP). Protein & Oil on dry weight basis.‡ If a trait appears inside parentheses i.e. (RR), then it is not part of the variety name. Shattering = 1 to 5 scale; where 1 = no shattering; 5 = 90+% of pods shatteredLodging = 1 to 5 scale; where 1 = 95% of plants erect; 2.5 = ~50% of plants leaning at angle ≥ 45°; 5 = 95+% of plants leaning at an angle ≥ 45°.Seed Quality = 1 to 5 scale; where 1 = < 5% of seeds showing disease or split seed coats; 5=95+% of seed are diseased or have split seed coats.

Table 14. Yields †, plant health, and disease ratings of 34 Early Maturity Group IV (4.0 - 4.5) Roundup Ready soybeanvarieties evaluated at Milan, Tennessee during 2013.
Yield Yield Plant SDSMilan Milan Health DI DS DX
Brand Variety ‡ Irr. Non-Irr. (n=2) (n=1) (n=1) (n=1)bu/a bu/a (1-4) % 0 - 9 index
AGSouth Genetics AGS 43R212 (RR2Y) 67 70 1 17 2.7 64Progeny 4211 RY (RR2Y) 54 60 2 40 3.0 120Asgrow AG4534 (RR2Y/STS) 65 56 1 27 2.7 94USG 74F53R (RR2Y/STS) 61 56 1 40 3.3 133Dyna-Gro 39RY43 (RR2Y) 45 60 2 19 2.7 56Mycogen 5N431R2 51 59 2 43 3.3 153Warren Seed DSR-4633/R2Y 63 50 1 72 4.3 312LG Seeds C4544R2 55 51 1 47 3.7 187Dyna-Gro 31RY45 (RR2Y) 61 46 1 82 5.0 418Schillinger Seed 458 RCS 67 60 1 40 2.3 103Mycogen 5N451R2 59 46 1 75 5.3 417Armor 44-R08 (RR2Y) 47 49 1 42 3.3 182Progeny 4510 RY (RR2Y/STS) 58 59 1 45 3.3 155Steyer 4501 R2 (RR2Y) 59 48 1 56 4.0 322Warren Seed DS4330 R2Y 47 52 2 37 2.7 107AgBorn Genetics LLC ABx71141 (RR) 64 61 1 2 1.0 2Morsoy Xtra R2 44X82 49 52 3 6 1.7 12Croplan RT 47995 (RR) 61 46 1 37 4.0 170Steyer 4203 R2 (RR2Y) 44 55 2 45 3.7 223NK S 41-J6 (RR2Y) 56 54 3 17 2.0 38USG 74A33R (RR2Y) 44 51 3 17 2.7 47AGSouth Genetics AGS 45R212 (RR2Y) 56 48 2 52 4.0 228Asgrow AG4433 GENRR2Y 49 51 2 27 3.0 80Asgrow AG4232 GENRR2Y (STS) 46 36 1 92 6.7 617Armor X1401 (RR2) 52 44 3 30 3.3 110Beck's Hybrids 418NR (RR) 52 55 1 68 4.3 310Dyna-Gro S44RS93 (RR2Y/STS) 57 39 1 78 4.7 382Armor 45-R60 (RR2Y/STS) 54 35 1 88 6.7 587AgBorn Genetics LLC ABx0448 (RR) 48 54 2 32 3.0 152Steyer 4401R2 55 43 1 59 4.3 355Mycogen 5N423R2 (STS) 56 40 1 78 5.3 453Beck's Hybrids 444NR (RR) 53 45 2 67 4.0 273Progeny 4313 RY 41 50 3 22 3.0 65TN Exp TN09-47,169 (RR2Y) 42 60 2 28 3.7 112
Average 54 51 2 45 3.6 207† All yields are adjusted to 13% moisture.‡ If a trait appears inside parentheses i.e. (RR), then it is not part of the variety name.DI = disease incidence = percentage of plants with symptomsDS = disease severity = score of leaf chlorosis and necrosis; 0 = no symptoms; 9 = plant death before normal defoliation due to senescence.DX = disease index = (DI x DS / 9); ratings were made at approximately R6 when green pods with seed have reached full size on 8/28/13.

Table 15. Mean yields † of 19 Early Maturity Group IV (4.0 - 4.5) Roundup Ready soybean varietiesevaluated in five environments (n=10) in Tennessee for two years, 2012 - 2013.
Avg. Yield± Std Err. Milan
Brand Variety ‡ (n=10) Knoxville Irr. Non-Irr. Irr. Ames --------------------------------------------bu/a----------------------------------------------
Steyer 4501 R2 (RR2Y) 65 ± 1 87 65 56 70 48Armor 44-R08 (RR2Y) 64 ± 1 85 67 59 61 48Progeny 4211 RY (RR2Y) 64 ± 1 83 70 55 61 50Warren Seed DSR-4633/R2Y 64 ± 1 82 63 59 71 44AGSouth Genetics AGS 43R212 (RR2Y) 64 ± 1 72 68 56 75 47Dyna-Gro 31RY45 (RR2Y) 64 ± 1 87 61 55 68 46Mycogen 5N451R2 63 ± 1 84 62 55 67 49Asgrow AG4232 GENRR2Y (STS) 63 ± 1 80 61 58 64 51Progeny 4510 RY (RR2Y/STS) 62 ± 1 79 65 55 65 50Dyna-Gro 39RY43 (RR2Y) 62 ± 1 80 69 53 61 49Steyer 4203 R2 (RR2Y) 62 ± 1 73 71 58 60 49AGSouth Genetics AGS 45R212 (RR2Y) 61 ± 1 79 62 53 67 46Morsoy Xtra R2 44X82 61 ± 1 78 62 51 64 49NK S 41-J6 (RR2Y) 61 ± 1 83 59 46 70 46Asgrow AG4433 GENRR2Y 60 ± 1 80 59 50 65 46Armor 45-R60 (RR2Y/STS) 60 ± 1 76 61 59 58 46Dyna-Gro S44RS93 (RR2Y/STS) 60 ± 1 77 58 52 64 48Beck's Hybrids 418NR (RR) 59 ± 1 73 61 56 62 42Beck's Hybrids 444NR (RR) 58 ± 1 71 63 51 62 43Average (bu/a) 62 79 64 55 65 47L.S.D..05 (bu/a) 4 9 8.3 7 9 7C.V. (%) 8.9 7.7 9.1 8.5 9.3 10.3† All yields are adjusted to 13% moisture.‡ If a trait appears inside parentheses i.e. (RR), then it is not part of the variety name.
Springfield

Table 16. Mean yields † and agronomic characteristics of 19 Early Maturity Group IV (4.0 - 4.5) Roundup Ready soybean varietiesevaluated in five environments (n=10) in Tennessee for two years, 2012 - 2013.
Avg. Yield Seed± Std Err. Moisture § Lodging Height Maturity Shattering Quality Protein Oil
Brand Variety ‡ (n=10) (n=10) (n=8) (n=8) (n=8) (n=6) (n=2) (n=2) (n=2)bu/a % Score in. DAP ------ Score ------- % %
Steyer 4501 R2 (RR2Y) 65 ± 1 14.3 1.7 37 133 1.0 2.0 37.2 20.5Armor 44-R08 (RR2Y) 64 ± 1 14.3 1.8 35 131 1.0 2.8 38.1 20.6Progeny 4211 RY (RR2Y) 64 ± 1 13.9 1.7 35 131 1.0 2.5 37.6 20.9Warren Seed DSR-4633/R2Y 64 ± 1 13.7 1.6 38 133 1.0 2.3 36.7 21.5AGSouth Genetics AGS 43R212 (RR2Y) 64 ± 1 13.6 1.5 39 133 1.0 4.0 38.4 20.7Dyna-Gro 31RY45 (RR2Y) 64 ± 1 13.9 1.6 38 132 1.0 2.6 36.3 21.0Mycogen 5N451R2 63 ± 1 14.3 1.6 37 132 1.0 2.1 36.0 21.2Asgrow AG4232 GENRR2Y (STS) 63 ± 1 14.3 1.9 38 131 1.0 2.6 37.8 20.6Progeny 4510 RY (RR2Y/STS) 62 ± 1 14.0 1.7 36 133 1.0 2.3 37.2 20.3Dyna-Gro 39RY43 (RR2Y) 62 ± 1 14.1 1.6 35 131 1.0 2.7 38.5 20.8Steyer 4203 R2 (RR2Y) 62 ± 1 14.0 1.7 35 131 1.0 2.1 37.2 21.0AGSouth Genetics AGS 45R212 (RR2Y) 61 ± 1 13.9 1.6 41 133 1.0 2.8 36.7 21.1Morsoy Xtra R2 44X82 61 ± 1 13.7 1.2 35 132 1.0 2.5 38.4 20.7NK S 41-J6 (RR2Y) 61 ± 1 13.7 1.6 37 131 1.0 2.9 38.3 20.6Asgrow AG4433 GENRR2Y 60 ± 1 14.2 1.5 39 132 1.0 2.6 37.4 20.5Armor 45-R60 (RR2Y/STS) 60 ± 1 14.2 1.4 33 129 1.0 2.4 37.5 21.0Dyna-Gro S44RS93 (RR2Y/STS) 60 ± 1 13.9 1.3 32 130 1.0 2.3 37.3 20.9Beck's Hybrids 418NR (RR) 59 ± 1 13.5 1.6 34 130 1.0 2.8 37.3 21.3Beck's Hybrids 444NR (RR) 58 ± 1 14.0 1.7 37 131 1.0 2.9 38.4 20.9
Average 62 14.0 1.6 36 132 1.0 2.6 37.5 20.8† All yields are adjusted to 13% moisture.‡ If a trait appears inside parentheses i.e. (RR), then it is not part of the variety name.§ Average moisture at harvestLodging = 1 to 5 scale; where 1 = 95% of plants erect; 2.5 = ~50% of plants leaning at angle ≥ 45°; 5 = 95+% of plants leaning at an angle ≥ 45°.Maturity = days after planting (DAP).Shattering = 1 to 5 scale; where 1 = no shattering; 5 = 90+% of pods shattered.Seed Quality = 1 to 5 scale; where 1 = < 5% of seeds showing disease or split seed coats; 5 = 95+% of seed are diseased or have split seed coats.Protein & Oil on dry weight basis.

Table 17. Mean yields † of seven Early Maturity Group IV (4.0 - 4.5) Roundup Ready soybean varietiesevaluated in four environments (n=12) in Tennessee for three years, 2011 - 2013.
Avg. Yield± Std Err. Milan
Brand Variety ‡ (n=12) Knoxville Irr. Non-Irr. Irr. Ames ---------------------------------------------bu/a------------------------------------------
Steyer 4501 R2 (RR2Y) 65 ± 1 85 72 50 70 51Progeny 4211 RY (RR2Y) 63 ± 1 81 73 48 59 52Armor 44-R08 (RR2Y) 63 ± 1 81 71 49 61 51Progeny 4510 RY (RR2Y/STS) 62 ± 1 79 68 48 65 49Dyna-Gro 39RY43 (RR2Y) 62 ± 1 78 72 46 61 51Asgrow AG4232 GENRR2Y (STS) 62 ± 1 77 65 49 66 52Dyna-Gro 31RY45 (RR2Y) 62 ± 1 83 64 47 65 48Average (bu/a) 63 81 69 48 64 51L.S.D..05 (bu/a) 3 10 8 6 8 7C.V. (%) 8.9 8.5 8.6 9.4 8.6 9.4 † All yields are adjusted to 13% moisture.‡ If a trait appears inside parentheses i.e. (RR), then it is not part of the variety name.
Table 18. Mean yields † and agronomic characteristics of seven Early Maturity Group IV (4.0 - 4.5) Roundup Ready soybean varieties evaluated in four environments (n=12) in Tennessee for three years, 2011 - 2013.
Avg. Yield Seed± Std Err. Moisture § Lodging Height Maturity Shattering Quality Protein Oil
Brand Variety ‡ (n=12) (n=12) (n=12) (n=12) (n=12) (n=9) (n=3) (n=3) (n=3)bu/a % Score in. DAP ------------- Score ----- % %
Steyer 4501 R2 (RR2Y) 65 ± 1 13.8 1.7 39 133 1.0 1.9 38.0 21.0Progeny 4211 RY (RR2Y) 63 ± 1 13.6 1.8 36 131 1.0 2.5 38.1 21.6Armor 44-R08 (RR2Y) 63 ± 1 13.9 1.8 37 131 1.0 2.5 38.4 21.4Progeny 4510 RY (RR2Y/STS) 62 ± 1 13.6 1.8 38 133 1.0 2.2 38.0 20.9Dyna-Gro 39RY43 (RR2Y) 62 ± 1 13.9 1.8 36 132 1.0 2.7 38.8 21.5Asgrow AG4232 GENRR2Y (STS) 62 ± 1 13.8 1.8 38 131 1.0 2.5 38.0 21.1Dyna-Gro 31RY45 (RR2Y) 62 ± 1 13.5 1.8 39 132 1.0 2.5 36.6 21.8
Average 63 13.7 1.8 38 132 1.0 2.4 38.0 21.3† All yields are adjusted to 13% moisture.‡ If a trait appears inside parentheses i.e. (RR), then it is not part of the variety name.§ Average moisture at harvestLodging = 1 to 5 scale; where 1 = 95% of plants erect; 2.5 = ~50% of plants leaning at angle ≥ 45°; 5 = 95+% of plants leaning at an angle ≥ 45°.Maturity = days after planting (DAP).Shattering = 1 to 5 scale; where 1 = no shattering; 5 = 90+% of pods shattered.Leaf Retention (at harvest) = 1 to 5 scale; where 1 = < 5% of plants holding leaves at harvest maturity; 5=95+% of plants holding leaves and green stems at harvest maturity.Seed Quality = 1 to 5 scale; where 1 = < 5% of seeds showing disease or split seed coats; 5 = 95+% of seed are diseased or have split seed coats.Protein & Oil on dry weight basis.
Springfield

Table 19. Yields † of 14 Early Maturity Group IV (4.0 - 4.5) Roundup Ready soybean varieties in 12 County Standard Tests in Tennessee and Kentucky during 2013.Avg.
MS Brand/Variety Yld. Moist Cannon Coffee Dyer Franklin Henry Hickman Lake Lawrence Madison Obion Tipton Weakleybu/a % 5/30 § 5/2 5/28 5/21 6/24 6/14 5/14 6/28 5/30 5/28 6/21 7/8
A *Mycogen 5N451 RR2Y 70.6 13.4 70.8 76.8 64.7 80.7 77.6 74.5 73.6 65.5 79.2 61.6 69.1 53.4AB Dyna-Gro 39RY43 RR2Y 70.2 13.0 75.1 81.9 65.3 74.5 72.2 74.2 72.1 64.1 84.1 63.3 69.7 46.5AB Warren Seed DS 4340 R2Y 70.2 12.9 73.8 80.6 67.0 74.7 72.1 71.8 74.5 57.0 90.0 67.4 67.7 46.3AB Dyna-Gro 31RY45 RR2Y 70.1 13.2 64.9 82.5 64.7 75.1 75.0 71.8 59.4 63.1 95.5 71.6 66.6 51.3AB Asgrow AG4433 GENRR2Y 70.1 13.5 80.7 72.7 59.3 80.4 76.2 73.3 69.5 67.3 84.6 61.8 65.7 49.7AB *Asgrow AG4232 GENRR2Y/STS 69.6 13.4 74.7 75.0 66.9 77.3 70.1 68.6 68.3 63.4 79.2 74.7 66.8 50.3AB *Armor 44-R08 RR2Y 69.5 13.1 72.4 82.4 66.6 76.9 62.3 71.5 74.5 64.7 82.2 66.6 67.3 46.4AB *Croplan 4391 GENRR2Y 69.2 13.1 79.2 78.6 65.9 81.8 65.8 73.1 68.7 63.5 81.1 66.0 64.4 42.2ABC Ag South Genetics AGS45R212 67.3 13.3 70.4 76.5 64.5 86.4 67.8 72.6 53.7 63.1 73.3 69.5 63.5 46.3BC Progeny P4510 RY/STS 66.9 13.1 74.4 81.2 58.0 60.6 73.7 68.9 59.5 64.8 77.0 63.7 64.6 56.0C USG 74D32 RR2Y 65.3 13.2 71.4 77.1 61.1 67.5 67.5 59.3 61.4 58.5 87.5 59.5 64.5 47.7C Armor 45-R60 RR2/STS 64.8 13.5 63.3 73.7 62.6 88.5 59.4 66.1 56.2 59.9 79.3 59.6 61.2 48.4C USG 74F12 RR2Y 64.6 13.1 69.4 79.2 66.6 67.9 59.7 63.3 63.7 56.2 85.6 57.9 65.1 40.3C Schillinger 458.RCS 63.6 13.3 71.2 77.5 60.4 68.3 64.0 67.2 60.8 55.2 71.1 63.9 62.9 41.2
Average (bu/a) 68.0 13.2 72.3 78.3 63.8 75.8 68.8 69.7 65.4 61.9 82.1 64.8 65.6 47.6† Yields have been adjusted to 13% moisture.‡ Moisture at harvest.§ Planting date.Each variety was evaluated in a large strip-plot at each loction, thus each county test was considered as one replication of the test in calculating the average yield and in conducting the statistical analysis to determine significant differences (MS).Varieties marked with an asterisk (*) were in the top performing group in 2012.MS= Varieties with any MS letter in common are not statistically different at the 5% level of probability.Data provided by Robert C. Williams, Ext. Area Specialist, Grain Crops, and the extension agents in the counties shown above.

Kentucky County Standard Tests during 2013. CSTAvg.Yield Frogeye SCN
MS Brand/Variety (n=12) RECM/WTREC Sudden Death Treated ¶ Untreated Treated ¶ Untreated Race 2 Race 3 Race 5bu/a bu/a bu/a
A Mycogen 5N451 RR2Y* 70.6 LOW/LOW LOW-MOD 45.3 41.7 52.0 50.8 S MS SAB Dyna-Gro 39RY43 RR2Y 70.2 MOD/LOW LOW 35.6 33.5 52.3 40.9 MS S SAB Warren Seed DS 4340 R2Y 70.2 MOD/LOW LOW 34.7 33.8 48.2 39.1 S MS SAB Dyna-Gro 31RY45 RR2Y 70.1 LOW/LOW LOW-MOD 43.2 41.3 57.0 54.0 MS MS SAB Asgrow AG4433 GENRR2Y 70.1 MOD/MOD LOW 39.3 31.2 50.6 47.6 S S SAB Asgrow AG4232 GENRR2Y/STS* 69.6 MOD/MOD LOW-HIGH 45.1 44.7 59.8 51.7 S MS SAB Armor 44-R08 RR2Y* 69.5 MOD/LOW LOW-HIGH 40.2 34.1 53.3 48.6 S MS SAB Croplan 4391 GENRR2Y* 69.2 MOD/LOW LOW 37.2 33.8 53.8 49.1 S S MSABC Ag South Genetics AGS45R212 67.3 LOW/LOW LOW 42.4 43.9 49.7 39.8 S S SBC Progeny P4510 RY/STS 66.9 MOD/MOD LOW 41.3 38.4 58.9 51.8 S MS MSC USG 74D32 RR2Y 65.3 LOW/LOW LOW 36.6 33.3 47.3 44.9 S S MRC Armor 45-R60 RR2/STS 64.8 LOW/LOW LOW-HIGH 44.0 42.4 50.7 50.0 S MS SC USG 74F12 RR2Y 64.6 LOW/LOW LOW 36.3 37.4 44.2 47.7 S MS SC Schillinger 458.RCS 63.6 MOD/LOW LOW 46.0 40.5 47.0 45.1 MS MS S
Average (bu/a) 68.0 40.5 37.9 51.8 47.2Varieties marked with an asterisk (*) were in the top performing group in 2012.YLD= Avg. Yield @ 13% moisture.MS= Varieties that have any MS letter in common are not statistically different in yield at the 5% level of probability.County locations include: Cannon, Coffee, Dyer, Franklin, Henry, Hickman, Lake, Lawrence, Madison,Obion, Tipton and Weakley.¶ Treated plots at RECM & WTREC sprayed with Quadris TOP @ 8 oz./Acre + 1% Induce @ R3 growth stage. RECM varieties planted May 28 and WTREC planted June 29 Disease ratings (of unsprayed plots) for Frogeye and Sudden Death are LOW (0-10% disease), MOD (11-40% disease), HIGH (41-100%)Disease ratings & yield data compiled by Dr. Heather Kelly from replicated plots at the Research and Education Center at Milan (RECM, which has severe disease pressure) and the West Tennessee Research and Education Center (WTREC, which has low disease pressure due to regular crop rotation).SCN Greenhouse Ratings compiled by Dr. Pat Donald, Research Plant Path., USDA-ARS, WTREC. Race 2 (HG Type 1.2.5.7), Race 3 (HG Type 7) andRace 5 (HG Type 2.5.7), HS = Highly Susceptible, S = Susceptible, MS = Moderately Susceptible, MR = Moderately Resistant, R = Resistant.
Table 20. Yields † and disease ratings § of 14 early Maturity Group IV (4.0 - 4.5) Roundup Ready soybean varieties evaluated in 12 Tennessee and
------------------------------------- Research and Education Center at Milan (RECM) and Jackson (WTREC)------------------------------------RECM Yield WTREC Yield

Table 21. Overall average yields † and moistures of 10 Early Maturity Group IV (4.0 - 4.5) Roundup Ready soybean varietiesevaluated in County Standard Tests (n=12) and AgResearch and Education Centers (n=6) in Tennessee during 2013.
Research and Averages of CST & REC Tests County Standard Trials Education Center Trials
Avg. Avg. Avg.Brand Variety ‡ Yield Moisture Yield Moisture Yield Moisture
bu/a % bu/a % bu/a %Mycogen 5N451R2 67 13.9 71 13.4 64 14.5Armor 44-R08 (RR2Y) 66 13.9 69 13.1 63 14.7Dyna-Gro 31RY45 (RR2Y) 66 13.8 70 13.2 62 14.3Dyna-Gro 39RY43 (RR2Y) 65 13.8 70 13.0 59 14.6AGSouth Genetics AGS 45R212 (RR2Y) 64 13.7 67 13.3 61 14.1Asgrow AG4232 GENRR2Y (STS) 63 14.1 70 13.4 57 14.9Progeny 4510 RY (RR2Y/STS) 62 13.7 67 13.1 57 14.2Asgrow AG4433 GENRR2Y 62 13.9 70 13.5 53 14.4Armor 45-R60 (RR2Y/STS) 61 14.0 65 13.5 57 14.5Schillinger Seed 458 RCS 61 13.7 64 13.3 58 14.1Average (bu/a) 64 13.9 68 13.3 59 14.4† Yields have been adjusted to 13% moisture.‡ If a trait appears inside parentheses i.e. (RR), then it is not part of the variety name.

Table 22. Mean yields † of 75 Late Maturity Group IV (4.6 - 4.9) Roundup Ready soybean varieties evaluated in six environments in Tennessee during 2013.
Avg. Yield± Std Err. Springfield Milan AgCenter
Brand Variety ‡ (n=6) Knoxville Irr. Non-Irr. Irr. Ames Memphis
Progeny 4850 RY 64 ± 2 70 85 62 61 57 49Warren Seed DSR-4850/R2Y (STS) 64 ± 2 66 83 64 61 56 51Morsoy Xtra R2 47X12 (STS) 63 ± 2 47 81 70 56 71 51Armor 48-R91 (RR2Y/STS) 63 ± 2 64 77 64 58 63 48Delta Grow 4765 R2Y 62 ± 2 58 78 62 62 61 52Progeny 4613 RY 62 ± 2 65 80 51 63 66 47Delta Grow 4670 R2Y 61 ± 2 76 81 51 56 55 48Terral-REV Brand 48R44 (RR) 61 ± 2 71 77 53 63 53 49Caverndale Farms 486 RR2Y/STSn 60 ± 2 60 78 58 59 62 46Asgrow AG4832 GENRR2Y (STS) 60 ± 2 58 78 59 61 60 46Terral-REV Brand 46R64 (RR) 60 ± 2 68 85 56 53 56 42AGSouth Genetics AGS 47R212 (RR) 59 ± 2 70 73 58 57 52 44Steyer 4702 R2 (RR2Y) 59 ± 2 65 80 54 57 51 46Asgrow AG4632 GENRR2Y (STS) 59 ± 2 56 80 58 56 54 47Terral-REV Brand 48R33 (RR) 59 ± 2 65 76 57 55 56 42Delta Grow 4825 R2Y/STS 58 ± 2 59 72 57 57 52 52Hornbeck HBK RY 4721 (RR2Y) 58 ± 2 56 76 55 55 57 50Asgrow AG4934 (RR2Y/STS) 58 ± 2 56 80 56 56 53 45Beck's Hybrids 477NR (RR) 58 ± 2 57 74 55 58 57 44Terral-REV Brand 47R34 (RR) 57 ± 2 36 80 58 55 67 48Asgrow AG4933 GENRR2Y 57 ± 2 51 76 55 53 57 52Progeny 4710 RY (RR2Y/STS) 57 ± 2 59 69 60 58 50 50USG 74A79R (RR2Y/STS) 57 ± 2 52 66 56 55 65 49Hornbeck HBK RY 4620 (RR2Y/STS) 57 ± 2 49 74 53 54 66 46USG 74B83R (RR2Y/STS) 57 ± 2 48 77 54 53 61 48Croplan R2C 4873 S 57 ± 2 34 73 60 60 59 55Croplan R2C 4752 S 57 ± 2 29 81 61 57 64 47Delta Grow 4940 RR 57 ± 2 69 67 58 51 58 37USG 74A91 (RR) 57 ± 2 69 77 52 48 49 44NK S 48-P4 (RR2Y/STS) 56 ± 2 56 70 51 57 60 45Morsoy Xtra R2 48X02 56 ± 2 42 82 53 60 55 47USG 74A69R (RR2Y) 56 ± 2 61 69 56 51 56 45Terral-REV Brand 49R94 (RR) 56 ± 2 40 85 59 57 49 46Dyna-Gro S48RS53 (RR2Y/STS) 56 ± 2 31 80 56 57 66 47LG Seeds C4867R2 56 ± 2 32 77 53 63 59 53Progeny 4747 RY (RR2Y) 56 ± 2 29 81 66 61 50 49Delta Grow 4925 R2Y 56 ± 2 69 69 55 50 47 45USG 74H92R (RR2Y) 56 ± 2 59 80 50 51 51 44Delta Grow 4755 R2Y 56 ± 2 44 76 59 64 48 43Armor 49-R56 (RR2Y) 55 ± 2 69 75 55 50 43 41
-------------------------------bu/a--------------------------------------

Table 22 (continued)Avg. Yield± Std Err. Springfield Milan AgCenter
Brand Variety ‡ (n=5) Knoxville Irr. Non-Irr. Irr. Ames Memphis
Progeny 4900 RY (RR2Y) 55 ± 2 54 78 63 52 38 46LG Seeds C4780R2 55 ± 2 30 75 60 60 54 52Mycogen 5N478R2 55 ± 2 16 81 58 66 62 47TN Exp TN12-4715 (RR2Y) 55 ± 2 46 83 53 54 52 40Schillinger Seed 4990 RC 55 ± 2 29 81 60 58 55 45Steyer 4802 R2 (RR2Y/STS) 54 ± 2 22 77 60 59 57 51Terral-REV Brand 48R22 (RR) 54 ± 2 66 70 55 52 40 44Terral-REV Brand 46R73 (RR) 54 ± 2 42 79 52 52 54 46Armor X1409 (RR2) 54 ± 2 64 74 52 51 41 41Terral-REV Brand 49R22 (RR) 54 ± 2 71 78 46 49 37 40Terral-REV Brand 47R53 (RR) 54 ± 2 58 72 48 52 46 45Asgrow AG4633 GENRR2Y 53 ± 2 58 75 48 50 45 45USG 74B81R (RR2Y/STS) 53 ± 2 42 72 49 52 58 45Dyna-Gro S47RY13 (RR2Y) 53 ± 2 52 76 49 53 41 46TN Exp TN11-4512 (RR2Y) 52 ± 2 69 64 49 44 50 38Armor 48-R66 (RR2/STS) 52 ± 2 19 76 59 53 53 53Midwest Premium Genetics MPG4714 (RR) 52 ± 2 49 68 49 49 51 45Dyna-Gro SX 13346R (RR2Y) 52 ± 2 56 71 46 50 42 45Armor 47-R13 (RR2Y/STS) 52 ± 2 15 77 61 58 56 43Caverndale Farms 496 RR2Yn 51 ± 2 44 69 55 53 45 40Schillinger Seed 495 RC 50 ± 2 31 75 61 56 33 47LG Seeds C4625 R2 50 ± 2 34 67 43 50 59 50NK S 46-L2 (RR2Y) 50 ± 2 24 70 56 55 53 45AgBorn Genetics LLC ABx57318 (RR/STS) 50 ± 2 23 66 54 49 58 48Morsoy Xtra R2 46X29 (STS) 50 ± 2 18 66 53 52 66 44Morsoy Xtra 49X14 (RR) 50 ± 2 19 77 56 46 55 44Schillinger Seed 4712R2 49 ± 2 40 62 49 56 46 41Delta Grow 4880 RR 49 ± 2 55 68 42 51 35 41AgBorn Genetics LLC ABx2105 (RR) 48 ± 2 39 65 55 49 44 36Caverndale Farms 466 RR2Yn 47 ± 2 35 66 44 50 47 40Armor X1406 (RR2/STS) 46 ± 2 12 73 52 50 44 45NK S 47-N3 (RR2Y) 45 ± 2 20 71 46 47 45 43Delta Grow 4970 RR 44 ± 2 16 68 51 48 38 46TN Exp TN12-4743 (RR2Y) 43 ± 2 33 55 55 41 41 34AgBorn Genetics LLC ABx2164 (RR) 43 ± 2 22 63 42 39 46 43Average (bu/a) 55 47 74 55 54 53 46L.S.D..05 (bu/a) 4 7 10 6 12 7 7C.V. (%) 9.4 6.1 11.4 6.5 13.6 8.8 8.8† All yields are adjusted to 13% moisture.‡ If a trait appears inside parentheses i.e. (RR), then it is not part of the variety name.
-------------------------------bu/a--------------------------------------

Table 23. Mean yields † and agronomic characteristics of 75 Late Maturity Group IV (4.6 - 4.9) Roundup Ready soybean varieties evaluated in six environments in Tennessee in 2013.
Avg. Yield Seed± Std Err. Moisture § Lodging Height Maturity Shattering Quality Protein Oil Frogeye
Brand Variety ‡ (n=6) (n=6) (n=4) (n=4) (n=4) (n=3) (n=1) (n=1) (n=1) (n=1)bu/a % Score in. DAP -------- Score -------- % % Score
Progeny 4850 RY 64 ± 2 15.6 1.6 42 132 1.0 2.3 34.4 19.3 3.7Warren Seed DSR-4850/R2Y (STS) 64 ± 2 15.0 1.7 41 132 1.1 1.8 34.7 18.9 3.7Morsoy Xtra R2 47X12 (STS) 63 ± 2 15.5 1.6 41 132 1.0 2.0 34.8 18.9 4.3Armor 48-R91 (RR2Y/STS) 63 ± 2 15.2 1.8 40 131 1.0 2.2 33.8 19.0 3Delta Grow 4765 R2Y 62 ± 2 15.0 1.7 39 131 1.1 2.5 34.6 19.0 3.7Progeny 4613 RY 62 ± 2 14.8 1.9 39 132 1.0 2.7 35.1 18.9 5Delta Grow 4670 R2Y 61 ± 2 14.3 1.8 37 129 1.0 1.3 32.5 20.0 2.7Terral-REV Brand 48R44 (RR) 61 ± 2 14.6 1.9 38 132 1.0 1.8 34.1 20.1 2Caverndale Farms 486 RR2Y/STSn 60 ± 2 15.1 2.0 34 134 1.0 2.3 34.5 19.0 6.3Asgrow AG4832 GENRR2Y (STS) 60 ± 2 15.1 1.7 40 131 1.0 2.0 34.6 19.4 4.7Terral-REV Brand 46R64 (RR) 60 ± 2 14.6 1.9 38 131 1.0 2.2 33.2 20.5 6AGSouth Genetics AGS 47R212 (RR) 59 ± 2 14.5 1.9 36 130 1.0 1.5 33.1 20.2 3.3Steyer 4702 R2 (RR2Y) 59 ± 2 14.6 1.9 37 131 1.0 1.8 33.7 20.0 5Asgrow AG4632 GENRR2Y (STS) 59 ± 2 15.1 1.7 36 130 1.1 1.7 33.0 19.7 2.3Terral-REV Brand 48R33 (RR) 59 ± 2 14.6 2.0 40 131 1.0 2.0 34.2 19.4 2.7Delta Grow 4825 R2Y/STS 58 ± 2 15.1 2.0 35 133 1.0 2.7 34.1 19.2 7Hornbeck HBK RY 4721 (RR2Y) 58 ± 2 15.3 1.7 41 131 1.0 2.3 33.8 19.0 2.7Asgrow AG4934 (RR2Y/STS) 58 ± 2 14.8 1.5 39 132 1.0 2.3 34.4 19.2 5.7Beck's Hybrids 477NR (RR) 58 ± 2 14.1 2.0 40 132 1.0 3.0 34.9 19.3 3.3Terral-REV Brand 47R34 (RR) 57 ± 2 14.4 2.1 41 131 1.0 2.2 34.9 19.1 2.7Asgrow AG4933 GENRR2Y 57 ± 2 15.2 1.5 38 134 1.0 2.2 35.2 19.0 3.7Progeny 4710 RY (RR2Y/STS) 57 ± 2 14.8 1.9 37 131 1.0 1.3 34.4 19.6 4USG 74A79R (RR2Y/STS) 57 ± 2 14.8 1.8 35 129 1.0 2.8 34.0 19.6 7.3Hornbeck HBK RY 4620 (RR2Y/STS) 57 ± 2 15.0 1.6 35 129 1.0 2.0 34.3 19.5 6.7USG 74B83R (RR2Y/STS) 57 ± 2 15.2 1.9 35 132 1.0 1.8 34.1 19.2 5.7Croplan R2C 4873 S 57 ± 2 14.8 2.0 35 133 1.0 2.3 34.3 19.2 5.3Croplan R2C 4752 S 57 ± 2 15.1 1.5 40 131 1.1 2.0 34.7 18.9 4Delta Grow 4940 RR 57 ± 2 15.9 2.8 42 137 1.0 2.0 34.6 19.0 3.7USG 74A91 (RR) 57 ± 2 15.4 1.7 39 132 1.0 2.5 34.4 19.9 6.3NK S 48-P4 (RR2Y/STS) 56 ± 2 14.8 1.7 40 130 1.0 2.5 34.6 19.5 5.3Morsoy Xtra R2 48X02 56 ± 2 14.6 1.8 38 131 1.0 1.3 33.8 19.8 4.3USG 74A69R (RR2Y) 56 ± 2 14.7 1.6 35 128 1.0 2.7 34.0 19.2 8.7Terral-REV Brand 49R94 (RR) 56 ± 2 14.2 2.0 38 131 1.0 1.5 34.4 19.9 2.3Dyna-Gro S48RS53 (RR2Y/STS) 56 ± 2 15.5 1.5 39 132 1.0 1.5 34.7 18.9 3.3LG Seeds C4867R2 56 ± 2 15.5 2.0 35 133 1.0 2.5 34.5 19.2 6Progeny 4747 RY (RR2Y) 56 ± 2 14.4 1.7 37 130 1.1 1.7 33.7 19.8 5.3Delta Grow 4925 R2Y 56 ± 2 15.1 1.8 38 133 1.0 1.5 33.6 19.4 6USG 74H92R (RR2Y) 56 ± 2 14.4 1.8 35 133 1.0 2.3 35.6 19.1 4.3Delta Grow 4755 R2Y 56 ± 2 14.7 1.7 37 131 1.1 1.3 33.8 20.1 4.7Armor 49-R56 (RR2Y) 55 ± 2 14.9 1.7 32 132 1.0 2.2 34.8 19.3 6Progeny 4900 RY (RR2Y) 55 ± 2 15.0 1.6 34 132 1.0 2.3 34.2 19.5 5.7LG Seeds C4780R2 55 ± 2 15.1 1.5 39 131 1.0 1.5 34.8 19.0 4Mycogen 5N478R2 55 ± 2 14.8 1.7 40 131 1.0 2.5 33.9 19.1 2.7

Table 23 (continued)Avg. Yield Seed± Std Err. Moisture § Lodging Height Maturity Shattering Quality Protein Oil Frogeye
Brand Variety ‡ (n=5) (n=5) (n=4) (n=4) (n=4) (n=3) (n=1) (n=1) (n=1) (n=1)bu/a % Score in. DAP -------- Score -------- % % Score
TN Exp TN12-4715 (RR2Y) 55 ± 2 14.8 2.0 40 132 1.0 2.2 34.5 18.9 3.7Schillinger Seed 4990 RC 55 ± 2 14.5 2.2 40 134 1.0 2.3 35.0 19.3 1.7Steyer 4802 R2 (RR2Y/STS) 54 ± 2 14.9 2.2 34 133 1.0 1.8 34.1 19.3 5.3Terral-REV Brand 48R22 (RR) 54 ± 2 14.7 2.0 36 132 1.1 2.0 35.5 18.7 3.7Terral-REV Brand 46R73 (RR) 54 ± 2 14.6 1.9 38 131 1.0 1.8 34.6 20.1 2.3Armor X1409 (RR2) 54 ± 2 15.3 1.9 37 132 1.1 1.5 34.1 19.4 5.3Terral-REV Brand 49R22 (RR) 54 ± 2 14.6 1.9 41 133 1.0 2.8 35.9 18.6 5.7Terral-REV Brand 47R53 (RR) 54 ± 2 14.6 2.2 37 128 1.0 1.5 34.9 20.8 2.7Asgrow AG4633 GENRR2Y 53 ± 2 14.5 1.5 32 131 1.0 2.0 33.1 19.7 5.7USG 74B81R (RR2Y/STS) 53 ± 2 15.1 1.7 40 130 1.0 1.8 34.3 19.7 4Dyna-Gro S47RY13 (RR2Y) 53 ± 2 15.1 1.8 37 131 1.0 2.2 33.5 19.9 4.7TN Exp TN11-4512 (RR2Y) 52 ± 2 16.9 1.7 29 137 1.0 1.7 35.4 18.9 3.7Armor 48-R66 (RR2/STS) 52 ± 2 14.7 2.0 34 133 1.0 2.2 34.1 19.2 5.3Midwest Premium Genetics MPG4714 (RR) 52 ± 2 14.9 2.2 40 133 1.0 3.2 35.1 19.5 4.7Dyna-Gro SX 13346R (RR2Y) 52 ± 2 14.9 1.5 33 130 1.0 2.5 33.1 20.0 6.7Armor 47-R13 (RR2Y/STS) 52 ± 2 15.3 1.6 39 131 1.0 2.2 35.1 18.6 3.3Caverndale Farms 496 RR2Yn 51 ± 2 14.4 1.6 38 133 1.0 1.8 34.0 19.2 6.3Schillinger Seed 495 RC 50 ± 2 14.8 2.4 42 132 1.0 2.8 35.5 19.3 2LG Seeds C4625 R2 50 ± 2 14.5 1.8 35 128 1.0 2.5 34.2 19.2 7.7NK S 46-L2 (RR2Y) 50 ± 2 14.4 1.8 35 130 1.0 2.3 34.8 19.1 6.3AgBorn Genetics LLC ABx57318 (RR/STS) 50 ± 2 14.0 1.8 37 130 1.1 2.7 34.1 20.0 5.3Morsoy Xtra R2 46X29 (STS) 50 ± 2 14.5 1.6 34 128 1.0 2.8 34.3 19.1 8.7Morsoy Xtra 49X14 (RR) 50 ± 2 14.5 1.9 37 134 1.0 2.0 34.6 19.5 6Schillinger Seed 4712R2 49 ± 2 14.1 1.7 36 128 1.0 1.5 34.9 20.0 4.7Delta Grow 4880 RR 49 ± 2 14.3 2.2 35 132 1.0 1.5 35.6 19.3 1.7AgBorn Genetics LLC ABx2105 (RR) 48 ± 2 15.8 1.7 36 134 1.0 2.2 34.3 19.7 5.7Caverndale Farms 466 RR2Yn 47 ± 2 14.5 1.4 33 131 1.0 2.0 33.4 20.3 5Armor X1406 (RR2/STS) 46 ± 2 14.1 1.7 37 129 1.0 2.5 33.7 20.1 5NK S 47-N3 (RR2Y) 45 ± 2 13.8 2.2 34 130 1.0 2.0 35.9 18.6 3.7Delta Grow 4970 RR 44 ± 2 14.8 2.5 40 134 1.0 2.5 35.4 19.4 2TN Exp TN12-4743 (RR2Y) 43 ± 2 15.1 2.8 31 134 1.0 1.5 35.0 18.6 5AgBorn Genetics LLC ABx2164 (RR) 43 ± 2 13.8 1.9 33 128 1.0 1.7 33.9 20.3 5.7
Average 55 14.8 1.8 37.2 131.5 1.0 2.1 34.4 19.4 4.6† All yields are adjusted to 13% moisture.‡ If a trait appears inside parentheses i.e. (RR), then it is not part of the variety name.§ Average moisture at harvestLodging = 1 to 5 scale; where 1 = 95% of plants erect; 2.5 = ~50% of plants leaning at angle ≥ 45°; 5 = 95+% of plants leaning at an angle >45°. Maturity = days after planting (DAP).Shattering = 1 to 5 scale; where 1 = no shattering; 5 = 90+% of pods shattered.Seed Quality = 1 to 5 scale; where 1 = < 5% of seeds showing disease or split seed coats; 5=95+% of seed are diseased or have split seed coats.Protein & Oil on dry weight basis.Disease ratings for Frogeye Leaf Spot are from 1-9, where 0=no disease & 10=maximum amount of plant disease or plant death. Ratings taken 8/26/13 in Knoxville, TN

Table 24. Yields †, plant health, and disease ratings of 75 Late Maturity Group IV (4.6 - 4.9) Roundup Ready soybean varieties evaluated at Milan, Tennessee during 2013.
Yield Yield Plant SDSMilan Milan Health DI DS DX
Brand Variety ‡ Irr. Non-Irr. (n=2) (n=1) (n=1) (n=1)bu/a bu/a (1-4) % 0 - 9 index
Morsoy Xtra R2 47X12 (STS) 71 48 1 73 3.7 268Steyer 4802 R2 (RR2Y/STS) 57 71 1 50 3.3 170Progeny 4613 RY 66 68 1 50 3.7 193Terral-REV Brand 47R34 (RR) 67 59 1 38 4.0 208Armor 48-R91 (RR2Y/STS) 63 56 1 81 5.0 420Mycogen 5N478R2 62 52 1 73 5.0 390Warren Seed DSR-4850/R2Y (STS) 56 50 1 89 5.0 451Croplan R2C 4752 S 64 54 2 72 5.0 400Dyna-Gro S48RS53 (RR2Y/STS) 66 58 1 47 4.3 230Progeny 4747 RY (RR2Y) 50 56 2 52 4.0 220Caverndale Farms 486 RR2Y/STSn 62 59 1 52 3.7 208USG 74B83R (RR2Y/STS) 61 68 1 67 4.0 267LG Seeds C4867R2 59 57 1 60 4.3 260Croplan R2C 4873 S 59 54 1 60 3.7 223TN Exp TN12-4715 (RR2Y) 52 77 2 15 2.3 37Delta Grow 4765 R2Y 61 44 1 68 3.7 262Schillinger Seed 4990 RC 55 58 2 77 5.0 392LG Seeds C4780R2 54 55 1 76 5.3 429Progeny 4850 RY 57 42 1 90 6.3 570Delta Grow 4825 R2Y/STS 52 64 1 53 3.7 193Armor 47-R13 (RR2Y/STS) 56 60 1 62 4.3 275Terral-REV Brand 48R44 (RR) 53 60 2 73 4.0 300Terral-REV Brand 46R64 (RR) 56 61 1 77 4.7 360Asgrow AG4832 GENRR2Y (STS) 60 44 1 63 4.3 322Steyer 4702 R2 (RR2Y) 51 60 1 63 3.7 237Armor 48-R66 (RR2/STS) 53 54 1 73 4.7 347Delta Grow 4755 R2Y 48 56 1 57 3.0 170Morsoy Xtra 49X14 (RR) 55 66 3 15 2.3 33Morsoy Xtra R2 48X02 55 47 2 70 4.3 310Asgrow AG4933 GENRR2Y 57 48 3 23 2.7 63Hornbeck HBK RY 4721 (RR2Y) 57 47 1 67 3.3 223Asgrow AG4934 (RR2Y/STS) 53 49 1 72 4.0 297USG 74A79R (RR2Y/STS) 65 48 1 75 4.7 368Terral-REV Brand 49R94 (RR) 49 41 1 66 4.7 329Hornbeck HBK RY 4620 (RR2Y/STS) 66 42 1 85 3.7 310Beck's Hybrids 477NR (RR) 57 48 2 57 4.3 247Asgrow AG4632 GENRR2Y (STS) 54 40 1 90 5.7 537Terral-REV Brand 46R73 (RR) 54 52 1 75 5.0 378Morsoy Xtra R2 46X29 (STS) 66 52 1 53 3.7 223USG 74H92R (RR2Y) 51 56 2 35 2.7 103

Table 24 (continued)Yield Yield Plant SDSMilan Milan Health DI DS DX
Brand Variety ‡ Irr. Non-Irr. (n=2) (n=1) (n=1) (n=1)Terral-REV Brand 48R33 (RR) 56 44 1 73 5.0 383NK S 48-P4 (RR2Y/STS) 60 47 1 72 4.7 338AGSouth Genetics AGS 47R212 (RR) 52 44 2 61 5.0 334Progeny 4900 RY (RR2Y) 38 51 2 60 4.7 310Delta Grow 4670 R2Y 55 34 1 82 5.0 413Dyna-Gro S47RY13 (RR2Y) 41 57 2 28 2.7 88USG 74A91 (RR) 49 52 2 67 4.3 300Midwest Premium Genetics MPG4714 (RR) 51 59 2 62 4.7 317USG 74A69R (RR2Y) 56 44 1 63 4.3 307Progeny 4710 RY (RR2Y/STS) 50 35 1 88 6.0 535LG Seeds C4625 R2 59 52 1 49 3.7 240Delta Grow 4940 RR 58 49 2 20 2.3 43USG 74B81R (RR2Y/STS) 58 44 1 77 6.0 497AgBorn Genetics LLC ABx57318 (RR/STS) 58 41 1 67 5.7 383NK S 46-L2 (RR2Y) 53 36 2 82 4.3 368Terral-REV Brand 47R53 (RR) 46 49 2 77 4.7 373Asgrow AG4633 GENRR2Y 45 50 3 16 2.7 58Terral-REV Brand 49R22 (RR) 37 59 2 43 3.7 160Armor X1406 (RR2/STS) 44 45 1 53 3.7 200Terral-REV Brand 48R22 (RR) 40 46 3 9 3.0 27Delta Grow 4925 R2Y 47 39 3 57 3.7 203Schillinger Seed 495 RC 33 29 1 97 5.3 518Caverndale Farms 496 RR2Yn 45 38 2 72 4.3 325NK S 47-N3 (RR2Y) 45 47 2 43 3.0 130TN Exp TN11-4512 (RR2Y) 50 55 2 50 3.0 170Schillinger Seed 4712R2 46 45 1 67 4.0 280Dyna-Gro SX 13346R (RR2Y) 42 43 3 40 2.7 107Armor 49-R56 (RR2Y) 43 34 3 42 3.3 221Armor X1409 (RR2) 41 32 3 63 4.0 250TN Exp TN12-4743 (RR2Y) 41 57 1 37 3.3 140Caverndale Farms 466 RR2Yn 47 35 3 24 2.7 71Delta Grow 4970 RR 38 32 2 97 5.7 550AgBorn Genetics LLC ABx2105 (RR) 44 29 2 87 5.7 497Delta Grow 4880 RR 35 34 2 85 4.0 340AgBorn Genetics LLC ABx2164 (RR) 46 23 1 81 7.0 566
Average 53 49 2 61 4 284† All yields are adjusted to 13% moisture.‡ If a trait appears inside parentheses i.e. (RR), then it is not part of the variety name.DI = disease incidence = percentage of plants with symptomsDS = disease severity = score of leaf chlorosis and necrosis; 0 = no symptoms; 9 = plant death before normal defoliation due to senescence.DX = disease index = (DI x DS / 9); ratings were made at approximately R6 when green pods with seed have reached full size on 8/28/13.
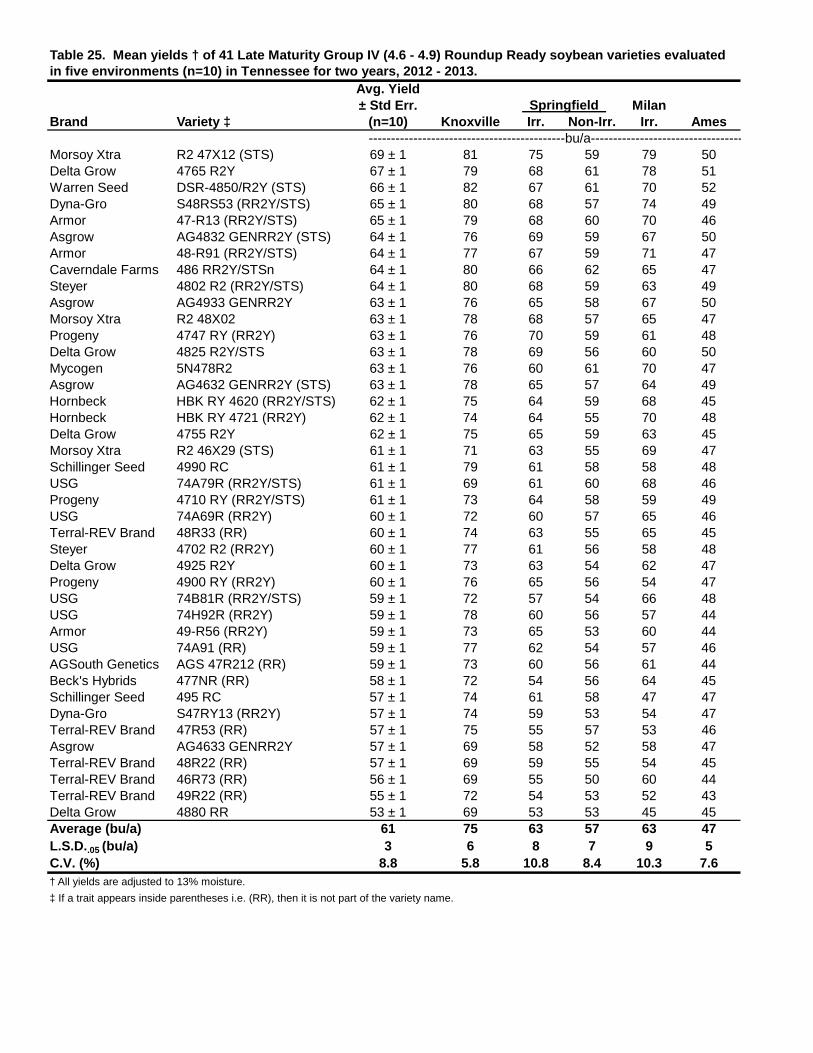
Table 25. Mean yields † of 41 Late Maturity Group IV (4.6 - 4.9) Roundup Ready soybean varieties evaluated in five environments (n=10) in Tennessee for two years, 2012 - 2013.
Avg. Yield± Std Err. Springfield Milan
Brand Variety ‡ (n=10) Knoxville Irr. Non-Irr. Irr. Ames --------------------------------------------bu/a----------------------------------
Morsoy Xtra R2 47X12 (STS) 69 ± 1 81 75 59 79 50Delta Grow 4765 R2Y 67 ± 1 79 68 61 78 51Warren Seed DSR-4850/R2Y (STS) 66 ± 1 82 67 61 70 52Dyna-Gro S48RS53 (RR2Y/STS) 65 ± 1 80 68 57 74 49Armor 47-R13 (RR2Y/STS) 65 ± 1 79 68 60 70 46Asgrow AG4832 GENRR2Y (STS) 64 ± 1 76 69 59 67 50Armor 48-R91 (RR2Y/STS) 64 ± 1 77 67 59 71 47Caverndale Farms 486 RR2Y/STSn 64 ± 1 80 66 62 65 47Steyer 4802 R2 (RR2Y/STS) 64 ± 1 80 68 59 63 49Asgrow AG4933 GENRR2Y 63 ± 1 76 65 58 67 50Morsoy Xtra R2 48X02 63 ± 1 78 68 57 65 47Progeny 4747 RY (RR2Y) 63 ± 1 76 70 59 61 48Delta Grow 4825 R2Y/STS 63 ± 1 78 69 56 60 50Mycogen 5N478R2 63 ± 1 76 60 61 70 47Asgrow AG4632 GENRR2Y (STS) 63 ± 1 78 65 57 64 49Hornbeck HBK RY 4620 (RR2Y/STS) 62 ± 1 75 64 59 68 45Hornbeck HBK RY 4721 (RR2Y) 62 ± 1 74 64 55 70 48Delta Grow 4755 R2Y 62 ± 1 75 65 59 63 45Morsoy Xtra R2 46X29 (STS) 61 ± 1 71 63 55 69 47Schillinger Seed 4990 RC 61 ± 1 79 61 58 58 48USG 74A79R (RR2Y/STS) 61 ± 1 69 61 60 68 46Progeny 4710 RY (RR2Y/STS) 61 ± 1 73 64 58 59 49USG 74A69R (RR2Y) 60 ± 1 72 60 57 65 46Terral-REV Brand 48R33 (RR) 60 ± 1 74 63 55 65 45Steyer 4702 R2 (RR2Y) 60 ± 1 77 61 56 58 48Delta Grow 4925 R2Y 60 ± 1 73 63 54 62 47Progeny 4900 RY (RR2Y) 60 ± 1 76 65 56 54 47USG 74B81R (RR2Y/STS) 59 ± 1 72 57 54 66 48USG 74H92R (RR2Y) 59 ± 1 78 60 56 57 44Armor 49-R56 (RR2Y) 59 ± 1 73 65 53 60 44USG 74A91 (RR) 59 ± 1 77 62 54 57 46AGSouth Genetics AGS 47R212 (RR) 59 ± 1 73 60 56 61 44Beck's Hybrids 477NR (RR) 58 ± 1 72 54 56 64 45Schillinger Seed 495 RC 57 ± 1 74 61 58 47 47Dyna-Gro S47RY13 (RR2Y) 57 ± 1 74 59 53 54 47Terral-REV Brand 47R53 (RR) 57 ± 1 75 55 57 53 46Asgrow AG4633 GENRR2Y 57 ± 1 69 58 52 58 47Terral-REV Brand 48R22 (RR) 57 ± 1 69 59 55 54 45Terral-REV Brand 46R73 (RR) 56 ± 1 69 55 50 60 44Terral-REV Brand 49R22 (RR) 55 ± 1 72 54 53 52 43Delta Grow 4880 RR 53 ± 1 69 53 53 45 45Average (bu/a) 61 75 63 57 63 47L.S.D..05 (bu/a) 3 6 8 7 9 5C.V. (%) 8.8 5.8 10.8 8.4 10.3 7.6† All yields are adjusted to 13% moisture.‡ If a trait appears inside parentheses i.e. (RR), then it is not part of the variety name.

Table 26. Mean yields † and agronomic characteristics of 41 Late Maturity Group IV (4.6 - 4.9) Roundup Ready soybean varieties in five environments (n=10) in Tennessee for two years, 2012 - 2013.
Avg. Yield Seed± Std Err. Moisture § Lodging Height Maturity Shattering Quality Protein Oil
Brand Variety ‡ (n=10) (n=10) (n=8) (n=8) (n=8) (n=6) (n=2) (n=2) (n=2)bu/a % Score in. DAP ------ Score ------- % %
Morsoy Xtra R2 47X12 (STS) 69 ± 1 15.1 1.5 42 135 1.0 2.1 37.3 20.2Delta Grow 4765 R2Y 67 ± 1 14.6 1.5 42 135 1.0 2.3 37.0 20.3Warren Seed DSR-4850/R2Y (STS) 66 ± 1 14.8 1.6 42 135 1.0 2.1 37.0 20.2Dyna-Gro S48RS53 (RR2Y/STS) 65 ± 1 14.6 1.5 42 135 1.0 1.8 37.1 20.1Armor 47-R13 (RR2Y/STS) 65 ± 1 15.2 1.6 41 135 1.0 2.4 37.4 20.0Asgrow AG4832 GENRR2Y (STS) 64 ± 1 14.0 1.6 43 134 1.0 2.2 37.0 20.9Armor 48-R91 (RR2Y/STS) 64 ± 1 14.1 1.7 42 134 1.0 3.0 37.0 20.2Caverndale Farms 486 RR2Y/STSn 64 ± 1 15.2 1.9 37 138 1.0 2.6 37.0 20.3Steyer 4802 R2 (RR2Y/STS) 64 ± 1 14.9 2.0 37 136 1.0 2.3 36.7 20.6Asgrow AG4933 GENRR2Y 63 ± 1 14.0 1.4 41 136 1.0 2.0 37.6 20.3Morsoy Xtra R2 48X02 63 ± 1 14.1 1.7 39 134 1.0 1.7 36.0 20.9Progeny 4747 RY (RR2Y) 63 ± 1 13.8 1.6 39 133 1.0 1.9 36.2 21.2Delta Grow 4825 R2Y/STS 63 ± 1 15.2 1.8 38 137 1.0 2.8 36.7 20.6Mycogen 5N478R2 63 ± 1 14.2 1.6 42 134 1.0 2.8 36.4 20.6Asgrow AG4632 GENRR2Y (STS) 63 ± 1 14.0 1.8 39 134 1.0 2.8 35.6 21.0Hornbeck HBK RY 4620 (RR2Y/STS) 62 ± 1 14.2 1.8 37 134 1.0 2.0 36.5 20.9Hornbeck HBK RY 4721 (RR2Y) 62 ± 1 14.2 1.7 43 134 1.0 2.8 36.5 20.4Delta Grow 4755 R2Y 62 ± 1 13.9 1.6 39 134 1.1 2.3 37.3 21.6Morsoy Xtra R2 46X29 (STS) 61 ± 1 14.0 1.6 37 133 1.0 2.4 36.7 20.5Schillinger Seed 4990 RC 61 ± 1 15.1 2.0 42 139 1.0 1.9 37.2 20.7USG 74A79R (RR2Y/STS) 61 ± 1 14.1 1.8 36 134 1.0 2.8 36.4 20.9Progeny 4710 RY (RR2Y/STS) 61 ± 1 14.1 1.8 39 135 1.0 1.8 36.8 20.9USG 74A69R (RR2Y) 60 ± 1 13.8 1.6 37 133 1.0 2.3 36.7 20.6Terral-REV Brand 48R33 (RR) 60 ± 1 13.8 1.9 42 133 1.0 2.2 36.3 20.8Steyer 4702 R2 (RR2Y) 60 ± 1 13.7 1.6 39 134 1.0 2.3 36.6 21.3Delta Grow 4925 R2Y 60 ± 1 14.3 1.6 41 136 1.0 2.1 36.3 20.7Progeny 4900 RY (RR2Y) 60 ± 1 13.9 1.5 35 135 1.0 2.4 37.4 21.2USG 74B81R (RR2Y/STS) 59 ± 1 14.2 1.7 43 134 1.0 2.5 37.3 21.0USG 74H92R (RR2Y) 59 ± 1 14.2 1.8 38 137 1.0 2.3 38.0 20.4Armor 49-R56 (RR2Y) 59 ± 1 13.9 1.6 34 135 1.0 2.5 37.4 20.6USG 74A91 (RR) 59 ± 1 14.4 1.8 41 135 1.0 2.3 36.4 21.2AGSouth Genetics AGS 47R212 (RR) 59 ± 1 13.8 1.8 38 133 1.0 1.8 35.6 21.6Beck's Hybrids 477NR (RR) 58 ± 1 13.4 1.8 41 134 1.0 3.1 36.8 21.1Schillinger Seed 495 RC 57 ± 1 14.6 2.4 45 136 1.0 2.6 38.2 20.2Dyna-Gro S47RY13 (RR2Y) 57 ± 1 14.1 1.6 40 134 1.0 2.4 36.4 21.2Terral-REV Brand 47R53 (RR) 57 ± 1 13.5 2.1 39 132 1.0 1.8 36.9 22.4Asgrow AG4633 GENRR2Y 57 ± 1 13.6 1.4 35 133 1.0 2.4 35.6 20.9

Table 26 (continued)Avg. Yield Seed± Std Err. Moisture § Lodging Height Maturity Shattering Quality Protein Oil
Brand Variety ‡ (n=10) (n=10) (n=8) (n=8) (n=8) (n=6) (n=2) (n=2) (n=2)bu/a % Score in. DAP ------ Score ------- % %
Terral-REV Brand 48R22 (RR) 57 ± 1 13.8 2.0 39 135 1.0 2.1 37.2 20.4Terral-REV Brand 46R73 (RR) 56 ± 1 13.6 1.8 40 133 1.0 2.4 37.1 21.7Terral-REV Brand 49R22 (RR) 55 ± 1 13.7 1.9 43 136 1.0 2.2 38.2 20.2Delta Grow 4880 RR 53 ± 1 13.8 2.1 39 135 1.0 2.1 38.3 20.6
Average 61 14.2 1.7 40 135 1.0 2.3 36.9 20.8† All yields are adjusted to 13% moisture.‡ If a trait appears inside parentheses i.e. (RR), then it is not part of the variety name.Lodging = 1 to 5 scale; where 1 = 95% of plants erect; 2.5 = ~50% of plants leaning at angle ≥ 45°; 5 = 95+% of plants leaning at an angle ≥ 45°.Maturity = days after planting (DAP).Shattering = 1 to 5 scale; where 1 = no shattering; 5 = 90+% of pods shattered. § Average moisture at harvestSeed Quality = 1 to 5 scale; where 1 = < 5% of seeds showing disease or split seed coats; 5 = 95+% of seed are diseased or have split seed coats.Protein & Oil on dry weight basis.

Table 27. Mean yields † of 15 Late Maturity Group IV (4.6 - 4.9) Roundup Ready soybean varietiesevaluated in five environments (n=15) in Tennessee for three years, 2011 - 2013.
Avg. Yield± Std Err. Milan
Brand Variety ‡ (n=15) Knoxville Irr. Non-Irr. Irr. Ames
Asgrow AG4832 GENRR2Y (STS) 60 ± 1 73 61 51 66 50Armor 48-R91 (RR2Y/STS) 60 ± 1 73 58 51 69 48Asgrow AG4632 GENRR2Y (STS) 59 ± 1 77 56 48 64 50Hornbeck HBK RY 4620 (RR2Y/STS) 58 ± 1 73 56 50 67 46Terral-REV Brand 48R33 (RR) 57 ± 1 72 56 47 65 46Progeny 4710 RY (RR2Y/STS) 57 ± 1 72 56 50 59 48USG 74A79R (RR2Y/STS) 57 ± 1 68 53 50 66 48Beck's Hybrids 477NR (RR) 56 ± 1 71 49 50 63 46Schillinger Seed 4990 RC 55 ± 1 73 54 48 56 44Terral-REV Brand 47R53 (RR) 55 ± 1 71 50 50 54 49USG 74A91 (RR) 55 ± 1 70 53 46 57 48Schillinger Seed 495 RC 54 ± 1 69 55 51 52 46Terral-REV Brand 48R22 (RR) 54 ± 1 67 53 46 54 47Terral-REV Brand 49R22 (RR) 52 ± 1 69 49 46 54 43Delta Grow 4880 RR 51 ± 1 68 50 46 47 47Average (bu/a) 56 71 54 49 60 47L.S.D..05 (bu/a) 3 7 9 7 8 5C.V. (%) 9.2 7.1 11.5 9.5 9.7 8.0† All yields are adjusted to 13% moisture.‡ If a trait appears inside parentheses i.e. (RR), then it is not part of the variety name.
Springfield
---------------------------------------bu/a-----------------------------------

Table 28. Mean yields † and agronomic characteristics of 15 Late Maturity Group IV (4.6 - 4.9) Roundup Ready soybean varietiesevaluated in five environments (n=15) in Tennessee for three years, 2011 - 2013.
Avg. Yield Seed± Std Err. Moisture § Lodging Height Maturity Shattering Quality Protein Oil
Brand Variety ‡ (n=15) (n=15) (n=12) (n=12) (n=12) (n=9) (n=3) (n=3) (n=3)bu/a % Score in. DAP ------------- Score ------ % %
Asgrow AG4832 GENRR2Y (STS) 60 ± 1 13.6 1.5 43 136 1.0 2.4 37.6 21.3Armor 48-R91 (RR2Y/STS) 60 ± 1 13.6 1.7 42 135 1.0 3.0 37.4 20.7Asgrow AG4632 GENRR2Y (STS) 59 ± 1 13.5 1.7 38 135 1.0 2.6 36.0 21.5Hornbeck HBK RY 4620 (RR2Y/STS) 58 ± 1 13.4 1.8 37 135 1.0 2.0 37.1 21.4Terral-REV Brand 48R33 (RR) 57 ± 1 13.1 1.8 42 134 1.0 2.3 36.9 21.6Progeny 4710 RY (RR2Y/STS) 57 ± 1 13.5 1.7 38 136 1.0 1.7 37.6 21.4USG 74A79R (RR2Y/STS) 57 ± 1 13.3 1.7 36 135 1.0 2.6 37.2 21.4Beck's Hybrids 477NR (RR) 56 ± 1 12.9 1.8 42 135 1.0 2.9 37.4 21.6Schillinger Seed 4990 RC 55 ± 1 14.5 1.9 41 140 1.0 2.1 37.9 21.1Terral-REV Brand 47R53 (RR) 55 ± 1 12.9 2.0 39 134 1.0 2.1 37.7 22.9USG 74A91 (RR) 55 ± 1 14.0 1.7 41 137 1.0 2.2 37.5 21.5Schillinger Seed 495 RC 54 ± 1 14.1 2.4 44 137 1.0 2.6 39.0 20.6Terral-REV Brand 48R22 (RR) 54 ± 1 12.9 1.9 39 136 1.0 2.1 37.9 20.9Terral-REV Brand 49R22 (RR) 52 ± 1 13.0 1.8 43 136 1.0 1.9 38.8 20.6Delta Grow 4880 RR 51 ± 1 13.1 2.2 39 136 1.0 2.2 39.4 20.8
Average 56 13.4 1.8 40 136 1.0 2.3 37.7 21.3† All yields are adjusted to 13% moisture.‡ If a trait appears inside parentheses i.e. (RR), then it is not part of the variety name.§ Average moisture at harvestLodging = 1 to 5 scale; where 1 = 95% of plants erect; 2.5 = ~50% of plants leaning at angle ≥ 45°; 5 = 95+% of plants leaning at an angle ≥ 45°.Maturity = days after planting (DAP).Shattering = 1 to 5 scale; where 1 = no shattering; 5 = 90+% of pods shattered.Seed Quality = 1 to 5 scale; where 1 = < 5% of seeds showing disease or split seed coats; 5 = 95+% of seed are diseased or have split seed coats.Protein & Oil on dry weight basis.

Avg. KY KY Fayette1 Fayette2MS Brand/Variety Yld. Moist Ballard Calloway Coffee Decatur Dyer Ames McNabb Franklin Giles Hardin Henry Lake Madison Marion Montgomery Obion
bu/a % 6/22 § 6/26 5/2 6/15 5/28 6/13 6/12 5/28 6/28 6/15 6/24 5/14 5/14 5/15 6/26 5/28A Morsoy Xtra R2 47X12 RR2Y/STS 61.3 13.1 55.1 56.3 70.3 79.6 62.4 45.0 44.3 69.6 48.4 72.1 66.4 59.5 72.2 60.5 56.3 62.4A ***Schillinger 4990RC 60.4 13.0 58.9 48.4 78.6 68.3 64.5 45.0 58.0 67.5 40.6 67.9 51.3 57.9 72.9 68.6 54.4 70.0A Dyna-Gro S48RS53 (RR2Y/STS) 60.1 13.2 50.9 58.9 60.0 81.8 66.1 39.2 46.6 69.9 42.3 71.4 52.5 58.2 72.3 72.8 50.1 69.9A Asgrow AG4632 GENRR2Y/STS 60.0 13.0 51.8 50.1 84.3 72.9 58.9 39.9 55.5 66.8 53.1 57.0 60.4 62.2 74.0 74.8 49.4 62.4A Armor 47-R13 RR2Y/STS 59.7 13.7 42.0 53.9 70.5 82.3 62.8 31.5 52.6 71.2 39.2 58.7 65.0 60.0 74.6 73.1 48.4 62.1A Warren Seed DS 4633 R2Y 59.6 13.0 39.2 47.2 84.5 67.0 65.1 40.9 56.7 73.2 44.5 67.9 51.0 66.2 71.2 59.4 52.4 60.1AB Asgrow AG4933 GENRR2Y 59.5 13.2 47.7 51.9 75.7 83.5 63.2 36.8 44.4 68.2 53.3 50.5 51.3 61.3 70.6 76.2 53.7 67.6AB **Armor 48-R91 RR2Y/STS 59.0 13.1 48.3 47.4 75.3 74.3 67.6 38.7 51.6 70.5 43.4 54.2 51.7 57.5 76.0 72.4 45.7 69.1AB Progeny P4850 RY/STS 58.9 13.1 47.4 48.2 53.6 78.1 64.2 35.8 46.9 60.9 55.2 74.5 51.1 61.6 80.7 74.6 56.0 65.2AB Croplan R2C 4752S GENRR2Y/STS 58.9 13.2 42.6 50.4 68.1 78.5 63.6 45.1 45.5 65.6 48.1 64.3 41.0 63.5 77.4 76.7 46.4 65.0AB Armor 48-R66 RR2Y/STS 58.8 13.7 38.1 43.3 64.9 67.1 65.4 28.2 44.2 72.0 40.4 72.8 54.0 56.0 77.3 73.2 59.6 72.6AB Mycogen 5N478 RR2Y/STS 58.8 13.2 49.8 53.8 77.5 69.2 69.7 35.0 42.3 73.4 40.2 60.0 50.9 60.3 70.9 69.8 50.7 65.0AB Morsoy Xtra R2 48X02 RR2Y 58.4 13.1 37.5 47.7 74.7 74.6 65.7 30.1 49.3 66.2 48.9 59.8 31.7 66.0 82.6 73.2 54.0 69.7AB Terral REV-47R53 58.1 12.7 37.3 53.2 72.5 74.1 65.3 41.5 40.4 60.5 46.6 62.6 61.4 58.1 74.5 64.9 51.4 64.4ABC *Croplan R2C 4801S GENRR2Y/STS 58.0 13.2 49.6 45.6 76.6 76.2 67.2 41.6 45.1 69.2 33.3 48.5 50.3 56.1 76.5 66.9 50.2 69.8ABC Ag South Genetics AGS47R212 57.5 13.0 43.6 44.5 77.5 68.7 69.0 37.1 41.2 66.1 47.0 64.1 48.5 58.0 78.6 69.2 45.2 61.9ABC *Warren Seed DS 4850 R2Y/STS 57.0 13.2 51.7 46.2 57.8 82.3 64.7 38.9 49.8 67.1 40.9 66.7 44.0 56.9 76.9 57.5 49.5 64.7ABCD Hornbeck HBK RY4620 RR2Y/STS 56.0 12.9 57.0 53.2 80.4 61.0 61.4 27.9 32.7 73.8 44.2 68.6 58.5 53.9 66.0 72.1 50.4 59.7BCDE Hornbeck HBK RY4721 RR2Y 55.9 13.2 39.1 30.6 75.0 73.4 65.1 36.7 46.5 62.4 33.1 42.5 44.3 62.3 75.3 65.7 47.6 68.7BCDE Progeny P4710 RY/STS 55.6 12.9 55.7 35.7 61.8 73.6 60.7 37.2 40.8 61.3 42.7 59.5 57.6 57.5 72.7 68.0 52.2 56.4BCDE USG 74A69R RR2Y 55.0 13.1 35.4 50.7 80.5 55.9 58.8 37.3 33.4 63.8 47.9 62.2 58.1 63.0 69.4 43.8 52.5 62.7CDE Schillinger 4712R2 53.7 12.9 43.7 34.4 77.6 58.9 65.2 43.5 42.9 69.6 37.7 53.8 37.8 55.2 71.9 59.3 41.9 65.4DE USG 74H92R RR2Y 51.9 13.4 33.3 35.1 65.2 62.4 62.7 27.8 45.6 63.6 39.8 50.9 33.2 54.7 71.9 74.0 46.5 63.9E Dyna-Gro S47RY13 RR2Y 50.8 13.3 40.4 34.3 73.7 58.1 64.5 28.9 42.3 68.2 35.3 52.5 20.4 53.3 77.4 65.7 38.7 59.2
Average (bu/a) 57.6 13.1 45.7 46.7 72.3 71.7 64.3 37.1 45.8 67.5 43.6 61.0 49.7 59.1 74.3 68.0 50.1 64.9† Yields have been adjusted to 13% moisture.‡ Moisture at harvest.§ Planting date.Each variety was evaluated in a large strip-plot at each loction, thus each county test was considered as one replication of the test in calculating the average yield and in conducting the statistical analysis to determine significant differences (MS).Varieties marked with an asterisk (*) and/or (**) were in the top performing group in 2012 and/or 2011.MS= Varieties with any MS letter in common are not statistically different at the 5% level of probability.Data provided by Robert C. Williams, Ext. Area Specialist, Grain Crops, and the extension agents in the counties shown above.
Table 29. Yields † of 24 Late Maturity Group IV (4.6-4.9) Roundup Ready soybean varieties in 16 County Standard Tests in Tennessee and Kentucky during 2013.

and Kentucky County Standard Tests during 2013.CSTAvg.Yield Frogeye SCN
MS Brand/Variety (n=16) RECM/WTREC Sudden Death Treated ¶ Untreated Treated ¶ Untreated Race 2 Race 3 Race 5bu/a bu/a bu/a
A Morsoy Xtra R2 47X12 RR2Y/STS 61.3 LOW/LOW LOW-MOD 41.5 38.2 55.6 54.6 MS MS SA Armor 47-R13 RR2Y/STS 60.4 LOW/LOW LOW-HIGH 39.4 38.0 54.4 54.0 MS S MSAB Asgrow AG4632 GENRR2Y/STS 60.1 LOW/LOW LOW-HIGH 44.4 42.0 53.2 50.8 MS MS SAB Asgrow AG4933 GENRR2Y 60.0 LOW/LOW LOW 44.6 42.8 39.4 42.0 MS S SABC ***Schillinger 4990RC 59.7 LOW/LOW LOW 48.7 44.1 43.0 43.4 S MS SABC Dyna-Gro S48RS53 (RR2Y/STS) 59.6 LOW/LOW LOW-MOD 42.3 35.5 53.1 36.0 - - -ABC Croplan R2C 4752S GENRR2Y/STS 59.5 MOD/LOW LOW-MOD 40.2 38.5 56.6 45.4 MS MS SABCD **Armor 48-R91 RR2Y/STS 59.0 LOW/LOW LOW-MOD 42.8 44.3 53.5 48.9 MS MS SABCD *Croplan R2C 4801S GENRR2Y/STS 58.9 LOW/LOW LOW-MOD 42.0 41.4 50.3 51.1 MS MS SABCD Progeny P4850 RY/STS 58.9 LOW/LOW LOW-MOD 39.7 34.1 56.3 52.6 MS MS MSABCD Warren Seed DS 4633 R2Y 58.8 LOW/LOW LOW 43.5 42.2 38.4 38.8 MS MR SABCD Armor 48-R66 RR2Y/STS 58.8 MOD/LOW LOW 41.7 38.5 54.3 54.8 MS MS SABCD Mycogen 5N478 RR2Y/STS 58.4 LOW/LOW LOW-HIGH 40.9 37.4 52.6 32.4 S MS SABCD Morsoy Xtra R2 48X02 RR2Y 58.1 MOD/LOW LOW 43.8 39.0 48.9 47.1 - - -ABCDE Terral REV-47R53 58.0 LOW/LOW LOW-HIGH 40.2 38.2 52.3 47.5 MS MS SABCDE Ag South Genetics AGS47R212 57.5 LOW/LOW LOW 43.3 42.5 47.9 43.0 MS MS SABCDE Hornbeck HBK RY4620 RR2Y/STS 57.0 MOD/MOD LOW-MOD 36.6 36.6 44.6 46.5 MS S SBCDEF Progeny P4710 RY/STS 56.0 MOD/LOW LOW-HIGH 35.7 32.9 51.7 52.8 S MR SBCDEF Warren Seed DS 4850 R2Y/STS 55.9 MOD/LOW LOW-MOD 39.0 35.5 54.8 52.4 - - -CDEF USG 74A69R RR2Y 55.6 MOD/MOD LOW 38.2 35.2 54.1 49.2 MS MS SDEFG Hornbeck HBK RY4721 RR2Y 55.0 LOW/LOW LOW 39.7 39.7 49.2 46.5 - - -EFG Schillinger 4712R2 53.7 MOD/LOW LOW-MOD 34.7 33.4 46.6 42.3 MS MS SFG USG 74H92R RR2Y 51.9 MOD/LOW LOW-MOD 40.0 33.4 39.6 42.2 S MS SG Dyna-Gro S47RY13 RR2Y 50.8 MOD/LOW LOW 42.3 38.1 35.4 39.3 MS MS MS
Average (bu/a) 57.6 41.0 38.4 49.4 46.4YLD= Avg. Yield @ 13% moisture.MS= Varieties that have any MS letter in common are not statistically different in yield at the 5% level of probability.Varieties marked with an asterisk (*) and/or (**) were in the top performing group in 2012 and/or 2011.County locations include: Ballard KY, Calloway KY, Coffee, Decatur, Dyer, Fayette (Ames Plantation & McNabb), Franklin, Giles, Hardin, Henry, Lake, Madison, Marion, Montgomery and Obion.¶ Treated plots at RECM & WTREC sprayed with Quadris TOP @ 8 oz./Acre + 1% Induce @ R3 growth stage. RECM varieties planted May 28 and WTREC planted June 29 Disease ratings (of unsprayed plots) for Frogeye and Sudden Death are LOW (0-10% disease), MOD (11-40% disease), HIGH (41-100%)Disease ratings & yield data compiled by Dr. Heather Kelly from replicated plots at the Research and Education Center at Milan (RECM, which has severe disease pressure) and the West Tennessee Research and Education Center (WTREC, which has low disease pressure due to regular crop rotation).SCN Greenhouse Ratings compiled by Dr. Pat Donald, Research Plant Path., USDA-ARS, WTREC. Race 2 (HG Type 1.2.5.7), Race 3 (HG Type 7) andRace 5 (HG Type 2.5.7), HS = Highly Susceptible, S = Susceptible, MS = Moderately Susceptible, MR = Moderately Resistant, R = Resistant.
Table 30. Yields † and disease ratings § of 24 late Maturity Group IV (4.6 - 4.9) Roundup Ready soybean varieties evaluated in 16 Tennessee
-------------------------------------- Research and Education Center at Milan (RECM) and Jackson (WTREC)-------------------------------------RECM Yield WTREC Yield

Table 31. Overall average yields † and moistures of 22 Late Maturity Group IV (4.6 - 4.9) Roundup Ready soybean varietiesevaluated in County Standard Tests (n=16) and AgResearch and Education Centers (n=6) in Tennessee during 2013.
Research and Averages of CST & REC Tests County Standard Trials Education Center Trials
Avg. Avg. Avg.Brand Variety ‡ Yield Moisture Yield Moisture Yield Moisture
bu/a % bu/a % bu/a %Morsoy Xtra R2 47X12 (STS) 62 14.3 61 13.1 63 15.5Progeny 4850 RY 61 14.4 59 13.1 64 15.6Armor 48-R91 (RR2Y/STS) 61 14.1 59 13.1 63 15.2Warren Seed DSR-4850/R2Y (STS) 61 14.1 57 13.2 64 15.0Asgrow AG4632 GENRR2Y (STS) 59 14.1 60 13.0 59 15.1AGSouth Genetics AGS 47R212 (RR) 58 13.8 58 13.0 59 14.5Asgrow AG4933 GENRR2Y 58 14.2 59 13.2 57 15.2Dyna-Gro S48RS53 (RR2Y/STS) 58 14.3 60 13.2 56 15.5Croplan R2C 4752 S 58 14.2 59 13.2 57 15.1Schillinger Seed 4990 RC 58 13.7 60 13.0 55 14.5Morsoy Xtra R2 48X02 57 13.9 58 13.1 56 14.6Hornbeck HBK RY 4721 (RR2Y) 57 14.2 56 13.2 58 15.3Mycogen 5N478R2 57 14.0 59 13.2 55 14.8Hornbeck HBK RY 4620 (RR2Y/STS) 57 14.0 56 12.9 57 15.0Progeny 4710 RY (RR2Y/STS) 56 13.8 56 12.9 57 14.8Terral-REV Brand 47R53 (RR) 56 13.7 58 12.7 54 14.6Armor 47-R13 (RR2Y/STS) 56 14.5 60 13.7 52 15.3USG 74A69R (RR2Y) 55 13.9 55 13.1 56 14.7Armor 48-R66 (RR2/STS) 55 14.2 59 13.7 52 14.7USG 74H92R (RR2Y) 54 13.9 52 13.4 56 14.4Dyna-Gro S47RY13 (RR2Y) 52 14.2 51 13.3 53 15.1Schillinger Seed 4712R2 51 13.5 54 12.9 49 14.1Average (bu/a) 57.2 14.0 57.5 13.1 56.9 14.9† Yields have been adjusted to 13% moisture.‡ If a trait appears inside parentheses i.e. (RR), then it is not part of the variety name.

Table 32. Mean yields † of 44 Early Maturity Group V (5.0 - 5.5) Roundup Ready soybean varietiesevaluated in five environments in Tennessee during 2013.
Avg. Yield± Std Err. Springfield Milan
Brand Variety ‡ (n=5) Knoxville Irr. Non-Irr. Irr. Ames
Progeny 5555 RY 64 ± 2 74 59 58 80 50Asgrow AG5233 GENRR2Y (STS) 64 ± 2 82 59 55 68 54Progeny 5213 RY 64 ± 2 76 63 64 68 42Asgrow AG5534 (RR2Y) 63 ± 2 77 52 57 69 54Armor X1413 (RR2) 62 ± 2 70 56 55 76 59Armor X1414 (RR2) 61 ± 2 67 63 62 74 40Warren Seed DS5122 R2Y 59 ± 2 73 55 50 68 51Morsoy Xtra 53X82 (RR2) 59 ± 2 60 63 57 66 46LG Seeds C5122R2 58 ± 2 61 60 59 67 40Armor 55-R22 (RR2Y) 58 ± 2 56 62 62 71 37Progeny 5333 RY 58 ± 2 79 53 52 52 45Dyna-Gro 32RY55 (RR2Y) 57 ± 2 59 58 57 63 48Dyna-Gro S53RY23 (RR2Y) 57 ± 2 69 65 49 64 49USG 75J23R (RR2Y) 57 ± 2 70 51 48 63 52Croplan R2C 5482 57 ± 2 54 55 51 71 40Terral-REV Brand 51R53 (RR) 57 ± 2 75 56 49 59 53Hornbeck HBK RY 5421 (RR2Y) 57 ± 2 53 58 53 67 52Asgrow AG5332 GENRR2Y 56 ± 2 71 53 51 56 49Steyer 5101R2 56 ± 2 64 61 55 65 33Delta Grow 5130 RR2 56 ± 2 60 61 56 65 37Morsoy RT 5429 (RR) 56 ± 2 62 55 56 52 48Beck's Hybrids EX6160 (RR) 56 ± 2 58 60 50 60 40MO Exp S09-6201R 56 ± 2 70 54 50 63 49Progeny 5111 RY (RR2Y) 56 ± 2 69 52 51 62 46Armor X1410 (RR2) 55 ± 2 66 56 48 59 47Hornbeck HBK RY 5221 (RR2Y) 55 ± 2 62 57 55 46 52Dyna-Gro S54RY43 (RR2Y) 55 ± 2 60 47 52 64 51NK S 52-Y2 (RR2Y) 54 ± 2 62 51 51 60 42USG 75Q42R (RR2Y) 54 ± 2 66 53 54 55 54Midwest Premium Genetics MPG5113 (RR) 54 ± 2 61 49 51 59 52Armor 53-R16 (RR2Y) 54 ± 2 55 52 52 59 47Terral-REV Brand 55R53 (RR) 54 ± 2 58 53 48 64 56Armor 53-R88 (RR2Y/STS) 53 ± 2 75 59 55 55 41TN Exp TN09-45,905 (RR2Y) 53 ± 2 63 52 43 58 50Midwest Premium Genetics MPG5214NRR 53 ± 2 67 55 45 56 41Asgrow AG5532 GENRR2Y (STS) 53 ± 2 62 55 47 58 47Terral-REV Brand 52R74 (RR) 51 ± 2 59 45 37 60 44Progeny 5210 RY (RR2Y) 51 ± 2 64 56 50 53 31AR R04-1250RR 50 ± 2 66 52 49 43 48Terral-REV Brand 54R84 (RR) 50 ± 2 45 49 50 56 42Terral-REV Brand 53R23 (RR) 49 ± 2 62 54 53 39 45AR R04-1268RR 49 ± 2 55 52 46 53 44Schillinger Seed 5220 RC 48 ± 2 54 54 48 35 50NK S 54-V4 (RR/STS) 47 ± 2 43 59 49 40 42Average (bu/a) 56 64 56 52 60 46L.S.D..05 (bu/a) 4 13 7 8 12 9C.V. (%) 10.9 12.3 7.6 9.3 12.2 11.6† All yields are adjusted to 13% moisture.‡ If a trait appears inside parentheses i.e. (RR), then it is not part of the variety name.
-------------------------------bu/a---------------------------------------

Table 33. Mean yields † and agronomic characteristics of 44 Early Maturity Group V (5.0 - 5.5) Roundup Ready soybean varietiesevaluated in five environments in Tennessee during 2013.
Avg. Yield Seed± Std Err. Moisture § Lodging Height Maturity Shattering Quality Protein Oil Frogeye
Brand Variety ‡ (n=5) (n=5) (n=4) (n=4) (n=4) (n=3) (n=1) (n=1) (n=1) (n=1)bu/a % Score in. DAP -------- Score -------- % % Score
Progeny 5555 RY 64 ± 2 13.3 1.9 38 143 1.2 2.2 33.4 18.6 2.3Asgrow AG5233 GENRR2Y (STS) 64 ± 2 14.3 1.8 36 136 1.3 3.3 35.2 18.9 6.3Progeny 5213 RY 64 ± 2 14.2 1.4 43 135 1.2 2.0 34.0 19.6 4Asgrow AG5534 (RR2Y) 63 ± 2 13.8 1.5 38 145 1.2 1.7 34.1 19.6 2Armor X1413 (RR2) 62 ± 2 13.9 1.4 42 136 1.2 2.3 34.5 19.2 4.7Armor X1414 (RR2) 61 ± 2 13.6 1.9 36 142 1.6 3.0 34.6 18.4 3.7Warren Seed DS5122 R2Y 59 ± 2 13.8 1.6 42 136 1.2 3.0 35.2 19.0 5Morsoy Xtra 53X82 (RR2) 59 ± 2 13.9 2.2 35 143 1.4 3.2 37.5 17.4 3.3LG Seeds C5122R2 58 ± 2 13.7 1.5 41 136 1.3 2.7 35.2 19.0 5Armor 55-R22 (RR2Y) 58 ± 2 13.7 1.9 36 144 1.4 2.0 34.8 18.4 2Progeny 5333 RY 58 ± 2 13.7 2.1 39 141 1.4 3.2 34.5 18.6 4.3Dyna-Gro 32RY55 (RR2Y) 57 ± 2 13.6 1.9 37 144 1.4 1.7 35.0 18.2 2.3Dyna-Gro S53RY23 (RR2Y) 57 ± 2 13.8 2.3 38 142 1.4 3.3 35.7 18.4 3.3USG 75J23R (RR2Y) 57 ± 2 13.8 1.6 40 136 1.2 2.5 35.0 18.9 4.7Croplan R2C 5482 57 ± 2 13.5 2.3 36 144 1.3 3.2 37.4 17.4 3.7Terral-REV Brand 51R53 (RR) 57 ± 2 14.0 1.9 36 137 1.3 3.0 35.2 20.0 6.7Hornbeck HBK RY 5421 (RR2Y) 57 ± 2 14.5 2.5 36 143 1.3 1.5 35.4 18.7 2Asgrow AG5332 GENRR2Y 56 ± 2 13.5 2.4 34 137 1.2 3.2 35.0 18.5 5Steyer 5101R2 56 ± 2 13.7 1.5 41 135 1.2 2.8 35.3 19.1 5.7Delta Grow 5130 RR2 56 ± 2 13.8 1.6 39 135 1.2 2.8 35.2 19.0 5Morsoy RT 5429 (RR) 56 ± 2 13.6 1.8 37 143 1.2 1.7 35.5 18.8 2Beck's Hybrids EX6160 (RR) 56 ± 2 13.6 1.6 36 135 1.2 3.0 35.3 19.9 7MO Exp S09-6201R 56 ± 2 14.4 2.0 37 136 1.2 3.3 37.2 17.9 2Progeny 5111 RY (RR2Y) 56 ± 2 13.9 2.1 34 138 1.3 2.0 34.4 19.3 2.7Armor X1410 (RR2) 55 ± 2 13.9 2.4 42 140 1.3 1.5 34.3 18.6 3.3Hornbeck HBK RY 5221 (RR2Y) 55 ± 2 15.2 2.0 39 141 1.3 3.7 36.1 18.2 2.3Dyna-Gro S54RY43 (RR2Y) 55 ± 2 14.0 2.3 38 144 1.4 2.7 37.1 17.6 3.3NK S 52-Y2 (RR2Y) 54 ± 2 14.0 2.0 37 135 1.3 2.8 36.2 18.7 7USG 75Q42R (RR2Y) 54 ± 2 13.6 2.5 38 144 1.4 2.0 37.2 17.5 3.3Midwest Premium Genetics MPG5113 (RR) 54 ± 2 14.0 2.2 38 139 1.3 2.0 35.2 18.3 4Armor 53-R16 (RR2Y) 54 ± 2 14.2 2.0 33 143 1.4 2.7 35.6 17.6 3Terral-REV Brand 55R53 (RR) 54 ± 2 13.6 2.3 36 143 1.2 3.3 36.3 18.2 4.7Armor 53-R88 (RR2Y/STS) 53 ± 2 13.7 1.8 34 140 1.4 2.3 33.9 19.5 4TN Exp TN09-45,905 (RR2Y) 53 ± 2 13.1 2.4 35 141 1.4 2.2 35.9 18.3 3.3Midwest Premium Genetics MPG5214NRR 53 ± 2 13.8 2.7 40 139 1.2 2.0 34.6 18.4 4Asgrow AG5532 GENRR2Y (STS) 53 ± 2 13.3 1.6 37 141 1.4 2.5 36.1 18.1 5.3Terral-REV Brand 52R74 (RR) 51 ± 2 13.6 1.5 38 134 1.2 2.5 36.3 18.4 4.7

Table 33 (continued)Avg. Yield Seed± Std Err. Moisture § Lodging Height Maturity Shattering Quality Protein Oil Frogeye
Brand Variety ‡ (n=5) (n=5) (n=4) (n=4) (n=4) (n=3) (n=1) (n=1) (n=1) (n=1)bu/a % Score in. DAP -------- Score -------- % % Score
Progeny 5210 RY (RR2Y) 51 ± 2 14.4 2.3 35 140 1.4 1.5 34.5 19.0 3.3AR R04-1250RR 50 ± 2 13.8 2.2 36 142 1.3 2.5 36.0 18.5 2.7Terral-REV Brand 54R84 (RR) 50 ± 2 13.6 2.7 34 140 1.3 2.2 36.2 18.4 3Terral-REV Brand 53R23 (RR) 49 ± 2 13.2 1.4 30 140 1.2 3.7 35.5 18.8 4.3AR R04-1268RR 49 ± 2 13.9 2.8 35 141 1.4 2.5 35.3 17.8 3.3Schillinger Seed 5220 RC 48 ± 2 13.6 2.4 40 136 1.3 3.5 35.9 18.6 5.3NK S 54-V4 (RR/STS) 47 ± 2 13.7 2.4 35 141 1.3 1.7 38.2 18.0 3.3
Average 56 13.8 2.0 37.2 139.7 1.3 2.6 35.5 18.6 3.9† All yields are adjusted to 13% moisture.‡ If a trait appears inside parentheses i.e. (RR), then it is not part of the variety name.§ Average moisture at harvestLodging = 1 to 5 scale; where 1 = 95% of plants erect; 2.5 = ~50% of plants leaning at angle ≥ 45°; 5 = 95+% of plants leaning at an angle >45°. Maturity = days after planting (DAP).Shattering = 1 to 5 scale; where 1 = no shattering; 5 = 90+% of pods shattered.Seed Quality = 1 to 5 scale; where 1 = < 5% of seeds showing disease or split seed coats; 5=95+% of seed are diseased or have split seed coats.Protein & Oil on dry weight basis.Disease ratings for Frogeye Leaf Spot are from 1-9, where 0=no disease & 10=maximum amount of plant disease or plant death. Ratings taken 8/26/13 in Knoxville, TN

Table 34. Yields †, plant health, and disease ratings of 44 Early Maturity Group V (5.0 - 5.5) Roundup Readysoybean varieties evaluated at Milan, Tennessee during 2013.
Yield Yield Plant SDSMilan Milan Health DI DS DX
Brand Variety ‡ Irr. Non-Irr. (n=2) (n=1) (n=1) (n=1)bu/a bu/a (1-4) % 0 - 9 index
Progeny 5555 RY 80 81 1 13 2.3 37Progeny 5213 RY 68 59 2 28 3 90Asgrow AG5534 (RR2Y) 68 59 2 40 3.3 147Armor X1413 (RR2) 69 60 2 33 3 123Asgrow AG5233 GENRR2Y (STS) 76 51 1 37 3 135Armor X1414 (RR2) 74 57 1 52 4 222Warren Seed DS5122 R2Y 68 61 2 12 2.3 35Armor 55-R22 (RR2Y) 66 58 2 30 3.3 100Dyna-Gro 32RY55 (RR2Y) 67 61 2 33 3.7 127Progeny 5333 RY 71 56 2 57 3.7 218Steyer 5101R2 52 62 2 19 2.7 56Croplan R2C 5482 63 58 1 47 3.3 180Morsoy Xtra 53X82 (RR2) 64 45 1 47 3 163USG 75J23R (RR2Y) 63 56 2 15 2.7 43Midwest Premium Genetics MPG5113 (RR) 71 67 2 22 2.7 58LG Seeds C5122R2 59 45 3 30 3.3 121Hornbeck HBK RY 5421 (RR2Y) 67 55 1 37 4 147Delta Grow 5130 RR2 56 55 2 27 3 94Progeny 5111 RY (RR2Y) 65 56 1 50 3.7 187Morsoy RT 5429 (RR) 65 54 2 78 4 313Dyna-Gro S54RY43 (RR2Y) 52 59 1 43 3.3 147Armor 53-R16 (RR2Y) 60 61 2 30 3 90Terral-REV Brand 51R53 (RR) 63 44 2 45 3.7 175Beck's Hybrids EX6160 (RR) 62 48 2 22 3 70Armor X1410 (RR2) 59 52 1 17 2.7 47USG 75Q42R (RR2Y) 46 55 1 33 3.7 127Hornbeck HBK RY 5221 (RR2Y) 64 49 2 13 2 27Armor 53-R88 (RR2Y/STS) 60 56 1 40 3.7 153Asgrow AG5332 GENRR2Y 55 40 1 78 4.3 343NK S 52-Y2 (RR2Y) 59 48 2 27 3 101Midwest Premium Genetics MPG5214NRR 59 53 1 15 2.7 42MO Exp S09-6201R 64 36 1 78 4 322Dyna-Gro S53RY23 (RR2Y) 55 29 1 73 5 372TN Exp TN09-45,905 (RR2Y) 58 45 1 50 4 200Asgrow AG5532 GENRR2Y (STS) 56 45 2 47 4 163Terral-REV Brand 55R53 (RR) 58 39 1 53 4 213Terral-REV Brand 53R23 (RR) 60 52 2 33 3 120Progeny 5210 RY (RR2Y) 53 41 2 60 4 227Terral-REV Brand 52R74 (RR) 43 33 2 75 5 408AR R04-1268RR 56 37 2 77 4 330AR R04-1250RR 39 27 2 62 5 295Terral-REV Brand 54R84 (RR) 53 23 1 75 4 325Schillinger Seed 5220 RC 35 18 2 93 6 593NK S 54-V4 (RR/STS) 40 22 1 96 5 512
Average 60 49 2 44 4 182† All yields are adjusted to 13% moisture.‡ If a trait appears inside parentheses i.e. (RR), then it is not part of the variety name.DI = disease incidence = percentage of plants with symptomsDS = disease severity = score of leaf chlorosis and necrosis; 0 = no symptoms; 9 = plant death before normal defoliation due to senescence.DX = disease index = (DI x DS / 9); ratings were made at approximately R6 when green pods with seed have reached full size on 8/28/13.

Table 35. Mean yields † of 21Early Maturity Group V (5.0 - 5.5) Roundup Ready soybean varietiesevaluated in five environments (n=10) in Tennessee for two years, 2012 - 2013.
Avg. Yield± Std Err. Springfield Milan
Brand Variety ‡ (n=10) Knoxville Irr. Non-Irr. Irr. Ames
Asgrow AG5233 GENRR2Y (STS) 65 ± 1 77 66 47 80 55Armor 55-R22 (RR2Y) 63 ± 1 72 69 51 74 50Dyna-Gro 32RY55 (RR2Y) 61 ± 1 73 67 50 71 46Hornbeck HBK RY 5421 (RR2Y) 61 ± 1 70 66 51 69 50Dyna-Gro S54RY43 (RR2Y) 61 ± 1 73 63 53 69 48Terral-REV Brand 55R53 (RR) 60 ± 1 72 66 50 64 46USG 75Q42R (RR2Y) 60 ± 1 71 68 53 55 52Asgrow AG5332 GENRR2Y 59 ± 1 77 64 48 57 49Terral-REV Brand 51R53 (RR) 59 ± 1 71 61 46 67 49Armor 53-R16 (RR2Y) 58 ± 1 70 65 47 67 42Asgrow AG5532 GENRR2Y (STS) 58 ± 1 71 63 47 62 46Armor 53-R88 (RR2Y/STS) 58 ± 1 70 58 48 68 43Progeny 5111 RY (RR2Y) 57 ± 1 68 62 50 62 41Progeny 5210 RY (RR2Y) 56 ± 1 70 65 49 58 40Terral-REV Brand 53R23 (RR) 56 ± 1 68 61 41 66 44Hornbeck HBK RY 5221 (RR2Y) 56 ± 1 67 54 45 68 45TN Exp TN09-45,905 (RR2Y) 55 ± 1 70 61 42 57 46Terral-REV Brand 52R74 (RR) 54 ± 1 71 59 42 55 45Terral-REV Brand 54R84 (RR) 54 ± 1 66 62 47 50 45Schillinger Seed 5220 RC 54 ± 1 64 60 47 48 48AR R04-1268RR 52 ± 1 57 55 46 59 44Average (bu/a) 58 70 63 48 63 46L.S.D..05 (bu/a) 4 10 8 8 11 7C.V. (%) 10 9.1 8.6 11.0 11.3 9.8† All yields are adjusted to 13% moisture.‡ If a trait appears inside parentheses i.e. (RR), then it is not part of the variety name.
----------------------------------------bu/a------------------------------------------

varieties evaluated in five environments (n=10) in Tennessee for two years, 2012 - 2013.Avg. Yield Seed± Std Err. Moisture § Lodging Height Maturity Shattering Quality Protein Oil
Brand Variety ‡ (n=10) (n=10) (n=8) (n=8) (n=8) (n=6) (n=2) (n=2) (n=2)bu/a % Score in. DAP ------ Score ------- % %
Asgrow AG5233 GENRR2Y (STS) 65 ± 1 13.0 1.8 38 141 1.1 3.4 37.4 20.3Armor 55-R22 (RR2Y) 63 ± 1 13.0 1.8 39 149 1.2 1.9 37.1 19.8Dyna-Gro 32RY55 (RR2Y) 61 ± 1 12.6 1.8 39 149 1.2 1.9 36.7 19.9Hornbeck HBK RY 5421 (RR2Y) 61 ± 1 13.4 2.2 36 148 1.2 1.7 37.4 21.0Dyna-Gro S54RY43 (RR2Y) 61 ± 1 13.1 2.0 39 149 1.2 2.4 38.9 19.2Terral-REV Brand 55R53 (RR) 60 ± 1 12.4 2.1 37 148 1.1 3.0 38.1 19.9USG 75Q42R (RR2Y) 60 ± 1 12.6 2.1 39 149 1.2 1.9 39.3 19.1Asgrow AG5332 GENRR2Y 59 ± 1 12.5 2.1 38 143 1.1 3.3 37.4 19.9Terral-REV Brand 51R53 (RR) 59 ± 1 13.0 1.8 38 142 1.1 2.5 37.7 21.3Armor 53-R16 (RR2Y) 58 ± 1 12.9 1.9 37 148 1.2 2.8 37.5 19.1Asgrow AG5532 GENRR2Y (STS) 58 ± 1 12.5 1.6 40 147 1.2 2.7 37.7 19.9Armor 53-R88 (RR2Y/STS) 58 ± 1 12.6 1.7 35 145 1.2 2.2 35.8 21.1Progeny 5111 RY (RR2Y) 57 ± 1 13.0 1.9 41 143 1.1 2.4 36.1 21.2Progeny 5210 RY (RR2Y) 56 ± 1 13.2 2.0 36 146 1.2 1.7 36.5 20.5Terral-REV Brand 53R23 (RR) 56 ± 1 12.1 1.4 34 145 1.1 3.0 37.3 20.4Hornbeck HBK RY 5221 (RR2Y) 56 ± 1 13.8 2.0 42 145 1.1 3.1 37.7 20.1TN Exp TN09-45,905 (RR2Y) 55 ± 1 12.2 2.2 37 146 1.2 2.6 37.4 19.9Terral-REV Brand 52R74 (RR) 54 ± 1 12.5 1.5 40 141 1.1 2.6 38.4 20.0Terral-REV Brand 54R84 (RR) 54 ± 1 12.6 2.5 35 145 1.2 2.0 37.6 20.3Schillinger Seed 5220 RC 54 ± 1 12.7 2.1 42 143 1.1 3.3 38.0 20.3AR R04-1268RR 52 ± 1 12.9 2.4 37 147 1.2 2.4 37.1 19.3
Average 58 12.8 1.9 38 146 1.2 2.5 37.5 20.1† All yields are adjusted to 13% moisture.‡ If a trait appears inside parentheses i.e. (RR), then it is not part of the variety name.§ Average moisture at harvestLodging = 1 to 5 scale; where 1 = 95% of plants erect; 2.5 = ~50% of plants leaning at angle ≥ 45°; 5 = 95+% of plants leaning at an angle ≥ 45°.Maturity = days after planting (DAP).Shattering = 1 to 5 scale; where 1 = no shattering; 5 = 90+% of pods shattered.Seed Quality = 1 to 5 scale; where 1 = < 5% of seeds showing disease or split seed coats; 5 = 95+% of seed are diseased or have split seed coats.Protein & Oil on dry weight basis.
Table 36. Mean yields † and agronomic characteristics of 21 Early Maturity Group V (5.0 - 5.5) Roundup Ready soybean

Table 37. Mean yields † of eight Early Maturity Group V (5.0 - 5.5) Roundup Ready soybean varieties evaluated in five environments (n=15) in Tennessee for three years, 2011 - 2013.
Avg. Yield± Std Err. Milan
Brand Variety ‡ (n=15) Knoxville Irr. Non-Irr. Irr. Ames -----------------------------------------bu/a----------------------------------
Armor 55-R22 (RR2Y) 61 ± 1 71 63 53 71 47Terral-REV Brand 51R53 (RR) 59 ± 1 69 59 47 67 52Armor 53-R88 (RR2Y/STS) 58 ± 1 66 58 55 68 43Asgrow AG5532 GENRR2Y (STS) 57 ± 1 70 61 50 60 46Asgrow AG5332 GENRR2Y 57 ± 1 70 61 46 58 50Progeny 5210 RY (RR2Y) 56 ± 1 66 62 51 59 41Progeny 5111 RY (RR2Y) 55 ± 1 66 59 48 62 41Schillinger Seed 5220 RC 55 ± 1 65 60 50 51 49Average (bu/a) 57 68 60 50 62 46L.S.D..05 (bu/a) 4 11 8.5 11 10 6C.V. (%) 11.1 11 9.4 14.2 10.8 9.4† All yields are adjusted to 13% moisture.‡ If a trait appears inside parentheses i.e. (RR), then it is not part of the variety name.
Springfield

Table 38. Mean yields † and agronomic characteristics of eight Early Maturity Group V (5.0 - 5.5) Roundup Ready soybean varieties evaluated in five environments (n=15) in Tennessee for three years, 2011 - 2013.
Avg. Yield Seed± Std Err. Moisture § Lodging Height Maturity Shattering Quality Protein Oil
Brand Variety ‡ (n=15) (n=15) (n=12) (n=12) (n=12) (n=9) (n=3) (n=3) (n=3)bu/a % Score in. DAP ------------- Score ----- % %
Armor 55-R22 (RR2Y) 61 ± 1 12.6 1.8 41 149 1.1 1.8 37.7 20.5Terral-REV Brand 51R53 (RR) 59 ± 1 12.4 1.8 40 143 1.1 2.5 38.6 21.8Armor 53-R88 (RR2Y/STS) 58 ± 1 12.4 1.7 38 145 1.1 2.1 36.4 21.7Asgrow AG5532 GENRR2Y (STS) 57 ± 1 12.1 1.6 41 146 1.1 2.4 38.3 20.5Asgrow AG5332 GENRR2Y 57 ± 1 12.1 2.5 39 145 1.1 3.2 38.2 20.4Progeny 5210 RY (RR2Y) 56 ± 1 12.9 2.1 38 146 1.1 1.7 37.0 21.2Progeny 5111 RY (RR2Y) 55 ± 1 12.5 1.9 42 143 1.1 2.3 36.8 21.7Schillinger Seed 5220 RC 55 ± 1 12.4 1.9 43 144 1.1 3.2 39.1 20.7
Average 57 12.4 1.9 40 145 1.1 2.4 37.8 21.1† All yields are adjusted to 13% moisture.‡ If a trait appears inside parentheses i.e. (RR), then it is not part of the variety name.§ Average moisture at harvestLodging = 1 to 5 scale; where 1 = 95% of plants erect; 2.5 = ~50% of plants leaning at angle ≥ 45°; 5 = 95+% of plants leaning at an angle ≥ 45°.Maturity = days after planting (DAP).Shattering = 1 to 5 scale; where 1 = no shattering; 5 = 90+% of pods shattered.Seed Quality = 1 to 5 scale; where 1 = < 5% of seeds showing disease or split seed coats; 5 = 95+% of seed are diseased or have split seed coats.Protein & Oil on dry weight basis.

Table 39. Yields † of 15 Early Maturity Group V (5.0 - 5.5) Roundup Ready soybean varieties in 10 County Standard Testsin Tennessee and Kentucky during 2013.
Avg. KY Shelby1 Shelby2MS Brand/Variety Yld. Moist Carlisle Coffee Crockett Dyer Fayette Franklin Lake Madison Johnson Tolbert
bu/a % 7/5 § 5/2 6/27 5/28 6/27 6/26 6/26 5/30 5/15 6/21A **Asgrow AG5332 GENRR2Y 62.4 12.8 52.9 79.1 53.3 69.8 60.4 77.6 64.7 77.2 36.2 53.3A Asgrow AG5233 GENRR2Y 62.0 13.2 50.7 74.1 60.7 69.3 55.3 73.6 60.7 72.4 41.5 61.9AB Dyna-Gro S32RY55 RR2Y 60.8 13.5 49.7 62.5 62.4 65.8 58.2 77.6 59.5 73.8 41.2 57.1ABC Armor 55-R22 RR2 60.3 13.5 51.0 67.8 60.0 61.6 56.0 76.8 60.5 72.0 38.1 59.0ABCD Warren Seed DS 5122 R2Y 59.8 13.4 52.1 83.8 56.6 63.1 53.1 75.5 62.1 65.2 26.7 59.7ABCDE Hornbeck HBK RY5221 RR2Y 59.6 13.5 56.9 72.7 57.3 61.4 56.7 74.3 58.3 63.3 37.9 57.4ABCDE Croplan R2C5371 GENRR2Y 58.9 13.1 50.6 53.1 56.5 61.1 55.1 74.1 57.1 78.9 42.2 60.3ABCDE *Croplan R2C5081 GENRR2Y 58.9 13.3 46.5 60.2 55.7 67.4 55.3 76.3 61.5 71.3 45.3 49.4ABCDE Progeny P5210 RY 58.6 13.3 49.0 56.3 59.9 66.9 54.3 75.7 59.4 72.5 34.1 57.8BCDE Terral REV-53R23 57.4 12.9 46.8 63.5 61.2 58.7 55.6 71.4 59.7 71.9 35.3 50.0BCDE Terral REV-55R83 57.3 13.0 49.9 58.3 47.7 61.3 57.5 74.4 55.4 74.0 40.9 53.4BCDE Dyna-Gro S54RY43 RR2Y 57.1 13.0 42.2 65.4 62.7 64.5 51.7 76.3 58.3 66.5 29.0 54.7CDE USG 75Q42R RR2Y 56.5 13.2 44.7 64.6 53.0 64.6 52.8 76.1 56.5 64.4 32.0 56.2DE Schillinger 5220.RC 56.2 13.3 51.9 47.9 61.4 60.4 54.1 75.9 57.9 67.8 40.0 44.9E Hornbeck HBK RY5421 RR2Y 55.8 12.9 46.0 59.4 57.3 64.2 48.1 71.2 61.5 70.1 31.5 48.3
Average (bu/a) 58.8 13.2 49.4 64.6 57.7 64.0 54.9 75.1 59.5 70.8 36.8 54.9† Yields have been adjusted to 13% moisture.‡ Moisture at harvest.§ Planting date.Each variety was evaluated in a large strip-plot at each loction, thus each county test was considered as one replication of the test in calculating the average yield and in conducting the statistical analysis to determine significant differences (MS).Varieties marked with an asterisk (*) and/or (**) were in the top performing group in 2012 and/or 2011.MS= Varieties with any MS letter in common are not statistically different at the 5% level of probability.Data provided by Robert C. Williams, Ext. Area Specialist, Grain Crops, and the extension agents in the counties shown above.

Tennessee and Kentucky County Standard Tests during 2013. CSTAvg.Yield Frogeye SCN
MS Brand/Variety (n=10) RECM/WTREC Sudden Death Treated ¶ Untreated Treated ¶ Untreated Race 2 Race 3 Race 5bu/a bu/a bu/a bu/a bu/a
A **Asgrow AG5332 GENRR2Y 62.4 HIGH/LOW LOW 37.1 34.3 53.0 51.9 S S SA Asgrow AG5233 GENRR2Y 62.0 HIGH/LOW LOW 32.8 32.4 60.1 56.7 S MS SAB Dyna-Gro S32RY55 RR2Y 60.8 MOD/LOW LOW 36.4 30.0 49.0 47.6 S S SABC Armor 55-R22 RR2 60.3 MOD/LOW LOW 34.4 32.9 54.0 49.4 S MS MRABCD Warren Seed DS 5122 R2Y 59.8 HIGH/LOW LOW 33.8 28.7 48.9 47.0 S S SABCDE Hornbeck HBK RY5221 RR2Y 59.6 LOW/LOW LOW 27.5 30.3 43.5 48.6 S S SABCDE Croplan R2C5371 GENRR2Y 58.9 LOW/LOW LOW-MOD 40.0 39.9 50.5 51.3 S S SABCDE *Croplan R2C5081 GENRR2Y 58.9 LOW/LOW LOW-HIGH 42.5 42.2 45.3 47.0 MS S MSABCDE Progeny P5210 RY 58.6 LOW/LOW LOW-HIGH 38.0 38.4 42.0 46.6 S MR SBCDE Terral REV-53R23 57.4 LOW/LOW LOW-MOD 43.8 40.3 52.4 47.8 S MR MRBCDE Terral REV-55R83 57.3 MOD/LOW LOW 37.4 31.4 49.7 48.2 MS MS MSBCDE Dyna-Gro S54RY43 RR2Y 57.1 MOD/LOW LOW 35.2 33.0 53.4 47.4 S MS MSCDE USG 75Q42R RR2Y 56.5 HIGH/LOW LOW 32.3 27.0 52.0 48.5 S MR MSDE Schillinger 5220.RC 56.2 HIGH/LOW LOW 28.3 24.6 53.2 49.8 MS MS MSE Hornbeck HBK RY5421 RR2Y 55.8 LOW/LOW LOW-HIGH 36.4 35.4 47.8 49.6 S S MS
Average (bu/a) 58.8 35.7 33.4 50.3 49.2YLD= Avg. Yield @ 13% moisture.MS= Varieties that have any MS letter in common are not statistically different in yield at the 5% level of probability.Varieties marked with an asterisk (*) and/or (**) were in the top performing group in 2012 and/or 2011.County locations include: Carlisle KY, Coffee, Crockett, Dyer, Fayette, Franklin, Lake, Madison, Shelby 1 (Johnson) and Shelby 2 (Tolbert).¶ Treated plots at RECM & WTREC sprayed with Quadris TOP @ 8 oz./Acre + 1% Induce @ R3 growth stage. RECM varieties planted May 28 and WTREC planted June 29 Disease ratings (of unsprayed plots) for Frogeye and Sudden Death are LOW (0-10% disease), MOD (11-40% disease), HIGH (41-100%)Disease ratings & yield data compiled by Dr. Heather Kelly from replicated plots at the Research and Education Center at Milan (RECM, which has severe disease pressure) and the West Tennessee Research and Education Center (WTREC, which has low disease pressure due to regular crop rotation).SCN Greenhouse Ratings compiled by Dr. Pat Donald, Research Plant Path., USDA-ARS, WTREC. Race 2 (HG Type 1.2.5.7), Race 3 (HG Type 7) andRace 5 (HG Type 2.5.7), HS = Highly Susceptible, S = Susceptible, MS = Moderately Susceptible, MR = Moderately Resistant, R = Resistant.
Table 40. Yields † and disease ratings § of 15 early Maturity Group V (5.0 - 5.5) Roundup Ready soybean varieties evaluated in 10
RECM Yield WTREC Yield------------------------------------------ Research and Education Center at Milan (RECM) and Jackson (WTREC)------------------------------------------

Table 41. Overall average yields † and moistures of 12 Early Maturity Group V (5.0 - 5.5) Roundup Ready soybean varietiesevaluated in County Standard Tests (n=10) and AgResearch and Education Centers (n=5) in Tennessee in 2013.
Research and Averages of CST & REC Tests County Standard Trials Education Center Trials
Avg. Avg. Avg.Brand Variety ‡ Yield Moisture Yield Moisture Yield Moisture
bu/a % bu/a % bu/a %Asgrow AG5233 GENRR2Y (STS) 63 13.8 62 13.2 64 14.3Warren Seed DS5122 R2Y 59 13.6 60 13.4 59 13.8Asgrow AG5332 GENRR2Y 59 13.2 62 12.8 56 13.5Armor 55-R22 (RR2Y) 59 13.6 60 13.5 58 13.7Dyna-Gro 32RY55 (RR2Y) 59 13.6 61 13.5 57 13.6Hornbeck HBK RY 5221 (RR2Y) 57 14.4 60 13.5 55 15.2Hornbeck HBK RY 5421 (RR2Y) 56 13.7 56 12.9 57 14.5Dyna-Gro S54RY43 (RR2Y) 56 13.5 57 13.0 55 14.0USG 75Q42R (RR2Y) 55 13.4 56 13.2 54 13.6Progeny 5210 RY (RR2Y) 55 13.9 59 13.3 51 14.4Terral-REV Brand 53R23 (RR) 53 13.1 57 12.9 49 13.2Schillinger Seed 5220 RC 52 13.5 56 13.3 48 13.6Average (bu/a) 57 13.6 59 13.2 55 14.0† Yields have been adjusted to 13% moisture.‡ If a trait appears inside parentheses i.e. (RR), then it is not part of the variety name.

Table 42. Mean yields † of 13 Late Maturity Group V (5.6 - 5.9) Roundup Ready soybean varieties evaluated in fiveenvironments in Tennessee during 2013.
Avg. Yield± Std Err. Springfield Milan
Brand Variety ‡ (n=5) Knoxville Irr. Non-Irr. Irr. Ames -----------------------------------bu/a--------------------------------------
Asgrow AG5634 (RR2Y) 58 ± 2 67 58 57 73 35TN Exp TN12-5716 (RR2Y) 57 ± 2 70 60 46 53 55Terral-REV Brand 57R21 (RR) 56 ± 2 58 64 46 68 44Terral-REV Brand 56R63 (RR) 55 ± 2 57 63 48 63 46Asgrow AG5633 GENRR2Y 55 ± 2 62 58 49 63 40Progeny 5711 RY (RR2Y) 55 ± 2 67 56 37 66 47TN Exp TN09-44,121 (RR2Y) 54 ± 2 53 57 49 57 56Progeny 5610 RY (RR2Y) 54 ± 2 75 47 40 66 41USG Allen (RR) 53 ± 2 62 51 40 60 50Terral-REV Brand 59R13 (RR) 52 ± 2 55 53 47 62 43TN Exp TN12-5523 (RR2Y) 51 ± 2 55 56 45 49 49Asgrow AG5632 GENRR2Y (STS) 51 ± 2 60 53 50 43 47Delta Grow 5625 RR2 48 ± 2 49 51 42 61 37Average (bu/a) 54 61 56 46 60 45L.S.D..05 (bu/a) 5 13 10 12 13 9C.V. (%) 12.5 12.7 10.3 14.8 12.5 12.0† All yields are adjusted to 13% moisture.‡ If a trait appears inside parentheses i.e. (RR), then it is not part of the variety name.

Table 43. Mean yields † and agronomic characteristics of 13 Late Maturity Group V (5.6 - 5.9) Roundup Ready soybeanvarieties evaluated in five environments in Tennessee during 2013.
Avg. Yield Seed± Std Err. Moisture § Lodging Height Maturity Shattering Quality Protein Oil Frogeye
Brand Variety ‡ (n=5) (n=5) (n=4) (n=4) (n=4) (n=3) (n=1) (n=1) (n=1) (n=1)bu/a % Score in. DAP -------- Score -------- % % Score
Asgrow AG5634 (RR2Y) 58 ± 2 12.6 2.1 38 148 1.2 2.2 34.6 18.5 3TN Exp TN12-5716 (RR2Y) 57 ± 2 12.4 1.9 35 147 1.2 1.2 34.0 18.5 2.3Terral-REV Brand 57R21 (RR) 56 ± 2 12.5 2.1 44 147 1.2 4.7 34.9 19.1 2.7Terral-REV Brand 56R63 (RR) 55 ± 2 12.6 2.3 40 147 1.5 2.0 35.1 18.3 4.7Asgrow AG5633 GENRR2Y 55 ± 2 12.6 1.9 34 144 1.2 2.5 34.4 18.6 5.7Progeny 5711 RY (RR2Y) 55 ± 2 12.2 2.1 33 145 1.4 1.5 33.7 18.6 3.3TN Exp TN09-44,121 (RR2Y) 54 ± 2 12.3 2.0 37 148 1.3 1.2 34.1 18.3 2.3Progeny 5610 RY (RR2Y) 54 ± 2 12.8 1.9 33 146 1.5 1.8 34.6 18.3 2.7USG Allen (RR) 53 ± 2 12.7 1.8 36 147 1.4 1.7 35.6 18.2 2.7Terral-REV Brand 59R13 (RR) 52 ± 2 12.8 1.9 34 146 1.4 1.5 34.6 18.6 2.7TN Exp TN12-5523 (RR2Y) 51 ± 2 12.5 2.1 33 145 1.4 1.0 34.7 18.3 2.3Asgrow AG5632 GENRR2Y (STS) 51 ± 2 12.7 1.7 36 144 1.6 3.3 34.6 18.9 6Delta Grow 5625 RR2 48 ± 2 12.2 2.2 33 146 1.3 1.8 33.4 18.7 2.7
Average 54 12.5 2.0 36 146 1.4 2.0 34.5 18.5 3.3† All yields are adjusted to 13% moisture.‡ If a trait appears inside parentheses i.e. (RR), then it is not part of the variety name.§ Average moisture at harvestLodging = 1 to 5 scale; where 1 = 95% of plants erect; 2.5 = ~50% of plants leaning at angle ≥ 45°; 5 = 95+% of plants leaning at an angle >45°. Maturity = days after planting (DAP).Shattering = 1 to 5 scale; where 1 = no shattering; 5 = 90+% of pods shattered.Seed Quality = 1 to 5 scale; where 1 = < 5% of seeds showing disease or split seed coats; 5=95+% of seed are diseased or have split seed coats.Protein & Oil on dry weight basis.Disease ratings for Frogeye Leaf Spot are from 1-9, where 0=no disease & 10=maximum amount of plant disease or plant death. Ratings taken 8/26/13 in Knoxville, TN

Table 44. Yields †, plant health, and disease ratings of 13 Late Maturity Group V (5.6 - 5.9) Roundup Readysoybean varieties evaluated at Milan, Tennessee during 2013.
Yield Yield Plant SDSMilan Milan Health DI DS DX
Brand Variety ‡ Irr. Non-Irr. (n=2) (n=1) (n=1) (n=1)bu/a bu/a (1-4) % 0 - 9 index
Asgrow AG5634 (RR2Y) 73 65 1 18 3 55Terral-REV Brand 57R21 (RR) 68 62 1 23 3.7 90Progeny 5711 RY (RR2Y) 66 66 2 20 3 60Terral-REV Brand 56R63 (RR) 63 57 1 30 3.7 113Progeny 5610 RY (RR2Y) 66 54 2 22 3 73TN Exp TN12-5716 (RR2Y) 53 34 2 63 4 267TN Exp TN09-44,121 (RR2Y) 57 43 2 43 3.7 167Asgrow AG5633 GENRR2Y 63 41 1 72 3.7 273USG Allen (RR) 60 42 2 42 3.3 138Delta Grow 5625 RR2 61 64 3 17 3.7 60Terral-REV Brand 59R13 (RR) 62 40 3 27 3 80TN Exp TN12-5523 (RR2Y) 49 44 2 37 3.7 133Asgrow AG5632 GENRR2Y (STS) 43 22 1 93 4.3 403
Average 60 49 2 39 4 147† All yields are adjusted to 13% moisture.‡ If a trait appears inside parentheses i.e. (RR), then it is not part of the variety name.DI = disease incidence = percentage of plants with symptomsDS = disease severity = score of leaf chlorosis and necrosis; 0 = no symptoms; 9 = plant death before normal defoliation due to senescence.DX = disease index = (DI x DS / 9); ratings were made at approximately R6 when green pods with seed have reached full size on 8/28/13.

Table 45. Mean yields † of eight Late Maturity Group V (5.6 - 5.9) Roundup Ready soybeanvarieties evaluated in five environments (n=10) in Tennessee for two years, 2012 - 2013.
Avg. Yield± Std Err. Springfield Milan
Brand Variety ‡ (n=10) Knoxville Irr. Non-Irr. Irr. Ames
Asgrow AG5633 GENRR2Y 60 ± 1 68 67 50 69 44Progeny 5711 RY (RR2Y) 59 ± 1 70 64 44 76 43Progeny 5610 RY (RR2Y) 58 ± 1 77 62 39 69 44Terral-REV Brand 56R63 (RR) 57 ± 1 66 62 48 62 49Terral-REV Brand 57R21 (RR) 57 ± 1 66 62 44 67 44Terral-REV Brand 59R13 (RR) 56 ± 1 59 62 49 66 47USG Allen (RR) 56 ± 1 71 58 40 65 46Asgrow AG5632 GENRR2Y (STS) 54 ± 1 65 61 46 54 46Average (bu/a) 57 68 62 45 66 45L.S.D..05 (bu/a) 4 11 9.3 9.3 11.5 8C.V. (%) 11.8 11.4 10.2 13.8 12.2 11.2† All yields are adjusted to 13% moisture.‡ If a RR appears inside parentheses (RR), then it is not part of the variety name.
---------------------------------------------bu/a----------------------------------------------

Table 46. Mean yields † and agronomic characteristics of eight Late Maturity Group V (5.6 - 5.9) Roundup Ready soybeanvarieties evaluated in five environments (n=10) in Tennessee for two years, 2012 - 2013.
Avg. Yield Seed± Std Err. Moisture § Lodging Height Maturity Shattering Quality Protein Oil
Brand Variety ‡ (n=10) (n=10) (n=8) (n=8) (n=8) (n=6) (n=2) (n=2) (n=2)bu/a % Score in. DAP -------- Score -------- % %
Asgrow AG5633 GENRR2Y 60 ± 1 12.2 1.8 37 152 1.1 2.8 36.4 19.9Progeny 5711 RY (RR2Y) 59 ± 1 11.9 2.0 36 153 1.2 2.3 35.5 20.3Progeny 5610 RY (RR2Y) 58 ± 1 13.1 1.8 37 154 1.3 2.3 36.8 19.7Terral-REV Brand 56R63 (RR) 57 ± 1 12.2 2.1 42 154 1.3 2.7 37.5 19.8Terral-REV Brand 57R21 (RR) 57 ± 1 12.9 2.0 45 154 1.1 3.9 37.0 20.6Terral-REV Brand 59R13 (RR) 56 ± 1 12.5 1.8 38 155 1.2 1.9 36.7 20.1USG Allen (RR) 56 ± 1 13.2 1.8 38 155 1.2 2.2 38.0 19.5Asgrow AG5632 GENRR2Y (STS) 54 ± 1 12.5 1.6 38 152 1.3 2.8 36.6 20.3
Average 57 12.6 1.9 39 154 1.2 2.6 36.8 20.0† All yields are adjusted to 13% moisture.‡ If a trait appears inside parentheses i.e. (RR), then it is not part of the variety name.§ Average moisture at harvestLodging = 1 to 5 scale; where 1 = 95% of plants erect; 2.5 = ~50% of plants leaning at angle ≥ 45°; 5 = 95+% of plants leaning at an angle ≥ 45°.Maturity = days after planting (DAP).Shattering = 1 to 5 scale; where 1 = no shattering; 5 = 90+% of pods shattered.Seed Quality = 1 to 5 scale; where 1 = < 5% of seeds showing disease or split seed coats; 5 = 95+% of seed are diseased or have split seed coats.Protein & Oil on dry weight basis.Frogeye = 1 to 5 scale; where 1 = < 5% of leaf surfaces containing disease spots; 5 = 95% + of leaf surfaces containing disease spots. Ratings from Knoxville on 9/1/11.

varieties evaluated in five environments (n=15) in Tennessee for three years, 2011-2013.Avg. Yield± Std Err. Milan
Brand Variety ‡ (n=15) Knoxville Irr. Non-Irr. Irr. Ames --------------------------------------bu/a-----------------------------------
Progeny 5711 RY (RR2Y) 62 ± 1 77 62 52 74 43Progeny 5610 RY (RR2Y) 57 ± 1 72 61 45 67 43USG Allen (RR) 57 ± 1 74 56 47 64 44Asgrow AG5632 GENRR2Y (STS) 55 ± 1 68 61 49 54 44Average (bu/a) 58 73 60 48 65 44L.S.D..05 (bu/a) 4 11 10 8 10 7C.V. (%) 11.4 11.2 11.1 11.5 11.4 10.8
varieties evaluated in five environments (n=15) in Tennessee for three years, 2011 - 2013.Avg. Yield Seed± Std Err. Moisture § Lodging Height Maturity Shattering Quality Protein Oil
Brand Variety ‡ (n=15) (n=15) (n=12) (n=12) (n=12) (n=9) (n=3) (n=3) (n=3)bu/a % Score in. DAP ------------- Score ------- % %
Progeny 5711 RY (RR2Y) 62 ± 1 12.0 1.9 38 152 1.1 2.4 36.1 20.9Progeny 5610 RY (RR2Y) 57 ± 1 12.9 1.7 38 153 1.2 2.1 37.0 20.4USG Allen (RR) 57 ± 1 13.2 1.7 40 154 1.1 2.1 38.4 20.1Asgrow AG5632 GENRR2Y (STS) 55 ± 1 12.4 1.6 40 151 1.2 2.5 36.9 20.9
Average 58 12.6 1.7 39.0 152.5 1.2 2.3 37.1 20.6† All yields are adjusted to 13% moisture.‡ If a trait appears inside parentheses i.e. (RR), then it is not part of the variety name.§ Average moisture at harvestLodging = 1 to 5 scale; where 1 = 95% of plants erect; 2.5 = ~50% of plants leaning at angle ≥ 45°; 5 = 95+% of plants leaning at an angle ≥ 45°.Maturity = days after planting (DAP).Shattering = 1 to 5 scale; where 1 = no shattering; 5 = 90+% of pods shattered.Leaf Retention (at harvest) = 1 to 5 scale; where 1 = < 5% of plants holding leaves at harvest maturity; 5=95+% of plants holding leaves and green stems at harvest maturity.Seed Quality = 1 to 5 scale; where 1 = < 5% of seeds showing disease or split seed coats; 5 = 95+% of seed are diseased or have split seed coats.Protein & Oil on dry weight basis.Frogeye = 1 to 5 scale; where 1 = < 5% of leaf surfaces containing disease spots; 5 = 95% + of leaf surfaces containing disease spots. Ratings from Knoxville on 9/1/11.
Table 47. Mean yields † of four Late Maturity Group V (5.6 - 5.9) Roundup Ready soybean
Table 48. Mean yields † and agronomic characteristics of four Late Maturity Group V (5.6 - 5.9) Roundup Ready soybean
Springfield

Table 49. Mean yields † of 29 Maturity Group IV Liberty Link soybean varieties evaluated in five environments in Tennessee during 2013.
Avg. Yield ± Std Err. Springfield MilanBrand Variety ‡ (n=5) Knoxville Irr. Non-Irr. Irr. Ames
Dyna-Gro SX 13246L (LL) 61 ± 2 71 47 70 60 55Halo 5:01 (LL) 58 ± 2 77 58 59 49 47Delta Grow 4967 LL 58 ± 2 73 61 59 51 45Halo X496 (LL) 56 ± 2 73 58 58 46 46Halo X466 (LL) 56 ± 2 67 50 66 54 43Progeny 4930 LL 55 ± 2 62 53 62 52 48Delta Grow 4981 LL/STS 55 ± 2 63 59 60 45 49Dyna-Gro S49LL34 (LL) 54 ± 2 55 47 61 55 50GoSoy 4912 LL 53 ± 2 60 54 63 44 43Beck's Hybrids 483NL (LL) 53 ± 2 78 52 58 32 45Halo 4:65 (LL) 53 ± 2 73 51 65 34 41Hornbeck LL4950 52 ± 2 68 47 60 44 43Delta Grow 4867 LL 52 ± 2 64 49 62 42 45Halo 4:95 (LL) 52 ± 2 62 46 63 42 47Progeny 4819 LL 51 ± 2 60 41 61 42 53Halo 4:94 (LL) 51 ± 2 61 52 56 40 47Beck's Hybrids 423NL (LL) 51 ± 2 61 38 62 52 41Delta Grow 4990 LL 51 ± 2 61 46 55 43 49Halo 4:40 (LL) 51 ± 2 56 37 64 51 46USG 74G99L (LL) 51 ± 2 58 46 56 46 47USG 74G82L (LL) 50 ± 2 60 47 60 38 45Hornbeck LL4850 50 ± 2 58 47 60 41 43GoSoy 4812 LL 49 ± 2 60 42 58 41 46Progeny 4560 LL 49 ± 2 - 48 64 46 37GoSoy 4411 LL 48 ± 2 60 49 58 32 43Progeny 4928 LL 48 ± 2 59 38 60 38 48GoSoy 4711 LL 47 ± 2 47 45 64 28 50Halo X477 (LL/STS) 46 ± 2 48 50 51 34 44Caverndale Farms 469 LL/STS 43 ± 2 55 50 46 21 42Average (bu/a) 52 63 49 60 43 46L.S.D..05 (bu/a) 5 19 10 7 11 7C.V. (%) 11.8 16.1 11.8 6.8 15.4 8.5† All yields are adjusted to 13% moisture.‡ If a trait appears inside parentheses i.e. (LL), then it is not part of the variety name.
--------------------------------------bu/a--------------------------------------------
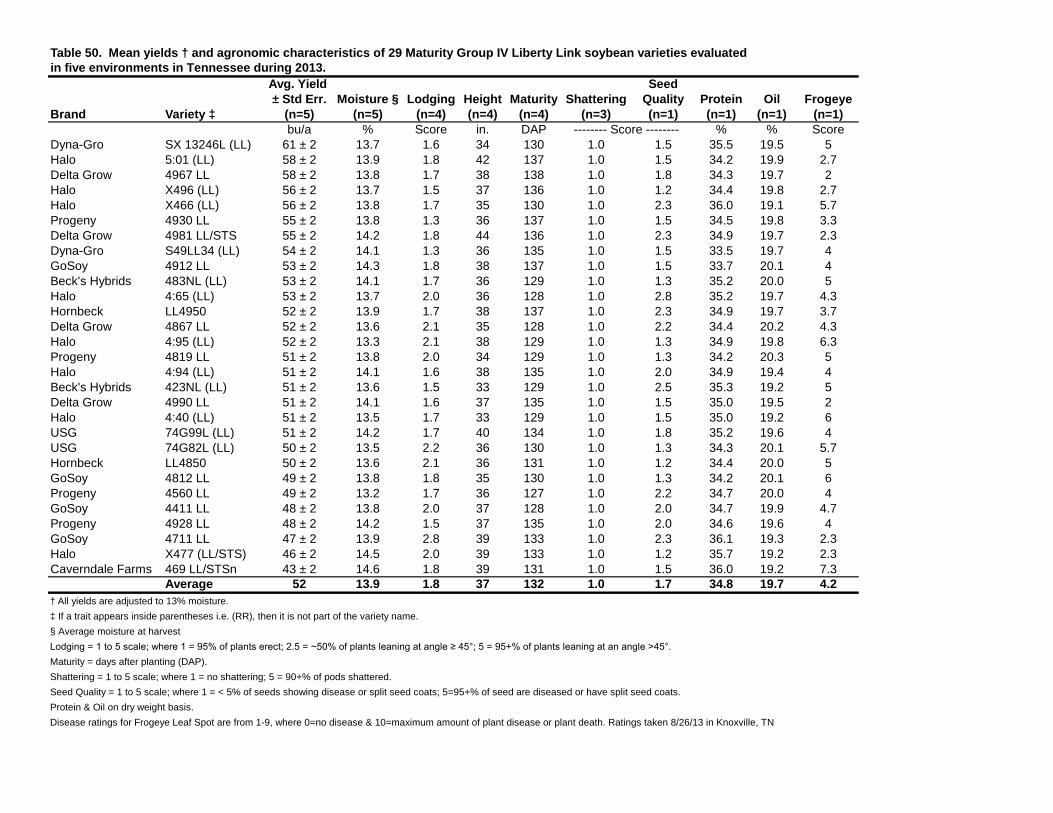
Table 50. Mean yields † and agronomic characteristics of 29 Maturity Group IV Liberty Link soybean varieties evaluatedin five environments in Tennessee during 2013.
Avg. Yield Seed± Std Err. Moisture § Lodging Height Maturity Shattering Quality Protein Oil Frogeye
Brand Variety ‡ (n=5) (n=5) (n=4) (n=4) (n=4) (n=3) (n=1) (n=1) (n=1) (n=1)bu/a % Score in. DAP -------- Score -------- % % Score
Dyna-Gro SX 13246L (LL) 61 ± 2 13.7 1.6 34 130 1.0 1.5 35.5 19.5 5Halo 5:01 (LL) 58 ± 2 13.9 1.8 42 137 1.0 1.5 34.2 19.9 2.7Delta Grow 4967 LL 58 ± 2 13.8 1.7 38 138 1.0 1.8 34.3 19.7 2Halo X496 (LL) 56 ± 2 13.7 1.5 37 136 1.0 1.2 34.4 19.8 2.7Halo X466 (LL) 56 ± 2 13.8 1.7 35 130 1.0 2.3 36.0 19.1 5.7Progeny 4930 LL 55 ± 2 13.8 1.3 36 137 1.0 1.5 34.5 19.8 3.3Delta Grow 4981 LL/STS 55 ± 2 14.2 1.8 44 136 1.0 2.3 34.9 19.7 2.3Dyna-Gro S49LL34 (LL) 54 ± 2 14.1 1.3 36 135 1.0 1.5 33.5 19.7 4GoSoy 4912 LL 53 ± 2 14.3 1.8 38 137 1.0 1.5 33.7 20.1 4Beck's Hybrids 483NL (LL) 53 ± 2 14.1 1.7 36 129 1.0 1.3 35.2 20.0 5Halo 4:65 (LL) 53 ± 2 13.7 2.0 36 128 1.0 2.8 35.2 19.7 4.3Hornbeck LL4950 52 ± 2 13.9 1.7 38 137 1.0 2.3 34.9 19.7 3.7Delta Grow 4867 LL 52 ± 2 13.6 2.1 35 128 1.0 2.2 34.4 20.2 4.3Halo 4:95 (LL) 52 ± 2 13.3 2.1 38 129 1.0 1.3 34.9 19.8 6.3Progeny 4819 LL 51 ± 2 13.8 2.0 34 129 1.0 1.3 34.2 20.3 5Halo 4:94 (LL) 51 ± 2 14.1 1.6 38 135 1.0 2.0 34.9 19.4 4Beck's Hybrids 423NL (LL) 51 ± 2 13.6 1.5 33 129 1.0 2.5 35.3 19.2 5Delta Grow 4990 LL 51 ± 2 14.1 1.6 37 135 1.0 1.5 35.0 19.5 2Halo 4:40 (LL) 51 ± 2 13.5 1.7 33 129 1.0 1.5 35.0 19.2 6USG 74G99L (LL) 51 ± 2 14.2 1.7 40 134 1.0 1.8 35.2 19.6 4USG 74G82L (LL) 50 ± 2 13.5 2.2 36 130 1.0 1.3 34.3 20.1 5.7Hornbeck LL4850 50 ± 2 13.6 2.1 36 131 1.0 1.2 34.4 20.0 5GoSoy 4812 LL 49 ± 2 13.8 1.8 35 130 1.0 1.3 34.2 20.1 6Progeny 4560 LL 49 ± 2 13.2 1.7 36 127 1.0 2.2 34.7 20.0 4GoSoy 4411 LL 48 ± 2 13.8 2.0 37 128 1.0 2.0 34.7 19.9 4.7Progeny 4928 LL 48 ± 2 14.2 1.5 37 135 1.0 2.0 34.6 19.6 4GoSoy 4711 LL 47 ± 2 13.9 2.8 39 133 1.0 2.3 36.1 19.3 2.3Halo X477 (LL/STS) 46 ± 2 14.5 2.0 39 133 1.0 1.2 35.7 19.2 2.3Caverndale Farms 469 LL/STSn 43 ± 2 14.6 1.8 39 131 1.0 1.5 36.0 19.2 7.3
Average 52 13.9 1.8 37 132 1.0 1.7 34.8 19.7 4.2† All yields are adjusted to 13% moisture.‡ If a trait appears inside parentheses i.e. (RR), then it is not part of the variety name.§ Average moisture at harvestLodging = 1 to 5 scale; where 1 = 95% of plants erect; 2.5 = ~50% of plants leaning at angle ≥ 45°; 5 = 95+% of plants leaning at an angle >45°. Maturity = days after planting (DAP).Shattering = 1 to 5 scale; where 1 = no shattering; 5 = 90+% of pods shattered.Seed Quality = 1 to 5 scale; where 1 = < 5% of seeds showing disease or split seed coats; 5=95+% of seed are diseased or have split seed coats.Protein & Oil on dry weight basis. Disease ratings for Frogeye Leaf Spot are from 1-9, where 0=no disease & 10=maximum amount of plant disease or plant death. Ratings taken 8/26/13 in Knoxville, TN

Table 51. Yields †, plant health, and disease ratings of 29 Maturity Group IV Liberty Link soybeanvarieties evaluated at Milan, Tennessee during 2013.
Yield Yield Plant SDSMilan Milan Health DI DS DX
Brand Variety ‡ Irr. Non-Irr. (n=2) (n=1) (n=1) (n=1)bu/a bu/a (1-4) % 0 - 9 index
Dyna-Gro SX 13246L (LL) 60 49 2 7 1.7 14Halo 5:01 (LL) 49 60 2 12 2 25Halo X496 (LL) 46 58 2 7 1.3 10Halo X466 (LL) 54 59 2 1 2 2Progeny 4930 LL 52 58 2 7 1.7 21Delta Grow 4967 LL 51 44 2 24 2.3 67Delta Grow 4981 LL/STS 45 51 2 57 3 170Dyna-Gro S49LL34 (LL) 55 55 3 1 2 3Halo 4:40 (LL) 51 66 2 1 1 1GoSoy 4912 LL 44 54 3 24 2 57Progeny 4819 LL 42 59 2 24 3.3 89Delta Grow 4867 LL 42 50 1 30 2 60USG 74G99L (LL) 46 57 2 11 1.7 31Beck's Hybrids 423NL (LL) 52 55 2 1 1 1Halo 4:65 (LL) 34 43 1 50 3.3 167Halo 4:94 (LL) 40 50 2 8 1.7 21Beck's Hybrids 483NL (LL) 32 40 2 33 3 93Halo 4:95 (LL) 42 44 1 43 3 137Hornbeck LL4950 44 38 3 30 2 84Delta Grow 4990 LL 43 43 3 8 1.3 14USG 74G82L (LL) 38 44 2 35 3.3 122GoSoy 4411 LL 32 50 1 11 2.7 42Hornbeck LL4850 41 39 2 40 3 120Progeny 4928 LL 38 45 3 8 2 17GoSoy 4812 LL 41 39 2 53 3.3 183GoSoy 4711 LL 28 45 1 21 3.7 82Halo X477 (LL/STS) 34 42 1 37 3 113Caverndale Farms 469 LL/STSn 21 37 1 48 3.3 195Progeny 4560 LL 46 63 1 30 2.7 123
Average 43 50 2 23 2 71† All yields are adjusted to 13% moisture.‡ If a trait appears inside parentheses i.e. (RR), then it is not part of the variety name.DI = disease incidence = percentage of plants with symptomsDS = disease severity = score of leaf chlorosis and necrosis; 0 = no symptoms; 9 = plant death before normal defoliation due to senescDX = disease index = (DI x DS / 9); ratings were made at approximately R6 when green pods with seed have reached full size on 8/28/1

Table 52. Mean yields † of 16 Maturity Group IV Liberty Link soybean varietiesevaluated in five environments (n=10) in Tennessee for two years, 2012 - 2013.
Avg. Yield ± Std Err. Springfield MilanBrand Variety ‡ (n=10) Knoxville Irr. Non-Irr. Irr. Ames
-----------------------------------bu/a-----------------------------------------Halo 5:01 (LL) 59 ± 1 71 69 52 55 46Delta Grow 4967 LL 58 ± 1 67 68 52 58 44GoSoy 4912 LL 56 ± 1 60 62 53 58 45Progeny 4819 LL 53 ± 1 58 58 53 50 47Beck's Hybrids 483NL (LL) 53 ± 1 68 57 52 47 41Halo 4:94 (LL) 52 ± 1 60 62 50 47 43Delta Grow 4990 LL 52 ± 1 58 58 50 48 48Halo 4:95 (LL) 52 ± 1 59 54 53 51 43Delta Grow 4867 LL 52 ± 1 59 60 53 45 43GoSoy 4812 LL 51 ± 1 58 56 53 49 42USG 74G82L (LL) 51 ± 1 60 58 53 44 42Halo 4:65 (LL) 51 ± 1 61 55 53 46 42Progeny 4928 LL 51 ± 1 59 52 51 50 45USG 74G99L (LL) 51 ± 1 58 54 50 49 44GoSoy 4711 LL 50 ± 1 53 53 53 43 46GoSoy 4411 LL 50 ± 1 56 55 50 44 43Average (bu/a) 53 60 58 52 49 44L.S.D..05 (bu/a) 4 12 9 6 10 5C.V. (%) 11.1 12.3 11.0 8.3 14.3 7.6† All yields are adjusted to 13% moisture.‡ If a trait appears inside parentheses i.e. (RR), then it is not part of the variety name.

Table 53. Mean yields † and agronomic characteristics of 16 Maturity Group IV Liberty Link soybean varietiesevaluated in five environments (n=10) in Tennessee for two years, 2012 - 2013.
Avg. Yield Seed± Std Err. Moisture § Lodging Height Maturity Shattering Quality Protein Oil
Brand Variety ‡ (n=10) (n=10) (n=8) (n=8) (n=8) (n=6) (n=2) (n=2) (n=2)bu/a % Score in. DAP -------------- Score ----- % %
Halo 5:01 (LL) 59 ± 1 15.9 1.9 43 141 1.0 1.8 35.5 22.2Delta Grow 4967 LL 58 ± 1 15.2 1.9 42 142 1.0 1.9 35.5 21.6GoSoy 4912 LL 56 ± 1 16.7 1.9 42 142 1.0 1.7 35.3 21.8Progeny 4819 LL 53 ± 1 13.8 2.2 37 135 1.0 2.3 36.4 21.7Beck's Hybrids 483NL (LL) 53 ± 1 14.3 1.9 37 135 1.0 2.2 36.9 21.6Halo 4:94 (LL) 52 ± 1 14.3 1.8 40 139 1.0 1.9 36.6 21.0Delta Grow 4990 LL 52 ± 1 14.0 1.6 39 138 1.0 1.8 36.5 21.0Halo 4:95 (LL) 52 ± 1 13.9 2.2 38 135 1.0 2.1 36.9 21.5Delta Grow 4867 LL 52 ± 1 14.1 2.2 36 135 1.0 2.3 36.6 21.5GoSoy 4812 LL 51 ± 1 14.1 2.1 37 135 1.0 2.0 36.1 21.8USG 74G82L (LL) 51 ± 1 13.9 2.5 37 135 1.0 2.2 36.4 21.7Halo 4:65 (LL) 51 ± 1 13.6 2.0 39 133 1.0 3.6 38.4 21.0Progeny 4928 LL 51 ± 1 14.8 1.6 40 139 1.0 2.0 36.4 21.1USG 74G99L (LL) 51 ± 1 14.1 1.9 41 138 1.0 1.9 36.7 21.1GoSoy 4711 LL 50 ± 1 13.5 2.5 43 136 1.0 2.3 37.7 21.2GoSoy 4411 LL 50 ± 1 13.5 2.1 39 133 1.0 3.1 37.1 21.5
Average 53 14.4 2.0 39 137 1.0 2.2 36.6 21.5† All yields are adjusted to 13% moisture.‡ If a trait appears inside parentheses i.e. (RR), then it is not part of the variety name.§ Average moisture at harvestLodging = 1 to 5 scale; where 1 = 95% of plants erect; 2.5 = ~50% of plants leaning at angle ≥ 45°; 5 = 95+% of plants leaning at an angle ≥ 45°.Maturity = days after planting (DAP).Shattering = 1 to 5 scale; where 1 = no shattering; 5 = 90+% of pods shattered.Seed Quality = 1 to 5 scale; where 1 = < 5% of seeds showing disease or split seed coats; 5 = 95+% of seed are diseased or have split seed coats.Protein & Oil on dry weight basis.Frogeye = 1 to 5 scale; where 1 = < 5% of leaf surfaces containing disease spots; 5 = 95% + of leaf surfaces containing disease spots. Ratings from Knoxville on 9/1/11.

Table 54. Mean yields † of five Maturity Group IV Liberty Link soybeanvarieties evaluated in four environments (n=12) in Tennessee for three years, 2011 - 2013.
Avg. Yield± Std Err. Milan
Brand Variety (n=12) Knoxville Irr. Non-Irr. Irr. ---------------------------bu/a------------------------
Halo 4:65 (LL) 52 ± 1 58 53 47 49Halo 4:94 (LL) 51 ± 1 55 57 44 48GoSoy 4411 LL 51 ± 1 56 54 44 49USG 74G99L (LL) 50 ± 1 52 57 44 48Progeny 4928 LL 50 ± 1 54 52 43 50Average (bu/a) 51 55 55 44 49L.S.D..05 (bu/a) 4.4 6 10 7 9C.V. (%) 11.6 10.0 11.6 10.3 12.2
Table 55. Mean yields † and agronomic characteristics of five Maturity Group IV Liberty Link soybean varieties evaluated in four environments (n=12) in Tennessee for three years, 2011 - 2013.
Avg. Yield Seed± Std Err. Moisture § Lodging Height Maturity Shattering Quality Protein Oil
Brand Variety ‡ (n=12) (n=12) (n=12) (n=12) (n=12) (n=9) (n=3) (n=3) (n=3)bu/a % Score in. DAP ------------- Score ----- % %
Halo 4:65 (LL) 52 ± 1 13.1 1.9 39 132 1.0 3.1 38.6 21.7Halo 4:94 (LL) 51 ± 1 13.5 1.7 40 138 1.0 1.9 37.2 21.4GoSoy 4411 LL 51 ± 1 13.2 1.9 39 132 1.0 2.9 37.8 22.1USG 74G99L (LL) 50 ± 1 13.7 1.7 41 138 1.0 1.9 37.1 21.6Progeny 4928 LL 50 ± 1 13.5 1.5 39 138 1.0 1.9 37.0 21.5
Average 51 13.4 1.7 40 136 1.0 2.3 37.5 21.7† All yields are adjusted to 13% moisture.‡ If a trait appears inside parentheses i.e. (RR), then it is not part of the variety name.§ Average moisture at harvestLodging = 1 to 5 scale; where 1 = 95% of plants erect; 2.5 = ~50% of plants leaning at angle ≥ 45°; 5 = 95+% of plants leaning at an angle ≥ 45°.Maturity = days after planting (DAP).Shattering = 1 to 5 scale; where 1 = no shattering; 5 = 90+% of pods shattered.Seed Quality = 1 to 5 scale; where 1 = < 5% of seeds showing disease or split seed coats; 5 = 95+% of seed are diseased or have split seed coats.Protein & Oil on dry weight basis.
Springfield

Table 56. Yields † of 15 Late Maturity Group IV (4.6 - 4.9) Liberty-Link (LL) soybean varieties in eight County Standard Tests in Tennessee and Kentucky during 2013.
Ky KyFulton1 Fulton2
Avg. AmbergMS Brand/Variety/Maturity Yld. Moist Dyer Fayette Franklin Farms Linder Gibson Obion Shelby
bu/a % 6/18 § 6/12 6/26 6/28 5/15 5/15 6/22 5/19A US Seeds Halo 5:01 61.1 12.9 53.9 49.5 64.4 68.0 77.0 67.0 71.1 37.6AB Hornbeck LL4950 59.3 13.2 49.7 50.2 65.9 67.8 67.4 60.6 74.4 38.4BC USG 74G99LL 57.4 13.1 50.1 42.4 61.3 62.3 67.0 63.4 71.4 41.0BCD Stratton Seed Go-Soy 4910LL 57.0 13.0 46.1 45.7 63.2 64.3 63.5 61.4 69.4 42.4BCD Warren Seed Micah 4900LL 56.7 13.1 47.0 43.7 63.0 61.6 65.1 60.4 71.1 41.3BCD US Seeds Halo 4:94 56.6 13.1 44.7 41.9 60.1 64.6 69.6 62.4 72.1 37.5CD Stratton Seed Go-Soy 4912LL 56.1 13.2 47.6 45.9 65.6 61.8 66.3 54.1 69.0 38.2CD Warren Seed Micah 4800LL 56.0 12.9 42.7 45.8 62.3 59.2 66.6 61.4 70.6 39.1CD Progeny 4819LL 55.4 13.0 35.7 38.3 62.2 71.4 65.3 63.6 69.5 37.0CD Progeny 4928LL 55.4 12.9 40.2 42.1 64.1 63.4 63.6 62.3 69.1 38.2CDE USG 74G82LL 54.5 13.0 39.9 36.0 58.2 68.0 60.6 68.8 68.2 36.7DE Hornbeck LL4850 54.0 13.1 36.3 36.0 59.2 65.5 63.6 64.6 66.7 40.4DE US Seeds Halo 4:97 53.9 13.1 40.8 39.7 60.4 61.0 62.5 62.9 63.9 40.0E Warren Seed Micah 4600LL 52.2 13.3 41.4 37.1 57.3 63.0 62.4 61.4 60.8 34.7E Stratton Seed Go-Soy 4512LL 52.2 13.6 38.5 37.6 57.5 62.0 61.0 60.4 65.2 35.3
Average (bu/a) 55.8 13.1 43.6 42.1 61.6 64.2 65.4 62.3 68.8 38.5† Yields have been adjusted to 13% moisture.‡ Moisture at harvest.§ Planting date.Each variety was evaluated in a large strip-plot at each loction, thus each county test was considered as one replication of the test in calculating the average yield and in conducting the statistical analysis to determine significant differences (MS).MS= Varieties with any MS letter in common are not statistically different at the 5% level of probability.Data provided by Robert C. Williams, Ext. Area Specialist, Grain Crops, and the extension agents in the counties shown above.

Table 57. Yields † and disease ratings § of 15 Late Maturity Group IV (4.6 - 4.9) Liberty Link (LL) soybean varieties evaluated in 8 Tennessee and Kentucky County Standard Tests during 2013.
CSTAvg.Yield Treated ¶ Untreated SCN
MS Brand/Variety (n=8) Frogeye Sudden Death Yield Yield Race 2 Race 3 Race 5bu/a bu/a bu/a
A US Seeds Halo 5:01 61.1 LOW LOW 47.8 40.9 MS S SAB Hornbeck LL4950 59.3 LOW LOW 46.1 39.5 S S SBC USG 74G99LL 57.4 LOW LOW 46.6 41.6 S S MSBCD Stratton Seed Go-Soy 4910LL 57.0 LOW LOW 43.1 39.4 S S SBCD Warren Seed Micah 4900LL 56.7 LOW LOW-MOD 44.5 40.3 S S SBCD US Seeds Halo 4:94 56.6 LOW LOW-MOD 45.6 42.3 S S SCD Stratton Seed Go-Soy 4912LL 56.1 LOW LOW 49.6 42.4 S MR MSCD Warren Seed Micah 4800LL 56.0 LOW LOW 47.7 40.7 S MS MSCD Progeny 4819LL 55.4 MOD LOW-MOD 34.8 34.8 MS S MRCD Progeny 4928LL 55.4 LOW LOW 46.1 41.0 S S SCDE USG 74G82LL 54.5 MOD LOW 39.0 35.7 MS MS MSDE Hornbeck LL4850 54.0 MOD LOW-MOD 43.6 36.7 MS S SDE US Seeds Halo 4:97 53.9 MOD LOW-MOD 40.9 35.8 S MS SE Warren Seed Micah 4600LL 52.2 LOW LOW-HIGH 45.9 42.5 S R MSE Stratton Seed Go-Soy 4512LL 52.2 LOW LOW-MOD 45.8 43.0 MS S S
Average (bu/a) 55.8 44.5 39.8YLD= Avg. Yield @ 13% moisture.MS= Varieties that have any MS letter in common are not statistically different in yield at the 5% level of probability.County locations include: Dyer, Fayette, Franklin, Fulton KY (1) Amberg Farms, Fulton KY (2) Linder, Gibson, Obion and Shelby.¶ Treated plots at RECM sprayed with Quadris TOP @ 8 oz./Acre + 1% Induce @ R3 growth stage. RECM varieties planted May 28 Disease ratings (of unsprayed plots) for Frogeye and Sudden Death are LOW (0-10% disease), MOD (11-40% disease), HIGH (41-100%)
SCN Greenhouse Ratings compiled by Dr. Pat Donald, Research Plant Path., USDA-ARS, WTREC. Race 2 (HG Type 1.2.5.7), Race 3 (HG Type 7) andRace 5 (HG Type 2.5.7), HS = Highly Susceptible, S = Susceptible, MS = Moderately Susceptible, MR = Moderately Resistant, R = Resistant.
Disease ratings & yield data compiled by Dr. Heather Kelly from replicated plots at the Research and Education Center at Milan (RECM, which has severe disease pressure)
----------------------------- Research and Education Center at Milan ----------------------------
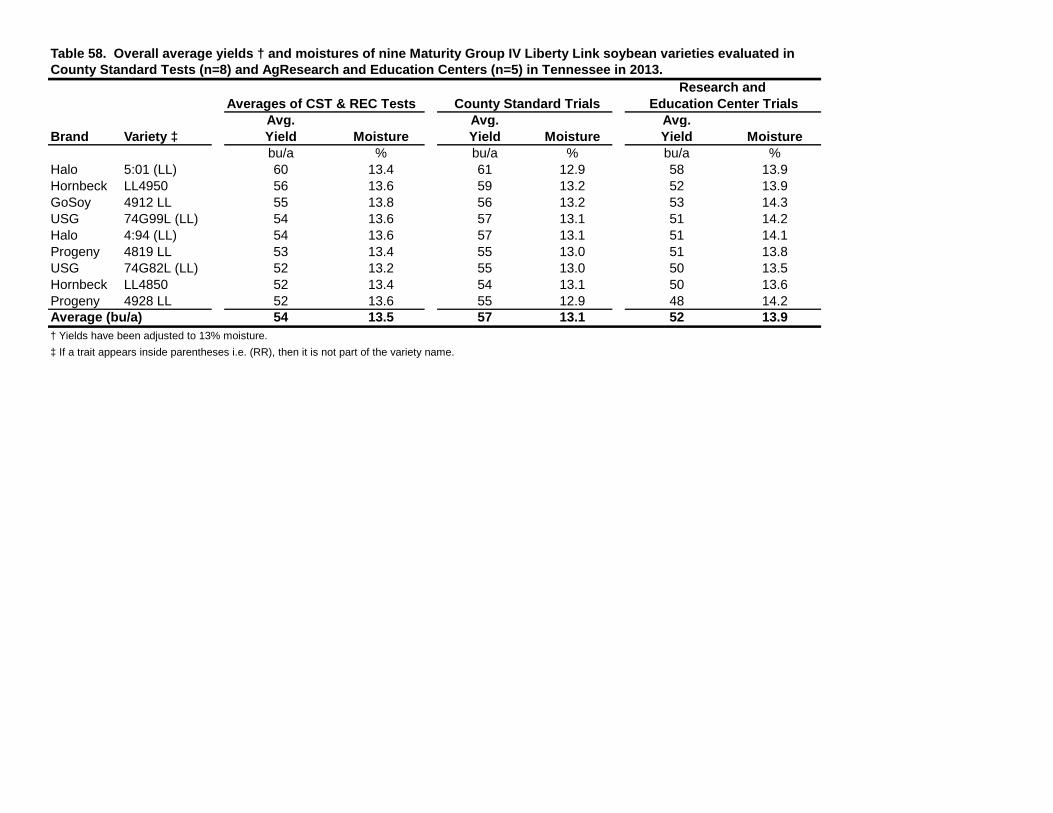
Table 58. Overall average yields † and moistures of nine Maturity Group IV Liberty Link soybean varieties evaluated in County Standard Tests (n=8) and AgResearch and Education Centers (n=5) in Tennessee in 2013.
Research and Averages of CST & REC Tests County Standard Trials Education Center Trials
Avg. Avg. Avg.Brand Variety ‡ Yield Moisture Yield Moisture Yield Moisture
bu/a % bu/a % bu/a %Halo 5:01 (LL) 60 13.4 61 12.9 58 13.9Hornbeck LL4950 56 13.6 59 13.2 52 13.9GoSoy 4912 LL 55 13.8 56 13.2 53 14.3USG 74G99L (LL) 54 13.6 57 13.1 51 14.2Halo 4:94 (LL) 54 13.6 57 13.1 51 14.1Progeny 4819 LL 53 13.4 55 13.0 51 13.8USG 74G82L (LL) 52 13.2 55 13.0 50 13.5Hornbeck LL4850 52 13.4 54 13.1 50 13.6Progeny 4928 LL 52 13.6 55 12.9 48 14.2Average (bu/a) 54 13.5 57 13.1 52 13.9† Yields have been adjusted to 13% moisture.‡ If a trait appears inside parentheses i.e. (RR), then it is not part of the variety name.

Table 59. Mean yields † of 15 Maturity Group V Liberty Link soybean varieties evaluatedin five environments in Tennessee during 2013.
Avg. Yield± Std Err. Springfield Milan
Brand Variety ‡ (n=5) Knoxville Irr. Non-Irr. Irr. Ames -----------------------------------------------bu/a-------------------------------------------------
AGSouth Genetics AGS 533LL 54 ± 1 59 57 59 48 50AGSouth Genetics AGS 5911LL 53 ± 1 63 48 54 68 34Halo 5:01-5 (LL) 53 ± 1 61 53 59 43 49Delta Grow 5481 LL 53 ± 1 58 52 65 39 50Beck's Hybrids EX6315 (LL) 53 ± 1 62 53 65 40 44Progeny 5960 LL 53 ± 1 62 50 58 63 31Halo X530 (LL/STS) 52 ± 1 62 61 60 38 41Halo 5:26 (LL) 52 ± 1 56 54 62 51 38Halo 5:45 (LL) 51 ± 1 61 47 57 59 31Delta Grow 5461 LL 50 ± 1 56 51 55 43 44GoSoy 5410 LL 49 ± 1 54 48 55 48 41Progeny 5460 LL 49 ± 1 54 53 53 42 44Progeny 5160 LL 47 ± 2 54 45 57 55 26GoSoy 5010 LL 45 ± 1 41 44 58 36 44Hornbeck LL5350 44 ± 1 55 46 52 49 20Average (bu/a) 51 57 51 58 48 39L.S.D..05 (bu/a) 4 7 10 8 12 8C.V. (%) 10.7 6.7 11.6 7.9 14.3 13.1† All yields are adjusted to 13% moisture.‡ If a trait appears inside parentheses i.e. (RR), then it is not part of the variety name.

Table 60. Mean yields † and agronomic characteristics of 15 Maturity Group V Liberty Link soybean varieties evaluatedin five environments in Tennessee during 2013.
Avg. Yield Seed± Std Err. Moisture § Lodging Height Maturity Shattering Quality Protein Oil Frogeye
Brand Variety ‡ (n=5) (n=5) (n=4) (n=4) (n=4) (n=3) (n=1) (n=1) (n=1) (n=1)bu/a % Score in. DAP -------- Score -------- % % Score
AGSouth Genetics AGS 533LL 54 ± 1 13.6 1.7 40 140 1.0 1.5 34.2 19.7 2.7AGSouth Genetics AGS 5911LL 53 ± 1 13.4 1.5 33 142 1.0 1.3 35.7 18.5 2Halo 5:01-5 (LL) 53 ± 1 13.4 1.5 40 138 1.0 1.7 34.0 19.9 1.7Delta Grow 5481 LL 53 ± 1 15.3 1.6 38 143 1.0 2.2 35.5 19.1 1.7Beck's Hybrids EX6315 (LL) 53 ± 1 13.7 1.3 36 139 1.0 1.2 34.1 20.0 1.7Progeny 5960 LL 53 ± 1 13.6 1.4 35 143 1.0 1.2 35.7 18.4 2Halo X530 (LL/STS) 52 ± 1 13.3 2.0 49 139 1.0 1.7 34.6 19.6 2.3Halo 5:26 (LL) 52 ± 1 13.2 1.6 32 137 1.0 1.0 35.7 19.2 2.7Halo 5:45 (LL) 51 ± 1 13.7 1.4 32 141 1.0 1.2 35.8 18.5 2Delta Grow 5461 LL 50 ± 1 13.9 1.2 37 138 1.0 1.8 35.4 19.4 1.7GoSoy 5410 LL 49 ± 1 14.0 1.3 39 140 1.0 1.8 35.0 19.6 2Progeny 5460 LL 49 ± 1 13.9 1.3 38 140 1.0 1.3 35.3 19.4 2Progeny 5160 LL 47 ± 2 12.8 1.4 27 140 1.0 1.3 35.2 19.2 2.3GoSoy 5010 LL 45 ± 1 13.9 1.6 32 137 1.1 1.5 36.3 18.5 3Hornbeck LL5350 44 ± 1 13.0 1.5 27 140 1.0 1.0 35.3 19.3 2.7
Average 51 13.6 1.5 36 140 1.0 1.4 35.2 19.2 2.2† All yields are adjusted to 13% moisture. Protein & Oil on dry weight basis.‡ If a trait appears inside parentheses i.e. (RR), then it is not part of the variety name.§ Average moisture at harvestLodging = 1 to 5 scale; where 1 = 95% of plants erect; 2.5 = ~50% of plants leaning at angle ≥ 45°; 5 = 95+% of plants leaning at an angle >45°. Maturity = days after planting (DAP).Shattering = 1 to 5 scale; where 1 = no shattering; 5 = 90+% of pods shattered.Seed Quality = 1 to 5 scale; where 1 = < 5% of seeds showing disease or split seed coats; 5=95+% of seed are diseased or have split seed coats.Disease ratings for Frogeye Leaf Spot are from 1-9, where 0=no disease & 10=maximum amount of plant disease or plant death. Ratings taken 8/26/13 in Knoxville, TN
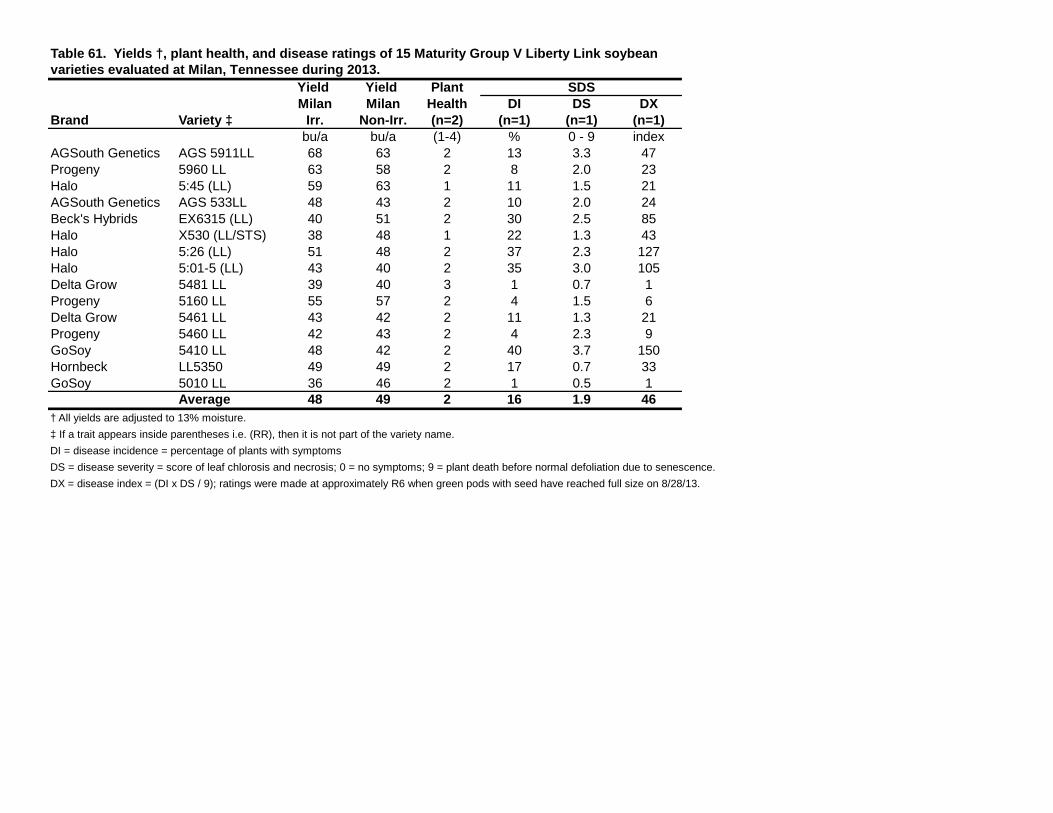
Table 61. Yields †, plant health, and disease ratings of 15 Maturity Group V Liberty Link soybean varieties evaluated at Milan, Tennessee during 2013.
Yield Yield Plant SDSMilan Milan Health DI DS DX
Brand Variety ‡ Irr. Non-Irr. (n=2) (n=1) (n=1) (n=1)bu/a bu/a (1-4) % 0 - 9 index
AGSouth Genetics AGS 5911LL 68 63 2 13 3.3 47Progeny 5960 LL 63 58 2 8 2.0 23Halo 5:45 (LL) 59 63 1 11 1.5 21AGSouth Genetics AGS 533LL 48 43 2 10 2.0 24Beck's Hybrids EX6315 (LL) 40 51 2 30 2.5 85Halo X530 (LL/STS) 38 48 1 22 1.3 43Halo 5:26 (LL) 51 48 2 37 2.3 127Halo 5:01-5 (LL) 43 40 2 35 3.0 105Delta Grow 5481 LL 39 40 3 1 0.7 1Progeny 5160 LL 55 57 2 4 1.5 6Delta Grow 5461 LL 43 42 2 11 1.3 21Progeny 5460 LL 42 43 2 4 2.3 9GoSoy 5410 LL 48 42 2 40 3.7 150Hornbeck LL5350 49 49 2 17 0.7 33GoSoy 5010 LL 36 46 2 1 0.5 1
Average 48 49 2 16 1.9 46† All yields are adjusted to 13% moisture.‡ If a trait appears inside parentheses i.e. (RR), then it is not part of the variety name.DI = disease incidence = percentage of plants with symptomsDS = disease severity = score of leaf chlorosis and necrosis; 0 = no symptoms; 9 = plant death before normal defoliation due to senescence.DX = disease index = (DI x DS / 9); ratings were made at approximately R6 when green pods with seed have reached full size on 8/28/13.

Table 62. Mean yields † of five Maturity Group V Liberty Link soybean varieties evaluated in nineenvironments (n=10) in Tennessee for two years, 2012 - 2013.
Avg. Yield± Std Err. Springfield Milan
Brand Variety ‡ (n=10) Knoxville Irr. Non-Irr. Irr. Ames ----------------------------------------------bu/a------------------------------------------------
Halo 5:26 (LL) 54 ± 1 59 60 51 59 42Halo 5:01-5 (LL) 54 ± 1 62 57 52 53 47Halo 5:45 (LL) 53 ± 1 59 54 48 67 39Progeny 5960 LL 52 ± 1 59 53 48 67 35GoSoy 5410 LL 51 ± 1 56 57 48 53 43Progeny 5460 LL 51 ± 1 56 56 44 53 46Delta Grow 5461 LL 51 ± 1 58 52 48 52 44Progeny 5160 LL 51 ± 1 56 54 45 62 35GoSoy 5010 LL 49 ± 1 49 48 52 49 45Average (bu/a) 52 57 55 48 57 42L.S.D..05 (bu/a) 4 6 10 7 10 7C.V. (%) 10.9 7.6 12.4 9.8 12.5 11.2† All yields are adjusted to 13% moisture.‡ If a trait appears inside parentheses i.e. (RR), then it is not part of the variety name.

Table 63. Mean yields † and agronomic characteristics of nine Maturity Group V Liberty Linksoybean varieties evaluated in five environments (n=10) in Tennessee for two years, 2012 - 2013.
Avg. Yield Seed± Std Err. Moisture § Lodging Height Maturity Shattering Quality Protein Oil
Brand Variety ‡ (n=10) (n=10) (n=8) (n=8) (n=8) (n=6) (n=2) (n=2) (n=2)bu/a % Score in. DAP ------ Score ------- % %
Halo 5:26 (LL) 54 ± 1 12.6 1.5 34 144 1.0 1.3 37.5 21.1Halo 5:01-5 (LL) 54 ± 1 12.9 1.7 43 144 1.0 1.8 35.7 21.7Halo 5:45 (LL) 53 ± 1 13.0 1.4 35 148 1.0 1.3 38.1 20.0Progeny 5960 LL 52 ± 1 13.2 1.4 36 150 1.0 1.5 37.9 20.0GoSoy 5410 LL 51 ± 1 13.2 1.5 41 145 1.0 1.8 36.4 21.4Progeny 5460 LL 51 ± 1 13.2 1.5 41 145 1.0 1.4 36.7 21.1Delta Grow 5461 LL 51 ± 1 13.3 1.5 41 144 1.0 1.8 36.7 21.2Progeny 5160 LL 51 ± 1 12.5 1.5 29 146 1.0 1.6 37.3 20.8GoSoy 5010 LL 49 ± 1 13.2 1.8 37 145 1.0 1.5 38.2 20.5
Average 52 13.0 1.5 37 146 1.0 1.6 37.2 20.9† All yields are adjusted to 13% moisture.‡ If a trait appears inside parentheses i.e. (RR), then it is not part of the variety name.§ Average moisture at harvestLodging = 1 to 5 scale; where 1 = 95% of plants erect; 2.5 = ~50% of plants leaning at angle ≥ 45°; 5 = 95+% of plants leaning at an angle ≥ 45°.Maturity = days after planting (DAP).Shattering = 1 to 5 scale; where 1 = no shattering; 5 = 90+% of pods shattered.Seed Quality = 1 to 5 scale; where 1 = < 5% of seeds showing disease or split seed coats; 5 = 95+% of seed are diseased or have split seed coats.Protein & Oil on dry weight basis.

Table 64. Mean yields † of four Maturity Group V Liberty Link soybean varieties evaluated in four environments (n=12) in Tennessee for three years, 2011 - 2013.
Avg. Yield± Std Err. Milan
Brand Variety ‡ (n=12) Knoxville Irr. Non-Irr. Irr. ----------------------------------------bu/a------------------------------------
Progeny 5960 LL 54 ± 1 55 53 43 67Progeny 5160 LL 52 ± 1 51 55 40 61Delta Grow 5461 LL 50 ± 1 54 53 39 52Progeny 5460 LL 49 ± 1 53 55 37 53Average (bu/a) 51 53 54 40 58L.S.D..05 (bu/a) 4 6 9 7 9C.V. (%) 9.9 7.2 10.8 11.0 10.1† All yields are adjusted to 13% moisture.‡ If a trait appears inside parentheses i.e. (RR), then it is not part of the variety name.
Table 65. Mean yields † and agronomic characteristics of four Maturity Group V Liberty Link soybean varieties evaluatedin four environments (n=12) in Tennessee for three years, 2011 - 2013.
Avg. Yield Seed± Std Err. Moisture § Lodging Height Maturity Shattering Quality Protein Oil
Brand Variety ‡ (n=12) (n=12) (n=12) (n=12) (n=12) (n=9) (n=3) (n=3) (n=3)bu/a % Score in. DAP ------------- Score ------ % %
Progeny 5960 LL 54 ± 1 13.1 1.3 35 149 1.0 1.7 38.7 20.4Progeny 5160 LL 52 ± 1 12.2 1.4 30 146 1.0 1.7 38.2 21.3Delta Grow 5461 LL 50 ± 1 12.9 1.4 40 144 1.0 2.2 37.4 21.6Progeny 5460 LL 49 ± 1 12.9 1.4 40 144 1.0 1.8 37.3 21.6
Average 51 12.8 1.4 36 146 1.0 1.9 37.9 21.2† All yields are adjusted to 13% moisture.‡ If a trait appears inside parentheses i.e. (RR), then it is not part of the variety name.§ Average moisture at harvestLodging = 1 to 5 scale; where 1 = 95% of plants erect; 2.5 = ~50% of plants leaning at angle ≥ 45°; 5 = 95+% of plants leaning at an angle ≥ 45°.Maturity = days after planting (DAP).Shattering = 1 to 5 scale; where 1 = no shattering; 5 = 90+% of pods shattered.Seed Quality = 1 to 5 scale; where 1 = < 5% of seeds showing disease or split seed coats; 5 = 95+% of seed are diseased or have split seed coats.Protein & Oil on dry weight basis.
Springfield

Table 66. Mean yields † of 16 Maturity Group IV Conventional, Liberty Link, and RoundupReady soybean varieties evaluated in four environments in Tennessee during 2013.
Avg. Yield ± Std Err. Springfield MilanBrand Variety ‡ (n=4) Knoxville Irr. Non-Irr. Irr.
USDA-TN JTN-4607 61 ± 2 65 52 64 63Armor X47C 60 ± 2 58 56 54 71Progeny 4510 RY (RR2Y/STS) (CHECK) 59 ± 2 67 53 58 60AR UA4913C 59 ± 2 65 51 62 59Armor 49-C3 (CV4) 58 ± 2 66 50 63 53MO Exp S09-10871 58 ± 2 58 49 61 62Armor X48C 56 ± 2 58 49 52 64MO Exp S09-13608 56 ± 2 56 57 49 62Armor X49C 55 ± 2 54 54 58 56Delta Grow 4967 LL (CHECK) 55 ± 2 57 51 59 53AR UA5213C 53 ± 2 43 58 61 50MO Exp S09-9943 51 ± 2 64 48 47 47TN Exp TN12-4088 51 ± 2 55 38 54 58TN Exp TN10-4045 49 ± 2 53 45 52 43TN Exp TN12-4070 48 ± 2 53 39 57 44TN Exp TN12-4075 48 ± 2 58 36 49 50Average (bu/a) 55 58 49 56 56L.S.D..05 (bu/a) 5 6 11 8 14C.V. (%) 10.9 6.0 13.6 8.8 14.2† All yields are adjusted to 13% moisture.‡ If a trait appears inside parentheses i.e. (LL), then it is not part of the variety name.
--------------------------------bu/a-------------------------------------
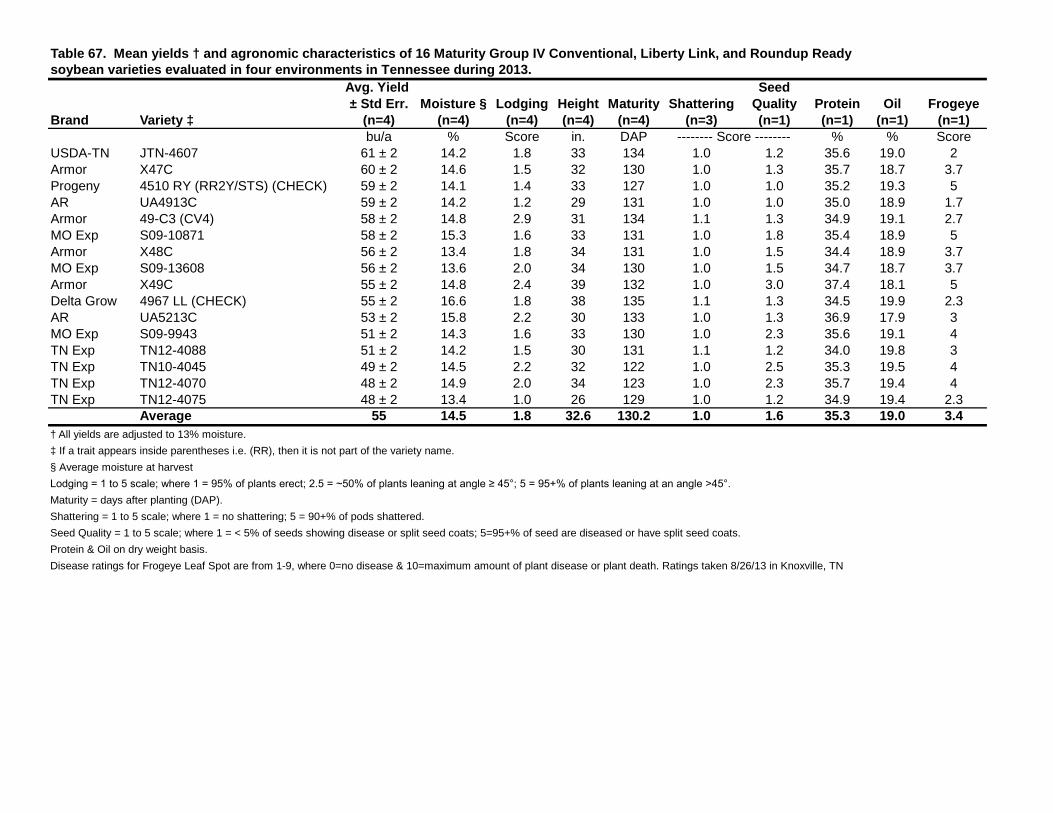
Table 67. Mean yields † and agronomic characteristics of 16 Maturity Group IV Conventional, Liberty Link, and Roundup Readysoybean varieties evaluated in four environments in Tennessee during 2013.
Avg. Yield Seed± Std Err. Moisture § Lodging Height Maturity Shattering Quality Protein Oil Frogeye
Brand Variety ‡ (n=4) (n=4) (n=4) (n=4) (n=4) (n=3) (n=1) (n=1) (n=1) (n=1)bu/a % Score in. DAP -------- Score -------- % % Score
USDA-TN JTN-4607 61 ± 2 14.2 1.8 33 134 1.0 1.2 35.6 19.0 2Armor X47C 60 ± 2 14.6 1.5 32 130 1.0 1.3 35.7 18.7 3.7Progeny 4510 RY (RR2Y/STS) (CHECK) 59 ± 2 14.1 1.4 33 127 1.0 1.0 35.2 19.3 5AR UA4913C 59 ± 2 14.2 1.2 29 131 1.0 1.0 35.0 18.9 1.7Armor 49-C3 (CV4) 58 ± 2 14.8 2.9 31 134 1.1 1.3 34.9 19.1 2.7MO Exp S09-10871 58 ± 2 15.3 1.6 33 131 1.0 1.8 35.4 18.9 5Armor X48C 56 ± 2 13.4 1.8 34 131 1.0 1.5 34.4 18.9 3.7MO Exp S09-13608 56 ± 2 13.6 2.0 34 130 1.0 1.5 34.7 18.7 3.7Armor X49C 55 ± 2 14.8 2.4 39 132 1.0 3.0 37.4 18.1 5Delta Grow 4967 LL (CHECK) 55 ± 2 16.6 1.8 38 135 1.1 1.3 34.5 19.9 2.3AR UA5213C 53 ± 2 15.8 2.2 30 133 1.0 1.3 36.9 17.9 3MO Exp S09-9943 51 ± 2 14.3 1.6 33 130 1.0 2.3 35.6 19.1 4TN Exp TN12-4088 51 ± 2 14.2 1.5 30 131 1.1 1.2 34.0 19.8 3TN Exp TN10-4045 49 ± 2 14.5 2.2 32 122 1.0 2.5 35.3 19.5 4TN Exp TN12-4070 48 ± 2 14.9 2.0 34 123 1.0 2.3 35.7 19.4 4TN Exp TN12-4075 48 ± 2 13.4 1.0 26 129 1.0 1.2 34.9 19.4 2.3
Average 55 14.5 1.8 32.6 130.2 1.0 1.6 35.3 19.0 3.4† All yields are adjusted to 13% moisture.‡ If a trait appears inside parentheses i.e. (RR), then it is not part of the variety name.§ Average moisture at harvestLodging = 1 to 5 scale; where 1 = 95% of plants erect; 2.5 = ~50% of plants leaning at angle ≥ 45°; 5 = 95+% of plants leaning at an angle >45°. Maturity = days after planting (DAP).Shattering = 1 to 5 scale; where 1 = no shattering; 5 = 90+% of pods shattered.Seed Quality = 1 to 5 scale; where 1 = < 5% of seeds showing disease or split seed coats; 5=95+% of seed are diseased or have split seed coats.Protein & Oil on dry weight basis.Disease ratings for Frogeye Leaf Spot are from 1-9, where 0=no disease & 10=maximum amount of plant disease or plant death. Ratings taken 8/26/13 in Knoxville, TN
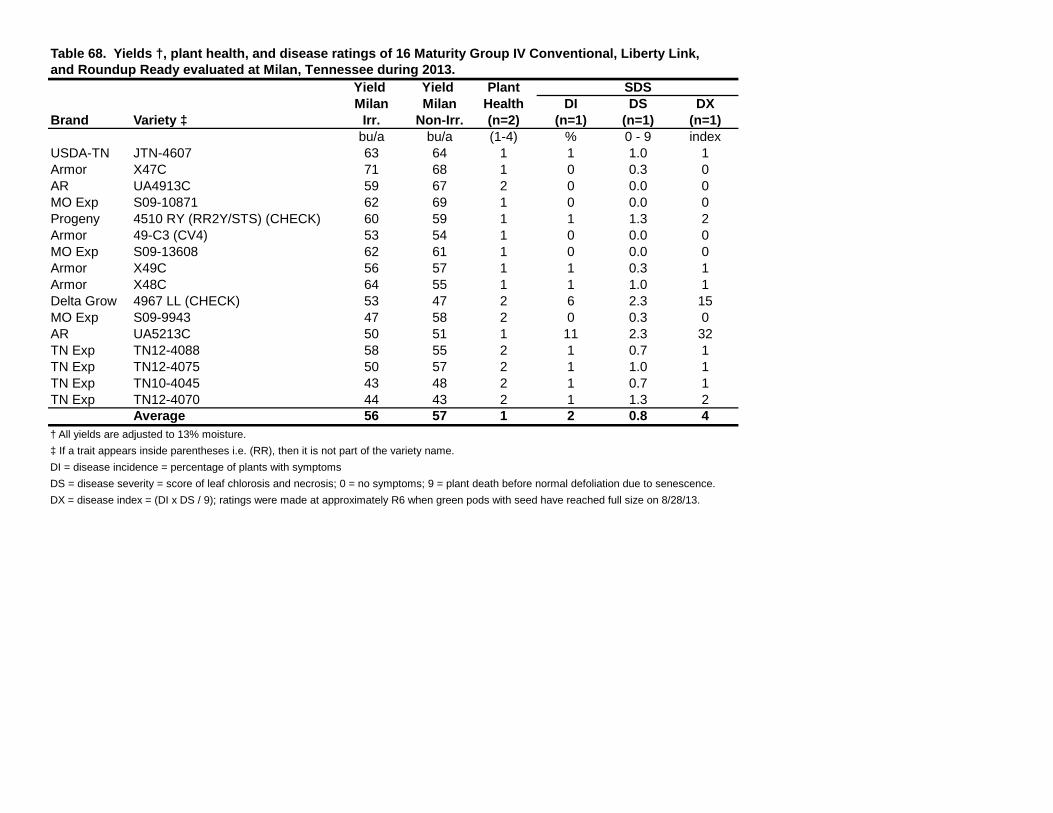
Table 68. Yields †, plant health, and disease ratings of 16 Maturity Group IV Conventional, Liberty Link, and Roundup Ready evaluated at Milan, Tennessee during 2013.
Yield Yield Plant SDSMilan Milan Health DI DS DX
Brand Variety ‡ Irr. Non-Irr. (n=2) (n=1) (n=1) (n=1)bu/a bu/a (1-4) % 0 - 9 index
USDA-TN JTN-4607 63 64 1 1 1.0 1Armor X47C 71 68 1 0 0.3 0AR UA4913C 59 67 2 0 0.0 0MO Exp S09-10871 62 69 1 0 0.0 0Progeny 4510 RY (RR2Y/STS) (CHECK) 60 59 1 1 1.3 2Armor 49-C3 (CV4) 53 54 1 0 0.0 0MO Exp S09-13608 62 61 1 0 0.0 0Armor X49C 56 57 1 1 0.3 1Armor X48C 64 55 1 1 1.0 1Delta Grow 4967 LL (CHECK) 53 47 2 6 2.3 15MO Exp S09-9943 47 58 2 0 0.3 0AR UA5213C 50 51 1 11 2.3 32TN Exp TN12-4088 58 55 2 1 0.7 1TN Exp TN12-4075 50 57 2 1 1.0 1TN Exp TN10-4045 43 48 2 1 0.7 1TN Exp TN12-4070 44 43 2 1 1.3 2
Average 56 57 1 2 0.8 4† All yields are adjusted to 13% moisture.‡ If a trait appears inside parentheses i.e. (RR), then it is not part of the variety name.DI = disease incidence = percentage of plants with symptomsDS = disease severity = score of leaf chlorosis and necrosis; 0 = no symptoms; 9 = plant death before normal defoliation due to senescence.DX = disease index = (DI x DS / 9); ratings were made at approximately R6 when green pods with seed have reached full size on 8/28/13.

Table 69. Mean yields † of two Maturity Group IV Conventional and Roundup Readysoybean varieties evaluated in four environments (n=8) in Tennessee for two years, 2012 - 2013.
Avg. Yield ± Std Err. Springfield MilanBrand Variety ‡ (n=8) Knoxville Irr. Non-Irr. Irr.
Armor 49-C3 (CV4) 58 ± 1 67 56 53 58AR UA5213C 57 ± 1 53 62 45 67Average (bu/a) 58 60 59 49 63L.S.D..05 (bu/a) 5.2 6 13.6 8 12C.V. (%) 11.7 6.7 14.9 10.1 12.8† All yields are adjusted to 13% moisture.‡ If a trait appears inside parentheses i.e. (RR), then it is not part of the variety name.
Table 70. Mean yields † and agronomic characteristics of two Maturity Group IV Conventional and Roundup Readysoybean varieties evaluated in four environments (n=8) in Tennessee for two years, 2012 - 2013.
Avg. Yield Seed± Std Err. Moisture § Lodging Height Maturity Shattering Quality Protein Oil
Brand Variety ‡ (n=8) (n=8) (n=8) (n=8) (n=8) (n=6) (n=2) (n=2) (n=2)bu/a % Score in. DAP ------ Score ------- % %
Armor 49-C3 (CV4) 58 ± 1 14.1 2.5 34 140 1.1 1.7 36.8 20.5AR UA5213C 57 ± 1 15.1 2.0 33 139 1.0 1.3 38.6 19.4
Average 58 14.6 2.3 34 140 1.1 1.5 37.7 20.0† All yields are adjusted to 13% moisture.‡ If a trait appears inside parentheses i.e. (RR), then it is not part of the variety name.§ Average moisture at harvestLodging = 1 to 5 scale; where 1 = 95% of plants erect; 2.5 = ~50% of plants leaning at angle ≥ 45°; 5 = 95+% of plants leaning at an angle ≥ 45°.Maturity = days after planting (DAP).Shattering = 1 to 5 scale; where 1 = no shattering; 5 = 90+% of pods shattered.Seed Quality = 1 to 5 scale; where 1 = < 5% of seeds showing disease or split seed coats; 5 = 95+% of seed are diseased or have split seed coats.Protein & Oil on dry weight basis.
---------------------------------bu/a---------------------------------------

Table 71. Mean yields † of 14 Maturity Group V Conventional, Liberty Link, and RoundupReady soybean varieties evaluated in four environments in Tennessee during 2013.
Avg. Yield± Std Err. Springfield Milan
Brand Variety ‡ (n=4) Knoxville Irr. Non-Irr. Irr.
USDA-TN JTN-5110 64 ± 2 74 50 62 71Asgrow AG5233 (RR2 CHECK) 62 ± 2 70 53 65 60USDA-TN JTN-5203 61 ± 2 74 53 64 54AR R05-374 60 ± 2 61 52 62 63MO Exp S09-13635 58 ± 2 60 60 50 60Asgrow AG5532 (RR CHECK) 57 ± 2 65 52 55 57Midwest Premium Genetics Leland 56 ± 2 66 39 55 65AR UA 5612 55 ± 2 61 51 54 56Progeny 5160 LL (LL CHECK) 54 ± 2 66 41 53 55TN Exp TN12-5015 54 ± 2 65 32 59 57AR Osage 52 ± 2 61 43 54 51AR Ozark 51 ± 2 58 44 49 54TN Exp TN11-5088 51 ± 2 61 30 60 53USDA-TN JTN-4307 49 ± 2 61 37 56 41Average (bu/a) 56 65 46 57 57L.S.D..05 (bu/a) 5 10 11 9 11C.V. (%) 11.0 9.1 14.0 9.6 11.9† All yields are adjusted to 13% moisture.‡ If a trait appears inside parentheses i.e. (RR), then it is not part of the variety name.
-------------------------------------bu/a---------------------------------------

Table 72. Mean yields † and agronomic characteristics of 14 Maturity Group V Conventional, Liberty Link, and Roundup Readysoybean varieties evaluated in four environments in Tennessee during 2013.
Avg. Yield Seed± Std Err. Moisture § Lodging Height Maturity Shattering Quality Protein Oil Frogeye
Brand Variety ‡ (n=4) (n=4) (n=4) (n=4) (n=4) (n=3) (n=1) (n=1) (n=1) (n=1)bu/a % Score in. DAP -------- Score -------- % % Score
USDA-TN JTN-5110 64 ± 2 14.2 1.8 33 138 1.0 1.0 35.7 18.7 2Asgrow AG5233 (RR2 CHECK) 62 ± 2 13.9 1.5 35 137 1.0 2.0 34.6 19.2 4.7USDA-TN JTN-5203 61 ± 2 15.0 1.4 29 139 1.0 1.3 35.8 18.5 1.3AR R05-374 60 ± 2 13.2 2.3 32 140 1.0 1.5 34.8 19.3 3MO Exp S09-13635 58 ± 2 14.5 2.3 41 137 1.0 3.8 37.3 17.9 4.7Asgrow AG5532 (RR CHECK) 57 ± 2 13.7 1.5 34 142 1.1 2.3 35.3 18.8 4.7Midwest Premium Genetics Leland 56 ± 2 14.0 2.6 33 138 1.0 1.0 34.8 18.8 2.3AR UA 5612 55 ± 2 14.1 2.7 33 144 1.0 1.7 35.0 18.6 2Progeny 5160 LL (LL CHECK) 54 ± 2 13.2 1.7 26 140 1.0 1.3 35.1 19.4 2TN Exp TN12-5015 54 ± 2 13.7 1.3 29 136 1.0 1.7 36.7 18.2 2.3AR Osage 52 ± 2 13.7 1.5 28 141 1.0 1.0 38.1 17.9 2.3AR Ozark 51 ± 2 14.8 1.6 31 140 1.0 1.0 34.7 18.8 2TN Exp TN11-5088 51 ± 2 14.1 1.3 32 136 1.0 1.8 36.1 18.5 2.7USDA-TN JTN-4307 49 ± 2 13.6 1.8 31 136 1.0 1.0 35.8 18.9 2
Average 56 14.0 1.8 32 139 1.0 1.6 35.7 18.7 2.7† All yields are adjusted to 13% moisture. Protein & Oil on dry weight basis.‡ If a trait appears inside parentheses i.e. (RR), then it is not part of the variety name.§ Average moisture at harvestLodging = 1 to 5 scale; where 1 = 95% of plants erect; 2.5 = ~50% of plants leaning at angle ≥ 45°; 5 = 95+% of plants leaning at an angle >45°. Maturity = days after planting (DAP).Shattering = 1 to 5 scale; where 1 = no shattering; 5 = 90+% of pods shattered.Seed Quality = 1 to 5 scale; where 1 = < 5% of seeds showing disease or split seed coats; 5=95+% of seed are diseased or have split seed coats.Disease ratings for Frogeye Leaf Spot are from 1-9, where 0=no disease & 10=maximum amount of plant disease or plant death. Ratings taken 8/26/13 in Knoxville, TN

Table 73. Yields †, plant health, and disease ratings of 14 Maturity Group V Conventional, Liberty Link, and Roundup Readyevaluated at Milan, Tennessee during 2013.
Yield Yield Plant SDSMilan Milan Health DI DS DX
Brand Variety ‡ Irr. Non-Irr. (n=2) (n=1) (n=1) (n=1)bu/a bu/a (1-4) % 0 - 9 index
USDA-TN JTN-5110 71 63 2 1 0.7 1Asgrow AG5233 (RR2 CHECK) 60 58 1 1 0.7 1USDA-TN JTN-5203 54 54 2 0 0.0 0AR R05-374 63 57 1 7 2.0 21Midwest Premium Genetics Leland 65 62 2 0 0.7 1MO Exp S09-13635 60 56 1 8 1.7 22Asgrow AG5532 (RR CHECK) 57 52 3 15 2.3 37AR UA 5612 56 51 2 32 3.3 108TN Exp TN12-5015 57 47 2 14 1.7 41TN Exp TN11-5088 53 54 2 4 1.7 8Progeny 5160 LL (LL CHECK) 55 43 2 18 2.0 52AR Ozark 54 48 2 0 0.3 0USDA-TN JTN-4307 41 54 3 1 0.7 1AR Osage 51 41 3 10 2.0 30
Average 57 53 2 8 1.4 23† All yields are adjusted to 13% moisture.‡ If a trait appears inside parentheses i.e. (RR), then it is not part of the variety name.DI = disease incidence = percentage of plants with symptomsDS = disease severity = score of leaf chlorosis and necrosis; 0 = no symptoms; 9 = plant death before normal defoliation due to senescence.DX = disease index = (DI x DS / 9); ratings were made at approximately R6 when green pods with seed have reached full size on 8/28/13.

Table 74. Mean yields † of 11 Maturity Group V Conventional and Roundup Ready soybean varieties evaluated in four environments (n=8) in Tennessee for two years, 2012 - 2013.
Avg. Yield± Std Err. Springfield Milan
Brand Variety ‡ (n=8) Knoxville Irr. Non-Irr. Irr.-----------------------------------------bu/a-------------------------------------------
USDA-TN JTN-5203 62 ± 1 71 63 53 61USDA-TN JTN-5110 61 ± 1 71 57 50 66AR Osage 58 ± 1 63 57 48 62AR UA 5612 57 ± 1 62 58 48 61AR Ozark 55 ± 1 59 52 44 63USDA-TN JTN-4307 51 ± 1 61 44 49 51Average (bu/a) 57 65 55 49 61L.S.D..05 (bu/a) 5 7 12 8 11C.V. (%) 10.8 7.3 13.8 11.2 10.6† All yields are adjusted to 13% moisture.‡ If a trait appears inside parentheses i.e. (RR), then it is not part of the variety name.

Table 75. Mean yields † and agronomic characteristics of six Maturity Group V Conventional and Roundup Readysoybean varieties evaluated in four environments (n=8) in Tennessee for two years, 2012 - 2013.
Avg. Yield Seed± Std Err. Moisture § Lodging Height Maturity Shattering Quality Protein Oil
Brand Variety ‡ (n=8) (n=8) (n=8) (n=8) (n=8) (n=6) (n=2) (n=2) (n=2)bu/a % Score in. DAP ------- Score ------- % %
USDA-TN JTN-5203 62 ± 1 13.7 1.6 32 147 1.0 1.5 37.7 20.2USDA-TN JTN-5110 61 ± 1 13.6 2.0 34 146 1.0 1.5 38.3 20.6AR Osage 58 ± 1 12.8 1.6 30 148 1.0 1.5 40.7 20.3AR UA 5612 57 ± 1 13.2 2.5 35 151 1.0 1.6 37.0 20.2AR Ozark 55 ± 1 14.8 1.7 33 147 1.0 1.1 36.7 20.5USDA-TN JTN-4307 51 ± 1 13.1 1.9 34 144 1.0 1.2 38.0 20.4
Average 57 13.5 1.9 33 147 1.0 1.4 38.1 20.4† All yields are adjusted to 13% moisture.‡ If a trait appears inside parentheses i.e. (RR), then it is not part of the variety name.§ Average moisture at harvestLodging = 1 to 5 scale; where 1 = 95% of plants erect; 2.5 = ~50% of plants leaning at angle ≥ 45°; 5 = 95+% of plants leaning at an angle ≥ 45°.Maturity = days after planting (DAP).Shattering = 1 to 5 scale; where 1 = no shattering; 5 = 90+% of pods shattered.Seed Quality = 1 to 5 scale; where 1 = < 5% of seeds showing disease or split seed coats; 5 = 95+% of seed are diseased or have split seed coats.Protein & Oil on dry weight basis.

Table 76. Mean yields † of five Maturity Group V Conventional soybean varieties and oneRoundup Ready check evaluated in four environments (n=12) in Tennessee for three years, 2011 - 2013.
Avg. Yield± Std Err. Milan
Brand Variety ‡ (n=12) Knoxville Irr. Non-Irr. Irr.
USDA-TN JTN-5203 56 ± 1 61 58 43 63AR Osage 55 ± 1 58 57 42 63USDA-TN JTN-5110 55 ± 1 61 54 42 63AR UA 5612 55 ± 1 58 56 44 61AR Ozark 52 ± 1 55 55 38 62Average (bu/a) 55 59 56 42 62L.S.D..05 (bu/a) 4 6 10 7 9C.V. (%) 10.2 7.2 12.0 11.8 9.5† All yields are adjusted to 13% moisture.‡ If a trait appears inside parentheses i.e. (RR), then it is not part of the variety name.
Table 77. Mean yields † and agronomic characteristics of five Maturity Group V Conventional soybean varieties andone Roundup Ready check evaluated in four environments (n=12) in Tennessee for three years, 2011 - 2013.
Avg. Yield Seed± Std Err. Moisture § Lodging Height Maturity Shattering Quality Protein Oil
Brand Variety ‡ (n=12) (n=12) (n=12) (n=12) (n=12) (n=6) (n=3) (n=3) (n=3)bu/a % Score in. DAP ------------- Score ------ % %
USDA-TN JTN-5203 56 ± 1 13.3 1.5 33 146 1.0 1.7 38.8 20.3AR Osage 55 ± 1 12.5 1.4 31 147 1.0 1.8 41.6 20.4USDA-TN JTN-5110 55 ± 1 13.2 1.8 35 146 1.0 1.6 39.0 20.8AR UA 5612 55 ± 1 12.9 2.2 37 149 1.0 1.8 38.2 20.4AR Ozark 52 ± 1 14.0 1.7 34 146 1.0 1.6 37.6 20.8
Average 55 13.2 1.7 34 147 1.0 1.7 39.0 20.5† All yields are adjusted to 13% moisture. § Average moisture at harvest Maturity = days after planting (DAP).‡ If a trait appears inside parentheses i.e. (RR), then it is not part of the variety name.Lodging = 1 to 5 scale; where 1 = 95% of plants erect; 2.5 = ~50% of plants leaning at angle ≥ 45°; 5 = 95+% of plants leaning at an angle ≥ 45°.Shattering = 1 to 5 scale; where 1 = no shattering; 5 = 90+% of pods shattered.Seed Quality = 1 to 5 scale; where 1 = < 5% of seeds showing disease or split seed coats; 5 = 95+% of seed are diseased or have split seed coats.Protein & Oil on dry weight basis.
Springfield
------------------------------------bu/a---------------------------------

Table 78. Characteristics of soybean varieties evaluated in Tennessee during 2013, as provided by the seed company.2013 Relative Herbicide SCN Stem Flower Pubescence Seed
Brand Variety ‡ Test Maturity Tolerance Resistance Canker SDS Frogeye Color Color TreatmentAgBorn Genetics LLC ABx0448 (RR) RR4E 4.1 RR MR3 R MR MS P LT Innoculant, 2 fungicides, ins.AgBorn Genetics LLC ABx2105 (RR) RR4L 4.9 RR S S NR S P G Innoculant, 2 fungicides, ins.AgBorn Genetics LLC ABx2164 (RR) RR4L 4.6 RR S S NR S P T Innoculant, 2 fungicides, ins.AgBorn Genetics LLC ABx2193 (RR) RR3 3.9 RR S NR S NR P T Innoculant, 2 fungicides, ins.AgBorn Genetics LLC ABx57318 (RR/STS) RR4L 4.6 RR,STS MR3 MR NR MS W LT Innoculant, 2 fungicides, ins.AgBorn Genetics LLC ABx71141 (RR) RR4E 4.1 RR MR2,3,5 R MR MS W LT Innoculant, 2 fungicides, ins.AgBorn Genetics LLC ABx7648 (RR) RR3 3.8 RR MR3 R MR S P LT Innoculant, 2 fungicides, ins.AGSouth Genetics AGS 43R212 (RR2Y) RR4E 4.3 RR2Y 3 R MR R W T ApronMaxx/CruiserAGSouth Genetics AGS 45R212 (RR2Y) RR4E 4.5 RR2Y 3 R MR MR W T ApronMaxx/CruiserAGSouth Genetics AGS 47R212 (RR) RR4L 4.7 RR1 3 R MR MR P LT ApronMaxx/CruiserAGSouth Genetics AGS 533LL LL5 5.3 LLAGSouth Genetics AGS 5911LL LL5 5.9 LLAR Osage CV5 5.6 R R R P G Apron MaxxAR Ozark CV5 5.2 3 R R R P G Apron MaxxAR R04-1250RR RR5E 5.5 RR P G Apron-MaxxAR R04-1268RR RR5E 5.4 RR W G Apron MaxxAR R05-374 CV5 5.1 W G Apron-MaxxAR UA 5612 CV5 5.6 R P G Apron MaxxAR UA4913C CV4 4.9 P T Apron-MaxxAR UA5213C CV4 4.9 P G Apron MaxxArmor 39-R16 (RR/STS) RR3 3.9 RR2Y/STS MR MR P G ApronMaxx/CruiserArmor 44-R08 (RR2Y) RR4E 4.4 RR2Y M MR M P G ApronMaxx/CruiserArmor 45-R60 (RR2Y/STS) RR4E 4.4 RR2Y/STS M R P G ApronMaxx/CruiserArmor 47-R13 (RR2Y/STS) RR4L 4.8 RR2Y/STS R MR MR P G ApronMaxx/CruiserArmor 48-R66 (RR2/STS) RR4L 4.8 RR2/STS ApronMaxx/CruiserArmor 48-R91 (RR2Y/STS) RR4L 4.7 RR2Y/STS R M MR P LT ApronMaxx/CruiserArmor 49-C3 (CV4) CV4 4.9 MR R R W T ApronMaxx/CruiserArmor 49-R56 (RR2Y) RR4L 4.9 RR2Y MR MR MR P LT ApronMaxx/CruiserArmor 53-R16 (RR2Y) RR5E 5.4 RR2Y R M M P G ApronMaxx/CruiserArmor 53-R88 (RR2Y/STS) RR5E 5.4 RR2Y/STS R MR M P G ApronMaxx/CruiserArmor 55-R22 (RR2Y) RR5E 5.5 RR2Y R MR MR P G ApronMaxx/CruiserArmor X1401 (RR2) RR4E 4.2 RR2 ApronMaxx/CruiserArmor X1406 (RR2/STS) RR4L 4.6 RR2/STS ApronMaxx/CruiserArmor X1409 (RR2) RR4L 4.9 RR2 ApronMaxx/CruiserArmor X1410 (RR2) RR5E 5.0 RR2 ApronMaxx/CruiserArmor X1413 (RR2) RR5E 5.1 RR2 ApronMaxx/CruiserArmor X1414 (RR2) RR5E 5.3 RR2 ApronMaxx/CruiserArmor X47C (STS) CV4 4.8 STS Allegiance, Cruiser, MaximArmor X48C (STS) CV4 4.8 STS Allegiance, Cruiser, MaximArmor X49C CV4 4.9 STS Allegiance, Cruiser, MaximAsgrow AG4232 GENRR2Y (STS) RR4E 4.2 RR2Y/STS R3 R S MR P LT AcceleronAsgrow AG4433 GENRR2Y RR4E 4.4 RR2Y 3 R MR S LT AcceleronAsgrow AG4534 (RR2Y/STS) RR4E 4.5 RR2YLD/STS MR3 MS MS MS T Acceleron IAsgrow AG4632 GENRR2Y (STS) RR4L 4.6 RR2Y/STS MR3 R S R P LT AcceleronAsgrow AG4633 GENRR2Y RR4L 4.6 RR2Y 3 R MS MS LT AcceleronAsgrow AG4832 GENRR2Y (STS) RR4L 4.8 RR2Y/STS 3 MS S MS P LT AcceleronAsgrow AG4933 GENRR2Y RR4L 4.9 RR2Y 3 R R S G Acceleron

Table 78 (continued)2013 Relative Herbicide SCN Stem Flower Pubescence Seed
Brand Variety ‡ Test Maturity Tolerance Resistance Canker SDS Frogeye Color Color TreatmentAsgrow AG4934 (RR2Y/STS) RR4L 4.9 RR2YLD/STS MR3 R MS P LT Acceleron IAsgrow AG5233 (RR2 CHECK) CV5 5.2 RR2Y/STS 3 R R S LT AcceleronAsgrow AG5233 GENRR2Y (STS) RR5E 5.2 RR2Y/STS 3 R R S LT AcceleronAsgrow AG5332 GENRR2Y RR5E 5.3 RR2Y R3 R S R P T AcceleronAsgrow AG5532 (RR CHECK) CV5 5.5 RR2Y/STS S MS S S W G AcceleronAsgrow AG5532 GENRR2Y (STS) RR5E 5.5 RR2Y/STS S MS S S W G AcceleronAsgrow AG5534 (RR2Y) RR5E 5.5 RR2YLD S MS R T Acceleron IAsgrow AG5632 GENRR2Y (STS) RR5L 5.6 RR2Y/STS R3 R MS S W G AcceleronAsgrow AG5633 GENRR2Y RR5L 5.6 RR2Y S R MS MS T AcceleronAsgrow AG5634 (RR2Y) RR5L 5.6 RR2YLD 2,3 MS MR P T Acceleron IBeck's Hybrids 418NR (RR) RR4E 4.1 RR R 3, MR 14 EscalateBeck's Hybrids 423NL (LL) LL4 4.2 LL R3, MR 14 EscalateBeck's Hybrids 444NR (RR) RR4E 4.4 RR R 3, MR 14 EscalateBeck's Hybrids 477NR (RR) RR4L 4.7 RR R3, MR14 MR MR MR P T EscalateBeck's Hybrids 483NL (LL) LL4 4.8 LL R 3, MR 14 EscalateBeck's Hybrids EX6160 (RR) RR5E 5.1 RR R3, MR 14 EscalateBeck's Hybrids EX6315 (LL) LL5 5.2 LL R3, MR 14 Escalate
Caverndale Farms 466 RR2Yn RR4L 4.6 RR2Y 1c R MR NA P LTFluidioxonil, metalaxyl, imidacloprid
Caverndale Farms 469 LL/STSn LL4 4.6 LL/STS NA NA NA NA P GFluidioxonil, metalaxyl, imidacloprid
Caverndale Farms 486 RR2Y/STSn RR4L 4.8 RR2Y/STS 3, 14 R R R W TRanconna,Metaxyl, Macho 600, Optomize 400
Caverndale Farms 496 RR2Yn RR4L 4.9 RR2Y 1c,1.9 R R MR P LTFluidioxonil, metalaxyl, imidacloprid
Croplan R2C 4752 S RR4L 4.7 RR/STS R3 MR14 R R R P GCroplan R2C 4873 S RR4L 4.8 RR/STS MR R S W TCroplan R2C 5482 RR5E 5.4 RR warden, nitroshieldCroplan RT 47995 (RR) RR4E 4.7 RR warden, nitroshieldDelta Grow 4670 R2Y RR4L 4.6 RR2Y 3,14 R M R P T Cruiser MaxxDelta Grow 4755 R2Y RR4L 4.7 RR2Y 3, 14 MR R R P T Cruiser MaxxDelta Grow 4765 R2Y RR4L 4.7 RR2Y 3, 14 R R R W T Cruiser MaxxDelta Grow 4825 R2Y/STS RR4L 4.8 RR2Y 3, 14 R MR S W T Cruiser MaxxDelta Grow 4867 LL LL4 4.8 LL 3, 14 R W T Cruiser MaxxDelta Grow 4880 RR RR4L 4.8 RR 3, 9, 14 R R P T Cruiser MaxxDelta Grow 4925 R2Y RR4L 4.9 RR2Y 3, 14 R MR MR P T Cruiser MaxxDelta Grow 4940 RR RR4L 4.9 RR 1,2,3,5,14 MR MR MR P T Cruiser MaxxDelta Grow 4967 LL LL4 4.9 LL 3 R W T Cruiser MaxxDelta Grow 4970 RR RR4L 4.9 RR 3, 14 R R R P T Cruiser MaxxDelta Grow 4981 LL/STS LL4 4.9 LL/STS 3 MR MR MR W T Cruiser MaxxDelta Grow 4990 LL LL4 4.9 LL 3, 14 R R R P G Cruiser MaxxDelta Grow 5130 RR2 RR5E 5.1 RR2 3.14 R R R P T Cruiser MaxxDelta Grow 5461 LL LL5 5.4 LL 3, 14 R R R P T Cruiser MaxxDelta Grow 5481 LL LL5 5.4 LL 3 MR MR MR P G Cruiser MaxxDelta Grow 5625 RR2 RR5L 5.6 RR2 3,14 MR MR MR P T Cruiser MaxxDyna-Gro 31RY45 (RR2Y) RR4E 4.5 RR2Y 3,14 R MS R P LT AcceleronDyna-Gro 32RY55 (RR2Y) RR5E 5.5 RR2Y 3, 14 R MR MR P G AcceleronDyna-Gro 39RY43 (RR2Y) RR4E 4.3 RR2Y 3,14 S MR MS P G Acceleron/Imidacloprid

Table 78 (continued)2013 Relative Herbicide SCN Stem Flower Pubescence Seed
Brand Variety ‡ Test Maturity Tolerance Resistance Canker SDS Frogeye Color Color TreatmentDyna-Gro S38RY84 (RR2Y) RR3 3.8 RR2Y R3,MR14 W LT Acceleron/ImidaclopridDyna-Gro S44RS93 (RR2Y/STS) RR4E 4.4 RR2Y/STS 3, 14 MR MR R P G Acceleron/ImidaclopridDyna-Gro S47RY13 (RR2Y) RR4L 4.7 RR2Y 3, 14 MR MR MR P LT Acceleron/ImidaclopridDyna-Gro S48RS53 (RR2Y/STS) RR4L 4.8 RR2Y/STS 3, 14 R MR MR P G Acceleron/ImidaclopridDyna-Gro S49LL34 (LL) LL4 4.9 LL R3,MR14 P G Acceleron/ImidaclopridDyna-Gro S53RY23 (RR2Y) RR5E 5.3 RR2Y R3,MR14 P G Acceleron/ImidaclopridDyna-Gro S54RY43 (RR2Y) RR5E 5.4 RR2Y 3, 14 R MR MR W G Acceleron/ImidaclopridDyna-Gro SX 13246L (LL) LL4 4.6 LL R3,MR14 W G Acceleron/ImidaclopridDyna-Gro SX 13346R (RR2Y) RR4L 4.6 RR2Y R3,MR14 P LT Acceleron/ImidaclopridGoSoy 4411 LL LL4 4.4 LL 3 MR MR MR P LT Cruiser MaxxGoSoy 4711 LL LL4 4.7 LL 3 MR MR P G Cruiser MaxxGoSoy 4812 LL LL4 4.8 LL 3 MR W T Cruiser MaxxGoSoy 4912 LL LL4 4.9 LL MS MR W G Cruiser MaxxGoSoy 5010 LL LL5 5.0 LL 3 MR MR MR P G Cruiser MaxxGoSoy 5410 LL LL5 5.4 LL 3 MR MR MR P G Cruiser MaxxHalo 4:40 (LL) LL4 4.2 LL ApronMaxx/CruiserHalo 4:65 (LL) LL4 4.6 LL MR 3 R MR R P LT ApronMaxx/CruiserHalo 4:94 (LL) LL4 4.9 LL MR 3 R MR MR P G ApronMaxx/CruiserHalo 4:95 (LL) LL4 4.8 LL ApronMaxx/CruiserHalo 5:01 (LL) LL4 4.9 LL ApronMaxx/CruiserHalo 5:01-5 (LL) LL5 5.0 LL ApronMaxx/CruiserHalo 5:26 (LL) LL5 5.1 LL ApronMaxx/CruiserHalo 5:45 (LL) LL5 5.4 LL ApronMaxx/CruiserHalo X466 (LL) LL4 4.6 LL ApronMaxx/CruiserHalo X477 (LL/STS) LL4 4.7 LL/STS ApronMaxx/CruiserHalo X496 (LL) LL4 4.9 LL ApronMaxx/CruiserHalo X530 (LL/STS) LL5 5.3 LL/STS ApronMaxx/CruiserHornbeck HBK RY 4620 (RR2Y/STS) RR4L 4.6 RR2Y/STS MS R P LT Trilex 2000, Poncho VotivoHornbeck HBK RY 4721 (RR2Y) RR4L 4.7 RR2Y R MR R P LT Trilex 2000, Poncho VotivoHornbeck HBK RY 5221 (RR2Y) RR5E 5.2 RR2Y R 3 R R P G Trilex 2000, Poncho VotivoHornbeck HBK RY 5421 (RR2Y) RR5E 5.4 RR2Y MR 3 R R P G Trilex 2000, Poncho VotivoHornbeck LL4850 LL4 4.8 LL 1.5 Race 3 3.5 1.8 NA W T Poncho/Votivo + Trilex 2000Hornbeck LL4950 LL4 4.9 LL 1.5 Race 3 NA 1.9 NA W G Poncho/Votivo + Trilex 2000Hornbeck LL5350 LL5 5.3 LL 1.5 Race 3 1.5 1.5 1.4 W T Poncho/Votivo + Trilex 2000
LG Seeds C4544R2 RR4E 4.5 RR2 3,14 R MR R P LTPoncho/Votivo, metalaxyl, fluxapyroxad, pyraclostrobin
LG Seeds C4625 R2 RR4L 4.6 RR2Y MR R S P LTPoncho/Votivo, metalaxyl, fluxapyroxad, pyraclostrobin
LG Seeds C4780R2 RR4L 4.7 RR2/STS 3,14 R R R P GPoncho/Votivo, metalaxyl, fluxapyroxad, pyraclostrobin
LG Seeds C4867R2 RR4L 4.8 RR2/STS 3,14 MR R MR W LTPoncho/Votivo, metalaxyl, fluxapyroxad, pyraclostrobin
LG Seeds C5122R2 RR5E 5.1 RR2 3 R R MR P LTPoncho/Votivo, metalaxyl, fluxapyroxad, pyraclostrobin
Midwest Premium Genetics Leland CV5 5.1 1,2,3,5,14 MR MR R W T Cruiser MaxxMidwest Premium Genetics MPG4714 (RR) RR4L 4.7 RR 3 R MR MS P T Cruiser MaxxMidwest Premium Genetics MPG5113 (RR) RR5E 5.1 RR R R W G Cruiser MaxxMidwest Premium Genetics MPG5214NRR RR5E 5.2 RR 1,2,3,5,14 MR MR MR P T Cruiser Maxx

Table 78 (continued)2013 Relative Herbicide SCN Stem Flower Pubescence Seed
Brand Variety ‡ Test Maturity Tolerance Resistance Canker SDS Frogeye Color Color TreatmentMO Exp S09-10871 CV4 4.8 MS R MR S W LT Trilex+GauchoMO Exp S09-13608 CV4 4.8 MS R MR S W G Trilex+GauchoMO Exp S09-13635 CV5 5.0 MS R MR S W G Trilex+GauchoMO Exp S09-6201R RR5E 5.1 RR MS R MR R W G Trilex+GauchoMO Exp S09-9943 CV4 4.6 MS R MR S W LT Trilex+GauchoMorsoy RT 5429 (RR) RR5E 5.4 RR R MR W T Cruiser MaxxMorsoy Xtra 49X14 (RR) RR4L 4.9 RRMorsoy Xtra 53X82 (RR2) RR5E 5.3 R2 UNK UNK UNK UNK W TN Cruiser MaxxMorsoy Xtra R2 44X82 RR4E 4.4 RR2Y R 3, MR 14 R R MR P T ApronMaxx/CruiserMorsoy Xtra R2 46X29 (STS) RR4L 4.6 RR2Y/STS MS R MR P T ApronMaxx/CruiserMorsoy Xtra R2 47X12 (STS) RR4L 4.7 RR2Y/STS R 3, MR 14 R MR R P G ApronMaxx/CruiserMorsoy Xtra R2 48X02 RR4L 4.8 RR2Y R 3, MR 14 MR MR MR P T ApronMaxx/CruiserMycogen 5N423R2 (STS) RR4E 4.2 RR,STS 3,14 R R R P G Cruiser MaxxMycogen 5N431R2 RR4E 4.3 RR 3,14 R R P G Cruiser MaxxMycogen 5N451R2 RR4E 4.5 RR2Y 3, 14 S MR G Cruiser MaxxMycogen 5N478R2 RR4L 4.7 RR2Y 3, 14 S R T Cruiser MaxxNK S 41-J6 (RR2Y) RR4E 4.1 RR2Y M MR Cruiser MaxxNK S 46-L2 (RR2Y) RR4L 4.6 RR2Y 3,MR14 R MED MED Mefenoxam, Fludioxonil, NK S 47-N3 (RR2Y) RR4L 4.7 RR2Y 3,MR14 MED MED MED Mefenoxam, Fludioxonil, NK S 48-P4 (RR2Y/STS) RR4L 4.8 RR2Y,STS 3,MR14 N/A MED N/A P LT T Mefenoxam, Fludioxonil, NK S 52-Y2 (RR2Y) RR5E 5.2 RR2Y 3,MR14 R MED S Mefenoxam, Fludioxonil, NK S 54-V4 (RR/STS) RR5E 5.4 RR/STS 3 MED MED GOOD P G Mefenoxam, Fludioxonil, Progeny 4211 RY (RR2Y) RR4E 4.2 RR2Y MR MR P G Poncho, VotivoProgeny 4313 RY RR4E 4.3 R2Y R MR MS MS P LT Poncho/Votivo/Trilex2000Progeny 4510 RY (RR2Y/STS) RR4E 4.5 RR2Y/STS MS R S P LT Poncho, VotivoProgeny 4560 LL LL4 4.5 LL MR MR MR P LT Poncho/Votivo/Trilex2000Progeny 4613 RY RR4L 4.6 R2Y/STS R R MR W G Poncho/Votivo/Trilex2000Progeny 4710 RY (RR2Y/STS) RR4L 4.7 RR2Y/STS MS MS MR P LT Poncho, VotivoProgeny 4747 RY (RR2Y) RR4L 4.7 RR2Y MR MR MR P LT Poncho, VotivoProgeny 4819 LL LL4 4.8 LL MR W T Poncho, VotivoProgeny 4850 RY RR4L 4.8 R2Y R-3, MR-14 R MR MR P G Poncho/Votivo/Trilex2000Progeny 4900 RY (RR2Y) RR4L 4.9 RR2Y MR MR MR P LT Poncho, VotivoProgeny 4928 LL LL4 4.9 LL MR3 R MR P G Poncho, VotivoProgeny 4930 LL LL4 4.9 LL MR P G Poncho/Votivo/Trilex2000Progeny 5111 RY (RR2Y) RR5E 5.1 RR2Y 3 MS MS MR W G Poncho, VotivoProgeny 5160 LL LL5 5.1 LL MR MR MR W T Poncho, VotivoProgeny 5160 LL (LL CHECK) CV5 5.1 LL MR MR MR W T Poncho, VotivoProgeny 5210 RY (RR2Y) RR5E 5.2 RR2Y R3, MR14 R MS MR P G Poncho, VotivoProgeny 5213 RY RR5E 5.2 R2Y R-3 R MR MR P LT Poncho/Votivo/Trilex2000Progeny 5333 RY RR5E 5.3 R2Y R3 R MR MR W G Poncho/Votivo/Trilex2000Progeny 5460 LL LL5 5.4 LL MR MS MR P LT Poncho, VotivoProgeny 5555 RY RR5E 5.5 R2Y R-3 MR MR MR P LT Poncho/Votivo/Trilex2000Progeny 5610 RY (RR2Y) RR5L 5.6 RR2Y R3, MR14 MS P G Poncho, VotivoProgeny 5711 RY (RR2Y) RR5L 5.7 RR2Y MS MS P T Poncho, VotivoProgeny 5960 LL LL5 5.9 LL MR MR MR W G Poncho, VotivoSchillinger Seed 458 RCS RR4E 4.5 RR/STS R 3 R MS R W LT Cruiser MaxxSchillinger Seed 4712R2 RR4L 4.7 RR2 3 W T Cruiser MaxxSchillinger Seed 495 RC RR4L 4.9 RR 3,14 R S R P LT Cruiser Maxx

Table 78 (continued)2013 Relative Herbicide SCN Stem Flower Pubescence Seed
Brand Variety ‡ Test Maturity Tolerance Resistance Canker SDS Frogeye Color Color TreatmentSchillinger Seed 4990 RC RR4L 4.9 RR 3, 14 R MR MR P LT Cruiser MaxxSchillinger Seed 5220 RC RR5E 5.2 RR 3, 14 R W LT Cruiser MaxxSteyer 4203 R2 (RR2Y) RR4E 4.2 RR2Y 3, 14 S S S G Rancona, MetastarSteyer 4203 R2 (RR2Y) (4E CHECK) RR3 4.2 RR2Y 3, 14 S S S G Rancona, Metastar
Steyer 4401R2 RR4E 4.4 RR,STS 3,14 R S R P GMaxim, Apron, Vibrance, Cruiser
Steyer 4501 R2 (RR2Y) RR4E 4.5 RR2Y 3, 14 S R S P LT Rancona, MetastarSteyer 4702 R2 (RR2Y) RR4L 4.7 RR2Y 3, 14 R R R LT Rancona, MetastarSteyer 4802 R2 (RR2Y/STS) RR4L 4.8 RR2Y/STS 3, 14 R R S LT Rancona, Metastar
Steyer 5101R2 RR5E 5.1 RR 3,14 R R R P LTMaxim, Apron, Vibrance, Cruiser
Terral-REV Brand 38R10 (RR) RR3 3.8 RR 7 R R P T Cruiser MaxxTerral-REV Brand 46R64 (RR) RR4L 4.6 RR Cruiser MaxxTerral-REV Brand 46R73 (RR) RR4L 4.6 RR R W T Cruiser MaxxTerral-REV Brand 47R34 (RR) RR4L 4.7 RR Cruiser MaxxTerral-REV Brand 47R53 (RR) RR4L 4.7 RR 3, 14 R S R P T Cruiser MaxxTerral-REV Brand 48R22 (RR) RR4L 4.8 RR 3, 14 R S W T Cruiser MaxxTerral-REV Brand 48R33 (RR) RR4L 4.8 RR 3, 14 R P T Cruiser MaxxTerral-REV Brand 48R44 (RR) RR4L 4.8 RR Cruiser MaxxTerral-REV Brand 49R22 (RR) RR4L 4.9 RR 3, 14 R P T Cruiser MaxxTerral-REV Brand 49R94 (RR) RR4L 4.9 RR Cruiser MaxxTerral-REV Brand 51R53 (RR) RR5E 5.1 RR 3, 14 R R S P T Cruiser MaxxTerral-REV Brand 52R74 (RR) RR5E 5.2 RR R R T Cruiser MaxxTerral-REV Brand 53R23 (RR) RR5E 5.3 RR R R T Cruiser MaxxTerral-REV Brand 54R84 (RR) RR5E 5.4 RR R T Cruiser MaxxTerral-REV Brand 55R53 (RR) RR5E 5.5 RR R R T Cruiser MaxxTerral-REV Brand 56R63 (RR) RR5L 5.6 RR 3, 14 R R R W G Cruiser MaxxTerral-REV Brand 57R21 (RR) RR5L 5.7 RR 3 R R R P T Cruiser MaxxTerral-REV Brand 59R13 (RR) RR5L 5.9 RR R R G Cruiser MaxxTN Exp TN09-44,121 (RR2Y) RR5L 5.9 RR2Y P T Cruiser MaxxTN Exp TN09-45,905 (RR2Y) RR5E 5.3 RR2Y P T Cruiser MaxxTN Exp TN09-47,169 (RR2Y) RR4E 4.5 RR2Y P GTN Exp TN10-4045 CV4 4.3 W GTN Exp TN11-4512 (RR2Y) RR4L 4.9 RR2Y P GTN Exp TN11-5088 CV5 5.4 W GTN Exp TN12-4070 CV4 4.0 W GTN Exp TN12-4075 CV4 4.5 P TTN Exp TN12-4088 CV4 4.5 W GTN Exp TN12-4715 (RR2Y) RR4L 4.6 RR2Y P GTN Exp TN12-4743 (RR2Y) RR4L 4.6 RR2Y P GTN Exp TN12-5015 CV5 5.6 W LtTN Exp TN12-5523 (RR2Y) RR5L 5.6 RR2Y P TTN Exp TN12-5716 (RR2Y) RR5L 5.7 RR2Y P TUSDA-TN JTN-4307 CV5 5.0 2, 3, 14 R MS R P T ApronMaxx/Cruiser/Moly
USDA-TN JTN-4607 CV4 4.6 3,5 W TApronMaxx RTA+Moly, Cruiser 5FS
USDA-TN JTN-5110 CV5 5.5 2, 3, 5 R R P T ApronMaxx/Cruiser/MolyUSDA-TN JTN-5203 CV5 5.3 2, 3, 14 R R R W G ApronMaxx/Cruiser/Moly

Table 78 (continued)2013 Relative Herbicide SCN Stem Flower Pubescence Seed
Brand Variety ‡ Test Maturity Tolerance Resistance Canker SDS Frogeye Color Color TreatmentUSG 74A33R (RR2Y) RR4E 4.3 RR2Y R3 P LT Cruiser MaxxUSG 74A69R (RR2Y) RR4L 4.6 RR2Y MS MR MR P LT Cruiser MaxxUSG 74A79R (RR2Y/STS) RR4L 4.7 RR2Y/STS MS MR P LT Cruiser MaxxUSG 74A91 (RR) RR4L 4.9 RR R 3, MR 14 MR MR P LT Cruiser MaxxUSG 74B81R (RR2Y/STS) RR4L 4.8 RR2Y/STS R 3, MR 14 MS P LT Cruiser MaxxUSG 74B83R (RR2Y/STS) RR4L 4.8 RR2Y/STS P LT Cruiser MaxxUSG 74F53R (RR2Y/STS) RR4E 4.5 RR2Y/STS P G Cruiser MaxxUSG 74G82L (LL) LL4 4.8 LL MR W T Cruiser MaxxUSG 74G99L (LL) LL4 4.9 LL R P G Cruiser MaxxUSG 74H92R (RR2Y) RR4L 4.9 RR2Y R 3, MR 14 P LT Cruiser MaxxUSG 75J23R (RR2Y) RR5E 5.2 RR2Y R3 P G Cruiser MaxxUSG 75Q42R (RR2Y) RR5E 5.4 RR2Y R 3, MR 14 R MR W G Cruiser MaxxUSG Allen (RR) RR5L 5.6 RR MR MR W G Cruiser MaxxWarren Seed DS4010 (RR) RR3 RRWarren Seed DS4330 R2Y RR4E 4.3 R2Y 3,14 P LT Cruiser MaxxWarren Seed DS5122 R2Y RR5E 5.1 R2Y 3,14 P LT Cruiser MaxxWarren Seed DSR-4330/R2Y (4E CHECK) RR3 4.3 R2Y 3,14 P LT Cruiser MaxxWarren Seed DSR-4633/R2Y RR4E 4.3 RR2Y 3, 14 W G Cruiser MaxxWarren Seed DSR-4850/R2Y (STS) RR4L 4.8 RR2Y/STS 3, 14 P G Cruiser MaxxRR / RR2Y = Contains a gene for tolerance to glyphosate herbicide; STS = tolerance to sulfonylurea class of herbicides; LL = contains a gene for tolerance to glufosinate herbicide.R = resistant, MR = moderately resistant, MS = moderately susceptible, S = susceptible, VS = very susceptible.Flower & Pubescence colors:P = purple, W = white, S = segregating, T = tawny, LT = light tawny, B = Brown, G = gray.Most information supplied by companies.RR3 = Roundup Ready 3 CV4 = Conventional Group 4 (with LL & RR Checks)R4E = Roundup Ready Early Group 4 CV5 = Conventional Group 5 (with LL & RR Checks)R4L = Roundup Ready Late Group 4 LL4 = Liberty Link Group 4 R5E = Roundup Ready Early Group 5 LL5 = Liberty Link Group 5R5L = Roundup Ready Late Group 5‡ If a trait appears inside parentheses i.e. (RR), then it is not part of the variety name.

Company Contact Phone Email Web site Address
AgBorn Genetics LLC Bill Cook 816-830-1252 [email protected] http://www.agborn.com 28706 State Hwy 75, Garden City, MO 64747Bob Joehl 317-409-8214
Ag South Genetics Mixon Seed 800-922-1377 www.agsouthgenetics.com Orangeburg, SC
University of Arkansas Tina Hart 479-466-2213 [email protected] Dept of Crop, Soil & Env. Sciences115 Plant Science BldgFayetteville, AK 72701
Armor Seed Lane Dill 901-233-0274 [email protected] www.armorseed.com 2528 Alexander Drive, Jonesboro, AR 72401P.O. Box 178, Fisher, AR 72429
Asgrow (Monsanto) Larry Ganann 901-326-7140 [email protected] www.asgrowanddekalb.com 1404 Dexter Lake Dr., Apt 104, Cordova, TN 38016
Beck's Hybrids Doug Clouser 800-937-2325 [email protected] www.beckshybrids.com 6767 East 276th Street, Atlanta, IN 46031
Caverndale Farms Barry Welty 859-236-2150 [email protected] www.caverndalefarms.com Foothills Co-opJohnson City Chemical Co.
Croplan Genetics Jesse Witt 256-221-5932 [email protected] http://www.winfield.com/farmer/croplan/(Winfield)
Delta Grow Seed Lee Hughes 800-530-7933 [email protected] www.deltagrow.com P O Box 219, England, AR 72046
Dyna-Gro Todd Theobald 731-885-1212 [email protected] www.dynagroseed.com 710 S. First Street, Union City, TN 38261(Crop Production Services) Dewain Riley 731-223-9876 [email protected]
GoSoy (Stratton Seed Co.) Heath North 800-264-4433 [email protected] www.strattonseed.com 1530 Hwy 79 South, Stuttgart, AR 72160
Halo (US Seeds) Jamie Boone 870-336-0111 [email protected] 2528 Alexander Drive, Jonesboro, AR 72401
Hornbeck Seed Co (Bayer CropScience) Lucas Owen 731-793-3530 [email protected] www.hbkseed.com P O Box 472, 210 Drier Rd, DeWitt, AR 72042
LG Seeds Brock Sargeant 270-881-3003 [email protected] www.lgseeds.com 303 Sherwood Dr., Hokinsville, KY 42240
Midwest Premium (Stratton Seed Co.) Heath North 800-264-4433 [email protected] www.strattonseed.com 1530 Hwy 79 South, Stuttgart, AR 72160
University of Missouri, 147 State Hwy TUniversity of Missouri Grover Shannon 573-379-5431 [email protected] Partageville, MO 63873
Morsoy Xtra (Cache River Valley Seed) Jim Bigger [email protected] www.crvseed.com 12470 Hwy 226, PO Box 10, Cash, AR 72421
Mycogen Seed Todd McClellan 317-522-6641 www.dowagro.com/mycogen 225 Peachtree Dr., Benton, KY 42025
NK Brand (Syngenta) Mike Saxton 270-792-5885 [email protected] www.nk-us.com P.O. Box 959, Minneapolis, MN 55440
Progeny Brian Murray 888-535-7333 [email protected] www.progenyag.com 1529 Hwy 193, Wynne, AR 72396
Schillinger Genetics (Stratton Seed Co.) Heath North 800-264-4433 [email protected] www.strattonseed.com 1530 Hwy 79 South, Stuttgart, AR 72160
Steyer Seeds Joe Steyer 800-231-4274 [email protected] www.steyerseeds.com PO Box 209, Old Fort, OH 44861
Table 79. Contact information for soybean seed companies evaluated in yield tests in Tennessee during 2013.

Table 79 (continued)Company Contact Phone Email Web site Address
University of Tennessee Vince Pantalone 865-974-8801 [email protected] Dept. of Plant Sciences, Ellington 2522431 Joe Johnson DriveKnoxville, TN 37996-4561
Terral Seed Inc Phil Michener 318-231-8800 [email protected] www.terralseed.com 111 Ellington Dr., Rayville, LA 71269
USDA-ARS TN Lisa Fritz 731-425-4736 [email protected] 605 Airways Blvd, Jackson, TN 38301
Unisouth Genetics (USG) Stacy Burwick 615-412-4157 [email protected] www.usgseed.com 3205-C Highway 46S, Dickson, TN 37055931-967-3377 [email protected] Fandrich Supply Co, Belvidere, TN731-235-2167 [email protected] Huffstetler & Sons Seed Inc, Greenfield, TN731-836-7574 [email protected] Hurt Seed Co. Inc, Halls, TN731-536-6251 [email protected] Obion Grain Co. Inc, Obion, TN731-538-2990 Sellers Seed, Obion, TN
Warren Seed Lanny Warren 731-234-2921 [email protected] [email protected] PO Box 10, Woodland Mills, TN 38271

Management of Soybean Diseases Foliar Fungicide Efficacy for Control of Foliar Soybean Diseases—2014
The North Central Regional Committee on Soybean Diseases and the Regional Committee for Soybean Rust Pathology (NCERA-212 and NCERA-208) have developed the following information on foliar fungicide efficacy for control of major foliar soybean diseases in the United States. Efficacy ratings for each fungicide listed in the table were determined by field-testing the materials over multiple years and locations by the members of the committee. Efficacy ratings are based upon level of disease control achieved by product, and are not necessarily reflective of yield increases obtained from product application. Efficacy depends upon proper application timing, rate, and application method to achieve optimum effectiveness of the fungicide as determined by labeled instructions and overall level of disease in the field at the time of application. Differences in efficacy among fungicide products were determined by direct comparisons among products in field tests and are based on a single application of the labeled rate as listed in the table, unless otherwise noted. Table includes systemic fungicides available that have been tested over multiple years and locations. The table is not intended to be a list of all labeled products1. Efficacy categories: NR=Not Recommended; P=Poor; F=Fair; G=Good; VG=Very Good; E=Excellent; NL = Not Labeled for use against this disease; U = Unknown efficacy or insufficient data to rank product efficacy.
Fungicide(s)
Class Active ingredient (%)
Product/Trade name
Rate/A
(fl oz)
Aerial web
blight Anthracnose Brown
spot Cercospora leaf blight2
Frogeye leaf
spot3
Phomopsis/ Diaporthe (Pod and
stem blight)
Soybean rust
White mold4
Harvest restriction5
QoI
Str
obilu
rins
Gro
up 1
1
Azoxystrobin 22.9% Quadris 2.08 SC 6.0 -
15.5 VG VG G F VG U G-VG P 14 days
Fluoxastrobin 40.3%
Aftershock 480 SC Evito 480 SC
2.0 – 5.7
VG G G F VG U U NL R5
(beginning seed) 30 days
Picoxystrobin Aproach 2.08 SC
6.0 -12.0
VG G G F VG U G G 14 days
Pyraclostrobin 23.6%
Headline 2.09 EC/SC
6.0 - 12.0
VG VG G F VG U VG NL 21 days
DM
I Tria
zole
s G
roup
3
Cyproconazole 8.9% Alto 100SL 2.75 –
5.5 U U VG U F U VG NL 30 days
Flutriafol 11.8% Topguard 1.04 SC 7.0 –
14.0 U VG VG F VG U VG-E G 21 days
Propiconazole 41.8%
Tilt 3.6 EC Multiple Generics6
2.0 - 4.0
P VG G NL F NL VG NL R5 (beginning seed)
Prothioconazole 41.0% Proline 480 SC7 2.5 –
4.3 NL NL NL NL VG NL VG G 21 days
Tetraconazole 20.5% Domark 230 ME 4.0 –
5.0 NL VG VG F VG U VG-E G R5
(beginning seed)
MB
C T
hiop
hana
tes
Gro
up 1
Thiophanate-methyl
Topsin-M Multiple Generics
10.0 – 20.0
U U U F VG U G G 21 days

Fungicide(s)
Class Active ingredient (%)
Product/Trade name
Rate/A (fl oz)
Aerial web
blight Anthracnose Brown
spot Cercospora leaf blight
Frogeye leaf spot
Phomopsis/ Diaporthe (Pod
and Stem blight)
Soybean rust White mold Harvest
restriction
SDH
I C
arbo
xim
ides
Gro
up 7
Boscalid 70% Endura 0.7 DF 3.5 –
11.0 U NL VG U P NL NL G 21 days
Mix
ed m
ode
of a
ctio
n
Azoxystrobin 18.2%
Difenconazole 11.4%
Quadris Top 2.72 SC
8.0 – 14.0
U U U U VG U VG NL 14 days
Azoxystrobin 7.0% Propiconazole
11.7%
Avaris 1.66 SC Quilt 1.66 SC
HM-0812 1.66 SC 14.0 – 20.5
U U G U G U VG NL 21 days
Azoxystrobin 13.5%
Propiconazole 11.7%
Quilt Xcel 2.2 SE 10.5 - 21.0
E VG G F VG U VG NL R6
Fluoxastrobin 18.0%
Tebuconazole 25.0%
Evito T 3.99 F 4.0 -6.0
U F VG P-F F U U NL 30 days
Pyraclostrobin 28.58%
Fluxapyroxad 14.33%
Priaxor 4.17 SC
4.0 – 8.0
E VG E F VG U VG P-F 21 days
Trifloxystrobin 11.4%
Propiconazole 11.4%
Stratego 250 EC 10.0 G-VG VG G F VG U VG NL 21 days
Trifloxystrobin 32.3%
Prothioconazole 10.8%
Stratego YLD 4.18 SC8
4.0 – 4.65
VG VG VG F VG U VG NL 21 days
1Multiple fungicides are labeled for soybean rust only, powdery mildew, and Alternaria leaf spot, including tebuconazole (multiple products) and Laredo (myclobutanil). Contact fungicides such as chlorothalonil may also be labeled for use. 2 Cercospora leaf blight efficacy relies on accurate application timing, and standard R3 application timings may not provide adequate disease control. Fungicide efficacy may improve with earlier or later applications. Fungicides with a solo or mixed QoI or MBC mode of action may not be effective in areas where QoI or MBC resistance has been detected in the fungal population that causes Cercospora leaf blight. 3 Fungicides with a solo or mixed QoI mode of action may not be effective in areas where QoI-resistance has been detected in the fungal population that causes frogeye leaf spot. 4 White mold efficacy is based on an R1 application timing, and lower efficacy is obtained at an R3 application timing, or if disease symptoms are already present at the time of application. 5Harvest restrictions are listed for soybean harvested for grain. Restrictions may vary for other types of soybean (edamame, etc.) and soybean for other uses such as forage or fodder. 6Multiple generic products containing this mode of action may also be labeled in some states. 7Proline has a supplemental label (2ee) for soybean, only for use on white mold in IL, IN, IA, MI, MN, NE, ND, OH, SD, WI. A separate 2ee for NY exists for white mold. 8Stratego YLD has a supplemental label (2ee) for white mold on soybean only in IL, IN, IA, MI, MN, NE, ND, OH, SD, WI. Many products have specific use restrictions about the amount of active ingredient that can be applied within a period of time or the amount of sequential applications that can occur. Please read and follow all specific use restrictions prior to fungicide use. This information is provided only as a guide. It is the responsibility of the pesticide applicator by law to read and follow all current label directions. Reference to products in this publication is not intended to be an endorsement to the exclusion of others that may be similar. Persons using such products assume responsibility for their use in accordance with current directions of the manufacturer. Members or participants in the NCERA-212 or NCERA-208 group assume no liability resulting from the use of these products.