Embed Size (px)
Citation preview

1
Soybean Production Costs: An Analysis of the United States, Brazil, and Argentina
Alexandria I. Huerta and Marshall A. Martin*
Selected Paper Presented at the 2002 AAEA Annual Meeting
Long Beach, CA July 28-31, 2002
ABSTRACT: U.S. farmers’ share of world soybean exports has declined, while Brazil
and Argentina are gaining. There is much debate concerning the competitive advantage
of U.S. versus Latin American soybean producers. A detailed analysis of soybean
production costs under different systems and technologies in the United States,
Argentina, and Brazil was conducted.
Keywords: Argentina, Brazil, international competition, soybeans, productions costs, United States Copyright 2002 by Alexandria I. Huerta and Marshall A. Martin. All rights reserved. Readers may make verbatim copies of this document for non-commercial purposes by any means, provided that this copyright notice appears on all such copies.
* Huerta is a Graduate Research Assistant in the Department of Agricultural Economics, Purdue University. Martin is the Associate Director of Agricultural Research Programs, Purdue University.

2
Soybean Production Costs: A Competitive Analysis of the
United States, Brazil, and Argentina
Introduction
Over the past several years, U.S. soybean farmers have seen their share of world
soybean exports decline. While U.S. soybean production represents approximately one-
half of total world soybean production, other competitors such as Brazil and Argentina
are gaining. Furthermore, U.S. farmers are facing some of the lowest soybean prices in
decades, due in part to bumper crops, coupled with a weaker world demand. Also, the
relative loan rates and loan deficiency payments (LDP) incentives associated with the
1996 Farm Bill have encouraged American farmers to increase soybean production.
Geographical Comparisons
The three major soybean producers in the world market today are the United
States, Brazil, and Argentina, respectively. To better understand the existing agricultural
conditions and future potential, it is important to compare and contrast these countries.
The United States and Argentina share a temperate climate, while the climate in Brazil is
more tropical. Because of their location in the Southern Hemisphere, Brazil and
Argentina have almost an opposite crop production season compared to the United States,
with approximately a six-month difference in the time of harvest. This provides some
market advantages to Brazil and Argentina because their farmers harvest their soybeans
between February and April. Growing seasons for these three countries also vary in their
length. The United States experiences a generally shorter growing season (May through
October) than its competitors. Argentina’s potential growing season extends from
November through May, while in Brazil’s frost-free tropics three crops can potentially be
produced per year.
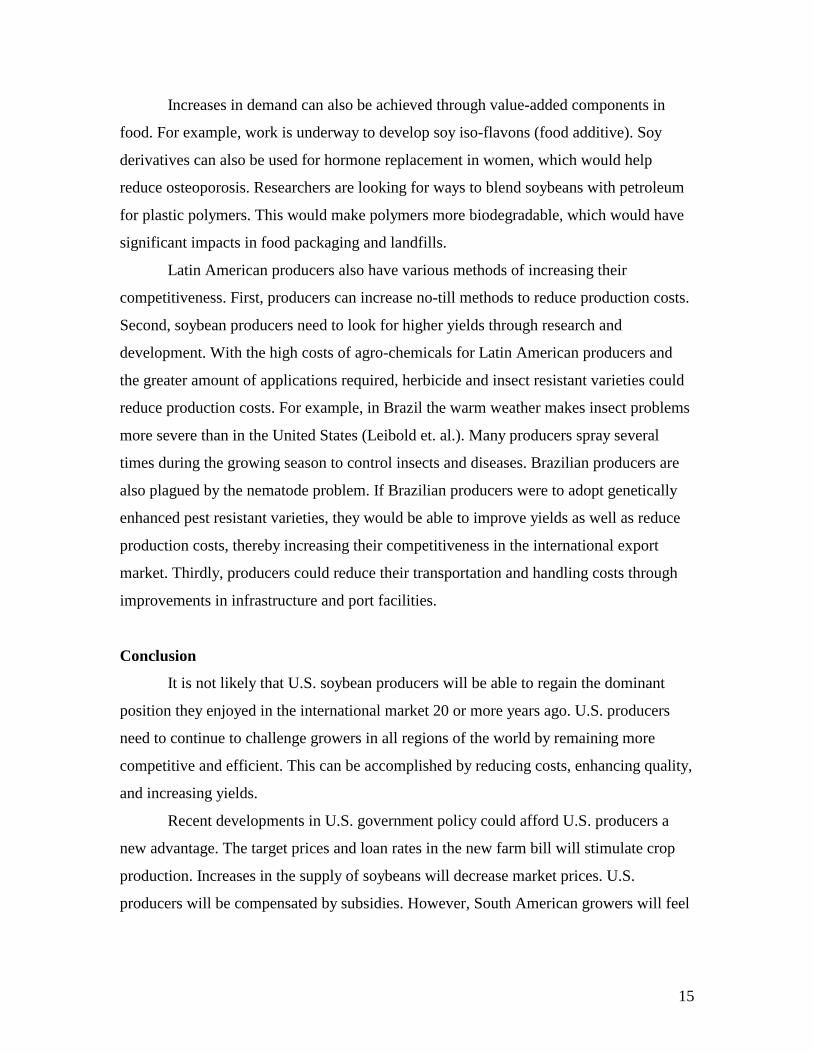
In the United States, the deep rich soils of the Corn Belt have made that region the
world’s most productive soybean-growing area. Argentina’s soybean production region,
known as the “Pampas”, has soils that are equally fertile (See figure 1).

3
In Brazil, soybean production is concentrated in the area called the “Cerrado”,
which is a savannah-like flatland. These soils, which are high in aluminum, highly acidic,
and deficient in phosphorus and nitrogen, are less fertile. Many native Cerrado plants
have high tolerances to aluminum toxicity. Soybean varieties in Brazil have been bred to
adapt to these soil conditions. The low pH of the soils reduces the availability of
phosphorus and increases the availability of aluminum and iron (Leibold et. al.). This
becomes a problem for producers since soybeans require large amounts of phosphorous.
The addition of lime and phosphorus minimizes aluminum toxicity, and Brazil has large
supplies of lime. The soils in the Cerrado are very fragile, and high rainfall levels create
significant soil erosion problems. Producers in Brazil have adopted no-till production
practices and terracing to minimize these erosion risks. Hence, soil management
techniques have elevated the productivity of this region to a competitive level.
U.S. soybean production has increased between 1991 and 2001, from 52.9 to 79.1
million metric tons. In 1991, the United States exported 23.6 million tons, approximately
39% world market share. In 2001, exports had increased to 35.1 million tons, but the
export share had fallen to 32% (Schnepf et. al, 2001).
Brazilian soybean production has been steadily increasing over the last decade,
from 18.5 million metric tons in 1991 to 41.5 million tons in 2001 (Schnepf et. al, 2001).
Brazilian production has expanded faster than domestic consumption, resulting in
increased exports. Argentina too has experienced an increase in soybean production. In
1991, Argentine soybean production was 11.1 million tons, and has increased to 27
million tons (Schnepf et. aL, 2001).
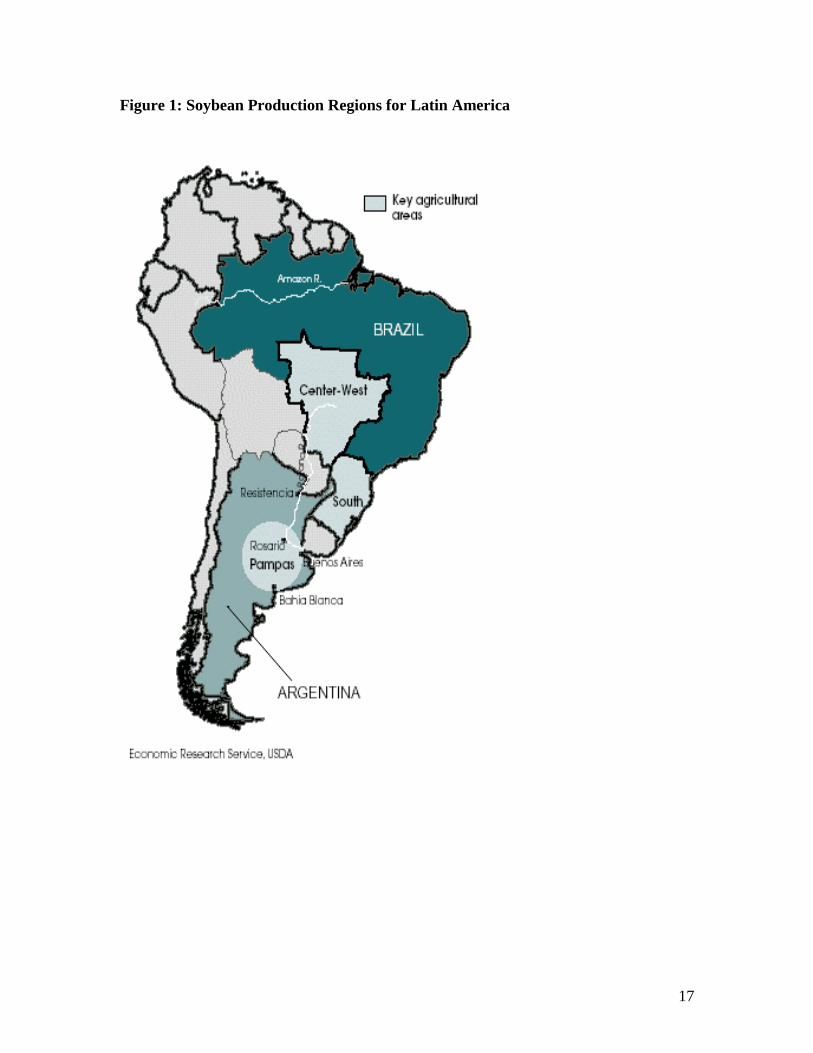
U.S. soybean production is already very efficient. However, soybean yields are
comparable among all three producers; with producers in the U.S. Heartland Region
averaging 45.0 bushels per acre compared to average U.S. yields of 41.0 bushels per acre
(Table 1). Soybean yields in Brazil and Argentina are 44.5 and 40.0 bushels per acre,
respectively.
Total U.S. agricultural land area is 418.3 million hectares, with 239.3 million
hectares in permanent pasture, 177 million hectares in cropland, and 2.1 million hectares
in permanent crops. Any soybean expansion in the United States would have to come
from a reduction in the area planted to another crop. Brazil and Argentina combined have
4
approximately the same amount of agricultural land in use as the United States: 419.4
million hectares. The difference lies in the potential for expansion. Nearly 600 million
hectares of land in Argentina and Brazil combined is accessible underdeveloped
agricultural land (Schnepf et. al, 2001). For example, Brazil currently has 50% as much
land under cultivation as the United States, but it has the potential to increase crop area
by 56% more than the United States has under production (Leibold et al.). Both
Argentina and Brazil have vast expanses of land in permanent pasture which could be
converted to soybean production with appropriate market incentives and technologies.
Infrastructure
The United States possesses an infrastructure that is vastly more developed than
its competitors. With its widespread internal transportation network, U.S. soybean
producers are able to move their product to international markets more efficiently and at a
cheaper cost. Paved highways are more prevalent in the United States than in Argentina
and Brazil, where only 10 percent and 30 percent, respectively, of the highways are
paved. The availability of rail lines and a common single gauge allows for larger load
densities in the United States that further reduce transportation costs for commodities.
In contrast, Argentina’s and Brazil’s waterways and overland transportation
infrastructure are underdeveloped and generally sub-standard. The governments in these
countries have not invested much capital or implemented policies to modernize and
improve existing transportation infrastructure. Inefficient barge and railroad
transportation systems have led to a dependence on slower, and more expensive, overland
trucking. However, recent initiatives to deregulate and privatize railways and ports in
both countries could lead to improvements in infrastructure.
Another major problem in Argentina and Brazil is the underdeveloped on- and
off-farm storage. Increasing storage capacity would reduce the need for harvest-time
sales, and shipment, which tends to depress harvest-time prices and create congestion at
terminal elevators and port facilities.

5
Competitive Positions
Competitiveness in international commodity markets reflects the ability to deliver
a product at the lowest cost. Competitiveness is influenced by many factors: relative
resource endowments, agro-climate conditions, macroeconomic policiesi, agricultural
policiesii, infrastructure and supporting institutionsiii (Schnepf et. al, 2001). The
combination of farm-level production, transportation, and marketing costs will determine
a farmer’s competitiveness on the international stage.
As noted previously, there are clear differences in agro-climate conditions among
the three soybean production regions. Soil types and climate conditions dictate yields and
when the product reaches the market. However, there are other equally important
differences: types and availability of technology, land costs, labor costs, access to capital
(cost of capital), transportation costs and marketing costs.
All three major competitors have some potential to expand their areas of soybean
production. In Brazil this potential exists in the development of new land areas for
soybean production. Argentina’s expansion will come from converting pastureland into
agricultural production. U.S. potential for expansion lies in switching production from
other crops into soybeans.
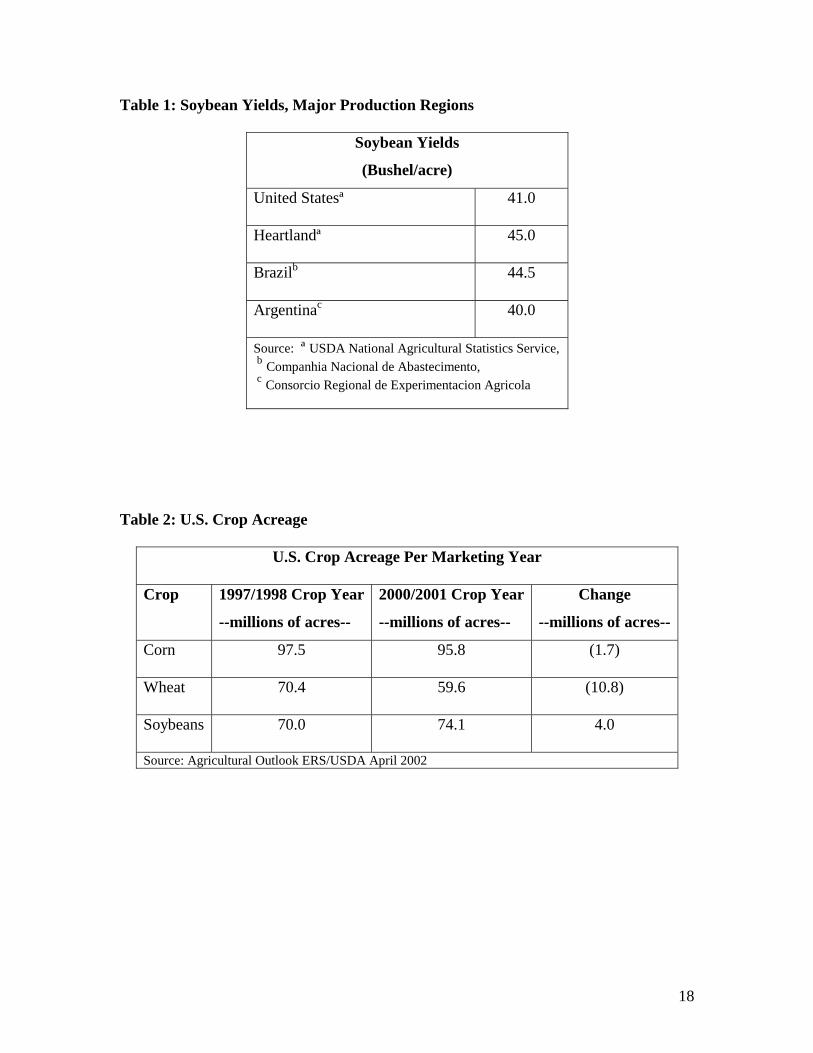
In the United States, soybean acreage increased between 1997 and 2001 by
approximately 4 million acres (Table 2). The reason for this increase could be a result of
two things: some soybean expansion into the Dakotas, a region previously considered too
far north for the production of soybeans, and a shift in crop acreage. At the same time
soybean acreage has been expanding, there has been a slight decrease in corn acreage,
and a substantial decline in wheat acreage.
Brazil’s soybean production is occurring in two main regions: the south and
central west. Increased soybean production in these areas will come from increased
yields, shifts from other crops to soybean, and land clearing. Most of Brazil’s expansion
in soybean production is in the Cerrado, on recently cleared land. The Cerrado includes
land in several states, but much of the current development is in Mato Grosso.
In Argentina, the potential for expanding soybean production into new areas is
limited. The biggest change could come from converting pastureland into land for

6
soybean production. Another alternative for Argentine producers is to switch production
of other crops into soybean acres under appropriate price and technology conditions.
A major production cost difference is the cost of land. The relatively high soybean
production costs in the United States are primarily attributed to higher fixed costs,
especially land. A recent study by the ERS shows estimated land rental rates for Brazil at
$6 per acre (in Mato Grosso) to $14 per acre (in Parana). Per acre rental rates in the
United States and Argentina were much higher: $88 and $63, respectively. U.S. data
represent the Heartland region, while those for Argentina represent prime land in
northern Buenos Aires Province. The lower land rental rates in Brazil are a reflection of
the abundance of land available in the Cerrado for agricultural development. High
yielding land in Mato Grosso can be purchased for as low as $200iv per acre compared to
the $2000 or more per acre costs in the U.S. Corn Belt (Schnepf et. al, 2001).
In terms of competitive advantages from infrastructure, the United States still
holds the advantage. U.S. transportation systems are superior to those in South America.
The U.S. infrastructure is better for moving soybeans from the field to the port and from
the domestic port to Rotterdam. Since the mid-1980’s, the average U.S. producer to free-
on-board port price spread has shown little variability, about $16 to $18 per ton. Lower
transportation and marketing costs for U.S. soybean producers reflect in part the efficient
barge transportation system. With the barge system, soybeans can travel long distances at
relatively low costs. However, on the Mississippi River, barges loaded with Heartland
grown soybeans often wait in line for hours to pass through a series of 80-year-old locks
that lower the barges down to sea level at New Orleans. From there the soybeans are
loaded onto freighters. Farmers have been lobbying for upgrades in the lock system, a
project that will cost more than $1 billion (Rich, 2001). This long awaited upgrade has
been slowed by doubts raised about an eight year cost benefit analysis and environmental
impact study by the Army Corps of Engineers. Such transportation improvements will be
essential if U.S. soybean producers are to remain competitive in the international market.
This transportation advantage is under constant threat from U.S. competitors.
There have been some reductions in internal transportation costs in Argentina and Brazil,
which has boosted their soybean export competitiveness. However, despite construction
of some new rail lines and ports, roadways are still the primary means of moving

7
commodities throughout Brazil. In the last few years, the Brazilian government has
leased roads for private maintenance. To fund road maintenance, private companies
charge high tolls, thereby increasing the transportation costs for Brazilian soybean
producers. The trucking distance in Brazil is greater than that faced by U.S. farmers. On
average, Brazilian soybeans travel 900 miles by truck before being transferred to railroad
cars or waterways (Spangler and Wilson, 2002). These soybeans must then travel
approximately an additional 900 miles to reach an east coast seaport, as is the case for
soybeans produced in Mato Grosso. The producer f.o.b. price spread is estimated at $47
per ton.
The Brazilian government has been promising upgrades in paved roads and
navigable waterways, but chronic economic instability and large budget deficits have
held up this work. Private companies are stepping in and partially filling the gap. Using
loans from a government development bank, private companies are building new
railroads. One example of private initiative is the case of Blairo Maggi, one of Brazil’s
largest soybean producers. When promises of infrastructure improvements from the
government went unfulfilled, Maggi used $20 million of his own money and $40 million
from the state of Amazonas to build a port on the Amazon-feeding Madeira River. Once
the port was opened, soy shipments on the Madeira River quadrupled, and Maggi’s
shipping costs fell 20 percent (Rich).
Another competitive advantage for Brazilian soybean producers comes from the
government breaking up the long-standing petroleum monopoly. New laws have allowed
new fuel and petroleum companies access to the country, allowing increased fuel imports.
In January 2002, Brazilians saw a 20% drop in fuel prices, which translates into
decreased fuel costs for soybean producers.
One area that has concerned government and soybean producers alike is the state
of navigation on Brazilian rivers. Producers want the government to invest in the
development of a system of locks and dams to raise water levels on the rivers, especially
the Parana River. This would help control river flows and keep the waters deep enough to
float larger barges capable of carrying larger soybean loads to ports. Such a project would
require huge investments. However, there are also some severe environmental
implications for such a project. Damming the river would drain other areas that house

8
many species of flora and fauna. Draining this watershed could have an adverse impact
on the wildlife of that region. The social welfare cost of losing that natural environment
could be high. As a result, environmentalists, both foreign and domestic, oppose such a
plan.
Agricultural producers, on the other hand, could benefit from such a project. By
draining this swampy region, land that is not currently productive could be converted to
viable productive farmland. The Brazilian government faces pressure both for and against
this project, since there are positive and negative economic and political implications.
Even if such a project were to garner approval by the government, the Brazilian
government has no funds to undertake such an expensive project. This kind of
infrastructural development would require obtaining a loan from the World Bank which
faces considerable political pressures to reject such a project.
In Argentina, soybean producers face the problem of shallow rivers. The Parana
River which connects the Port of Rosario, one of the largest in Argentina, to the Atlantic
Ocean requires dredging to maintain a deeper channel. As a result, barges cannot carry
big shipments nor larger ocean going vessels to transport as many tons of soybeans as
their U.S. or Brazilian competitors. This results in higher transportation costs for
Argentine soybean producers.
Despite its problems with antiquated systems of locks and dams, the United States
still has a fairly efficient water-based system of transportation using barges. Trucking
distances in the United States are shorter, especially since the majority of soybean
production occurs in the regions surrounding the Ohio, Illinois, Mississippi, and Missouri
Rivers. Once the soybeans are hauled overland to the nearest river, they are loaded onto
barges. Except some western parts of the soybean growing area, the majority of the beans
flow down the Mississippi River for export.
Even if Brazil could greatly improve its infrastructure, Brazilian soybeans must
still travel larger distances overland before reaching a waterway. Rivers in Brazil do not
connect in the same way as they do in the United States. The major rivers in Brazil are a
long distance from the main soybean production regions. As a result, Brazilian producers
must pay more in transportation and handling costs than U.S. producers.

9
In South America there have been some investments or improvements in
infrastructure, primarily on railroads and roads. Not much investment has been made in
water transport systems. Despite these investments in South America and the need for
repairs of the current system of U.S. locks and dams, the United States still remains cost
efficient, particularly in water-based transportations. The challenge for all three
competitors is to improve or make more efficient their current transportation systems.
This will require heavy investment.
In the long run, there is the potential for substantial gains in South America. This
is due to the fact that South American infrastructure is so far behind that of the United
States, it has further to go. However, this will require consideration of economic,
political, and environmental issues. The bottom line is that the current gap in production
costs will narrow with improvements in South America, but the United States will still
have the comparative advantage on transportation costs, especially if there are
improvements in the existing U.S. locks and dams.
Analysis
Different countries and institutions within a country use different concepts,
definitions, terminologies, and measurement methods to estimate production costs. As a
result, there are some limitations to the data used in this study. Data for U.S. soybean
production costs were gathered and published by the Economic Research Service (ERS)
of the USDA. Data for Argentina and Brazil were gathered from various government
agency websites, e-mail contacts with key personnel in the industry in South America,
individual company websites, and the ERS.
Comparisons of farm-level costs of production can be potentially imprecise for a
number of limiting factors. Methods used to calculate costs vary from country to country,
with certain variables included in the costs by one country but omitted by another.
Another difficulty lies in the different production practices. These would include single
versus double cropping, conventional till versus no-till, Genetically Modified Organisms
(GMO) versus conventional varieties, etc. It is currently illegal to raise genetically
modified soybeans in Brazil, but some GMO soybeans are planted in the southwest part
of Brazil. Most of these are exported through Argentina.

10
Tillage systems are defined by the amount of crop residue remaining on the soil
surface from the previous crop. Conventional tillage leaves between 15% to 30% crop
residue covering the soil when planting another crop, while reduced tillage leaves at least
30% residue. No-till means that no tillage operations have occurred prior to planting.
Exchange rate conversion issues further complicate cost estimates. Fluctuations in
the Brazilian currency make accurate dollar-valued representations somewhat difficult.
Between 1995 and 1999, apparent declines in Brazilian soybean production costs were
largely a reflection of a weakening Brazilian currency. After the Real was allowed to free
float in international exchange markets, Brazilian total production costs actually
increased in local currency terms (ERS, 2001). If exchange rates adjustments are ignored
and nothing changed in terms of the Real, devaluation alone makes it appear as if
Brazilian producers possess a cost advantage in soybean production. However, the
devaluation affects the cost of tradable goods. Imported tradable goods include
machinery, petroleum, and agro-chemicals, all of which are used in soybean production.
Non-tradable goods include land and labor, two key production costs, which are
minimally impacted by currency devaluation. Currency devaluation drives up the cost of
imported inputs, while making soybean exports more competitive in international
markets.
Comparisons of costs of production are further complicated by interest rates and
inflation. Choosing the appropriate exchange rate and adjusting for inflation are common
problems because all estimates have to be denominated in a common currency at one
point in time in order to make accurate multi-country comparisons. For example, in the
recent past, Brazilian inflation has exceeded 30% per month (AAEA, 1998), and from
1997 to 2002 the Real depreciated by 132%. In 1997, the Real was at 1.0779 to $1, and
by 2002 it had devalued to 2.32. Government macro policies have direct impacts on
levels of inflation. Increased government spending, due to domestic support programs
such as subsidies, increases inflation. This increase in inflation normally leads to
currency devaluation.
In the last 6 years, soybean producers in Argentina have adopted Round-Up
Ready soybean with about 95% of the area devoted to the technology. This resulted in
higher yields and lower overall production costs. The goal of producers was to drive

11
down the cost of production, increase efficiency, and become more competitive in
international markets. This was in line with the Argentine government’s plan to stimulate
the economy.
In the 1990s, the Argentine government privatized the economy to drive out
excess labor and excess cost. The result was an increase in unemployment to almost 20%.
Structural readjustment plans take a long time to take effect, and as a result social unrest
can develop, and investors can lose confidence in the economy. After nearly a decade of
parity of the Argentine Peso to the U.S. dollar, the exchange rate fell from 1 to 1 to 3.22
to 1 in a period of three months (January to March 2002). While this made Argentine
exports more competitive, import prices increased dramatically. The cost of most inputs,
including capital and imported inputs, could rise by as much as 100% (ERS/USDA,
2002). That has resulted in higher production costs for soybean farmers who use imported
inputs such as agro-chemicals or machinery. Further concerns over financing of present
and future production have lead to a fear of inflation. Argentina currently finds itself in
the midst of a serious economic crisis.
“Underlying the current economic crisis in Argentina are three interrelated
factors: the policy of pegging the domestic currency to the U.S. dollar throughout most of
the 1990s, the Argentine government’s failure to reduce budget and trade deficits, and the
ensuing default on government debt” (ERS/USDA, 2002). In the short-run, supply-side
effects of capital controls have made it difficult to obtain dollars to buy imports. As well,
in April 2002 the Argentine government imposed even more export taxes on many
agricultural products and other primary products, with soybeans experiencing an export
tax of 23.5%. Nitrogen-based fertilizer and fuel, which are produced domestically, are
expected to at least double in cost. As well, percentage markup for transportation and
export marketing expenses will likely rise due to increased market and policy uncertainty.
One way for Argentine farmers to assuage the higher costs of inputs is to change
cropping patterns. Should this happen, farmers are most likely to plant more soybeans
and less corn, since corn requires greater amounts of fertilizer, diesel fuel, agro-
chemicals, and high-cost seed than soybeans. Prospects for Argentine farm exports will
depend on that sector’s ability to adopt innovative solutions to the higher production
costs.

12
Production costs are defined as the sum of the operating and ownership costs for
consumable inputs. These costs exclude marketing and storage costs, as well as
opportunity costs for land and unpaid labor. Operating costs are the sum of costs that vary
directly with the amount of soybean acreage planted (Foreman and Livezey, 2002). Those
are referred to as the variable costs. These variable costs include the costs of seed,
fertilizer, fuel, repairs, manure, chemicals, custom operations, purchased irrigation water,
interest, and hired labor. Unfortunately, specific data for Brazil and Argentina production
are unavailable for some of these inputs. Rather, they are often aggregated into general
categories labeled “variable costs”. Ownership costs are costs relating to capital items
consumed during the annual production process. These costs include capital recoveryv
costs for farm machinery and equipment, property taxes and insurance. These ownership
costs are considered fixed costs.
Empirical Results
Average soybean yields are similar for all three countries (Table 1). Per acre
variable costs for soybean production are lower in the United States, while fixed costs are
higher, mainly due to the higher cost of land. Total production costs are higher for U.S.
producers (Table 3). The implications of these findings indicate U.S. producers will have
to find new means of staying competitive, since their competitors are currently able to
produce at a lower cost per bushel.
For the U.S. Heartland Region, variable costs are comparable to those in
Argentina, while Brazil’s variable costs are almost double that amount. In Brazil it is
illegal to plant Round-Up Ready soybeans, resulting in higher herbicide costs for
producers. Also, the majority of soybean producers custom hire harvesting, further
increasing their variable costs. And finally, inputs for production (fuel, chemicals, lime,
etc.) have to travel longer distances to the soybean production region in the interior of
Brazil, which also result in higher variable costs to producers.
Brazil, with its vast supply of unused agricultural land, has considerably lower
fixed costs compared to that of their competitors. The fixed costs for U.S. producers are
nearly triple that of their Brazilian counterparts. Much of this is attributable to higher

13
land costs in the United States. Fixed costs for Argentine producers falls somewhere in-
between, as their land costs are higher than in Brazil but lower than in the United States.
As noted earlier, data gathered from various different sources are not based on the
same methods of cost estimation. However, the variability in the data range is relatively
small. Using data from an ERS study, costs for transportation and marketing indicate the
United States holds the competitive edge in international freight costs (Table 4). Internal
transport and marketing costs for Brazil are nearly three times more expensive, due in
large part to the inefficiency of the infrastructure and the larger distances the beans must
travel before reaching a waterway. However, U.S. producers have a slight cost advantage
when shipping to European markets. Internal transportation costs are much lower for the
United States, affording U.S. producers a competitive advantage over their competitors.
Recent U.S. government policy developments will have an impact on future
soybean production costs. On May 13th President Bush signed a new farm bill that will
increase subsidies to agricultural producers. Agricultural spending is expected to swell by
nearly 80% over the cost of existing programs (AgriAmerica, 2002). Once the variable
production costs have been met, remaining revenues are used to pay operator salaries,
management costs, and returns to land. These new subsidies will be used to offset input
costs, resulting in more residual income. Much of this residual income will be capitalized
into land prices, resulting in higher cash rent and land values. Higher land costs translate
into higher production costs for U.S. soybean producers. Hence, an outcome of the new
farm bill will be to encourage production and drive down market prices, while increased
subsidies will tend to increase land prices.
Implications
How can U.S. producers become more competitive? If the United States wants to
expand its exports, there are two methods to increase competitiveness: reduce costs or
increase yields on the supply side, and increase consumption on the demand side. Supply
side changes can be affected by boosting production through improved genetics. Demand
can be expanded by adding value to soybean products.
Most soybeans in the United States are already produced under a no-till system.
By encouraging farmers to switch to no-till practices, soybean producers could reduce

14
somewhat labor, machinery, and fuel costs. Many farmers in Brazil and Argentina have
already incorporated no-till practices into their production. No-till practices are of vital
importance in controlling soil erosion, and maintaining long term production efficiency.
Another method of affecting a supply side change would be to improve soybean
yields or quality. In the United States, a large percentage of soybean producers have
already adopted Round-Up Ready seed. This allows farmers to reduce herbicide costs,
improve weed control, and make fewer trips across the field. However, the amount of
improvement that can be gained from adoption of this technology in the United States in
the future is limited. Currently, 74% of all soybean acres in the United States are planted
to biotech varieties (NASS, 2002). In Argentina, about 95% of the soybeans are biotech
varieties (Round-Up Ready). For Brazil the story is different. Currently, it is illegal to use
biotech varieties. Even so, between 10% – 20% of soybeans produced in Brazil are
Round-Up Ready. The potential growth in biotech soybean in Brazil will be much greater
if the government allows biotech varieties.
Another way to reduce production costs is through enhanced varieties. Currently,
research is being conducted on ways to improve pest resistant soybean varieties. Several
insects and diseases attack the soybean plant. Sudden death syndrome (SDS) and the
soybean aphid can reduce yields by 20% or more. Also, nematodes can attack the roots of
the plant and reduce yields. The nematode problem has lead to the development of
CystX, a soybean variety that is resistant to nematodes. Research is underway to cross
this variety with other existing varieties, thereby increasing their resistance to nematodes.
U.S. producers can find ways of increasing demand by enhancing the quality of
their product and searching for alternative markets. By enhancing the quality of soybean
meal, oil, amino acids, and processing characteristics, there exists a potential for
increased demand for soybeans. For example, there is growing demand for soybean oil
blended with diesel fuel. This blend of soybean oil (which can be as high as 20%) can be
used in diesel motors, for both on- or off-road vehicles (trucks, school buses, tractors,
etc.). This new fuel blend is environmentally friendly and reduces sulfur emissions.
Research is also currently underway to blend soybean oil with jet fuel. The goal is to find
a cleaner, more efficient jet fuel. This would also help make the United States less
dependent on foreign oil.
15
Increases in demand can also be achieved through value-added components in
food. For example, work is underway to develop soy iso-flavons (food additive). Soy
derivatives can also be used for hormone replacement in women, which would help
reduce osteoporosis. Researchers are looking for ways to blend soybeans with petroleum
for plastic polymers. This would make polymers more biodegradable, which would have
significant impacts in food packaging and landfills.
Latin American producers also have various methods of increasing their
competitiveness. First, producers can increase no-till methods to reduce production costs.
Second, soybean producers need to look for higher yields through research and
development. With the high costs of agro-chemicals for Latin American producers and
the greater amount of applications required, herbicide and insect resistant varieties could
reduce production costs. For example, in Brazil the warm weather makes insect problems
more severe than in the United States (Leibold et. al.). Many producers spray several
times during the growing season to control insects and diseases. Brazilian producers are
also plagued by the nematode problem. If Brazilian producers were to adopt genetically
enhanced pest resistant varieties, they would be able to improve yields as well as reduce
production costs, thereby increasing their competitiveness in the international export
market. Thirdly, producers could reduce their transportation and handling costs through
improvements in infrastructure and port facilities.
Conclusion
It is not likely that U.S. soybean producers will be able to regain the dominant
position they enjoyed in the international market 20 or more years ago. U.S. producers
need to continue to challenge growers in all regions of the world by remaining more
competitive and efficient. This can be accomplished by reducing costs, enhancing quality,
and increasing yields.
Recent developments in U.S. government policy could afford U.S. producers a
new advantage. The target prices and loan rates in the new farm bill will stimulate crop
production. Increases in the supply of soybeans will decrease market prices. U.S.
producers will be compensated by subsidies. However, South American growers will feel

16
this increase in competitive pressure from U.S. growers. This may become a contentious
issue to be challenged in the World Trade Organization (WTO).
A growing concern among U.S. producers is that their Latin American
competitors will gain more market share due to lower production costs, mostly associated
with lower land costs. As previously noted, land values are lower in Brazil and
Argentina, but these countries face other issues that reduce their competitive edge. They
include: economic instability, inadequate transportation infrastructure, and geographical
disadvantages associated with warmer climates. There is nothing in the foreseeable future
that points to Brazil and Argentina leaping over their U.S. competitors in the export
market. Just like their American counterparts, Brazilian and Argentine soybean producers
must finds way to increase their competitiveness and efficiency in production.
17
Figure 1: Soybean Production Regions for Latin America
18
Table 1: Soybean Yields, Major Production Regions
Soybean Yields
(Bushel/acre)
United Statesª 41.0
Heartlandª 45.0
Brazilb 44.5
Argentinac 40.0
Source: ª USDA National Agricultural Statistics Service, b Companhia Nacional de Abastecimento,
c Consorcio Regional de Experimentacion Agricola
Table 2: U.S. Crop Acreage
U.S. Crop Acreage Per Marketing Year
Crop 1997/1998 Crop Year
--millions of acres--
2000/2001 Crop Year
--millions of acres--
Change
--millions of acres--
Corn 97.5 95.8 (1.7)
Wheat 70.4 59.6 (10.8)
Soybeans 70.0 74.1 4.0
Source: Agricultural Outlook ERS/USDA April 2002

19
Table 3: Production Costs, Major Competitors
Soybean Production Costs
Cost of Production
Heartlandª
-$ per acre-
Brazil b
-$ per acre-
Argentina c
-$ per acre-
Variable Costs 76.95 132.39 76.0
Fixed Costs 153.0 46.72 80.8
Total Production Costs 230.0 179.11 157.2
Source: ª USDA National Agricultural Statistics Service, b Companhia Nacional de Abastecimento,
c Consorcio Regional de Experimentacion Agricola
Table 4: Transportation Costs, Major Production Regions
Cost
Heartland
-$ per bushel-
Brazil
-$ per bushel-
Argentina
-$ per bushel-
Internal transport
and marketing
0.43 1.34 0.81
Border Price 5.54 5.23 4.74
Freight Costs
To Rotterdam
0.38 0.57 0.49
Price at Rotterdam 5.92 5.80 5.23
Source: ERS/USDA

20
References
American Agricultural Economics Association. 1998. Commodity Costs and Returns Estimation Handbook. Ames, IA. AgBrazil, 2002. Brazil Production Inputs Markets. http://www.agbrazil.com AgriAmerica. May 8, 2002., US AG Today. Wednesday, http://www.agriAmerica.com CONAB, Companhia Nacional de Abastecimento (National Food Supply Company). March 2002. http://www.conab.gov.br/ CREA, Consorcio Regional de Experimentacion Agricola (Regional Consortium for Agricultural Research). March 1998. No. 209, EMBRAPA, Empresa Brasileira de Pesquisas Agropecuarias (Brazilian Institute for Agricultural Research). March 2002. http://www.embrapa.br Fee, R. October 2001. “U.S. Producers Say They Can Compete With Brazil.” Successful Farming. Foreman, L. and J. Livezey. March 2002. “Characteristics and Production Costs of U.S. Soybean Farms.” ERS Statistical Bulletin. No. 974-4, Leibold, K., P. Baumel, R. Wisner and M. McVey. January 14, 2002. “Brazil’s Crop Production System Holds Much Potential.” Feedstuffs. Vol. 74, No. 2. Rich, J. July 10, 2001. “Soy Growers in Brazil Shadow U.S. Farmers.” The New York Times. Schnepf, R., E. Dohlman, and C. Bolling. November 2001. “Agriculture in Brazil and Argentina: Developments and Prospects for Major Field Crops.” ERS/USDA Agriculture and Trade Report. WRS-01-3. Spangler, H. and M. Wilson. March 2002. “Beating Back Brazil.” Prairie Farmer. U.S. Department of Agriculture, Economic Research Service (ERS). March 2002. Published Database. http://www.ers.usda.gov/ U.S. Department of Agriculture, Economic Research Service. May 2002. “Argentina’s Economic Crisis: Can the Ag Sector Help?” Agricultural Outlook. U.S. Department of Agriculture, National Agricultural Statistics Service (NASS). March 2002. Published Estimates Database. http://www.nass.usda.gov

21
Footnotes
i Macroeconomic policies affect exchange rates, investment incentives, energy costs, etc.
ii Sector specific policies include credit subsidies, import and export taxes, etc.
iii Supporting institutions include regulatory, credit, news and information, etc.
iv This reflects land that has not yet been cleared or prepared for planting. v These costs include depreciation for machinery, equipment, and buildings.