Embed Size (px)
Citation preview

As the world’s largest and most diverse derivatives marketplace, CME Group
(cmegroup.com) is where the world comes to manage risk. CME Group exchanges
offer the widest range of global benchmark products across all major asset
classes, including futures and options based on interest rates, equity indexes,
foreign exchange, energy, agricultural commodities, metals, weather and real
estate. CME Group brings buyers and sellers together through its CME Globex
electronic trading platform and its trading facilities in New York and Chicago.
CME Group also operates CME Clearing, one of the largest central counterparty
clearing services in the world, which provides clearing and settlement services
for exchange-traded contracts, as well as for over-the-counter derivatives
transactions through CME ClearPort. These products and services ensure that
businesses everywhere can substantially mitigate counterparty credit risk in both
listed and over-the-counter derivatives markets.
COMMODITY PRODUCTSMORE COMMODITY FUTURES AND OPTIONS. GREATER OPPORTUNITY.
CME Group offers the widest range of commodity derivatives of any exchange,
with trading available on a range of grains, oilseeds, livestock, dairy, lumber and
other products. Representing the staples of everyday life, these products offer
you liquidity, transparent pricing and extraordinary opportunities in a regulated
centralized marketplace with equal access for all participants.

Soybean Crush Reference Guide
1
INTRODUCTION
In the soybean industry, the term ‘crush’ refers both to
a physical process as well as a value calculation. The
physical crush is the process of converting soybeans into
the by-products of soybean meal and soybean oil. The
crush spread is a dollar value quoted as the difference
between the combined sales values of the products and
the cost of the raw soybeans. This value is traded in the
cash and futures markets based on expectations of future
price movement of soybeans versus the components.
The relationship between prices in the cash market is
commonly referred to as the Gross Processing Margin
(GPM). The crush value traded in the futures market is
an inter-commodity spread transaction in which Soybean
futures are bought (or sold) and Soybean Meal and
Soybean Oil futures are sold (or bought). When using
futures prices, the crush spread is referred to as the
Board Crush. The Board Crush spread is often used by
processors to hedge the margin between the purchase
price of soybeans and the combined selling price of
the soybean meal and oil. It also offers opportunities
for speculators, as the spread relationship between
soybeans and the soybean by-products varies over time.
The November-December Board Crush (buying
November Soybean futures and selling December
Soybean Meal futures and December Soybean Oil
futures) is used to hedge new-crop gross processing
margins. The November-December Reverse Board Crush
uses the opposite positions (selling November Soybean
futures and buying the December Soybean Meal and
Soybean Oil futures).
The November/December futures prices often reflect
the market’s perception of conditions in the new soybean
crop year. Many seasonal, cyclical and fundamental
factors affect the Soybean Crush spread. For example,
soybean prices are typically lowest at harvest and trend
higher during the year as storage, interest
and insurance costs accumulate over time. Changes in
demand for high protein feed over the course of the year
and depletion of South American soybean stocks during
the late fall and winter months are additional factors than
can affect the crush spread; others include crop size
and yields, world demand, carryover stocks, Third World
purchases of edible oils, Malaysian palm oil production,
European meal demand, government programs and
weather. Fundamental and technical analysis can be
used to help forecast the potential for repetitive market
behavior, although there are many unpredictable
elements (such as weather) that affect the crush spread.
The historical data provided in this publication highlight
some of the trends and market conditions that have
prevailed in the crush spread over the past decade.

cmegroup.com/soybeancrush
2
Spreads are defined as the buying of one or more futures
contract(s) and the selling of different but related futures
contract(s). Those who typically trade spreads do so for two
important reasons – lower risk and attractive margin rates.
Lower Risk: Spreads usually offer lower risk1 than
outright futures positions, since the prices of related
commodities exhibit a strong tendency to move up or
down together. This relationship may offer protection
against losses that can arise from unexpected or extreme
price volatility.
Attractive Margin Rates: Since spreads are usually
less risky than outright positions, spread margin rates
are generally lower than those of the combined outright
positions. Spread margin rates apply even if a trader “legs
into” (trade entry for the spread components, or “legs,”
are not simultaneous) the spread over time.
WHY TRADE SPREADS?
-$1.00
-$0.50
$0.00
$0.50
$1.00
$1.50
$2.00
$2.50
$3.00
01/
04
/20
10
03
/04
/20
10
05
/04
/20
10
07/
04
/20
10
09
/04
/20
10
11/0
4/2
010
01/
04
/20
11
03
/04
/20
11
05
/04
/20
11
07/
04
/20
11
09
/04
/20
11
11/0
4/2
011
01/
04
/20
12
03
/04
/20
12
05
/04
/20
12
07/
04
/20
12
09
/04
/20
12
11/0
4/2
012
01/
04
/20
13
03
/04
/20
13
05
/04
/20
13
07/
04
/20
13
09
/04
/20
13
11/0
4/2
013
01/
04
/20
14
03
/04
/20
14
05
/04
/20
14
07/
04
/20
14
09
/04
/20
14
11/0
4/2
014
01/
04
/20
15
$0.00
$100.00
$200.00
$300.00
$400.00
$500.00
$600.00
01/
04
/20
10
03
/04
/20
10
05
/04
/20
10
07/
04
/20
10
09
/04
/20
10
11/0
4/2
010
01/
04
/20
11
03
/04
/20
11
05
/04
/20
11
07/
04
/20
11
09
/04
/20
11
11/0
4/2
011
01/
04
/20
12
03
/04
/20
12
05
/04
/20
12
07/
04
/20
12
09
/04
/20
12
11/0
4/2
012
01/
04
/20
13
03
/04
/20
13
05
/04
/20
13
07/
04
/20
13
09
/04
/20
13
11/0
4/2
013
01/
04
/20
14
03
/04
/20
14
05
/04
/20
14
07/
04
/20
14
09
/04
/20
14
11/0
4/2
014
01/
04
/20
15
$0.00
$2.00
$4.00
$6.00
$8.00
$10.00
$12.00
$14.00
$16.00
$18.00
$20.00
01/
04
/20
10
03
/04
/20
10
05
/04
/20
10
07/
04
/20
10
09
/04
/20
10
11/0
4/2
010
01/
04
/20
11
03
/04
/20
11
05
/04
/20
11
07/
04
/20
11
09
/04
/20
11
11/0
4/2
011
01/
04
/20
12
03
/04
/20
12
05
/04
/20
12
07/
04
/20
12
09
/04
/20
12
11/0
4/2
012
01/
04
/20
13
03
/04
/20
13
05
/04
/20
13
07/
04
/20
13
09
/04
/20
13
11/0
4/2
013
01/
04
/20
14
03
/04
/20
14
05
/04
/20
14
07/
04
/20
14
09
/04
/20
14
11/0
4/2
014
01/
04
/20
15
$0.00
$0.10
$0.20
$0.30
$0.40
$0.50
$0.60
$0.70
01/
04
/20
10
03
/04
/20
10
05
/04
/20
10
07/
04
/20
10
09
/04
/20
10
11/0
4/2
010
01/
04
/20
11
03
/04
/20
11
05
/04
/20
11
07/
04
/20
11
09
/04
/20
11
11/0
4/2
011
01/
04
/20
12
03
/04
/20
12
05
/04
/20
12
07/
04
/20
12
09
/04
/20
12
11/0
4/2
012
01/
04
/20
13
03
/04
/20
13
05
/04
/20
13
07/
04
/20
13
09
/04
/20
13
11/0
4/2
013
01/
04
/20
14
03
/04
/20
14
05
/04
/20
14
07/
04
/20
14
09
/04
/20
14
11/0
4/2
014
01/
04
/20
15
SOYBEAN CRUSH
SOYBEAN MEAL
SOYBEAN
SOYBEAN OIL
1 Similar to other commodity spreads, the Soybean Board Crush is generally less risky than the outright components but there can be periods of time where the crush spread volatility can be relatively high.

Soybean Crush Reference Guide
3
THE CRUSH SPREAD
The crush is quoted as the difference between the
combined sales value of soybean meal and oil and the
price of soybeans. The Board Crush spread includes
Soybean futures, which are traded in cents per bushel,
Soybean Meal futures priced in dollars per short ton,
and Soybean Oil futures traded in cents per pound. To
determine the relationship of the three commodities and
potential trading opportunities, it is necessary to convert
soybean meal and soybean oil prices to cents per bushel
because of their different pricing units.
When a bushel of soybeans weighing 60 pounds is crushed,
the typical result is 11 pounds of soybean oil, 44 pounds of
48 percent protein soybean meal, 4 pounds of hulls and
1 pound of waste. Although soybean meal can be delivered
with different levels of protein, the CBOT Soybean Meal
futures contract specifications are for 48 percent protein.
To Convert Prices into Cents per Bushel
Soybeans: No conversion required Soybean futures are quoted in cents per bushel
Soybean Meal: 0.022 x price of soybean meal 44 lbs/2000 lbs = 0.022
Soybean Oil: 11 x price of soybean oil 11 pounds of oil per 60 lb. bushel
Once these commodities have been converted to a price
per bushel, individual crushing facilities can compare
these numbers to data on their own production efficiency
to determine the profitability of processing – this
calculation is referred to as the Gross Processing Margin
(GPM) or “Crush.”
To Calculate the Crush or GPM
[(Price of Soybean Meal ($/short ton) x .022) + Price of
Soybean Oil (¢/lb) x 11] – Price of Soybeans ($/bu.)
Typically, crushing activity is expanded or reduced to
maintain sufficient profitability; the GPM is used to
gauge the relative profitability of processing. When the
processing margin exceeds processing costs, crushers
will most likely process more soybeans; when the margin
falls below processing costs, processors may scale back
their operations.
To manage the risks of changing crush margins or GPM,
processors will often use the Board Crush as a hedge.
The Board Crush uses the same calculations but with
futures prices instead of the cash market prices used in
calculating the GPM.
An Example of Calculating the Board Crush
To illustrate the calculation of the Board Crush, assume
the following prices and values for November/December
futures contracts:
November Soybean futures: $9.44 per bushel (5,000 bushels)
December Soybean Meal futures:
$304 per short ton (100 short tons)
December Soybean Oil futures: $0.3358 per pound (60,000 pounds)
Step 1 – Convert prices into dollars per bushel:
Soybean Meal: $304.00 x .022 = $6.69 per bushel
Soybean Oil: $0.3358 x 11 = $3.69 per bushel
Step 2 – Subtract the cost of soybeans from the
combined sales value of the products:
Soybean Meal + Oil ($6.33 + $3.66): $10.38
– Soybeans – $9.44
Board Crush $0.94

cmegroup.com/soybeancrush
4
CRUSH SPREAD TERMINOLOGY
The difference between the price of soybeans and the
combined sales value of soybean meal and oil can vary
over time. Expectations about the behavior of the spread
offer different trading strategies, depending upon whether
one expects the difference to “widen” or “narrow.”
• A narrowing Board Crush spread occurs when the price
of Soybean futures rises relative to the combined sales
price of Soybean Oil and Meal futures. When this occurs,
the spread declines. A trader expecting a narrowing
crush spread sells the Board Crush spread (put on the
Board Crush) – buying Soybean futures and selling
Soybean Meal and Soybean Oil futures.
• Note that the position you take in the soybean products
(soybean meal and soybean oil) is the same position
you are taking with the crush.
• A widening Board Crush spread occurs when the
combined sales price of Soybean Oil and Meal futures
rise relative to the price of Soybean futures. When
this occurs, the spread increases. A trader expecting a
widening crush spread buys the Board Crush (put on
the reverse Board Crush) – selling Soybean futures and
buying Soybean Meal and Oil futures.
The difference between the price of soybeans and the combined sales value of soybean meal and oil can vary over time.
Soybean Crush Reference Guide
5
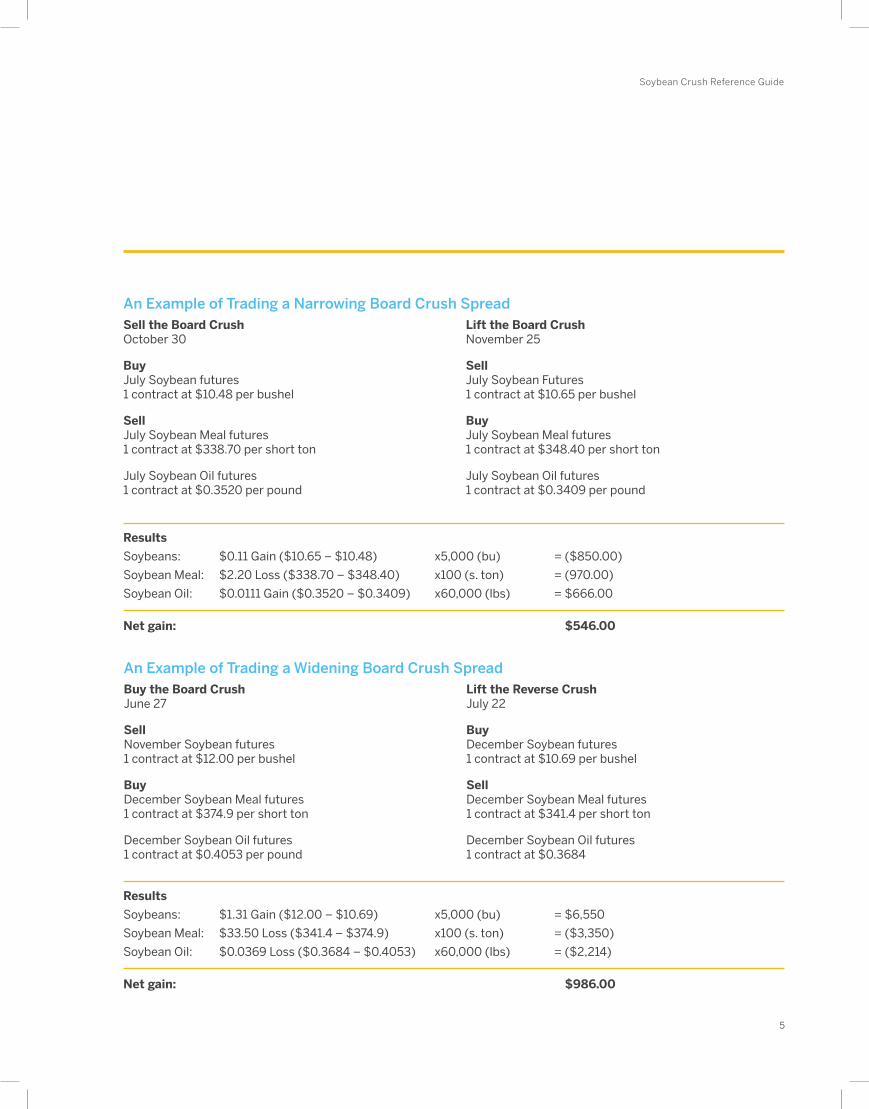
An Example of Trading a Narrowing Board Crush SpreadSell the Board CrushOctober 30
BuyJuly Soybean futures1 contract at $10.48 per bushel
SellJuly Soybean Meal futures1 contract at $338.70 per short ton
July Soybean Oil futures1 contract at $0.3520 per pound
Lift the Board CrushNovember 25
SellJuly Soybean Futures1 contract at $10.65 per bushel
BuyJuly Soybean Meal futures1 contract at $348.40 per short ton
July Soybean Oil futures1 contract at $0.3409 per pound
An Example of Trading a Widening Board Crush SpreadBuy the Board CrushJune 27
SellNovember Soybean futures1 contract at $12.00 per bushel
BuyDecember Soybean Meal futures1 contract at $374.9 per short ton
December Soybean Oil futures1 contract at $0.4053 per pound
Lift the Reverse CrushJuly 22
BuyDecember Soybean futures1 contract at $10.69 per bushel
SellDecember Soybean Meal futures1 contract at $341.4 per short ton
December Soybean Oil futures1 contract at $0.3684
Results
Soybeans: $0.11 Gain ($10.65 – $10.48) x5,000 (bu) = ($850.00)
Soybean Meal: $2.20 Loss ($338.70 – $348.40) x100 (s. ton) = (970.00)
Soybean Oil: $0.0111 Gain ($0.3520 – $0.3409) x60,000 (lbs) = $666.00
Net gain: $546.00
Results
Soybeans: $1.31 Gain ($12.00 – $10.69) x5,000 (bu) = $6,550
Soybean Meal: $33.50 Loss ($341.4 – $374.9) x100 (s. ton) = ($3,350)
Soybean Oil: $0.0369 Loss ($0.3684 – $0.4053) x60,000 (lbs) = ($2,214)
Net gain: $986.00

cmegroup.com/soybeancrush
6
TRADING THE BOARD CRUSH SPREAD
CME Group supports execution of Soybean Board Crush
spread transactions on CME Globex. Execution of crush
spreads can be completed via legging into the crush
(trading each of the individual components) or by trading
the Exchange defined Soybean Board Crush spread,
which is the relationship between the three components
(CME Globex Commodity Code: SOM). Traders within this
spread may be matched with others trading the other
side of the Soybean Board Crush spread or matched
with traders trading the outright markets for Soybean,
Soybean Meal, and Soybean Oil futures. This is possible
due to implied functionality. Outright orders in the
Soybean, Soybean Meal and Soybean Oil futures are used
to create implied Soybean Crush orders along with the
actual Soybean Board Crush spread orders entered into
CME Globex. Trades will be matched only in the specified
fixed ratio of contracts. Implied crush bids are rounded
down to the nearest tick and implied crush offers are
rounded up to the nearest tick. Explicit Soybean Board
Crush spread orders entered into CME Globex are
calculated as implied orders into the Soybean, Soybean
Meal and Soybean Oil futures markets. Although theses
bids and offers are eligible for trade execution, these
quotes will not be publicly displayed or disseminated.
Although the previous examples have used a one-to-one-
to-one ratio of futures contracts (one Soybean futures
contract, one Soybean Meal futures contract and one
Soybean Oil futures contract), the Board Crush (and
reverse Board Crush) can also be traded as a spread in
which a bid or offer is made for a particular crush value
rather than making individual trades in each of the spread
legs. The crush spread is based on a ratio of contracts
that more accurately approximates the equivalent yields
of soybean meal and oil generated from one bushel of
soybeans. When trading the Board Crush or the reverse
Board Crush spreads, the trader buys or sells the
equivalent of 50,000 bushels of each commodity (after
using the unit conversion factors previously discussed),
or 10 Soybean futures contracts, 11 Soybean Meal futures
contracts and 9 Soybean Oil futures contracts. This is the
smallest ratio of contracts that accurately represents the
equivalent yields of the three commodities.
The Board CrushSoybeans: 50,000 bushels = 10 Soybean futures
contracts (at 5,000 bushels/contract)
Soybean Meal: 50,000 bushels of soybeans x 44 lbs/48% Meal = 2,200,000 lbs of meal 2,200,000 lbs/2,000 lbs/short ton = 1,110 short tons of meal = 11 Soybean Meal futures contracts (at 100 short tons/contract)
Soybean Oil: 50,000 bushels of soybeans x 11 lbs of oil = 550,000 lbs of oil 550,000 lbs/60,000 lbs/futures contract = 9 Soybean Oil futures contracts (approximate)2
2 Trading the crush in a single 50,000 bushel unit results in under-hedging the soybean oil component of the crush by 10,000 lbs.3 Not all ISVs provide an auto-spreader.

Soybean Crush Reference Guide
7
Options on the Soybean Board Crush spread allow market participants to efficiently establish a crush spread position
using a single contract. In addition, buyers of crush spread options do not face the margin requirements necessary in
trading an outright futures spread.
Contract Features
• Contract size: 50,000 bushels
• Price basis: Dollars and cents per bushel
• Strike price increment: 2 cents per bushel (e.g. 44, 46, 48, 50, 52)
• Tick size: One-eighth (1/8) of one cent per bushel, $0.00125 per bushel or $62.50 per contract.
• Daily price limit: There is no price limit on any day.
• Contract months: Eight standard delivery months with the following soybean crush spread combinations (note:
October and December crush options are based on November Soybeans since no Soybean futures contracts are listed
for those months):
Soybeans Jan. Mar. May July Aug. Sept. Nov. Nov.
Meal/Oil Jan. Mar. May July Aug. Sept. Oct. Dec.
Crush Options Jan. Mar. May July Aug. Sept. Oct. Dec.
Soybean Crush Spread option contracts offer the buyer of the option the right, but not the obligation, to “buy” or “sell”
the crush at a specific strike price. The strike price for a crush option contract can be thought of as the value of the
crush, or the GPM.
• A buyer of a Soybean Crush Spread call option has the right to buy the crush – to go long eleven (11) Soybean Meal
futures contracts, long nine (9) Soybean Oil futures contracts, and short ten (10) Soybean futures contracts.
• A buyer of a Soybean Crush Spread put option has the right to sell the crush – to go short eleven (11) Soybean Meal
contracts, short nine (9) Soybean Oil contracts, and long ten (10) Soybean futures contracts.
OPTIONS ON THE SOYBEAN BOARD CRUSH SPREAD

cmegroup.com/soybeancrush
8
Contract Expiration
Only buyers of calls and buyers of puts have the right
to exercise their option contract into a futures position
on any day during the life of the option. Upon exercise,
the entry price at which these positions are recorded
is determined by the crush spread calculation and the
strike price of the option purchased. The strike price, or
crush value, is subtracted from the sum of the prices of
soybean meal and oil (converted into dollars and cents
per bushel); this calculation yields a “synthetic” price
at which the buyer of the option will be exercised into
Soybean futures contracts. Since the prices of soybean
meal and oil must be converted into dollars and cents
to perform the crush value calculation, these prices are
rounded so that, in conjunction with the crush option
strike price, they always yield a synthetic Soybean futures
contract priced in dollars, cents and quarters-of-a-cent
per bushel.
Only buyers of calls and buyers of puts have the right to exercise their option contract into a futures position on any day during the life of the option.
Contract Advantages
The efficiencies afforded by the crush spread option
contract allow added flexibility in trading the Soybean
Board Crush. Specifically, crush spread options can be
used to:
• Set a “floor” or minimum price for the Soybean Board
Crush, which allows traders to lock in a predetermined
GPM in advance of cash market purchases and sales.
To establish a floor price, a trader would purchase a
Soybean Board Crush spread put option.
• Set a “ceiling” or maximum price for the Soybean
Board Crush for those with increasing-price risk
exposure or traders seeking to profit from a favorable
reverse crush opportunity. To establish a ceiling price, a
Soybean Board Crush spread call option is purchased.
• Establish a price range for the crush, but allow for
variation within that range, by buying a put and
simultaneously selling a call. This allows traders and
processors to estimate crushing margins within a known
range, but also participate in favorable price moves.
• Enhance trading revenue by writing (selling) either call
or put options.
8

Soybean Crush Reference Guide
9
An Example of the Soybean Crush Spread Option Exercise Process
To illustrate the positions a buyer of a December $0.84 crush spread call option contract would receive upon exercise,
assume the following prices and values for November/December futures contracts:
November Soybean futures: $9.52 per bushel (5,000 bushels)
December Soybean Meal futures: $306.30 per ton (100 tons)
December Soybean Oil futures: $0.3327 per pound (60,000 pounds)
Step 1 – Round prices
Soybean Meal: Round to nearest $2.50 per ton
$306.30 per ton = $307.50
Soybean Oil: Round to nearest $0.0025 per pound
$0.3327 per pound = $0.3325
Step 2 – Convert Prices into dollars per bushel
Soybean Meal: $307.50 x .022 = $6.765 per bushel
Soybean Oil: $0.3325 x 11 = $3.6575 per bushel
Step 3 – Calculate assigned soybean futures price
Soybean Meal rounded price = $6.765/bu.
+ Soybean Oil rounded price = +$3.6575/bu.
– Crush option strike price = – $0.97/bu.
Assigned Soybean futures price $9.4525/bu.
Therefore, the buyer of the call option is assigned:
Long 11 Soybean Meal futures contracts at $307.50 per short ton
Long 9 Soybean Oil futures contracts at $3325 per pound
Short 10 Soybean futures contracts at $9.4525 per bushel

cmegroup.com/soybeancrush
10
An Example of Buying a Soybean Crush Spread Put Option
Assume that on September 3, a crusher decides to lock in
upcoming purchases of soybeans and the combined sales
of soybean meal and oil by buying a $0.84 December
Soybean Crush put option for $0.0250.
The Crusher’s account is debited for the purchase of the
December 84 Soybean Crush put option in the amount of
$0.0250 per bushel or $1,250.00 per contract ($0.0250 x
50,000 bushels).
Scenario #1: Offset on October 12, Prior to Expiration
The crusher decides to lift the hedge to coincide with the
cash market purchases and sales. With the Board Crush
currently trading at $0.80, the December 84 Soybean
Crush spread put option is in-the-money. The crusher
sells the put for $0.0425 per bushel or ($0.0425 x
50,000) $2,125.
The net return for this hedge would be the $2,125 return
minus the cost to purchase the option, $1,250.00, or
$875 ($0.0175/bu. x 50,000 bushels).
Scenario #2: Exercise at Expiration, Hold Resulting
Futures and Offset on October 21
Trading expires in the December Soybean Crush Spread
option with the December 84 put option in-the-money.
The put option is automatically exercised into Soybean,
Soybean Meal and Soybean Oil futures positions.
Settlement values for the underlying futures contracts are:
December Soybean Meal: $272.90 per short ton
December Soybean Oil: $0.3420 per pound
November Soybeans: $8.92 per bushel
The crusher is assigned positions with rounded values
for Soybean Meal futures (to the nearest $2.50 per
short ton) and Soybean Oil futures (to the nearest
$0.0025 per pound):
Short 11 December Soybean Meal contracts at $272.50
per short ton Short 9 December Soybean Oil contracts at
$0.3425 per pound
The crusher also receives a Soybean futures position;
the assigned price for this leg is determined by using the
rounded prices for soybean meal and oil and the crush
option strike price:
($272.50/short ton x .022) + ($0.3425/lb. x 11) –
$0.84/bu. = $8.9225
Therefore, the position assigned is: Long 10 November
Soybean contracts at $8.9225

Soybean Crush Reference Guide
11
On October 24:
The crusher decides to liquidate the assigned positions in Soybean, Soybean Meal and Soybean Oil futures the next
week at the following prices:
December Soybean Meal: $272.80 per short ton
December Soybean Oil: $0.3415 per pound
November Soybeans: $8.955 per bushel
Offsetting positions at these prices, the hedger earned:
Soybean Meal: Short at $272.50/short ton, offset (buy back) at $272.80/short ton =
$0.3/short ton loss or $30/contract ($0.20 x 100 short tons)
Soybean Oil: Short at $0.3425/lb, offset (buy back) at $0.3415/lb. =
$0.0010/lb. profit or $60/contract ($0.001 x 60,000 lbs.)
Soybeans: Long at $8.9225/bu., offset (sell back) at $8.955/bu. =
$0.0325/bu. profit or $162.50/contract ($0.0325 x 5,000 bu.)
The total profits from these positions are calculated as follows:
Soybean Meal rounded price = $6.765/bu.
Meal: ($20)/contract x 11 contracts = ($220)
+ Oil: $60/contract x 9 contracts = $540
+ Soybeans: $112.50/contract x 10 contracts = $1,125
Total Profit $1,445.00
The net return for this hedge would be $195 or $0.0039 per bushel (the $1,445.00 return minus $1,250, the cost to
purchase the option).
Introduction to Hedging with Dairy Futures and Options
11

cmegroup.com/soybeancrush
12
SUMMARY
CME Group options and futures contracts on the Soybean
Board Crush Spread provide market participants with
several efficient vehicles for both commercial hedging
and position trading. CME Group Soybean Crush
Spread contracts also have significantly lower margin
requirements, as the spread is generally less volatile than
the prices themselves.
cmegroup.com/agriculture
12
For more information on Soybean Crush spreads, visit cmegroup.com/soybeancrush.


Futures trading is not suitable for all investors, and involves the risk of loss. Futures are a leveraged investment, and because only a percentage of a contract’s value is required to trade, it is possible to lose more than the amount of money deposited for a futures position. Therefore, traders should only use funds that they can afford to lose without affecting their lifestyles. And only a portion of those funds should be devoted to any one trade because they cannot expect to profit on every trade.
All references to options refer to options on futures.
CME Group is a trademark of CME Group Inc. The Globe logo, CME, Chicago Mercantile Exchange, E-mini and Globex are trademarks of Chicago Mercantile Exchange Inc. CBOT and Chicago Board of Trade are trademarks of the Board of Trade of the City of Chicago. NYMEX, New York Mercantile Exchange and ClearPort are trademarks of New York Mercantile Exchange Inc. COMEX is a trademark of Commodity Exchange Inc. All other trademarks are the property of their respective owners.
The information within this brochure has been compiled by CME Group for general purposes only. CME Group assumes no responsibility for any errors or omissions. Although every attempt has been made to ensure the accuracy of the information within this brochure, CME Group assumes no responsibility for any errors or omissions. Additionally, all examples in this brochure are hypothetical situations, used for explanation purposes only, and should not be considered investment advice or the results of actual market experience.
All matters pertaining to rules and specifications herein are made subject to and are superseded by official CME, CBOT and CME Group rules. Current rules should be consulted in all cases concerning contract specifications.
Copyright © 2015 CME Group. All rights reserved.

PM1438/00/0415
CME GROUP GLOBAL OFFICES
Chicago New York London +1 312 930 1000 +1 212 299 2000 +44 20 3379 3700
Singapore Calgary Hong Kong+65 6593 5555 +1 403 444 6876 +852 2582 2200
Houston São Paulo Seoul+1 713 658 9292 +55 11 2565 5999 +82 2 6336 6722
Tokyo Washington D.C.+81 3242 6232 +1 202 638 3838
CME GROUP HEADQUARTERS
20 South Wacker DriveChicago, Illinois 60606cmegroup.com


![[CBOT] CBOT Soybean Crush Reference Guide](https://img.dokumen.tips/doc/110x75/577d2f891a28ab4e1eb1fe36/cbot-cbot-soybean-crush-reference-guide.jpg)