Embed Size (px)
Citation preview

Federal Government of Ethiopia
Ministry of Finance and Economic Development
SOUTHERN NATIONS & NATIONALITIES PEOPLES’ (SNNPRG) REGIONAL
GOVERNMENT PEFA ASSESSMENT REPORT
FWC Beneficiaries 2009 – Europe Aid/127054/C/SER/Multi
LOT No 11 – PEFA Ethiopia
October 17, 2010 (Final)
Programme financed by the European Commission Project implemented by
IDC - SAFEGE Group
Subsidiary of SUEZ
ENVIRONMENT
And
LINPICO (France)

Southern Nations and Nationalities Peoples’ Regional Government –
PEFA Assessment
Page i
This report does not necessarily reflect the views of the EU, IDC, LINPICO or the views of
the PEFA Secretariat in Washington DC.

Southern Nations and Nationalities Peoples’ Regional Government –
PEFA Assessment
Page ii
Table of contents
Abbreviations and Acronyms iii
SUMMARY ASSESSMENT 1
(i) Integrated Assessment of PFM Performance 1
1. Introduction 5
1.1. Objective 5
1.2. Process of preparing the report 5
1.3. Scope of the Assessment 6
2. SNNPR Background Information 7
2.1. General Information 7
2.2 Description of Budgetary Outcomes 8
2.3. Legal and Institutional Framework for PFM 9
3. Assessment of the PFM Systems, Processes and Institutions 13
3.1. Introduction 13
3.2. Budget Credibility 13
3.3. Comprehensiveness and transparency 20
3.4. Policy based budgeting 33
3.5. Predictability and control in budget execution 38
3.6 Accounting, recording and reporting 63
3.7. External oversight and legislative scrutiny 69
3.9. Predictability of Transfers from Federal Government 78
4. Government reform process 80
4.1 Recent and on-going reforms 80
4.2 Institutional factors supporting reform planning and implementation 80
Annex A: Calculation of Performance Indicator Two on Budget Variance 81
Annex B: External Assistance and Loans Template: ETB 84
Annex C: List of People Met 85

Southern Nations and Nationalities Peoples’ Regional Government –
PEFA Assessment
Page iii
Abbreviations and Acronyms
SNNPR
SNNPRG
SNNPRS
Southern Nations and Nationalities Peoples’ Region
Southern Nations and Nationalities Peoples’ Regional Government
Southern Nations and Nationalities Peoples’ Regional State
BOFED Bureau of Finance and Economic Development
BPR
COA
Business Process Re-engineering
Chart of Accounts
CTA
CBE
Central Treasury Account
Commercial Bank of Ethiopia
ETB Ethiopian Birr
EMCP
FAPMD
FDRE
GF
Expenditure Management and Control Programme
Financial Administration and Property Department
Federal Democratic Republic of Ethiopia
Global Fund
IBEX
IAD
Integrated Budget and Expenditure System
Internal Audit Department
JBAR
NBE
ORAG
Joint Budget and Aid Review
National Bank of Ethiopia
Office of Regional Auditor General
PEFA Public Expenditure and Financial Accountability
PFM Public Finance Management
PBS
PI
Protection of Basic Services
Performance Indicator
PSCAP
RA
TOFED
TSA
WOFED
VAT
ZOFED
Public Sector Capacity Building Programme
Revenue Authority
Town Administration Office of Finance & Economic Development
Treasury Single Account
Woreda Office of Finance & Economic Development
Value-Added Tax
Zonal Administration Office of Finance & Economic Development

Southern Nations and Nationalities Peoples’ Regional Government–
PEFA Assessment
Page 1
SUMMARY ASSESSMENT
(i) Integrated Assessment of PFM Performance
This sub-section summarizes Chapter 3 in terms of the six core dimensions of PFM
performance and donor practices. The “Credibility of the Budget” core dimension
represents the “outcome” core dimension, reflecting the influences of the other five core
dimensions plus donor practices (as indicated in the flow chart in page 4 of the PEFA
Framework document). The indicator-by-indicator scores are reproduced in the
summary table at the end of this section.
As measured under Performance Indicators (PIs) 1-4, the budget appears to lack
predictability and therefore credibility, with both PI-1 and PI-2 scoring D. Even though
the budget preparation process appears sound (PI-11), there are significant deviations
between actual and budgeted expenditures (according to the approved budget) for many
of the public bodies. The unpredictability may be overstated to an extent, as the
contingency item may be used in part for transfers to lower level governments, and, in
the case of negative deviations, may represent advances to contractors that have yet to
be retired and regularized as expenditures. It should be noted that BOFED’s views (as
well as the views of the BOFEDs in the other regions assessed) on the predictability of
the budget differ somewhat from the assessment team, as the reference point of
comparison tends to be the “adjusted” budget, rather than the originally approved
budget.
Strong positive factors supporting budget credibility are:
The Expenditure Management and Control Programme (EMCP), under which PFM
reforms have been designed and implemented over the last several years, focused on
putting in place the basic nuts and bolts of a well-functioning PFM system:
• Strengthened budget preparation, execution, revenue administration (though
recording and collection of tax debts remains a challenge – PI 15), cash
management, recording, reporting and accounting systems: PIs 11, 13-17, 19,
22-25.
• Tight internal control systems (PIs 18 and 20), preventing the emergence of
domestic payments arrears. Such arrears can erode credibility of the budget as
the unpaid bills eventually have to be paid off at the possible expense of service
delivery programmes. The emerging internal audit function (PI-21) is beginning
to play an effective oversight role in relation to internal control systems. (Given
human resource capacity constraints, as highlighted in a recent assessment of
EMCP, it is understandable that managers in line ministries perhaps have
accorded higher priority to strengthening the basic components of the PFM
system, as listed above, than to developing the internal audit function).
• Strengthening external audit function (PI-26).

Southern Nations and Nationalities Peoples’ Regional Government –
PEFA Assessment
Page 2
Remaining challenges
A number of challenges, many of which are already being addressed, would help to
further strengthen the credibility and predictability of the budget. The basic “nuts and
bolts” of the PFM system are already in place, or close to being in place, as described in
the previous paragraph, are helping to enable the addressing of the remaining
challenges:
(i) Strengthening Comprehensiveness and Transparency of the Budget
• Including the elements under PI-6 (Comprehensiveness of information included
in budget documentation) that are not presently included in budget
documentation (e.g. stock of financial assets, explanation of budget implications
of new policies). More comprehensive and analytical budget documentation
submitted to the Economics Committee in the Regional Council would
strengthen the Committee’s ability to determine the extent that proposed budgets
are consistent with public policy objectives and priorities.
• Further increasing the proportion of donor-funded projects and programmes
funded through Channel 1 modalities and, within Channel 1, increasing the
proportion using the government’s budget classification system and other
elements of SNNPRG PFM’s system (budget execution mechanisms – including
procurement -- accounting and reporting, and external audit). While donor
project and programme funding is increasingly being integrated into the budget
preparation process (through increasing use of the Channel 1 funding modality
relative to the Channel 2 and 3 funding modalities), nevertheless, a significant
amount of public services appears to be funded outside the scrutiny of the
budget preparation process and is not being transparently reported on and
accounted for: PIs 7, D2 and D3.
• Further improving the comprehensiveness and transparency of information
provided to the public (i.e. meeting the currently unmet benchmarks listed under
PI-10, particularly timely provision of in-year budget execution reports and
publication of contract awards, audited financial statements and the audit reports
on budget entities). While comprehensiveness and transparency of information
provided to the public is strengthening, the ability of the public to demand
accountability from the government in the allocation of budgetary resources is
still limited.
• Strengthening the transparency of the procurement system (PI-19): Systems
appear not to be sufficiently in place for the recording of, and reporting on,
contracts awarded according to the type of procurement method, and the
justifications for using restrictive competitive procurement methods instead of
open competitive bidding. Transparency of budget execution is diminished as a
result and the public and legislature are not assured that inputs are being
procured in the most cost-effective manner.
(ii) Strengthening External Scrutiny:

Southern Nations and Nationalities Peoples’ Regional Government –
PEFA Assessment
Page 3
Strong demand by the legislature for accountability supported by an effective
external audit function can help to induce a strengthened supply of accountability by
the executive branch of government (through submission of draft budgets that are
clearly consistent with public policy objectives and priorities and through more
accurate, comprehensive and timely budget performance reports and annual
financial statements -- PIs 24-25):
• The quality of budget documentation currently submitted to the Economics
Committee in the Regional Council is reasonable – though it could be
further strengthened (PI-6) -- but the main challenge is to allow more time
for legislative debate on the draft budget documentation (PI-27).
• The quality of scrutiny by the Economics Committee/Regional Council of
the audited annual financial statements and the audit reports on budget
institutions is reasonable, but could probably be strengthened – capacity
permitting -- particularly with reference to the audit reports and to the
follow up of the implementation by budget institutions of recommendations
issued by the Regional Council.
(iii) Strengthening the medium-term perspective to the budgeting process:
Preparation of forward spending estimates that could help inform the rational setting of
annual budget ceilings is still in its early stages . Forward spending estimates, perhaps
in a programme budgeting framework that currently is being prepared by MOFED --
would support more accurate budgeting for the provision of public services under
existing policies, provide a basis for introducing new policies consistent with fiscally
realistic costed strategic plans, and strengthen linkages between proposed capital
expenditure and the future recurrent costs associated with this: (PI-12).
(ii) Prospects for reform planning and implementation
The PFM reform process has been underway for several years, through the EMCPand
the Public Sector Capacity Building Programme (PSCAP). The emphasis has been on
getting the basics of PFM right in terms of the mechanics of budget preparation,
revenue administration, budget execution, internal controls, cash management and
accounting and reporting. These mechanics are now more or less in place and will help
to enable the addressing of the remaining challenges as outlined above.

Southern Nations and Nationalities Peoples’ Regional Government –
PEFA Assessment
Page 4
Summary of Performance Indicator Ratings Note: Shaded areas represent M2 scoring methodology Overall I ii iii I
v A. Credibility of the Budget
PI-1 Aggregate expenditure out-turn compared to original approved budget M1
D D
PI-2 Composition of expenditure out-turn compared to original approved budget M1
D D
PI-3 Aggregate revenue out-turn compared to original approved budget M1
A
A
PI-4 Stock and monitoring of expenditure payment arrears M1 A A A B. Comprehensiveness and Transparency
PI-5 Classification of the budget M1 B B PI-6 Comprehensiveness of information included in budget documentation
M1 C C
PI-7 Extent of unreported government operations M1 B B B PI-8 Transparency of inter-governmental fiscal relations: M2 A A B A PI-9 Oversight of aggregate fiscal risk from other public sector entities
M1 B+ B A
PI-10 Public Access to key fiscal information M1 C C C ( i) Policy-Based Budgeting
PI-11 Orderliness and participation in the annual budget process M2 B+ A A C PI-12 Multi-year perspective in fiscal planning, expenditure policy and
budgeting M2 C C NA C C
C ( ii) Predictability and Control in Budget Execution
PI-13 Transparency of taxpayer obligations and liabilities M2 B▲ B▲ B▲ B▲ PI-14 Effectiveness of measures for taxpayer registration and tax
assessment M2 B▲ B B C▲
PI-15 Effectiveness in collection of tax payment M1 D+▲ NS C▲ D PI-16 Predictability in the availability of funds for commitment of
expenditures M1 B+ B A B
PI-17 Recording and management of cash balances, debt and guarantees M2
B NA B NA
PI-18 Effectiveness of payroll controls M1 B+ B A A B PI-19 Competition, value for money and controls in procurement M2 C D C B PI-20 Effectiveness of internal controls for non-salary expenditure M1 B B B B PI-21 Effectiveness of internal audit M1 C C C C
C ( iii) Accounting, Recording and Reporting
PI-22 Timeliness and regularity of accounts reconciliation M2 B+ B A PI-23 Availability of information on resources received by service delivery
units M1 B B
PI-24 Quality and timeliness of in-year budget reports M1 C+▲ C▲ A C▲ PI-25 Quality and timeliness of annual financial statements M1 C+▲ B▲ B C▲
C ( iv) External Scrutiny and Audit
PI-26 Scope, nature and follow-up of external audit M1 C+ C B B PI-27 Legislative scrutiny of the annual budget law M1 D+ A C D B PI-28 Legislative scrutiny of external audit reports M1 B B B B
D. Donor Practices
D-1 Predictability of Direct Budget Support M1 NA NA NA D-2 Financial info provided by donors for budget, reporting on project,
programme aid M1 D+ C D
D-3 Proportion of aid that is managed by use of national procedures M1 D D HLG-
1 Predictability of transfers from Federal Government to SNNPRG A A
Southern Nations and Nationalities Peoples’ Regional Government –
PEFA Assessment
Page 5
1. Introduction
1.1. Objective
. As stated in the terms of reference (TOR) issued by the EU, the objective of the PEFA
assessments is to gauge the quality of PFM at federal and sub-national level in Ethiopia.
As noted in the TOR “Aside from providing donors with an assessment of Ethiopia’s
PFM, it is intended that the information/analysis included in this PEFA will be of value
to the GoE in its own ongoing efforts to reform and improve the quality of its financial
management systems”. The SNNPR is one of the sub-national governments selected for
the study. The Ethiopian Government agreed to carry out the assessment in 2010 as part
of the dated covenants for the next phase of the donor-supported Protection of Basic
Services (PBS) project.
1.2. Process of preparing the report
A consultancy team of four was contracted to conduct PEFA assessments of the Federal
Government, Addis Ababa City Government, and five regions, including SNNPR. Two
of the consultants (Peter Fairman, international consultant, and Getachew Gebre, local
consultant) visited Awassa, SNNPR during the week of 15-19 March to conduct the
field work phase of the assessment. The main contact point was the Bureau of Finance
and Economic Development (BOFED) and many of the meetings were held there. The
team also met the Office of Regional Auditor General, the Regional Council, the
Revenue Authority, the Bureau of Education, the Bureau of Health, the Bureau of
Agriculture and Resource Development and the Bureau of Water Resources.
The first draft of the report was submitted to the EU in mid-May, 2010; it incorporated
additional information received from the Head of SNNPRG BOFED during the JBAR
conference in mid-April. A second draft was submitted to EU on 8 July, 2010, along
with the second drafts of the reports of the other regions covered by the PEFA exercise
and the integrated regional government report that the team leader prepared during June.
Detailed comments on the SNNPRG were provided by the PEFA Secretariat on 13
September (the World Bank and African Development Bank provided some general
comments on all the reports in early August), and by the SNNPRG BOFED and
Revenue Authority during the PEFA workshop held in Addis Ababa during 16-17
September (organized by MOFED). The team leader made a presentation, summarizing
the main findings of the regional government assessments.

Southern Nations and Nationalities Peoples’ Regional Government –
PEFA Assessment
Page 6
1.3. Scope of the Assessment
The assessment covers the regional bureaus/authorities/institutes and agencies in the
SNNPRG, as well as the Office of the Regional Auditor General (ORAG) and the
SNNPR Regional Council. A later study will assess the PFM systems in the woreda
governments. SNNPRG expenditure comprises about 20 percent of consolidated
SNNPRG, zonal administration, special woreda and woreda government (abbreviated as
SNNPRS – Southern Nations and Nationalities Peoples’ Regional State). This
percentage is much lower than in other regions, as, unlike other regions, zonal
administrations are not part of the regional government, but comprise the decentralized
level of government immediately below the regional government.
Under some of the indicators it is not possible to separate out SNNPRG activities from
SNNPRS activities: PI-5, PI-25 and PI-26. Furthermore, in relation to donor-financed
operations, it is not always easy to distinguish donor spending at SNNPRG level from
donor spending at lower levels of government.

Southern Nations and Nationalities Peoples’ Regional Government –
PEFA Assessment
Page 7
2. SNNPR Background Information
2.1. General Information 1
SNNPR is located in the south of Ethiopia, sharing borders with Oromia, Gambella,
Kenya and Sudan. It has a land area of 110,000 square kilometers, 10 percent of the
total land area of Ethiopia. Based on the 2003/04 Population and Housing Census, the
population of the region was estimated at 15.7 milllion in 2004, accounting for about 20
percent of the population of the country. At 142 persons per square kilometer, it is one
of the most densely populated regions in the country. As the name suggests, it is
multinational, consisting of 56 ethnic groups. The topography is diverse (high
mountains, valleys, rolling plains and lowlands, including part of the Rift Valley). It
has 7 big rivers. Agriculture is an important component of the economy and significant
mineral resource potential has been discovered.
SNNPR is divided into 13 zonal administrations, which, unlike the other regions, are
institutionally separate from the regional government (thus, only the regional bureaus
fall under the regional government). Within the zones fall 126 woreda governments and
urban administrations, which, under Ethiopia’s decentralized system of government,
have their own governing councils. In addition, there are 8 special woredas.
The structure of government is similar at all the different levels of government. The
regional equivalent of the federal Ministry of Finance and Economic Development
(MOFED) is the BOFED, located in Addis Ababa. Similarly, sector ministries at federal
level have their equivalents at regional government level in the form of 40 sector public
bodies (bureaus, authorities, institutes and agencies located in Awassa, the capital.
Zonal administrations/special woreda governments form the level of government
immediately below the regional government level. The zonal administration Office of
Finance and Economic Development (ZOFED) forms the equivalent of BOFED, while
sector offices form the equivalent of sector public bodies at regional government level.
At the next level of government down, woreda Offices of Finance and Development
(WOFED) and town administration Offices of Finance and Development (TOFEDs) are
the equivalent of ZOFEDs and sector offices are the equivalent of sector offices at the
zonal administration level.
Similarly, the external audit and legislative oversight function is broadly the same as at
federal government level. The external audit function is conducted by the Office of the
Regional Auditor General (ORAG), which covers all levels of government. The
legislative oversight function is conducted by the elected Regional Council.
Table 1, extracted from the 2007/08 (EFY 2000) budget proclamation summarises the
structure of public finances in SNNPRS.
1 This section is extracted from the SNNPR BOFED’s website (www.SNNPRbofed.gov.et). A very comprehensive regional atlas (both
physical and social geography) is also posted.

Southern Nations and Nationalities Peoples’ Regional Government –
PEFA Assessment
Page 8
Table 1: Structure of Public Finance in SNNPRS
Category ETB mill. %
Financial Resources 3,084.3 100
Fed. Govt. Subsidy (block grant) 2,627.9 85.2
Foreign loans & assistance via Fed. Govt 64.3 2.1
Tax revenue of region 340.2 11.0
Own revenue of public bodies 7.6 0.2
Foreign aid 1/ 44.3 1.4
Allocation of Resources 3,084.3 100
SNNPRG public bodies 2/ 514.3 16.7
Block grant to Zones & Woredas 1,900 61.5
Regional programmes 3/ 240 7.8
Contingency 430 13.9 1/ Mainly Irish Aid, also Netherlands aid.
2/ SNNPRG bodies comprise bureaus, authorities, institutes and agencies.
3/ Mainly donor-funded programmes (e.g. Local Investment grant (LIG), Water & Sanitation and Hygiene Programme (WaSH)).
Table 1 shows that 85 percent of financial resources represents the Federal Governmentt
block grant, SNNPRG expenditure (excluding regional programmes and contingency)
comprises 16.7 percent of total expenditure (a lower proportion than in other regions,
due to zonal administrations not being part of SNNPRG). Regional government
revenues, including public body own revenue, finance two thirds of SNNPRG public
bodies.
As with other regions, the SNNPRG takes its lead from the Federal Government in
relation to economic development strategies and government reform programmes. The
overall development strategy of the Federal Government is the “Plan for Accelerated
and Sustained Development to End Poverty, (PASDEP), 2005/06-2009/10”. A follow-
up is currently under preparation. SNNPR sector bureaus base their sector development
strategies on sector ministry strategies (particularly education, heath, agriculture, water
resources and roads), themselves based on PASDEP.
Implementation of development strategies requires effective government, for which a
well-functioning PFM system and a capable civil service are pre-requisites. The
Expenditure Management and Control Program (EMCP) and Public Sector Capacity
Building Programs, led by MOFED and Ministry of Capacity Building respectively,
which have been in existence for several years, are the main vehicles for implementing
PFM reform and strengthening capacity.
2.2 Description of Budgetary Outcomes
The mission requested budget and budgetary outcome data on a regional state-wide
level but did not receive it. So, it has not been possible to compile tables showing
budget outcomes in the same format as shown in the PEFA reports for Amhara (Amhara
National Regional State) and Oromia (Oromia National Regional State).

Southern Nations and Nationalities Peoples’ Regional Government –
PEFA Assessment
Page 9
Table 2 summarises regional government expenditure by broad economic classification.
The ratio of personnel expenses to total expenditure would be higher on a regional state
wide basis, as the labour-intensive public services tend to be delivered at lower levels of
government.
Table 2: Economic Classification of SNNPRG Expenditure
ETB millions 2007/08
Actual %
Total Expenditure 784 100.0
Personnel Services (61) 181 23.1
Goods and Services (62) 147 18.8
Fixed Assets & Construction (63) 418 53.3
Subsidies, investments & Other Payments (64) 38 4.8
Source: IBEX tables and end-year trial balance sheets. Excludes foreign-financed expenditures and fiscal transfers to lower level governments.
2.3. Legal and Institutional Framework for PFM
Legal framework for PFM
The legal framework for PFM is based entirely on the Federal government legal
framework for PFM: Financial Administration Proclamations (the latest for SNNPR is
2002/03 – EFY 1996), accompanying Financial Regulations, Annual Budget
Proclamations (including proclamations for supplementary budgets), Tax
proclamations, Procurement Proclamations and Proclamations concerning the Office of
the Auditor General (ORAG). These are all referred to Section 3 under the relevant
indicators.
Institutional Framework for PFM
Revenue and Expenditure
Tax System: The regional government shares some taxes (described in Section 3 under
PI-13) with the Federal Government. No revenue raising powers are assigned to zonal
administrations, special woredas and woreda governments, but these collect some
revenues on behalf of the regional government and (Agricultural Income tax and Rural
Land Use fees in particular), and in the interests of efficiency, retain a portion of them
as an offset to fiscal transfers due to them. A revised Tax Code Proclamation came into
force in 2002/03.
Internal and External Audit
Development of the internal audit function is one of the components of the EMCP. It is
described more fully under PI-21 in Section 3. A new proclamation with regard to the
external audit function was approved in 2005 (referred to in PI-26).
Southern Nations and Nationalities Peoples’ Regional Government –
PEFA Assessment
Page 10
Sub-National Governments
A new decentralized system came into force in the 1990s. The fiscal transfers aspect of
this is covered under PI-8 in Chapter 3.
Procurement
The responsibility for procurement was largely devolved to line ministries/bureaus in
2002/03 through proclamation. Procurement is discussed in Section 3 under PI-19.
Planning and Budgeting
Under the DSA project in the early 2000s, a new budget manual was prepared, based on
the Federal Government Manual. It finally came in effect in December 2007 (discussed
further in Section 3 under PI-11).
.
Budget Execution, Cash and Debt Management, Reporting and Accounting
Use of IT in PFM systems has gathered pace. It started out in the early 2000s through
the development of a computerised Budget Information System (BIS) for reporting on
budget performance and a Budget Disbursement and Accounting System (BDA) at
MOFED and BOFED level, both systems being stand-alone. These two modules were
then merged under the umbrella of an Integrated Budget and Expenditure Management
(IBEX) system, consisting of the following modules: budget, accounts, budget
adjustment, budget control, accounts consolidation and administration. The accounts
module manages the tracking of revenues and expenditures of public bodies:
specifically, it records the financial transactions of budgetary institutions, captures the
aggregated monthly accounting reports and provides accounting reports in the form of
ledgers, financial statements, management reports and transactions listings.
In recent years IBEX was rolled out to BOFEDs and during 2008/09 and, in particular,
since the beginning of 2009/10, it has been further rolled out to regional sector bureaus.
With regard to SNNPRG, electronic linkages between these bureaus and BOFED have
not, however, been developed yet and financial information is still transmitted by the
bureaus to BOFED through hard copy (CDs). Roll-out to 20 woredas is planned to start
during the current financial year through the oversight of zonal administrations.
In the meantime, the donor-financed IT project team located in MOFED is preparing an
upgrading of IBEX to IBEX 2. This has entered the testing phase. It is more user
friendly than IBEX 1.3. Roll out of the system to woreda governments is envisaged. A
further upgrading of IBEX 2 to an IBEX 3 is currently being discussed, through the
introduction of a performance program budgeting module, but, as the introduction of
programme budgeting is currently stalled, this would probably only happen in the
medium term.
PI-18 in Chapter 3 discusses budget execution control processes and issues in terms of
management of the payroll. PIs-16-17 discusses processes and issues in terms of cash
flow forecasting and cash management. PIs 22, 24 and 25 in Section 3 describe the
reporting and accounting systems and issues thereof.

Southern Nations and Nationalities Peoples’ Regional Government –
PEFA Assessment
Page 11
Business Process Re-engineering (BPR)
As in other regions, a major exercise during 2007/08 and 2008/09 instigated by the
federal government was studies in all bureaus to determine how to improve
administrative efficiency in support of strengthened PFM. Implementation of the
recommendations of BPR) commenced in 2008/09 and is still ongoing. Implementation
activities so far have included:
• Re-organisation of bureaus; e.g. in BOFED, the procurement, property
management and financial administration departments were combined, to form
the Financial Administration and Property Management Department, and
departments have been re-designated as “business processes” for the core
functions, such as budget preparation and financial administration, and
“supportive processes” for supporting functions such as human resource
management;
• Reduction in the number of signatures required for the implementation of a
process, such as procurement; (referred to under PI-20 in Section 3); and
• Increase in the numbers of positions in internal audit departments in order to
increase their effectiveness (referred to under PI-21 in Section 3).
.


Southern Nations and Nationalities Peoples’ Regional Government –
PEFA Assessment
Page 13
3. Assessment of the PFM Systems, Processes and
Institutions
3.1. Introduction
The following paragraphs provide the detailed assessment of the PFM indicators contained in
the PFM PMF framework. The summary of scores is based on actual performance and is
shown in the Summary Assessment above. The scoring methodology does not recognize
ongoing reforms or planned activities but these are summarized at the end of the discussion
on each section.
Each indicator contains one or more dimensions in order to assess the key elements of the
PFM process. Two methods of scoring are used. Method 1 (M1) is used for all single
dimensional indicators and for multi-dimensional indicators where good performance on one
dimension of the indicator is likely to undermine the impact of good performance on other
dimensions of the same indicator (in other words, by the weakest link in the connected
dimensions of the indicator). A plus sign is given where any of the other dimensions are
scoring higher.
Method 2 (M2) is based on averaging the scores of individual dimensions of an indicator. It is
prescribed for multi-dimensional indicators, where a low score on one dimension of the
indicator does not necessarily undermine the impact of a high score on another dimension of
the same indicator. A conversion table for 2, 3 and 4 dimensional indicators is used to
calculate the overall score. In both scoring methodologies, the ‘D’ score is the residual score
if the requirements for any higher score are not met. The PEFA handbook (“PFM
Performance Measurement Framework, June 2005, www.pefa.org) provides detailed
information on the scoring methodology.
An upward arrow (▲) shown against a score indicates: (i) small improvements in PFM
performance not yet captured by the indicators; and (ii) reforms implemented to date that have
not yet impacted on PFM performance.
3.2. Budget Credibility
Good practice in public financial management emphasizes the importance of the budget being
credible so that planned Government policies can be achieved. Budget credibility requires act
ual budgetary releases to be similar to voted budgets and requires appropriate fiscal discipline
to be in place. The indicators in this group assess to what extent the budget is realistic and
implemented as intended, particularly by comparing actual revenues and expenditures with
original approved ones, and analyzing the composition of expenditure outturn. The matrix
below summarizes the assessment of indicators relating to budget credibility.

Southern Nations and Nationalities Peoples’ Regional Government –
PEFA Assessment
Page 14
Assessment of Performance Indicators of Budget Credibility
No. Credibility of Budget Score Dimensions Scoring Methodology
PI-1 Aggregate expenditure outturn compared to original approved budget
D (i) D M1
PI-2 Composition of expenditure outturn compared to original approved budget
D (i) D M1
PI-3 Aggregate revenue out-turn compared to original approved budget
A (i) A M1
PI-4 Stock and monitoring of expenditure payment arrears A
(i) A (ii) A
M1
3.2.1. PI-1 Aggregate expenditure out-turn compared to original budget
The ability to implement the budgeted expenditure is an important factor in supporting the
government’s ability to deliver the public services for the year, as expressed in policy
statements, output commitments and work plans. The indicator reflects this by measuring the
actual total expenditure compared to the originally budgeted total expenditure (as defined in
government budget documentation and fiscal reports), but excludes two expenditure
categories over which the government will have little control: debt service payments and
donor-funded project expenditure.
In the case of Southern Nations and Nationalities Peoples’ Regional Government (SNNPRG),
debt service payments are zero as the stock of debt is zero; the Financial Administration Law
does not allow SNNPRG to borrow. Investment expenditure is divided into three categories:
domestically financed, externally financed through grant assistance and externally financed
through loans.2 The budget and budget performance tables prepared by SNNPRG clearly
distinguish between the three different types of investment expenditure financing, so adding
domestically-financed investment expenditure to recurrent expenditure is straightforward.
Annex A shows the original budgets for the SNNPRG bureaus, as approved by the SNNPR
Regional Council, for 2006/07, 2007/08 and 2008/09 and the actual outturns for these years.
The SNNPRG’s financial statements for 2008/09 were submitted to the Office of the Regional
Auditor General (ORAG) for audit in May, 2010.3 Total primary expenditure excludes fiscal
transfers to woreda governments from SNNPRG; as deviations of actual transfers from
budgeted transfers impact on the predictability of the woreda budget rather than the regional
bureau budget; in practice, however, actual transfers are very close to budgeted transfers.
Table 2 is extracted from Annex A and shows the aggregate deviation (in absolute terms) in
terms of percentage of the approved budget.
2 Externally-financed investment expenditure may include recurrent expenditure elements due to the nature of some projects.
The justification for excluding such expenditure from aggregate expenditure for the purposes of calculating PI-1 and PI-2 still holds, however, as SNNPRG still has less control over this type of expenditure than its own expenditure.
3 The years shown correspond to Ethiopian Fiscal Years (EFY) 1999, 2000 and 2001.

Southern Nations and Nationalities Peoples’ Regional Government –
PEFA Assessment
Page 15
Table 3: SNNPRG Regional Bureau Aggregate Expenditure Outturn and Approved Budget 1/
ETB millions 2006/07 Budget
2006/07 Outturn
2007/08 Budget
2007/08 Outturn
2008/09 Budget
2008/09 Estimate
Total Primary Expenditure 2/ 3/ 530 585 1095 785 1187 793 Deviation (%) 10.4% -28.3% -33.2%
1/ Years correspond to EFYs 1999-2001. 2/ Defined as total recurrent expenditure, less SNNPRG budget subsidies to woreda and urban administrations, less interest payments (which, in any case, are zero) plus domestically -financed investment expenditure. 3/ ORAG audit of 2007/08 statements nearing completion, 2008/09 statements not yet audited by ORAG.
Source: SNNPRG BOFED Accounting Department,
Table 2 indicate large negative aggregate deviations in 2007/08 and 2008/09. As mentioned in
Section 1, and elaborated upon under PI-2 below, the team leader (Peter Fairman) discussed
these findings with the BOFED Bureau Head during the JBAR conference (held April 12-16,
2010 at MOFED).
Score
Minimum Requirements
Justification Information Sources
D i) In two or all of the last three years actual expenditure deviated from budgeted expenditure by an amount equivalent to more than 15 percent of budgeted expenditure.
The deviations (in absolute terms) were 10.4%, 28.3% and 33.2% in 2006/07, 2007/08 and 2008/09 respectively.
SNNPRG BOFED Financial Administration and Property Management Department (FAPMD). Tables generated from IBEX.
3.2.2. PI-2 Composition of expenditure out-turns compared to original approved
budget.
Where the composition of expenditure varies considerably from the original approved budget,
the budget may not be a useful statement of policy intent. Measurement against this indicator
requires an empirical assessment of expenditure out-turns against the original budget at a sub-
aggregate level. The PI-2 indicator measures the extent to which reallocations between budget
lines have contributed to variance in expenditure composition beyond the variance resulting
from changes in the overall level of expenditure. The first step is to calculate the average of
deviations between actual allocations and budgeted spending at ministry/agency level as a
percentage of total budgeted expenditure. The second step is to subtract from this the
aggregate deviation, as measured in PI-1 (aggregate expenditure must be the same in both
cases).
The composition of budgeted and reported expenditure by administrative agency is shown in
detail in Annex A for 2006/07-2008/09. Table 3 shows the measurement of PI-2, extracted
from Annex A. 45
4 The deviations are explicitly shown for the 20 largest BIs in compliance with the PEFA Framework methodology. The deviations for the other 22
BIs, including for the contingency item, are aggregated together as the 21st item in the table. The scores would likely differ if the extent of
disaggregation was different (i.e. fewer or more than 20 BIs explicitly shown). The composition of the 20 largest BIs changed slightly over the three years For example, the SNNPR Pastoral Area Development Commission (code 214) and the Housing Development Project Office (code 23) are shown in the table for 2006/07 but not in the tables for the other years, while the Small Scale Enterprise Development Office (code 232) and the Work and Urban Development bureau (code 277) are shown in the tables for 2007/08 and 2008/09 but not in the table for 2006/07.

Southern Nations and Nationalities Peoples’ Regional Government –
PEFA Assessment
Page 16
Table 4: SNNPRG Regional Bureaus: Expenditure Composition Variance in Excess of Total Expenditure Deviation
Year For PI-1 Total expenditure deviation Composition expenditure variance
For PI-2 Variance > total deviation
2006/07 10.4 % 70.9 % 60.5% 2007/08 28.3 % 56.2 % 27.9% 2008/09 33.2 % 33.5 % 0.3 %
Source: SNNPRG BOFED. Deviations shown in absolute terms.
Deviations are large, both positive and negative, the expenditure variance exceeding 30
percent in each year. Most of the deviations are negative in 2006/07 and 2008/09 and positive
in 2007/08. As with Amhara and Oromia regions, the only budget institution (BI: bureaus,
authorities, offices/institutes) explicitly shown in Annex A that spends more than its
originally approved budget in all three years is the President’s Office (code 115). The only
BIs that spend less than their originally approved budget in all three years are the Arbaminch
Teachers’ Training College and the Mass Communications Enterprise.
In response to queries from the assessment team about the accuracy of the data (queries raised
during the JBAR week in mid-April), the BOFED sent (15 June, 2010) another set of tables
that indicate differences in some cases between: (i) the approved budget, as it appears in the
budget proclamations, and the approved budget, as entered into IBEX, particularly in the
cases of the education, health, agriculture, water resource development, and trade and industry
bureaus; and (ii) actual expenditure, as indicated by MOFED’s figures and as indicated under
IBEX. Comparability of the two sets of data is hindered by: (i) the re-submitted data
appearing, in some instances, to include foreign-financed capital expenditure with
domestically-financed capital expenditure, contrary to the methodology for scoring PIs 1-2;
and (ii) the re-submitted data covering only 17 bureaus/offices (the largest ones) out of 42.
bureaus/offices (the expenditure of these averaging 75 percent of total expenditure over the
three years). But, in any case, there appears to be no basis for changing the D rating.
Nevertheless, the re-submitted data did indicate a reason for large negative deviations in some
instances (particularly in the cases of the education, health and agriculture bureaus and South
Roads Authority) as a result of advances to contractors that had not yet been settled as the
invoices had not yet been received (due to the contracted works not being completed during
the fiscal year and thus being carried over to the following year). If the works had been
completed, the advances would have been cleared and thus recorded as expenditures, causing
the negative deviation to be smaller. Such kinds of deviations tend to exaggerate the
measurement of unpredictability under PI-2.
Adding these advances to the expenditures listed in the re-submitted data results in a sharply
reduced aggregate deviation, but a still large expenditure variance. The aggregate expenditure
deviations fall to -1.5, -4.9 and -27 percent for EFY 1999, 2000 and 2001 respectively,
resulting in a C rating for PI-1, instead of a D rating (but bearing in mind that the resubmitted
data do not cover all expenditures and are not necessarily directly comparable). Total
expenditure variance (sum of absolute deviations for each bureau) is estimated at 44, 27 and
42 percent respectively for the same three year), and so PI-2 (total expenditure variance less
5 I PI-2 in the PEFA Framework document is to be revised to take into account methodological issues that have arisen, particularly in the cases
when nearly all deviations have the same sign and the contingency is relatively large. A revised methodology might result in different scores for SNNPRG.
Southern Nations and Nationalities Peoples’ Regional Government –
PEFA Assessment
Page 17
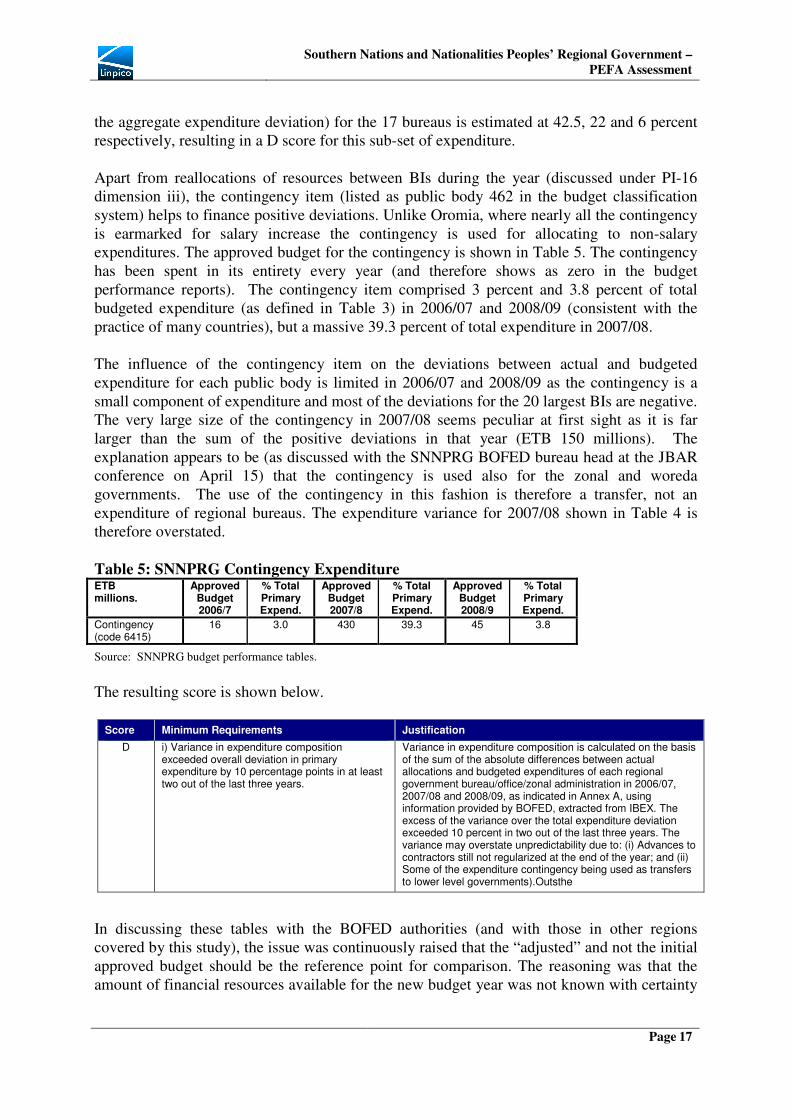
the aggregate expenditure deviation) for the 17 bureaus is estimated at 42.5, 22 and 6 percent
respectively, resulting in a D score for this sub-set of expenditure.
Apart from reallocations of resources between BIs during the year (discussed under PI-16
dimension iii), the contingency item (listed as public body 462 in the budget classification
system) helps to finance positive deviations. Unlike Oromia, where nearly all the contingency
is earmarked for salary increase the contingency is used for allocating to non-salary
expenditures. The approved budget for the contingency is shown in Table 5. The contingency
has been spent in its entirety every year (and therefore shows as zero in the budget
performance reports). The contingency item comprised 3 percent and 3.8 percent of total
budgeted expenditure (as defined in Table 3) in 2006/07 and 2008/09 (consistent with the
practice of many countries), but a massive 39.3 percent of total expenditure in 2007/08.
The influence of the contingency item on the deviations between actual and budgeted
expenditure for each public body is limited in 2006/07 and 2008/09 as the contingency is a
small component of expenditure and most of the deviations for the 20 largest BIs are negative.
The very large size of the contingency in 2007/08 seems peculiar at first sight as it is far
larger than the sum of the positive deviations in that year (ETB 150 millions). The
explanation appears to be (as discussed with the SNNPRG BOFED bureau head at the JBAR
conference on April 15) that the contingency is used also for the zonal and woreda
governments. The use of the contingency in this fashion is therefore a transfer, not an
expenditure of regional bureaus. The expenditure variance for 2007/08 shown in Table 4 is
therefore overstated.
Table 5: SNNPRG Contingency Expenditure ETB millions.
Approved Budget 2006/7
% Total Primary Expend.
Approved Budget 2007/8
% Total Primary Expend.
Approved Budget 2008/9
% Total Primary Expend.
Contingency (code 6415)
16 3.0 430 39.3 45 3.8
Source: SNNPRG budget performance tables.
The resulting score is shown below.
Score Minimum Requirements Justification
D i) Variance in expenditure composition exceeded overall deviation in primary expenditure by 10 percentage points in at least two out of the last three years.
Variance in expenditure composition is calculated on the basis of the sum of the absolute differences between actual allocations and budgeted expenditures of each regional government bureau/office/zonal administration in 2006/07, 2007/08 and 2008/09, as indicated in Annex A, using information provided by BOFED, extracted from IBEX. The excess of the variance over the total expenditure deviation exceeded 10 percent in two out of the last three years. The variance may overstate unpredictability due to: (i) Advances to contractors still not regularized at the end of the year; and (ii) Some of the expenditure contingency being used as transfers to lower level governments).Outsthe
In discussing these tables with the BOFED authorities (and with those in other regions
covered by this study), the issue was continuously raised that the “adjusted” and not the initial
approved budget should be the reference point for comparison. The reasoning was that the
amount of financial resources available for the new budget year was not known with certainty

Southern Nations and Nationalities Peoples’ Regional Government –
PEFA Assessment
Page 18
at the time of budget preparation, particularly in relation to the amount of retained revenue
that would be available (reflecting the fact that end-year revenue and expenditure
performance was not fully known while the budget was being prepared) and because the
projections of receipts of donor financing would not be firmed up.
The assessment team stressed that the initially approved budget should be the reference point,
not only because this is required by the PEFA Framework methodology, but also because
sector bureaus should ideally be confident at the beginning of the year that the approved
budget is a reliable guideline for indicating the financial resources that will be allocated to
them for implementing the approved budgets. This facilitates better planning for the delivery
of public services smoothly during the year. Revising the budget after the new fiscal year has
started reduces the length of the planning period, with possible adverse impact on the quality
of the public services that the bureaus are planning to deliver.
3.2.3. PI-3: Aggregate revenue out-turn compared to original approved budget
Accurate forecasting of domestic revenue is a critical factor in determining budget
performance, since budgeted expenditure allocations are based on that forecast. A comparison
of budgeted and actual revenue provides an indication of the quality of revenue forecasting.
The macro-fiscal department in the SNNPRG BOFED, in consultation with the Revenue
Bureau (that was separated from BOFED in 2001/02) is responsible for revenue forecasting,
using the Federal Government’s projections for inflation and real GDP growth (the macro-
fiscal department has yet to develop its own macro-fiscal capacity).
Table 6 (details in Annex 1) indicate that actual revenues have exceeded forecast revenues in
all the years under review, despite large increases in budgeted revenues each year, due in part
to strengthening tax administration. The over-performance of tax revenue indicates a
combination of inadequate forecasting (partly because Federal Government projections for
GDP growth may not be fully applicable to the regions), inherent uncertainty of forecasts in
an economy where weather-dependent agricultural activities play a large role, and
conservatism in forecasting.
Table 6: Southern Nations and Nationalities Peoples’ Regional Government: Revenue
Performance
2006/07 2006/07 2007/08 2007/08 2008/09 2008/09
ETB million Budget Outturn Diff. Budget Outturn Diff. Budget Outturn Diff.
Tax revenue 251.1 278.3 10.8% 352.4 405.5 15.1% 448.6 540.8 20.6%
Direct taxes (personal income, profits, cap. gains) 213.9 248.7 16.3% 308.6 362.5 17.5% 387.3 439.4 13.5%
Indirect taxes (excise, VAT, turnover, sales) 37.2 29.6 -20.4% 43.8 43.0 -1.8% 61.3 101.4 65.4%
Non-tax revenue (recurrent & capital) 68.9 60.5 -12.2% 82.4 92.4 12.1% 126.4 135.2 7.0%
TOTAL REVENUE 320.0 338.8 5.9% 434,8 497.9 14.5% 575.0 676.0 17.6%
Source: SNNPRG BOFED, Accounts Section, Financial Administration and Property Management Department.

Southern Nations and Nationalities Peoples’ Regional Government –
PEFA Assessment
Page 19
Score Minimum Requirements Justification
A i) Actual domestic revenue collection was below 97% of budgeted domestic revenue estimates in no more than one of the last three years.
Data provided by BOFED FAPMD.
3.2.4. PI-4: Stock and monitoring of expenditure payment arrears
This indicator is concerned with measuring the extent to which there is a stock of arrears, and
the extent to which the systemic problem is being brought under control and addressed.
A strong culture of paying bills on time (i.e. before they become overdue) is apparent in
Ethiopia, at both federal and regional level (at least in the case of the regions covered by the
team), in marked contrast to some other African countries. All wages and salaries are paid on
the 24th
of every month and invoices submitted by suppliers of goods and services are paid
within a few days (providing sufficient supporting documentation is provided, for example,
signed delivery receipts). Utility bills are paid on time, otherwise the utility companies cut off
the services.
At the end of the financial year, it may be the case that invoices were received too late to be
processed by year-end or have not yet been submitted, though the goods and services have
been delivered. In some regions (e.g. Oromia), a “grace period” of 30 days is formally
provided in respect of capital expenditures (Code 5001 in the Chart of Accounts), during
which time the invoices are paid; if not paid by the end of the grace period, the payables
become overdue (i.e. are in arrears). The SNNPRG does not do this, mainly because BOFED
considers it to be redundant, as virtually all bills are paid by year-end. As indicated in the trial
balances for SNNPRG for 2008/09, grace period payables at the end of 2008/9 were zero.
Apart from the grace period payables, the trial balances contains other types of accounts
payables, as coded in the Chart of Accounts: sundry creditors (code 5002), pension
contributions payable (code 5003), salary payable (code 5004), other payroll deductions (code
5005) and withholding tax payable (code 5006). Accounts payables in these other categories
amounted to zero the end of 2008/09. Although not recorded in IBEX, and therefore not
reflected in the trial balances sheets, manually-maintained subsidiary ledgers enable the
tracking of the age profile of these other kinds of payables. The roll-out of IBEX to the
regional bureaus is enabling quicker and more accurate recording and reporting of accounts
payables, and, in time, the manually-maintained subsidiary ledgers will be captured in IBEX. .

Southern Nations and Nationalities Peoples’ Regional Government –
PEFA Assessment
Page 20
Score Minimum Requirements
Justification Information sources
A (M1)
A i) The stock of arrears is low (i.e. is below 2 percent of total expenditure)
The SNNPRG has a culture of paying accounts payables on time. Grace period payables (COA code 5001) at the end of 2008/09 amounted to zero, thus the stock of arrears (payables still not paid by the end of the grace period) is zero. Other payables are usually paid on time, due to the culture of compliance with regulations (.e.g. the threat of cut-off of utility services).
-- Trial balance sheet for end-2008/09, the opening balance for 2009/10 and the trial balance sheet for the end of the first month of 2009/10. Provided by Head of FAPMD, SNNPR BOFED. -- Information provided by Head of FAPMD.
A (ii) Data on the stock of arrears is generated annually, but may not be complete for a few identified expenditure categories or specified budget institutions.
Arrears are only formally defined in terms of the grace period payables (COA code 5001) relating to payments due for goods and services received before the end of the year but not yet paid for (perhaps because the invoice has not yet been received or there is a contractual dispute). Payables unpaid at the end of the grace period represent payments arrears. IBEX does not as yet capture the age profiling of accounts payables other than the grace period payables, but these are captured by manually-maintained subsidiary ledgers. In time, as IBEX is rolled out, these will be captured in IBEX.
-- As above..
3.3. Comprehensiveness and transparency
The indicators in the Comprehensiveness and Transparency dimension of PFM assess to what
extent the budget and fiscal risk oversight are comprehensive, as well as to what extent fiscal
and budget information is accessible to the public. The matrix below summarises the
assessment of indicators under this dimension.
No. B: Cross-cutting issues: Comprehensiveness and
Transparency Score Dimensions Scoring
Methodology
PI-5 Classification of the budget B (i) B M1
PI-6 Comprehensiveness of information included in budget Documentation
C (i) C M1
PI-7 Extent of un-reported government operations B (i) B (ii) B
M1
PI-8 Transparency of inter-governmental fiscal relations A (i) A (ii) B (iii) A
M2
PI-9 Oversight of aggregate fiscal risk from other public sector entities
A (i) A(ii) A M1
PI-10 Public access to key fiscal information C M1
3.3.1. PI-5: Classification of budget
A robust classification system allows the tracking of spending on the following dimensions:
administrative unit, economic, functional and program.
The budget classification system at regional level is exactly the same as at the Federal level
(the Federal Government budget classification system is described in the Federal Budget
Manual, 2007, and the Federal Chart of Accounts manual, May 2007 and also in the SNNPR

Southern Nations and Nationalities Peoples’ Regional Government –
PEFA Assessment
Page 21
Budget Manual 2004), and so the score is the same as in the Federal PEFA assessment which
took place at the same time as the regional government assessments.6
The budget classification system at both Federal and regional level is on an administrative
basis grouped under three functions (Administrative Services (100), Economic Services (200)
and Social Services (300)), and, under each function, by sub-function (e.g. code 210
represents the sub-function of Agriculture and Natural Resources under the Economic
Services function and code 211 represents the Bureau of Agriculture and Rural Development
under this sub-function). The economic classification system (e.g. personnel emoluments) is
shown under each public body (and by sub-agency within each public body where relevant).
The budget classification system includes programme and sub-programme codes, though
these are not yet used, as programme budgeting has not yet been adopted.
The budget classification system does not correspond exactly to COFOG standards, but
broadly meets GFS standards (in terms of economic classification). A bridging table
matching MOFED budget classification codes to COFOG has not yet been developed,
although the IBEX system includes an application that would permit bridging; although the
functional codes and sub-functional codes differ from COFOG, the intent of public spending
is indicated in the codes. Thus, at least a B rating is warranted. An A rating (mapping to
COFOG sub-functions) may even be possible in principle, but to determine this would have
required the assessment team to review the IBEX application and there was not enough time
to do this.
Score Minimum Requirements
Justification Information Sources
B i) The budget formulation and execution is based on administrative, economic and functional classification using at least the 10 main COFOG functions, using GFS/COFOG standards or a standard that can produce consistent documentation according to those standards.
The budget classification system (as described in the Federal Government’s budget manual and Chart of Accounts manual) is on an administrative basis, with spending based on administrative units, the economic classification under each administrative unit and with each administrative unit classified according to function (three functions) and sub-function. A bridging table has not yet been developed to match the functional and sub-functional codes with COFOG, but the the codes currently in use clearly reflect the intent of public expenditure. In response to the 2001 GFS manual, MOFED, with technical assistance support from donors, developed an application under IBEX a few years ago that would facilitate the preparing of a bridging table. An A rating may be justified, but there was not enough time for the team to review the application..
-- Federal Budget Manual, January 2007
-- Federal Accounting System Manual, Volume 2, Chart of Accounts, May 2007. -- SNNPR Region Budget Guide, 2004, prepared by Budget Reform Team of SNNPRG and the donor-supported Decentralisation Support Activity project.
3.3.2. PI-6: Comprehensiveness of information included in budget
Annual budget documentation (annual budget and budget supporting documents) should
inform the executive, the legislative, and the general public and assist in informed budget
decision making and transparency and accountability. In addition to the detailed information
on revenues and expenditures, and in order to be considered complete, the annual budget
documentation should include information on the elements in the table below.
6 The draft budget manual was prepared by the Decentralisation Support Activity Project in 2004.

Southern Nations and Nationalities Peoples’ Regional Government –
PEFA Assessment
Page 22
The budget documentation submitted by BOFED to the SNNPR Regional Council consists of
the draft budget proclamation, explanations of the proclamation and the macro-fiscal
framework underpinning the budget. The detailed budget estimate document, which includes
expenditure by economic classification under each public body (and sub-agency within each
body) is not submitted7.
The main components of the draft budget proclamation (the approved one is more or less the
same) consist of:
• Summary of proposed appropriations according to regional bureau recurrent and
capital expenditure and subsidies to zonal administrations and special woredas
(according to domestic and external sources of financing;
• A summary table showing proposed recurrent and capital expenditure according to the
three main functions (administration and general services, economic services and
social services), subsidies to zonal administrations and special woredas and
contingency, and a summary of financing (tax and non tax revenue, federal
government subsidy, external assistance and loans, and retained earnings);
• A summary table showing proposed expenditure by function (3) and sub-function (16)
plus subsidies to zonal administrations/special woredas and contingency;
• A table of estimated revenues by line item according to the budget classification
system (e.g. line 1101, tax on wages and salaries);
• A table of estimated external assistance and loans by donor agency.
• Recurrent budget tables for the following year according to public body and sub-
agency (within each public body) by source of funding (Treasury and own-source
revenue), but not by economic classification within each public body.
• Capital budget tables for the following year according to projects under each public
body/sub-agency.
The explanations to the EFY 2003 (2010/11) draft budget proclamations contain the
following:
• Priority areas of the draft budget (e.g. education, health in support of MDGs);
• The assumptions underlying the the proposed provisions for recurrent and capital
expenditure.
• Comparison of the revenue estimates (including the federal government subsidy) for
the next financial year with the approved budget for the current financial year and the
11 month revenue outturn;
7 In any case, the detailed budget estimates document is not prepared any more (since 2-3 years ago), as is the case also with Oromia Region,
partly because it is not necessary, as it contains too much information to be easily digestible (the details are still available in soft copy under the IBEX system).

Southern Nations and Nationalities Peoples’ Regional Government –
PEFA Assessment
Page 23
• The stipulation of a requirement for all levels of government to publicize the budget
allocations.
The macro-fiscal framework documentation includes the following:
• Macro framework: Recent economic performance of the region, economic policies and
priorities, real GDP and inflation performance over the previous year, the current year
and the following year (i.e. the year covered by the draft budget).8
• Fiscal framework: Fiscal performance (financial resources received, expenditure
according to allocation) in recent years and projections (in aggregate terms) for the
next three years (the first of which is the year covered by the draft budget).
• Expenditure assignments and fiscal responsibilities of government structures of the
region (zones, woredas, cities/towns).
The GFS format of presenting the summary fiscal picture is not completely followed.
SNNPRG has no debt liabilities and is not allowed to borrow, so the issue of the correct
accounting treatment of debt amortization does not arise (it should appear ‘below-the-line’ as
a negative financing item, rather than as an expenditure item “above-the-line”). The revenue
estimates may include savings from the current budget year (“residual surplus” – line 1461 in
the budget classification system -- which is the excess of revenue and grants inflows over
expenditures), which is contrary to the GFS treatment, which classifies the use of such
savings as a ‘below-the-line’ financing item.9
During the budget preparation process, proposals for “new” expenditure initiatives (resulting
in new public services or expanded levels of services currently being provided) require
justification and, as part of this, projections of the future recurrent costs associated with
proposed new investments. But the budget documentation submitted to the Regional Council
does not mention new initiatives.
This indicator is assessed in terms of the following elements:
No. Item Available Source
1 Macro-economic assumptions, including at least estimates of aggregate growth, inflation and exchange rate
Yes
Macroeconomic and Fiscal Framework document presented to the Regional Council along with the draft budget proclamation. BOFED Annual Report for 2008/9 (EFY 2001), posted on www.snnprbofed.gov.et.
2 Fiscal deficit, defined according to GFS or other internationally recognized standard
No
The SNNPRG budget proclamation shows “residual surplus’ or “retained earnings” as a revenue source, but, according to GFS, this should be shown as a ‘below-the-line’ financing item.
3 Deficit financing, describing anticipated composition
No SNNPRG does not borrow, but may use retained earnings to finance a deficit. No,
8 The SNNPR BOFED’s annual report for 2008 (EFY 2001), posted on its website, describes the methodology for estimating regional GDP.
9 At first sight, it may seem inconsistent with GFS to show external loans as “above-the-line” rather than as financing items
‘below-the-line”, but the loans are the liability of the Federal Government, not the regional government; the funds are transferred to the regional governments.

Southern Nations and Nationalities Peoples’ Regional Government –
PEFA Assessment
Page 24
for the same reason as in 2.
4 Debt stock, including details at least for the beginning of the current year
Not applicable
SNNPRG does not borrow.
5 Financial Assets, including details at least for the beginning of the current year in a timely manner.
No
Financial assets consist of cash on hand and in the bank (COA codes 4101, 4103 and 4105), and accounts receivables (COA codes 4200-4299). Though reported on in the trial balance sheets, they are not mentioned in the budget documentation.
6 Prior year’s budget outturn, presented in the same format as the budget proposal
Yes Included in the documentation supporting the draft budget proclamation.
7
Current year’s budget (either the revised budget or the estimated outturn), presented in the same format as the budget proposal
No The 11 month revenue outturn for the current year is shown, but not the revised budget or estimated outturn.
8
Summarized budget data for both revenue and expenditure according to the main heads of the classifications used, including data for the current and previous year
Yes Same as 6.
9
Explanation of budget implications of new policy initiatives, with estimates of the budgetary impact of all major revenue policy changes and/or some major changes to expenditure programs
No Budget preparation process covers this issue but is not covered in the draft budget proclamation.
Score Minimum Requirements Justification
C i) Recent budget documentation fulfils 3 of the eight applicable benchmarks.
Explanation is provided above. Based on new information provided to the assessment team by the head of the BOFED’s FAPMD at the September 16-17 PEFA workshop in regard to the preparation of the EFY 2003 (2010/11) budget.
3.3.3. PI-7: Extent of unreported government operations
Annual budget estimates, in-year execution reports, year-end financial statements and other
fiscal reports for the public should cover all budgetary and extra-budgetary activities of
regional government to allow a complete picture of regional government revenue,
expenditures across all categories, and financing. This will be the case if (i) extra-budgetary
operations (regional government activities which are not included in the annual budget law,
such as those funded through extra-budgetary funds), are insignificant or if any significant
expenditures on extra-budgetary activities are included in fiscal reports, and if (ii) activities
included in the budget but managed outside the government’s budget management and
accounting system (mainly donor funded projects) are insignificant or included in government
fiscal reporting.
(i) Level of extra-budgetary expenditure (other than donor-funded projects), which
is unreported, i.e. not included in fiscal reports
It is difficult to dis-entangle extra-budgetary operations (EBOs) at regional bureau and
woreda level. The budget proclamations show external assistance and loans for the
consolidated regional government. The regional bureaus receive the support but some of this
may transferred to woreda government level and spent at that level.
Extra-budgetary operations (EBOs, excluding those of government-owned commercial
enterprises – only the SNNPR Water Works Enterprise -- which fall outside the scope of this
indicator) comprise:
Southern Nations and Nationalities Peoples’ Regional Government –
PEFA Assessment
Page 25
• Donor supported “Channel 1” Programmes: 10
These programmes represent
channeling of external funds from MOFED to BOFED, which then channels them to
sector bureaus. They are reflected in the SNNPRG capital budget and expenditure
reports, though not necessarily in the IBEX-generated budget performance reports, as
the programmes do not necessarily use the IBEX budget classification codes. The
Channel 1 donors comprise the multilateral agencies (except EU, which uses Channel
2, apart from its contributions to the multi-donor supported funds), Irish Aid, DFID
and multi-donor-supported funds, mainly the Water, Sanitation and Hygiene
Programme (WaSH).11
.12
• The Roads Fund: a donor-supported Federal Government Fund, from which funds are
disbursed to Rural Roads Authorities (South Road Authority in the case of SNNPRG)
in the regions for roads maintenance purposes. 13
This is a “Channel 2” fund: Channel
2 funds represent external funds channeled from sector Ministries at federal
government level (Ethiopian Roads Authority – public body code 273 - to Rural
Roads Authorities at regional government level). It is an EBO, as its planned and
actual incomes and expenditures are not included in the Federal government budget,
nor in the SNNPRG budget (except for the recurrent expenditures of the Roads Fund
Office itself), and thus the Fund constitutes an EBO at both federal and regional
government level. Its planned and actual operations are reported to the Regional
Council (and, where relevant, to the councils at lower levels of government), with
copies sent to BOFED).
• The Global Fund for HIV, Malaria and Tuberculosis, also a donor-supported Federal
Government programme under the Channel 2 aid disbursement modality (National
HIV/AIDS Prevention and Control Secretariat – code 345 – disburses directly to
health sector bureaus. The planned and actual incomes and expenditures of the Fund
are not included in either the Federal or the SNNPRG/lower level government
budgets and budget performance reports. It is therefore an EBO. The magnitude of
funding is very large, according to the Global Fund website (www.the
globalfund.org). In addition to reporting to the federal health ministry and HIV
Secretariat, the health bureaus/offices report to the Regional Council (and to councils
at lower levels of government, where relevant) on the operations of the Global Fund.
BOFED receives copies of these reports; the information is relevant for the
calculation of the block grant transfer to zonal administrations (see PI-8). Most of the
funds (90 percent according to the health bureau) are in fact distributed directly by the
10
As the funds are channeled through the federal government, they are classified here as domestic EBOs. 11
The Productive Safety Net Programme (PSNP), the Public Sector Capacity Building Programme (PSCAP), and the Food Security Programme (also known as the Household Package Programme) are part of Federal Government budgets and are reported on according to those budgets. The SNNPRG is effectively acting as a de-concentrated arm of the federal government in implementing these programmes.,
12 The donors that use Channel 1, either via MOFED to BOFED or direct to BOFED are: (i) UN Ex Com agencies, planning about US$9 million of
assistance for the next financial year, channeled directly to BOFED; 85 percent of this is from UNICEF (ii) World Bank, planning about $3 million; channeled through MOFED; (iii) ADB, planning about $2 million, channeled through MOFED; (iv) DFID, planning about $2 million, through MOFED; and (v) Irish Aid, planning about $1.5 million, through MOFED (though another information source told the assessment team that Irish aid would be zero during 2009/10)..
13 The Federal Government Roads Fund was established under Proclamation 66/1997 (2004 under Gregorian calendar) as a
permanent financial resource for roads maintenance and safety spending programmes. Through Proclamation 471/2005, it came under the jurisdiction of the Ministry of Works and Urban Development in the form of a semi-autonomous government agency. It is governed by a Roads Fund Board and managed by the Office of the Roads Fund. Its financial resources comprise: budget allocated by the Federal Government, roads maintenance fuel levy, annual vehicle licence fee, and axle overloading penalties.

Southern Nations and Nationalities Peoples’ Regional Government –
PEFA Assessment
Page 26
health bureau to zonal administration health offices, which are independent of the
regional government.
• Other Channel 2 donor-supported expenditure: The budget proclamations may
include Channel 2-type expenditure, though not necessarily all of it, and what is
included in the budget will not necessarily be reported on, thus constituting an
unreported EBO. Projects falling under Channel 2 are not captured in the Chart of
Accounts and are therefore not reflected in the expenditure reports generated through
IBEX. Neither is actual spending reported to BOFED through any other system.
Budget performance reports, if provided, may therefore understate actual
performance. BOFED claims that this type of Channel 2 expenditure is diminishing in
importance over time and was now likely to be very small relative to Channel 1
expenditure (though difficult to verify fully in the absence of full information on
Channel 2 expenditure).
• Non-tax revenues: Unreported EBOs in some countries are reflected in the spending of
Own Source Revenues (OSR) collected by government agencies that are not budgeted
for and not reported on. This is not the case at either the Federal or regional levels of
government in Ethiopia. With the exception of school and health care unit fees, which
can be retained and spent (as long as the proposed spending is reflected in the
approved budget), all own-source revenues must be surrendered to the SNNPRG
BOFED bank account. Revenues collected in excess of budgeted spending thereof
must be surrendered to SNNPRG’s treasury account. A comprehensive receipting
system (with receipts in triplicate at minimum – one copy for the client paying the
revenue, one copy for the government agency, and one copy for the Treasury) helps
guard against spending of NTR collected by a government agency that is not covered
in the approved budget and against the non-submission to the Treasury of NTR
collected in excess of the amount that can legally be spent.
(ii) Income/expenditure information on donor-funded projects which is included in
fiscal reports
This dimension refers only to donor-funded projects in the case where there is a direct
agreement between the donor and SNNPRG (i.e. the funds are not channeled through the
federal government). Channel One funds represent monies channeled by the donor agency
directly through BOFED and the receipt and spending thereof are partially captured in the
approved budget and budget execution reports (COA codes 2000-2999 under the External
Assistance category); the UN EXCOM funds (mainly UNICEF) funds fall into this category
(see footnote 11).
Channel Two funds represent monies transferred by donors directly to sector bureaus, which
are in charge of the financial management of the projects. The planned receipt and spending
may or may not be captured in the approved budget, but are likely not to be reported,
therefore representing EBOs. BOFED considers this type of funding to be small, Japan being
the main example.
Channel Three funds represent donor operations, including NGO operations, where the
donor/NGO is implementing a project directly, with no funding passing through the relevant
sector bureau. With regard to donor agencies, USAID falls into this category, according to
Southern Nations and Nationalities Peoples’ Regional Government –
PEFA Assessment
Page 27
BOFED, through its assistance to some health and education projects. Reports on income and
spending may or may not be sent to the sector bureau, but BOFED does not receive them. As
BOFED is in charge of fiscal management, such operations constitute unreported EBOs.
The situation regarding NGOs appears to be better. NGO operations are substantial in
SNNPR; the NGO unit in BOFED estimates that about 150 NGO projects – both Ethiopian
and foreign -- are operating in SNNPR, mainly in the health and education sectors. .Under
NGO Co-ordination Guidelines administered by the NGO office at BOFED, NGOs are
required to have proposed projects and annual workplans (physical and financial) approved by
BOFED and sector and zonal bureaus, report quarterly on these, and submit audit reports
(audited by private auditors). NGOs are first required to apply to BOFED for a time-bound
registration certificate, the renewal of which can be refused if performance has been
unsatisfactory.14
There does not seem be any one source of information on donor operations in SNNPR (under
both dimensions above) and BOFED admits it is hard to track what it happening under
Channel 2 and 3 funding modalities. The assessment team devised a format (shown in Annex
2) for reporting on donor-funded operations and submitted this to the regional bureaus, not for
the purposes of the assessment (as the form might take a long time to complete), but as a
format that the authorities might find helpful to use.
Any extra-budgetary operation has an opportunity cost, as scarce real resources, particularly
human resources, are being used to provide public services, the budgeting for which has not
been reflected in the budget submitted to the Regional Council. Ideally, the funding for all
public services should fall under the scope of the SNNPRG budget in order to increase the
chances of a reasonably optimum use of such resources in providing the range of public
services needed and required by society. Presumably donor agencies agree with this principle,
and therefore should not be funding extra-budgetary operations, even more so, unreported
extra-budgetary operations.
14 The NGO unit provided the team with copies of: (i) Guidelines for Terms of Collaboration between SNNPRG and NGOs
operating in the region, BOFED, April 2006; and (ii) a summary table of NGOs operations in SNNPR.
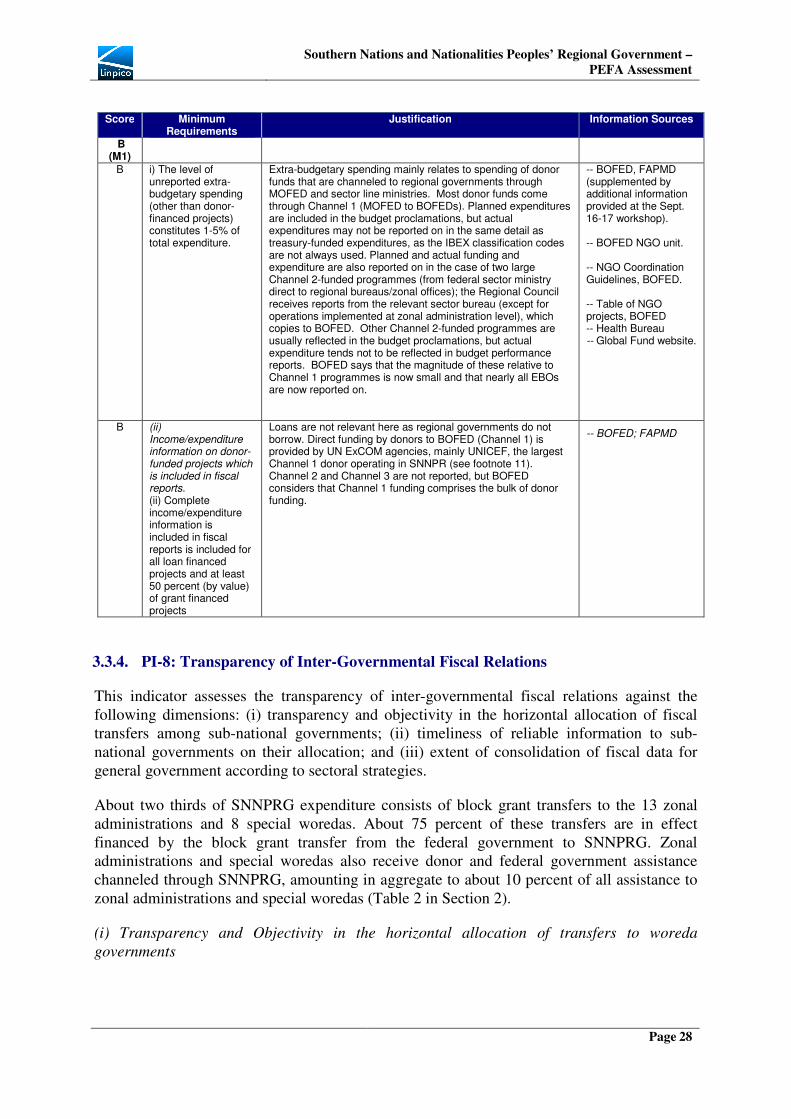
Southern Nations and Nationalities Peoples’ Regional Government –
PEFA Assessment
Page 28
Score Minimum Requirements
Justification Information Sources
B (M1)
B
i) The level of unreported extra-budgetary spending (other than donor-financed projects) constitutes 1-5% of total expenditure.
Extra-budgetary spending mainly relates to spending of donor funds that are channeled to regional governments through MOFED and sector line ministries. Most donor funds come through Channel 1 (MOFED to BOFEDs). Planned expenditures are included in the budget proclamations, but actual expenditures may not be reported on in the same detail as treasury-funded expenditures, as the IBEX classification codes are not always used. Planned and actual funding and expenditure are also reported on in the case of two large Channel 2-funded programmes (from federal sector ministry direct to regional bureaus/zonal offices); the Regional Council receives reports from the relevant sector bureau (except for operations implemented at zonal administration level), which copies to BOFED. Other Channel 2-funded programmes are usually reflected in the budget proclamations, but actual expenditure tends not to be reflected in budget performance reports. BOFED says that the magnitude of these relative to Channel 1 programmes is now small and that nearly all EBOs are now reported on.
-- BOFED, FAPMD (supplemented by additional information provided at the Sept. 16-17 workshop). -- BOFED NGO unit.
-- NGO Coordination Guidelines, BOFED. -- Table of NGO projects, BOFED -- Health Bureau -- Global Fund website.
B (ii) Income/expenditure information on donor-funded projects which is included in fiscal reports. (ii) Complete income/expenditure information is included in fiscal reports is included for all loan financed projects and at least 50 percent (by value) of grant financed projects
Loans are not relevant here as regional governments do not borrow. Direct funding by donors to BOFED (Channel 1) is provided by UN ExCOM agencies, mainly UNICEF, the largest Channel 1 donor operating in SNNPR (see footnote 11). Channel 2 and Channel 3 are not reported, but BOFED considers that Channel 1 funding comprises the bulk of donor funding.
-- BOFED; FAPMD
3.3.4. PI-8: Transparency of Inter-Governmental Fiscal Relations
This indicator assesses the transparency of inter-governmental fiscal relations against the
following dimensions: (i) transparency and objectivity in the horizontal allocation of fiscal
transfers among sub-national governments; (ii) timeliness of reliable information to sub-
national governments on their allocation; and (iii) extent of consolidation of fiscal data for
general government according to sectoral strategies.
About two thirds of SNNPRG expenditure consists of block grant transfers to the 13 zonal
administrations and 8 special woredas. About 75 percent of these transfers are in effect
financed by the block grant transfer from the federal government to SNNPRG. Zonal
administrations and special woredas also receive donor and federal government assistance
channeled through SNNPRG, amounting in aggregate to about 10 percent of all assistance to
zonal administrations and special woredas (Table 2 in Section 2).
(i) Transparency and Objectivity in the horizontal allocation of transfers to woreda
governments

Southern Nations and Nationalities Peoples’ Regional Government –
PEFA Assessment
Page 29
Unlike Oromia and Amhara regional governments, which use the unit cost approach to
determining the horizontal allocation of transfers to zonal administrations (described in the
PEFA assessments of those regions), SNNPRG uses the same transfer formula as that of the
Federal Government. The horizontal allocation of the block grant from the Federal
Government to regional governments until 2008/09 was based on three criteria: (i) population,
65 percent weight; (ii) development status (25 percent); and (iii) revenue generating capacity
(10 percent). With effect from the beginning of 2008/09, this formula is being phased out over
a period of four years (25:75 in first year to 100% in fourth year; for 2010/11 the ratio is
50:50) in favour of a new formula that gives more explicit emphasis to the expenditure needs
(numbering 14) each sector in order to more explicitly and accurately realize the fiscal
equalization purpose of the fiscal transfer formula.
Also, unlike Oromia and Amhara regional governments, SNNPRG reduces the amount of
block grant calculated for each zonal administration and special woreda under the formula by
the amount of donor assistance (Channel 1 only) already being provided to that
administration, or which is already committed and also by the amount of federal government
assistance (mainly donor-supported) directly targeted at zonal administrations and special
woredas.15
The amount of reduction is then redistributed to zonal administrations and special
woredas with relatively lower amounts of donor assistance. This practice derives from the
offsetting approach that the Federal Government uses in determining the allocation of its
block grant amongst the regional governments. In terms of the fiscal equalization principle,
this is justifiable, and in terms of the politics of the region (the multi-national aspect of it)
there appears to be significant pressure in favour of offsetting, but in practice it can lead to
problems for zonal administrations/special woredas if the budgeted donor assistance is
delayed (perhaps due to assistance conditionalities not being met). This is because the donor
assistance is in project or programme form, whereas most expenditures, particularly salaries,
are recurrent expenditures.16
17
The amount of subsidy for each zonal administration/special woreda is then determined as the
difference between the estimated budgetary requirements, the revenue generating potential of
each zonal administration/special woreda and the amount of projected donor assistance for
that zonal administration/special woreda. The SNNPRG Tax Administration Authority
contributes to the estimation of revenue generating potential.
In rating this dimension, only the transparency of the determination of the block grant for
each zonal administration/woreda is assessed, not the transparency of the determination of the
amount of donor assistance and federal government direct support to zonal
administrations/special woredas, even though such transparency may be an issue in itself (on
15
Apart from donor-funded projects, donors provide support (channeled through the federal government) to zonal administrations/woredas through programmes, notably the Water, Sanitation and Hygiene (WaSH) programme, the Local Investment Grant (LIG) programme (being piloted in 24 woredas in 2009/10 and the General Education Quality Improvement Programme (GEQIP). Donor-supported Federal Government programmes partly executed at zonal administration/woreda government level include the Food Security, Productive Safety Net and Public Sector Capacity Building programmes.
16 The steps are, as related to the assessment team by BOFED: (i) MOFED allocates its transfers to each region according to the block grant
formula, taking account of donor and federal government assistance being provided/planned to be provided to each region, providing an approximate sectoral breakdown for its use; (ii) BOFED notifies sector bureaus of donor/federal project/programme expenditure projections for each sector; (iii) sector bureaus prepare breakdown of projections of donor/federal project/programme expenditure under each zonal administration/special woreda and send the information to BOFED for compilation; and (iv) BOFED uses this information to allocate the block grant by zonal administration/special woreda.
17 BOFED informed the assessment team that woreda governments, which fall under zonal administrations (i.e. excluding special woredas) are the
main victims of delays in assistance, sometimes not even having enough money to pay salaries.

Southern Nations and Nationalities Peoples’ Regional Government –
PEFA Assessment
Page 30
aggregate, it may not seem much of an issue as such support is only 10 percent of total
support, but, because of offsetting, it may be an issue in some zonal administrations where
donor assistance/federal programmes play a relatively large role).
The block grant formula (both old and new) is transparent in itself but the methods for
estimating development potential (under the old formula), expenditure needs (under the new
formula) and revenue generating potential of each zonal administration/special woreda appear
not to be not fully transparent. Development potential is somewhat vague in its definition,
expenditure needs may be difficult to assess, particularly if the underlying data are suspect,
and good underlying data, forecasting and judgement are required to estimate revenue
generating potential accurately and objectively. As noted in the 2007 Regional PEFA
assessment, “there is uniform unhappiness in the seven regions visited about the transparency
of the transfer formula and the underlying time series data variables utilized”.
However, the Head of FAPMD in BOFED assured the team leader (at the workshop in
September) that the situation has improved: (i) the underlying data are checked for reliability;
(ii) the details of the allocation processed are discussed with zonal administrations and special
woredas; and (iii) the Regional Council fully discusses the formula and the proposed
allocations to zonal administrations and special woredas during its discussion of the budget
(as noted under PI-6).
(ii) Timeliness of reliable information to woreda governments on their allocations
Most of the block grant to zonal administrations/special woredas from SNNPRG is funded
through the Federal Government block grant to SNNPRG. However, SNNPRG only knows
for certain how much block grant it will receive from the Federal Government after the
Parliament approves the draft Federal Government budget at the end of June (i.e. just before
the end of the fiscal year). Prior to the beginning of SNNPRG’s budget preparation cycle in
February, MOFED provides indications to the regional governments on the likely horizontal
allocation of the block grant and, on this basis, regional governments can start preparing their
annual work plans (PI-11) and can notify zonal administrations/special woredas in turn as to
how much block grant funding they are likely to receive.
It is possible, according to BOFED, that the final allocation approved by the Parliament may
differ from the initial indications provided by MOFED. In the same vein, the final horizontal
allocation of the block grant for zonal administrations/special woredas approved by the
Regional Council may differfrom the initial indications provided by BOFED. According to
BOFED staff, any adjustments zonal administrations/special woredas need to make only take
two-three weeks, so that their draft budgets are usually ready for submission to zonal
administration/special woreda councils before the end of July, one month into the new fiscal
year. The budgets of zonal administrations/special woredas are usually proclaimed by
September.18
18
Regional governments, zonal administrations/special woredas and woreda governments are on the same fiscal calendar as for the federal
government, even though a staggered calendar would seem more appropriate.
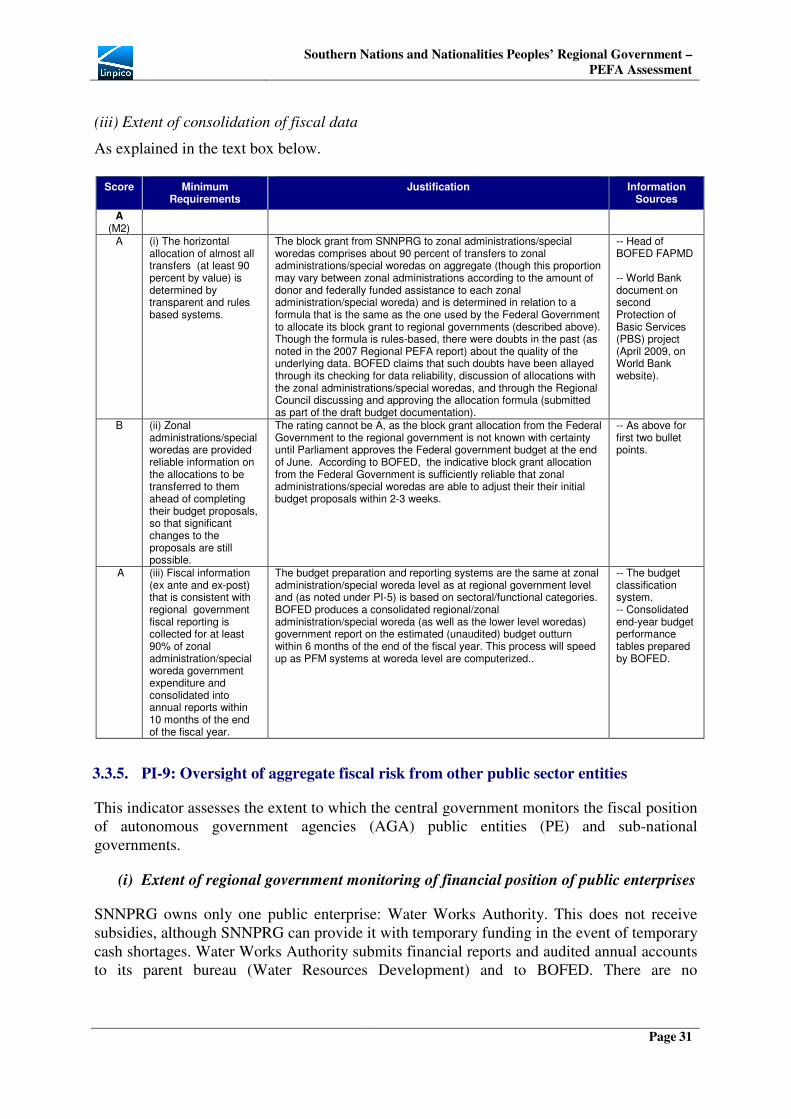
Southern Nations and Nationalities Peoples’ Regional Government –
PEFA Assessment
Page 31
(iii) Extent of consolidation of fiscal data
As explained in the text box below.
Score Minimum Requirements
Justification Information Sources
A (M2)
A (i) The horizontal allocation of almost all transfers (at least 90 percent by value) is determined by transparent and rules based systems.
The block grant from SNNPRG to zonal administrations/special woredas comprises about 90 percent of transfers to zonal administrations/special woredas on aggregate (though this proportion may vary between zonal administrations according to the amount of donor and federally funded assistance to each zonal administration/special woreda) and is determined in relation to a formula that is the same as the one used by the Federal Government to allocate its block grant to regional governments (described above). Though the formula is rules-based, there were doubts in the past (as noted in the 2007 Regional PEFA report) about the quality of the underlying data. BOFED claims that such doubts have been allayed through its checking for data reliability, discussion of allocations with the zonal administrations/special woredas, and through the Regional Council discussing and approving the allocation formula (submitted as part of the draft budget documentation).
-- Head of BOFED FAPMD -- World Bank document on second Protection of Basic Services (PBS) project (April 2009, on World Bank website).
B (ii) Zonal administrations/special woredas are provided reliable information on the allocations to be transferred to them ahead of completing their budget proposals, so that significant changes to the proposals are still possible.
The rating cannot be A, as the block grant allocation from the Federal Government to the regional government is not known with certainty until Parliament approves the Federal government budget at the end of June. According to BOFED, the indicative block grant allocation from the Federal Government is sufficiently reliable that zonal administrations/special woredas are able to adjust their their initial budget proposals within 2-3 weeks.
-- As above for first two bullet points.
A (iii) Fiscal information (ex ante and ex-post) that is consistent with regional government fiscal reporting is collected for at least 90% of zonal administration/special woreda government expenditure and consolidated into annual reports within 10 months of the end of the fiscal year.
The budget preparation and reporting systems are the same at zonal administration/special woreda level as at regional government level and (as noted under PI-5) is based on sectoral/functional categories. BOFED produces a consolidated regional/zonal administration/special woreda (as well as the lower level woredas) government report on the estimated (unaudited) budget outturn within 6 months of the end of the fiscal year. This process will speed up as PFM systems at woreda level are computerized..
-- The budget classification system. -- Consolidated end-year budget performance tables prepared by BOFED.
3.3.5. PI-9: Oversight of aggregate fiscal risk from other public sector entities
This indicator assesses the extent to which the central government monitors the fiscal position
of autonomous government agencies (AGA) public entities (PE) and sub-national
governments.
(i) Extent of regional government monitoring of financial position of public enterprises
SNNPRG owns only one public enterprise: Water Works Authority. This does not receive
subsidies, although SNNPRG can provide it with temporary funding in the event of temporary
cash shortages. Water Works Authority submits financial reports and audited annual accounts
to its parent bureau (Water Resources Development) and to BOFED. There are no

Southern Nations and Nationalities Peoples’ Regional Government –
PEFA Assessment
Page 32
autonomous government agencies (AGAs) whose expenditures are not captured in SNNPRG
budgets.
(ii) Extent of monitoring of the fiscal position of sub-national governments
Zonal administrations are not allowed to borrow. Financial Regulations prohibit over
committing of expenditure (in terms of the approved or adjusted budget) and are enforced,
thus payments arrears through over-commitment are not possible. Zonal administrations’
main source of revenue is the block grant (they also have a share of some tax revenues (PI-13,
but the block grant is the main source of financial resources). The block grant is very
predictable, so it is unlikely that zonal administrations would face resource shortfalls. The
main risk of a resource shortfall arises from delayed or non-arrival of budgeted external
assistance (PI-8). In the event of such shortfalls, the contingency item (public body code 462)
in the SNNPRG budget (ETB 45 million in 2008/09, representing 3.8 percent of the regional
bureau budget, see Table 5 in Section 2) can be used to help finance zonal administration
government resource shortfalls.
The SNNPRG BOFED monitors the financial situation of the zonal administrations/special
woredas through the reports they submit every month. The Single Pool system, under which
WOFEDs are effectively in charge of the PFM systems of the woreda sector bureaus (for
example, for procurement and payments), and which then report to the zonal administrations
also facilitates such monitoring.
Score Minimum Requirements Justification Information Sources
A (M1) A (i) All major AGAs/PEs
submit fiscal reports, to regional governments at least six monthly, as well as annual audited accounts, and the regional government consolidates the overall fiscal risk into an annual report.
SNNPRG owns only one enterprise –Water Works Authority – which submits periodic financial performance reports and annual audited accounts to its parent ministry and to BOFED. Keeping track of its fiscal position is straight forward.
-- Information provided by BOFED FAPMD..
A (ii) The net fiscal position of zonal administrations/special woreda governments is monitored at least annually for all governments and the regional government consolidates overall fiscal risk into annual reports.
Zonal administrations/special woreda governments are not permitted to borrow or enter into spending commitments that are not covered by the approved budget. As most of their resources derive mainly from the block grant, the delivery of which is predictable, the main risk of a shortfall comes from delays in receiving budgeted external assistance. SNNPRG practises offsetting arrangements, so delays in receipts of external assistance may result in shortfalls of resources for recurrent expenditure. SNNPRG’s contingency fund can be used to offset such shortfalls. Through the financial reporting system, SNNPRG can keep track of the financial position of zonal administrations/special woredas, though this is not formalized into a consolidated overall fiscal risk report.
Ditto
3.3.6. PI-10: Public access to key fiscal information
Transparency will depend on whether information on fiscal plans, position and performance
of the government is easily accessible to the general public or at least interested groups.
Public access to key fiscal information is still limited at regional bureau level, though at zonal
administration and woreda government level it is improving markedly under the Financial

Southern Nations and Nationalities Peoples’ Regional Government –
PEFA Assessment
Page 33
Transparency and Accountability Programme (FTAP) under the PBS programme. Under
FTAP, progress is evidenced in the following areas: (i) posting of budgets and budget
performance in simplified form on noticeboards outside WOFEDs (in formats designed under
the PBS programme); (ii) posting of service delivery information outside education, health
and agricultural extension service delivery units (in formats designed under PBS); and (iii)
design of brochures on woreda budgets for the layman. The media (local radios, newspapers,
magazines) are also disseminating information on budgets and budget performance, while
communities are playing a more active voice. Table 5 summarises.
Table 5: PI-10: Elements of information for public access
Elements of information for public access Availability and means
Annual budget documentation when submitted to legislature
Not met. The budget documentation is not available to the public until the budget has been approved by the Regional Council (at which point it is published, through the Budget Proclamation). The Budget Speech is publicized on radio and TV, but not in document form and details on the proposed budget are not provided . Interested members of the public are allowed to watch the debate on the draft budget.
In-year budget execution reports within one month of their completion.
Not met: BOFED prepares monthly budget execution reports, both at regional bureau and woreda level, but does not publish them, either in hard copy or through its website (www.SNNPRbofed.gov.et). The Regional Council receives quarterly and semi-annual budget performance reports, but these are not available to the public.Though beyond the scope of this study (which covers regional bureaus only) WOFEDs are now pinning simplified budget performance reports on notice boards (one of the products of the FTAP under the PBS project).
Year-end financial statements within 6 months of completed audit.
Not met. Audited year-end financial statements are not published, either by BOFED or by ORAG; the Regional Council has access to them. ..
Availability of external audit reports to the public. Not met: Publication is permitted under the law, but ORAG has yet to publish any of its audit reports, mainly due to resource constraints. The Regional Council has access to them.
Contract awards with value above US$ 100,000 approx. are published at least quarterly.
Not met: Tenders are published (TV, radio, internet) but contract awards are not yet published.
Availability to public of information on resources for primary service units.
Met. Under another FTAP project under PBS, information on service delivery is beginning to be provided through the posting of information on service delivery at primary schools, health care units and agricultural extension centres. The project is in the process of being rolled out to all woredas. The mass media and community organizations are increasingly disseminating information.
Score Minimum Requirements Justification
C (i) The government makes available to the public 1-2 the 6 listed types of information.
As described above.
3.4. Policy based budgeting
The indicators in this group assess to what extent the central budget is prepared with due
regard to government policy. The table below summarises the assessment.

Southern Nations and Nationalities Peoples’ Regional Government –
PEFA Assessment
Page 34
No. C (i) Policy –based budgeting Score Dimensions Scoring Methodology
PI-11 Orderliness and participation in the annual budget Process
B+ (i) A (ii) A (iii) C
M2
PI-12 Multiyear perspective in fiscal planning, expenditure policy and budgeting.
C
(i) C (ii) NA (iii) C (iv) C
M2
3.4.1 PI-11: Orderliness and participation in the annual budget process
This indicator reflects the organization, clarity and comprehensiveness of the annual budget
process. Dimensions to be assessed are: (i) existence and adherence to a fixed budget
calendar; (ii) clarity/comprehensiveness of and political involvement in the guidance on the
preparation of submissions (budget circular or equivalent); and (iii) timely budget approval by
the legislature or similarly mandated body (within the last three years).
(i) Existence of and adherence to a fixed budget calendar
Regions follow the Federal Government guidelines with regard to budget preparation, as
described in the Federal Government’s Budget Manual (January 2007). The Financial
Calendar is outlined on pages 38-39 of the manual. The calendar is generally adhered to. The
calendar allows six weeks for the submission of “Budget Requests” after the issue of the
Budget Call (end of January, as indicated in the Calendar). Most bureaus submit their requests
on time. Prior to the issue of the Budget Call, bureaus prepare Annual Work Plans, which
facilitate the preparation of the Budget Requests. Following evaluation by BOFED of these
requests during March-April, budget ceilings are sent out in mid-May to bureaus, which then
have three weeks to prepare detailed estimates to fit within these ceilings and submit to
BOFED; much of the estimation work has already been conducted during the initial phase of
budget preparation.
Section 6.5 of the Federal Budget Manual indicates the small differences between the Federal,
Regional and Woreda budget calendars.
(ii) Guidance on the preparation of budget submissions
The Federal Budget Manual includes “Guidelines for Public Bodies Preparing Budget
Requests” (pages 52-58). The main difference between the guidance on preparation of Budget
Requests at federal level and the guidance at regional level is that the ceilings for each bureau
cannot be finalized prior to the issue of the Budget Call (sent out by BOFED to bureaus in
February), as the amount of the federal block grant is not known with certainty. Instead,
bureaus are required to prepare their budget requests by filling out standard format budget
preparation forms (Annex H of the Federal Budget Manual). The forms provide for the
detailed estimation of recurrent and capital expenditures for the coming year on the basis of
the expected outturn for the current year; in other words, on the basis of the existing levels of
services (with adjustments for any efficiency-enhancing cost savings that may have been
identified). For example, estimation of salaries expenditure is based on the same levels of
staff being maintained. They also provide for prioritized and well-justified proposals for new
capital projects.

Southern Nations and Nationalities Peoples’ Regional Government –
PEFA Assessment
Page 35
At a later stage, after the submission of Budget Requests to BOFED and subsequent
discussion of these, the Regional Cabinet may prioritise (partly based on the proposals in the
budget requests for new capital projects) the allocation to bureaus of any extra fiscal resources
(‘fiscal space’) that may be available. Following this, BOFED sends out letters to each
bureau, indicating its spending ceiling, which cannot be exceeded in the subsequent
preparation of detailed budget estimates (which, after submission to BOFED, permit the
preparation of the draft budget proclamation to be submitted to the Regional Council.
(iii) Timely Budget Approval by the Legislature
The Regional Council approved the draft budget proclamations for 2006/07, 2007/08,
2008/09 and 2009/10 (EFYs 1999-2002) in mid-July.. The financial calendars of the federal
and regional governments are the same. Thus, as the federal government budget proclamation
is not approved until the end of the financial year, the regional governments need 1-3 weeks
after the end of the financial year to adjust their budgets if the block grant allocation is
different from the figure indicated earlier.19
Impact Assessment Study of Expenditure Management and Control Program (EMCP)
On the positive side: (i) the budget manual and training module were developed and
distributed; (ii) the new Chart of Accounts came into use in 2003, and no problems were
reported in using it; (iii) with the merger of the finance and planning bureaus, recurrent and
capital budgets have been prepared together; (iv) knowledge of the cost centre concept was
very good and it is being used in the budget preparation process; (v) Understanding of the
budget reforms was assessed as being very good, partly due to the training.
On the negative side: (i) Adherence to the budget calendar has not always been strictly
adhered to, due to delay in notification by the Federal Government of the budget subsidy;
regional bureaus tend to follow the calendar closely, but zonal administrations do not. (ii)
continual changes in the organization structure of sector bureaus was disrupting the reform
process; (iii) high turnover of trained employees; (iv) poor knowledge transfer problem in
relation to IBEX; (v) periodic failures of IBEX; (vi) lack of computer facilities; and (vii) need
for more training.
Score Minimum Requirements Justification Information Sources
B+ (M2)
A (i) Existence of and adherence to a fixed budget calendar A clear annual budget calendar exists, is generally adhered to and allows regional bureaus enough time (and at least 6 weeks from receipt of the budget circular) to meaningfully complete their
The annual budget calendar is clearly laid out in the Federal Budget Manual. Preparation of initial budget estimates begins early February following Budget Call issuance and these have to be submitted by mid-March. Following this, spending ceilings are set (mid-May), and bureaus then have 3 weeks to prepare estimates to fit within the ceilings, The calendar is generally adhered to at the regional bureau level, despite delays in notification by the Federal Government of the likely amount of subsidy (adherence is not so good at the zonal administration level, but, in the SNNPR context, this is a lower
- Federal Budget Manual, January, 2007. - Head, Financial Administration and Property Management Department, BOFED

Southern Nations and Nationalities Peoples’ Regional Government –
PEFA Assessment
Page 36
Score Minimum Requirements Justification Information Sources
detailed estimates on time. level of government).
A (ii) Guidance on the preparation of budget submissions A comprehensive and clear budget circular is issued to regional bureaus, which reflects ceilings approved by Cabinet (or equivalent), prior to the circular’s distribution to the bureaus.
The Budget Call requires preparation of Budget Requests using standard formats, mainly on the basis of the estimated outturn for the current fiscal year, forecasts of spending next year under existing service levels (including same staffing levels), ongoing and committed capital projects; and prioritized and well-justified proposals for new capital projects. Following discussion with BOFED and then within Cabinet, ceilings are sent to each bureau to guide the preparation of detailed estimates, which form the basis of the drafting of the budget proclamation.
-- Ditto.
C (iii) Timely budget approval by the legislature The legislature has, in two of the last three years, approved the budget within two months of the start of the fiscal year..
This is required by the Federal Financial Administration Law (both the 2003 law and the new 2009 law). In practice, due to the notification of the federal budget subsidy only at the end of the fiscal year, budget approval takes place 1-3 weeks after the end of the fiscal year. But this happens only because the financial years are the same for the federal and regional governments, thus approval by the Regional Council after the end of the financial year is not the fault of BOFED or the Council.
-- Budget proclamations for 2006/07-2009/10. -- Head, FAPMD, BOFED.
4.2. Multi-year perspective in fiscal planning, expenditure policy and budgeting
This indicator looks at the link between budgeting and policy priorities from the medium term
perspective and the extent to which costing of the implications of policy initiatives are
integrated into the budget formulation process. In particular, it assesses the following: (i)
multi-year fiscal forecast and function allocations; (ii) scope and frequency of debt
sustainability analysis; (iii) existence of costed sector strategies; and (iv) linkages between
investment budgets and forward expenditure estimates.
(i) Multi-year fiscal forecasts and functional allocations
The Federal Budget Manual indicates (under Section 6, Budget Calendar) that regional
governments, as with the Federal Government, should prepare a medium term Macro
Economic and Fiscal Framework (MEFF). As indicated under PI-6, SNNPRG does this:
forecasts of fiscal aggregates are prepared for the following three years on a rolling basis.
Forecasts of expenditures according to administrative structure are not yet performed. The
Federal Government (MOFED) is currently developing the methodology for MTEFs on a
programme budgeting basis. Unlike the Public Investment Plans (PIPs) that SNNPRG used to
prepare, the new methodology will provide for the estimation of recurrent costs associated
with planned investments. .
(ii) Scope and frequency of debt sustainability analysis (DSA)
This dimension is not applicable, as SNNPR Region does not borrow and has no debt
obligations.

Southern Nations and Nationalities Peoples’ Regional Government –
PEFA Assessment
Page 37
(iii) Existence of costed sector strategies
Sector strategies are prepared at federal government level and then adapted to regional level:
• The Agriculture and Resources Development Bureau is close to completing
preparation of a five year sector development plan covering 2009/10-2013/14. The
plan will indicate the costs of spending programmes covering all levels of government
(i.e. on a state-wide basis). Bureau expenditure comprised 8 percent of SNNPRG
expenditure in 2008/09.
• Education sector spending is based on a costed Education Sector Development Plan
(ESDP) covering 2006-2010 on a state-wide basis; the Education Bureau is currently
preparing a new five year plan. Spending programmes include the donor-supported
GEQIP, a component of which is a capitation grant to cover the non-wage recurrent
costs of educating each student, including maintenance costs. The budget for the
Education Bureau spending comprised about 11 percent of SNNPRG spending in
2008/09.
• Health sector spending is covered by a costed 5 year strategic plan. A new costed plan,
covering 2010/11-2014/15 on a state-wide basis, is being finalised. Costing follows
the WHO model. Planned spending does not include spending financed by the Global
Fund. Health Bureau spending comprised about 19 percent of SNNPRG spending in
2008/09.
The team was not able to obtain copies of these plans. However, it was able to review the
federal government’s education and health sector plans. These are fully costed, but the
totals imply large funding gaps that are unlikely to be filled, or if they could be filled they
would be inconsistent with aggregate spending ceilings derived from the macro-fiscal
framework.
(iv) Linkages between investment budgets and forward expenditure estimates
Investment decisions tend to be closely related to sector strategies, the costs of which include
the recurrent cost implications of investments. The EDSP does not explicitly link investment
budgets and associated future recurrent costs. The linkage is implicit, however, as the number
of classrooms and schools to be constructed ultimately depends on projections of student
enrollments and the recurrent expenditures that these generate. As noted under dimension
(iii), the GEQIP includes a capitation grant element that provides in part for maintenance
expenses. Health sector spending includes future recurrent costs associated with planned
capital expenditure. Future recurrent costs associated with agriculture sector capital
expenditure are not taken into account in the agriculture sector development plan.
The Guidelines for Preparing the Capital Budget (contained in the Federal Budget Manual)
stipulate that a public body should assess the recurrent budget implications of new capital
projects before it includes them in its Budget Request. Forward spending estimates are,
however, not formally prepared by regional governments. Although medium term recurrent
cost implications may be included in Budget Requests, these do not have any formal bearing
on the preparation of future budgets.

Southern Nations and Nationalities Peoples’ Regional Government –
PEFA Assessment
Page 38
Score Minimum Requirements Justification Information Sources
C(M2) C (i) Multi-year fiscal forecasts
and functional allocations Forecasts of fiscal aggregates (on the basis of the main categories of economic classification) are prepared for at least two years on a rolling annual basis.
As described under PI-6, BOFED projects fiscal aggregates using a macro-fiscal framework. MOFED is currently developing a methodology for the introduction of MTEFs and programme budgeting.
-- BOFED, head of planning and budgeting department and head of FAPMD (the latter at the September workshop). -- Information provided under PI-6..
NA (ii) Scope and frequency of debt sustainability analysis
The Regional Government does not borrow and has no debt liabilities.
-- BOFED
C (iii) Existence of costed sector strategies Statements of sector strategies exist for several major sectors but are only substantially costed for sectors representing up to 25% of primary expenditure, OR costed strategies cover more sectors but are inconsistent with broad fiscal forecasts.
The education and health sector development plans are costed. The agriculture sector development plan is costed, but does not include future recurrent costs associated with planned capital expenditure. The team was unable to obtain copies of the plans. These are derived from federal sector plans (that cover the whole country). In the case of education and health, at least, these are fully costed, but end up with large funding gaps. Education and health regional bureau spending represent 30 percent of total SNNPRG spending.
-- Education, Health and Agriculture and Resource Development Bureaus.
C (iv) Linkages between investment budgets and forward expenditure estimates Many investment decisions have weak links to sector strategies and their recurrent cost implications are included in forward budget estimates only in a few (but major) cases.
Investment decisions are closely related to sector strategies, the costs of which include the recurrent cost implications of investments (at least in the case of education). .Budget Requests for new capital projects should (according to the Guidelines in the Federal Budget Manual) contain estimates of the future recurrent costs associated with such projects. BOFED emphasizes the need to prepare such estimates. But forward budget estimates are not currently prepared in SNNPR. A rating of D would be too low, as budgeting for recurrent and capital expenditure are not separate processes. A B rating would be too high, this assumes forward budget estimates are prepared. .
-- Education, Health, and Agriculture and Water Resources Bureaus.
-- Federal Government Budget Manual.
3.5. Predictability and control in budget execution
This set of indicators reviews the predictability of funds for budget execution and the internal
controls and measures in place to ensure that the budget is executed in an accountable
manner.
No. C (ii) Predictability, Control and Budget Execution
Score Dimensions Scoring Methodology
PI-13 Transparency of tax payer obligations and Liabilities
B▲ (i) B▲ (ii) B▲ (iii) B▲
M2
PI-14 Effectiveness of measures for taxpayers registration and tax assessment.
B▲ (i) B (ii) B
(iii) C▲ M2
PI-15 Effectiveness in collection of tax payments
D+▲ (i) NS (ii) C▲ (iii) D
M1
PI-16 Predictability in the availability of funds for the commitment of expenditures.
B + (i) B (ii) A (iii) B
M1

Southern Nations and Nationalities Peoples’ Regional Government –
PEFA Assessment
Page 39
No. C (ii) Predictability, Control and Budget Execution
Score Dimensions Scoring Methodology
PI-17 Recording and management of cash balances, debt and guarantees.
B (i) NA (ii) B
(iii) NA M2
PI-18 Effectiveness of payroll controls B+
(i) B (ii) A (iii) A (iv) B
M1
PI-19 Competition, value for money and controls in Procurement
C (i) D (ii) C (iii) B
M2
PI-20 Effectiveness of internal controls for non- salary expenditure B (i) B (ii) B (iii) B
M1
PI-21 Effectiveness of internal audit C (i) C (ii) C (iii) C
M1
3.5.1. PI-13: Transparency of taxpayer obligations and liabilities
This indicator assesses the transparency of tax administration by reviewing:
(i) Clarity and comprehensiveness of tax liabilities
(ii) Taxpayer access to information on tax liabilities and administrative procedures,
and
(iii) Existence and functioning of a tax appeals mechanism.
Background
The Constitution of the FDRE clearly defines the power and distribution of taxation
responsibilities of the Federal Government and Regional State Governments (Articles 96-98)
Tax-related proclamations (all contained in one document, all dated 2002-2003, and, as with
the other regions, based on Federal Government tax proclamations, posted on the Ethiopian
Customs and Revenue Agency website -www.erca.gov.et), covering:
• Personal income tax collected by SNNPRG from regional state government
employees and private enterprises accrues 100 percent to SNNPRG.
• Business income tax levied on sole proprietorships is collected by SNNPRG,
which keeps 100 percent. Business income tax levied on legal entities (companies,
cooperatives, partnerships) resident in the region is collected by the Federal
Government and then shared 50:50 with SNNPRG.
• . Rental income tax is collected by SNNPRG, which keeps 100 percent.
• Agricultural Income Tax and Rural Land Use fees: These are collected and
fully used by woredas up to the approved budget ceiling (the block grant transfers to
woredas are commensurately offset).

Southern Nations and Nationalities Peoples’ Regional Government –
PEFA Assessment
Page 40
• Indirect taxes (Value-Added Tax (VAT), excise tax, turnover tax and chat
sales tax): These are collected by both the Federal Government and SNNPRG.
SNNPRG collects indirect taxes from sole proprietorships (subject to turnover tax,
applicable to enterprises with an annual turnover of less than ETB 500,000, which
represents the threshold above which VAT is payable) and keeps 100 percent. The
Federal Government collects indirect taxes from resident legal entities and retains 70
perent of this, with the other 30 percent transferred to SNNPRG.
•
• Non-tax revenues, e.g. royalties, casino license fees, and stamp duty, are
collected by SNNPRG, which keeps 100 percent.
All proclamations are supported by directives. The Revenue Authority (RA) and BOFED are
in the process of reviewing the proclamations and drafting amendments to strengthen them.
Tax system developments in recent years include:
• The establishment in 2008 of the Standard Integrated Tax Administration
System (SIGTAS), following in the footsteps of the Federal Government; 20
it
is gradually being rolled out to the zones, network connectivity issues
constraining the rate of roll-out; the TAA is planning to install more fibre-
optic cable. At present; SIGTAS only covers VAT, but it is planned to extend
the coverage to other taxes in the near future.
• Introduction of Value-Added Tax (2002);
• Introduction of the single Tax Identification Number (TIN);discussed under
PI-14;
• Strengthening of Compliance Handling Teams as a result of the BPR
(discussed under PI-14)
• Strengthening of the tax audit system (PI-14);
• Business Process Re-engineering (BPR): The purpose is to strengthen the
efficiency of the revenue bureau through streamlining processes. The review
started during 2006/07 and implementation of the streamlining exercise started
the following year and is still continuing.
• Write-off by the Federal Government in 2004 of all sub-national government
tax debts, as part of the tax reform programme (as mentioned in the 2007
Regional PEFA Assessment).
(i) Clarity and Comprehensiveness of tax liabilities
The preparation of the tax proclamations listed above was supported by financing under the
Tax Reform component of the Public Sector Capacity Building Programme (PSCAP), with
assistance from donors.
20
SIGTAS, developed in Canada, is used in a number of countries; for example in the Caribbean with financing from CIDA.

Southern Nations and Nationalities Peoples’ Regional Government –
PEFA Assessment
Page 41
As would be expected, the legislation is reasonably comprehensive and clear, with limited and
clearly stated discretionary powers. In the Income Tax Proclamation, the only discretionary
powers available to the Head of BOFED relate to the waiving of tax liabilities in cases of
grave unavoidable hardships (higher level approvals are required above stipulated thresholds,
for example, approval of the Regional Cabinet is required for waivers of tax liabilities greater
than ETB 100,000. Similar discretionary power is provided to the Head of BOFED in the case
of the turnover tax (section 39) and to the regional government in the case of the land use fee
and agricultural income tax (e.g. because of drought). Presumptive taxation (businesses with
less than ETB 100,000 turnover a year) implies discretionary powers by definition (as, in the
absence of books of account, the RA has to make an estimate of turnover and reach agreement
with the business on this).
Although the tax proclamations strictly limit discretionary power, in practice the amount of
discretion exercised by RA may exceed limits. The recently completed BPR addressed this
issue and the RA is accordingly in the process of tightening up on the instances of undue
exercise of discretionary power.
(ii) Tax payers access to information on tax liabilities and administrative
procedures
Explanatory brochures are available to businesses and the general public, facilitated by the
location of RA branches in woredas and towns. In addition, the RA runs radio programmes
twice a week, conducts Question and Answer sessions periodically in tertiary education
institutions, and promotes tax clubs in schools, churches/mosques and youth and women’s
associations. Tax training is provided face to face to Category A and B taxpayers (comprising
10 percent of all taxpayers, these have annual turnovers higher than ETB 500,000 in the case
of Category A taxpayers, and therefore have to be registered for VAT, and higher than ETB
100,000 a year in the case of Category B taxpayers and who are required to keep books of
account). Taxpayer access to information will be further strengthened once RA has completed
the development of its own web-site.
(iii) Existence and functioning of tax appeals mechanism
The tax proclamations provide for a tax appeals mechanism for the four major taxes, the
mechanism being the same for each type of tax (thus, the mechanism is described in detail in
the Income Tax Proclamation and summarized in the other tax proclamations) Tax appeals
processes have three components:
o Review Committee: Members of the Review Committee (RC) – accountable to
RA-- are appointed by the RA.. The RC examines tax payer queries over their tax
assessments and, where appropriate, recommends waivers of assessed tax
liabilities and any associated penalties and interest charges. These can be
appointed at woreda branch level. Many queries relate to the presumptive tax,
which is the turnover tax as applied to Category C taxpayers (those without books
of account). Almost by definition, queries are likely to be higher under this tax
then other taxes. Many other queries relate to incomplete understanding of the tax
laws and regulations and are resolved by the RC.

Southern Nations and Nationalities Peoples’ Regional Government –
PEFA Assessment
Page 42
o Tax Appeals Commission: If a tax payer is not satisfied with how the RC has
addressed his/her query/complaint, he/she can go to the Tax Appeals Commission.
This is established at regional, zonal, and woreda (including town administration)
level and is independent of the Government. Members are selected from bureaus
(BOFED, Trade and Industry, Justice), and the Chamber of Commerce.
Submission of an appeal requires: (i) lodging within 30 days of receipt of the tax
assessment notice or the date of the decision of the RC concerning the tax
assessment; and (ii) deposit of 50 percent of the disputed amount with RA. The
Commission has the authority to confirm, reduce or annul the tax assessment. The
Chair of the Commission is required to prepare an annual report. Complaints are
supposed to be dealt with within 10 days after the submission of the complaint, but
sometimes it takes longer. The Chair of the Commission is required to prepare an
annual report.
o Court of Appeal: A taxpayer dissatisfied with the decision of the Tax Appeals
Commission may appeal to the Court of Appeal within 30 days of the decision on
the grounds that the decision is erroneous in terms of the law. First, he/she must
deposit 100 percent of the assessed tax liability.
In practice, nearly all queries/complaints are resolved at the RC stage. The extensive tax payer
education campaign has helped to reduce the number of queries.
To assist in the rating of PI-13 and PI-14, the assessment team had requested BOFED to
arrange a meeting with the Chamber of Commerce in order to obtain the business
community’s views on the transparency of the tax system. Unfortunately, BOFED was unable
to set up this meeting.
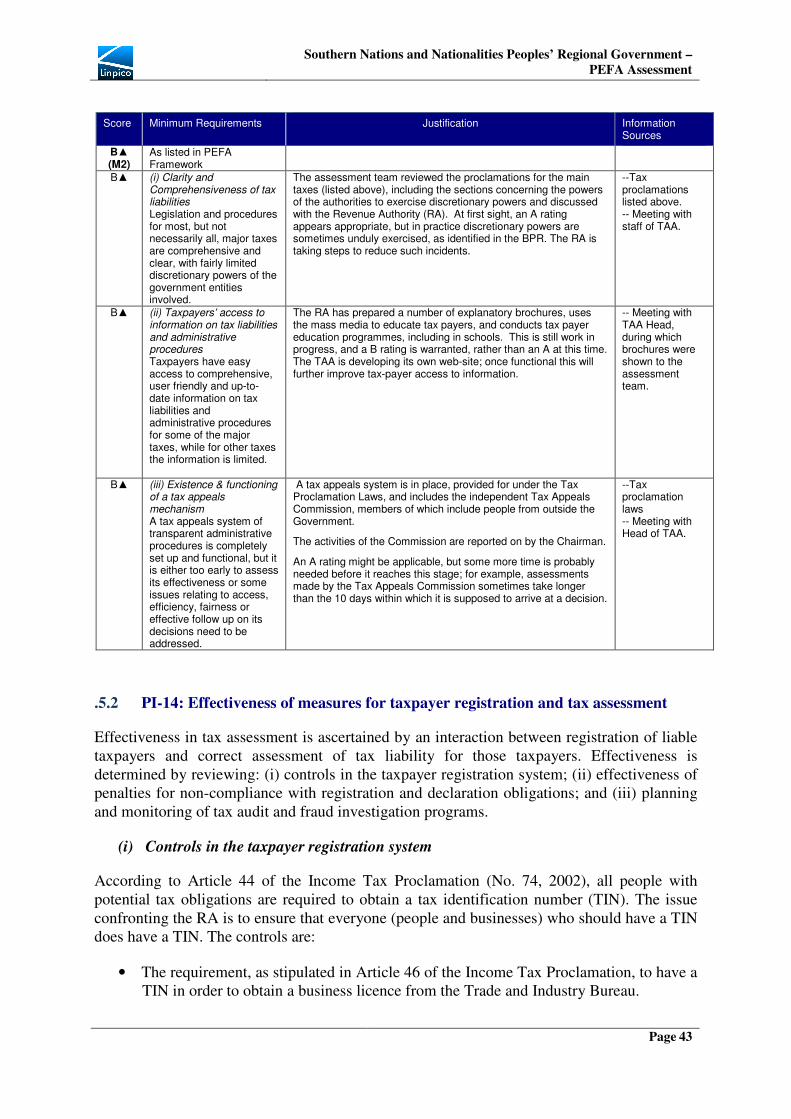
Southern Nations and Nationalities Peoples’ Regional Government –
PEFA Assessment
Page 43
Score Minimum Requirements Justification Information Sources
B▲ (M2)
As listed in PEFA Framework
B▲ (i) Clarity and Comprehensiveness of tax liabilities Legislation and procedures for most, but not necessarily all, major taxes are comprehensive and clear, with fairly limited discretionary powers of the government entities involved.
The assessment team reviewed the proclamations for the main taxes (listed above), including the sections concerning the powers of the authorities to exercise discretionary powers and discussed with the Revenue Authority (RA). At first sight, an A rating appears appropriate, but in practice discretionary powers are sometimes unduly exercised, as identified in the BPR. The RA is taking steps to reduce such incidents.
--Tax proclamations listed above. -- Meeting with staff of TAA.
B▲ (ii) Taxpayers’ access to information on tax liabilities and administrative procedures Taxpayers have easy access to comprehensive, user friendly and up-to-date information on tax liabilities and administrative procedures for some of the major taxes, while for other taxes the information is limited.
The RA has prepared a number of explanatory brochures, uses the mass media to educate tax payers, and conducts tax payer education programmes, including in schools. This is still work in progress, and a B rating is warranted, rather than an A at this time. The TAA is developing its own web-site; once functional this will further improve tax-payer access to information.
-- Meeting with TAA Head, during which brochures were shown to the assessment team.
B▲ (iii) Existence & functioning of a tax appeals mechanism A tax appeals system of transparent administrative procedures is completely set up and functional, but it is either too early to assess its effectiveness or some issues relating to access, efficiency, fairness or effective follow up on its decisions need to be addressed.
A tax appeals system is in place, provided for under the Tax Proclamation Laws, and includes the independent Tax Appeals Commission, members of which include people from outside the Government.
The activities of the Commission are reported on by the Chairman.
An A rating might be applicable, but some more time is probably needed before it reaches this stage; for example, assessments made by the Tax Appeals Commission sometimes take longer than the 10 days within which it is supposed to arrive at a decision.
--Tax proclamation laws -- Meeting with Head of TAA.
.5.2 PI-14: Effectiveness of measures for taxpayer registration and tax assessment
Effectiveness in tax assessment is ascertained by an interaction between registration of liable
taxpayers and correct assessment of tax liability for those taxpayers. Effectiveness is
determined by reviewing: (i) controls in the taxpayer registration system; (ii) effectiveness of
penalties for non-compliance with registration and declaration obligations; and (iii) planning
and monitoring of tax audit and fraud investigation programs.
(i) Controls in the taxpayer registration system
According to Article 44 of the Income Tax Proclamation (No. 74, 2002), all people with
potential tax obligations are required to obtain a tax identification number (TIN). The issue
confronting the RA is to ensure that everyone (people and businesses) who should have a TIN
does have a TIN. The controls are:
• The requirement, as stipulated in Article 46 of the Income Tax Proclamation, to have a
TIN in order to obtain a business licence from the Trade and Industry Bureau.

Southern Nations and Nationalities Peoples’ Regional Government –
PEFA Assessment
Page 44
• The requirement that people/businesses opening bank accounts should have TINs and
that prospective borrowers from banks have tax clearance certificates.
• The requirement that businesses registering for VAT have TINs (this applies to
businesses with an annual turnover of at least ETB 500,000). This enables the RA to
check if businesses are compliant with the Income Tax Proclamation (2002) and if
employees of the business have TINs.
• The requirement (as from September 2009) that all taxpayers (current and potential –
students for example) should have biometric fingerprints; the project to provide for
such fingerprints is only in its incipient stage.
In terms of Category C taxpayers (those with no books of accounts and turnover less than
ETB 100,000 a year, and who are therefore liable to presumptive turnover tax), who comprise
90 percent of taxpayers, the culture of tax compliance (including the requirement to obtain a
TIN) has strengthened in recent years as a result of the taxpayer education campaign (PI-13).
The RA informed the assessment team that TINs were on the way to becoming reasonably
well established at the regional level (so far, 56,000 TINs have been issued), but not yet at
zonal administration and woreda level.
(ii) Effectiveness of penalties for non-compliance with registration and declaration
obligations
Penalties for non-compliance are set out in the tax proclamations and appear to be high
enough to have potential significant impact. Failure to have a TIN may result in fines and
prosecution. Section VII of the Income Tax Law provides for seizure of property in the event
of default, Section VIII provides for administrative penalties21
. Section IX provides for
criminal penalties; the RA has its own prosecution department.22
The turnover, VAT and
Excise tax proclamations have penalties of similar scale and also interest charges on late
payments. The penalty for late payment under the Agriculture Income Tax proclamation is 2
percent of the amount of tax due for each month the payment is in default and criminal
penalties are according to the penal code.
The SIGTAS has made it easier to monitor compliance; for example, it picks up failure to file
a declaration or to file it on time is picked up by
21 (i) Penalties for late filing or non-filing of tax declarations: ETB 1000 for first 30 days, ETB 2000 for next 30 days, ETB 1500
for e ach 30 days thereafter; (ii) Penalties for understatement of tax in tax declaration: 10 percent of understated amount, or 50 percent if the understatement exceeds 25 percent of the tax required to be declared or exceeds ETB 20,000, whichever is smaller; (iii) Penalty for late payment: 5 percent of unpaid tax on the first day after the due date; an additional 2 percent for each following month; (iv) Penalty for failure to keep proper records: 20 percent of tax assessed and loss of business license if the failure continues for two years; (v) Penalty for failure to withhold tax: .ETB 1000 on manager/senior accountant for each instance of failure; (vi) Failure to meet TIN requirements: a withholding agent who makes a payment to a person who has not supplied a TIN is required to withhold 30 percent of the payment and the person to pay a fine of ETB 5,000. ..
22 (i) TIN violation: If a person has more than one TIN, he/she is required to pay a fine of ETB 20,000-ETB 50,000 and to imprisonment of years for each extra TIN; (ii) Tax evasion: At least 5 years in prison; (iii) False or misleading statements: Fines ranging between ETB 1000-200,000 and/or imprisonment of 1-15 years, depending on the extent of underpayment and the extent that the falseness is deliberate; (iv) Obstruction of tax administration, offences by tax authority employee, unauthorized tax collection: fines of at least ETB 10,000 and 2 years imprisonment; and (v) Failure to keep receipts generated by sales register machines, 2 years imprisonment.

Southern Nations and Nationalities Peoples’ Regional Government –
PEFA Assessment
Page 45
The consistency of administration is not so easy to judge. Capacity constraints imply the
possibility of inconsistent administration.
(iii) Planning and monitoring of tax audit programs
Following the BPR exercise referred to under PI-13 above, the tax audit system is in the
process of being strengthened through the creation of a Tax Audit Department, the adoption
of a risk-based audit approach and carrying out of audits based on annual audit plans. The RA
has established clearly defined risk assessment criteria with regard to tax audits.
Score Minimum Requirements Justification Information Sources
B▲ (M2)
As listed in PEFA Framework
B (i) Controls in the taxpayer registration system Taxpayers are registered in a complete database system with some linkages to other relevant government registration systems and financial sector regulations.
Any person or business with potential tax obligations is required to have a unique TIN. A major control point is the requirement of a TIN in order to obtain a business license or open a bank account. The recent (September 2009) introduction of biometric finger prints will facilitate the increased coverage of actual and potential taxpayers by the TIN. The TIN is now well-established at regional bureau level (the scope of this assessment) though not yet at zonal administration and woreda government level.
--Tax Proclamations --Head of RA
B (ii) Effectiveness of penalties for non-compliance with registration and declaration obligations Penalties for non-compliance exist for most relevant areas, but are not always effective due to insufficient scale and/or inconsistent administration..
Substantive penalties, high enough to act as a deterrent, are listed in the tax proclamations. The evidence is not sufficient to demonstrate consistent administration. Capacity constraints may lead to inconsistent administration.
-- Tax proclamations. -- Head of RA
C▲ (iii) Planning & monitoring of tax audit and fraud investigation programs There is a continuous program of tax audits and fraud investigations, but audit programs are not based on clear risk assessment criteria.
A system of audit plans based on clearly defined risk assessment criteria was instituted early in 2009/10 under the responsibility of a newly created Audit Department, one of the results of the BPR. The system needs to “bed-down” first before it can justify a B rating..
-- Head of RA
3.5.3 PI-15: Effectiveness in collection of tax payments
Collection effectiveness is determined by reviewing: (i) collection ratio for gross tax arrears
(percentage of tax arrears at the beginning of a fiscal year, which was collected during that
fiscal year); (ii) effectiveness of transfer of tax collections to the Treasury by the revenue
administration; and (iii) frequency of complete accounts reconciliation between tax
assessments, collections, arrears records and receipts by the Treasury.

Southern Nations and Nationalities Peoples’ Regional Government –
PEFA Assessment
Page 46
(i) Collection ratio for tax arrears
This dimension cannot be rated as the RA does not as yet collect the information in the format
necessary to rate it. In relation to Category A and B taxpayers, information on tax debt can be
collected on the basis of tax payer files, but as yet it is not collated. In the case of Category C
taxpayers, who are liable to presumptive turnover tax, the definition of tax debt becomes
hazy, as the RA assesses the amount of tax due on the basis of incomplete information (by
definition, as Category C taxpayers do not keep books of account).
The SIGTAS, once expanded to cover all taxes (currently it mainly covers VAT), would
enable improved recording and tracking of tax debt.
(ii) Effectiveness of transfer of tax collections to the Treasury
A large proportion of taxes collected by RA branches in woredas and town administrations is
deposited with WOFEDs and TOFEDs (town administration finance and economic
development offices). In the interests of efficiency, and particularly in the case of Agricultural
Personal Income tax and Rural Land Use fees, this is directly spent by WOFEDs/TOFEDs up
to the approved budget limit rather than remitting to ZOFEDs/BOFEDs, with a commensurate
offsetting in the amount of block grant transfer.
Revenue collected by RA branches that is not deposited with WOFEDs/TOFEDs is allowed
to accumulate to ETB 5000 in the RA’s safety deposit box, prior to deposit in RA bank
accounts held in local branches of Commercial Bank of Ethiopia (CBE). The transfer may not
be made for up to a month, depending on the time of year. The frequency of tax collections is
not even during the year, reflecting seasonal influences. For example, the end of October is a
deadline for declaring profits tax, and cash may accumulate in RA branches up to that point,
resulting in a spike in transfers to RA bank accounts after that date. Starting in 2010/2011
(EFY 2003) taxpayers will be able to deposit payments straight into the RA bank accounts
held in local branches of CBE; currently there is no way of doing this.
Tax revenues deposited by RA branches into their accounts held in CBE are transferred to
BOFED’s bank account 3 times a month.
(iii) Frequency of reconciliations between tax assessments and amounts received by the
Treasury
Tax auditors in RA branches check on tax collections, deposits in RA bank accounts and
amounts sent to BOFED. However, tax debtor records are not complete or well-defined
(mainly due to the bulk of taxpayers in Category C), hindering rigorous reconciliation
between tax assessment and collections. Manual recording systems still predominate (use of
SIGTAS is still evolving, connectivity problems constraining the speed of adoption) and the
errors that tend to go with these also hinder rigorous reconciliation.

Southern Nations and Nationalities Peoples’ Regional Government –
PEFA Assessment
Page 47
Score Minimum Requirements Justification and data sources Information
Sources
D+ (M1)▲
No Score
(i) Collection ratio for gross tax arrears and ratio of tax arrears to total tax revenue collections The RA as yet does not record data on tax debts that would enable this dimension to be rated.
The RA does not keep records in such a way that tax debts (and their age) can readily be tracked. In the case of Category A and B taxpayers, information on tax debts is available in tax payer files, but is manually recorded, with scope for errors, and the information is not systematically collated. In the case of Category C tax payers (those who pay presumptive tax), a significant number of assessed tax debts is disputed by tax payers and the definition of tax debt becomes hazy. Further roll out of SIGTAS will enable more systematic recording of tax debts..
-- Head of RA.
C▲ (ii) Effectiveness of transfer of tax collections to the Treasury by the revenue administration. Revenue collections are transferred to the Treasury at least monthly.
A large proportion of tax revenues collected by RA branches in woredas and town administrations is deposited with WOFEDs/TOFEDs for their expenditure according to their approved budgets. The block grant transfers are reduced by a commensurate amount. Other tax revenues are, in time (perhaps up to a month), deposited in RA bank accounts held in CBE branches. Deposits in RA bank accounts are transferred to BOFED’s bank account 1-3 times a month. Starting in 2010/2011, tax payers will be able to pay tax liabilities direct into RA bank accounts, facilitating speed-up of deposits of tax revenues into BOFED’s bank account. .
-- Head of RA.
D (iii) Frequency of complete accounts reconciliation Complete reconciliation of tax assessments, collections, arrears, and transfers to Treasury does not take place annually or is done with more than 3 months delay.
This follows from the No Score for dimension (i). As tax debts are not rigorously defined (in the case of presumptive tax) and tracked, the stock of tax debts in arrears is not rigorously recorded, and thus complete r reconciliation between tax assessed and tax collection is not possible.
-- Head of RA.
3.5.4. PI-16: Predictability in the availability of funds for the commitment of
expenditures
Effective execution of the budget in accordance with work plans requires that spending
ministries and agencies receive reliable information on the availability of funds within which
they can commit expenditure.
(i) Extent to which cash flows are forecast and monitored
Bureaus are required to prepare cash flow forecasts (based on disaggregated revenue and
expenditure projections, taking into account future payments becoming due on the basis of
commitments entered into earlier and taking into account pre-payment advances to
contractors) at the beginning of the new financial year on a quarterly and monthly basis. If
necessary, these are updated every month on the basis of actual cash inflows and outflows. In
practice, capacity constraints result in quarterly updating as a matter of routine. BOFED uses
the cash flow forecasts to estimate cash balances at the end of each month and then to prepare
monthly spending limits for each bureau.
About 30 percent of SNNPRG’s domestically financed expenditure (excluding its highly
predictable subsidies to zonal administrations) is for personnel emoluments, which is highly
predictable on a month to month basis (this may seem low, but labour-intensive service

Southern Nations and Nationalities Peoples’ Regional Government –
PEFA Assessment
Page 48
delivery, particularly for education and health care services is mainly at zonal administration
and woreda level). Thus, cash flow forecasting is of importance to about 70 percent of total
SNNPRG domestically-financed expenditure (excluding subsidies to zonal administrations,
which are highly predictable also on a month to month basis).
Forecasting of receipts of donor project/programme assistance is problematic; a complaint
often heard by the assessment team was that in-year predictability of these funds tended to be
low (because of the bureaucratic procedures of donors and failure of fund recipients in
meeting conditionalities on time). This dimension is rated, however, only in relation to
‘domestic’ cash flow forecasting, as SNNPRG only has direct access to cash balances held in
the Central Treasury Account (donor funds tend to be deposited in segregated bank accounts).
(ii) Reliability and horizon of periodic in-year information to regional bureaus on ceilings for
expenditure commitment
The only ceiling on expenditure commitments is the approved budget itself. The internal
control system (PI-20) guards against spending commitments being entered into that are not
covered by the approved budget or that would cause the approved budget limit to be
exceeded. The purpose of the monthly cash spending ceilings, derived from the cash flow
forecasts (dimension i), is to help keep spending to within the amount of cash available.
Given the inherent element of uncertainty in cash flow forecasting, it may be the case that a
cash shortage might arise (borrowing is prohibited), but, in practice, this situation usually
does not arise due to revenue collection being higher than budgeted revenues.. In the
circumstances where a cash shortage does arise, the BOFED and relevant sector bureaus can
determine the feasibility of an offsetting adjustment or allocate funds from the contingency
budget. Failing this, BOFED can request MOFED for temporary assistance (supported by a
cash flow forecast for the remainder of the year).
(iii) Frequency and transparency of adjustments to budget allocations, which are
decided above the level of management of regional bureaus
The Federal Financial Administration Law (both the previous 2003 law and the new 2009
law), along with the Financial Regulations under the previous law, and the annual Budget
Proclamation laws provide for a degree of transparency in making adjustments (the laws and
regulations at regional government level are very similar to the Federal Government laws).
Two types of adjustments can be made to budget allocations, above the level of sector bureau
management:
o Transfers between public bodies, spending ceiling unchanged: the BOFED head
can authorize transfers between bureaus with respect to capital expenditure that
leave total spending unchanged (allocating from the capital budget to the recurrent
budget is not allowed); prior regional council approval is not required. The low
score for PI-2 indicates that transfers are substantial in monetary terms. Only the
total value of transfers in and out for each bureau is reported, but this says nothing
about frequency. There is no reported record of the frequency of adjustments,
although the date of each adjustment is presumably contained in the original
source data. However, the head of BOFED’s Financial Administration and
Property Management Department indicated verbally that the transfers take place

Southern Nations and Nationalities Peoples’ Regional Government –
PEFA Assessment
Page 49
in two main batches, one half-way through the year, the other near the end of the
year.
o Supplementary budgets, total spending ceiling increased: Only one supplementary
budget per year is presented to the Regional Council for approval. This cannot
happen until January at the earliest. In principle, the Regional Council is supposed
to approve the supplementary budget before the proposed new spending takes
place in exactly the same way that it approves the initial budget before spending
takes place.
Recent Developments
The BPR exercise completed during 2008/09 combined with the increased emphasis placed
by the new Federal Government Financial Administration Proclamation (August 2009) on
cash flow forecasting (but yet to be supported in revised Financial Regulations and
Directives) are contributing to improved cash flow forecasting.
Score Minimum Requirements Justification Information Sources
B+ (M1)
B (i) A cash flow forecast is prepared for the fiscal year and is updated at least quarterly on the basis of actual cash inflows and outflows.
Information provided by BOFED. The updating is supposed to be monthly, but in practice, due to capacity constraints, it is quarterly.
-- BOFED FAPMD.. -- Draft East Afritac (IMF) Aide Memoire on Cash Management and Banking Arrangements in Ethiopia, February 2010.
A (ii) Bureaus are able to plan and commit expenditure for at least 6 months in advance in accordance with the budgeted appropriations.
The cash flow forecasting framework, combined with the internal controls guarding against over commitments (PI-20), and the ability to access the contingency budget or access temporary financing from MOFED in the event of unexpected cash shortfalls, enable commitment of expenditures within a medium term time horizon.
-- BOFED FAPMD..
B (iii) Significant in-year adjustments to budget allocations take place only once or twice a year and are done in a fairly transparent way.
Significant in-year adjustments in monetary terms take place above the level of bureau management through: (i) transfers between bureaus authorized by BOFED Head, typically in two main batches, half-way and near to the end of the year; and (ii) supplementary budgets (increase in total spending ceiling) requiring prior approval of Regional Council, typically once a year.
-- BOFED FAPMD. -- SNNPR Regional bureau Budget Performance Reports -- Financial Administration Laws and Regulations. -- Annual Budget Proclamation Laws.
3.5.5. PI-17: Recording and management of cash balances, debt and guarantees
(i) Quality of Debt Recording and Management
Under the Financial Administration Proclamation, the SNNPRG is not allowed to borrow. It
may be allowed to borrow in future once it enacts a new Financial Administration
Proclamation based on the new (August, 2009) Federal Government Financial Administration
Proclamation.
Southern Nations and Nationalities Peoples’ Regional Government –
PEFA Assessment
Page 50
(ii) Extent of Consolidation of the government’s cash balances
As part of cash management reform aimed at reducing the stock of unutilized cash sitting in
bank accounts, a zero-balance account (Z accounts) system was instituted in 2004/05 and
became fully operational in 2007/08.23
Under this system, bureaus have ‘virtual’ accounts at
Commercial Bank of Ethiopia (CBE) into which funds are deposited each day by BOFED
from its central treasury account (CTA) held at National Bank of Ethiopia up to the cash
availability limits set by BOFED. These limits are set on the basis of the cash requirements of
sector bureaus indicated in the monthly cash flow projections they make at the beginning of
each year (PI-16). Bureaus can draw-down from the virtual account the funds required for
making payments (for salaries, non-wage recurrent expenditure and capital expenditure) up to
the monthly limit, subject to the provision of supporting documentation (for non-wage
expenditure). Unused deposits are “swept” back into the CTA at the end of each day. In
effect, the CTA and the Z accounts constitute a Treasury Single Account (TSA). Balances are
calculated on a daily basis. Previous to this system the SNNPRG BOFED was making direct
payments in cash on behalf of the sector bureaus.
In addition to the Z accounts, there are donor project bank accounts and revenue bank
accounts. Donor funds provided through Channel 1 are deposited in bank accounts (known as
A accounts) under the control of BOFED, but they cannot be zero-balanced at the end of each
day; i.e. the balances are known but are not consolidated into the central treasury account.
Donor funds provided through Channel 2 (including for extra-budgetary funds such as the
Global Fund) are deposited into commercial bank accounts under sector bureau control (but
BOFED approval is still needed to open them). Protection of Basic Services (PBS) funds are
effectively budget support funds and are deposited into the CTA. Most deposits in SNNPRG-
controlled bank accounts are with TSA.
With regard to revenue bank accounts (known as B accounts), these are held by RA branches
for the purpose of depositing revenues into them; the revenues are subsequently transferred to
CTA (see PI-15 ii).
(iii) Systems for contracting loans and issuance of guarantees
The SNNPRG is not allowed to borrow or guarantee loans.
EMCP Impact Assessment Study: With regard to SNNPR, the study notes the benefits
associated with the zero balance system in terms of elimination of idle cash balances, less
paperwork and the shorter payments process in terms of time (also a benefit of IBEX, which
has been rolled out to regional bureaus).
23
Under EMCP, a cash management manual was prepared at Federal Government level, which has helped to guide strengthening of cash management at regional level. On the basis of the BPR conducted for BOFED, the FAPMD prepared a cash management manual in 2008/09 to help further strengthen cash management.

Southern Nations and Nationalities Peoples’ Regional Government –
PEFA Assessment
Page 51
Score Minimum Requirements Justification Information Sources
(M2) B (ii) Extent of consolidation of
government’s cash balances Most cash balances are calculated and consolidated at least weekly, but some extra-budgetary funds remain outside the arrangement.
The bulk of SNNPRG’s bank balances are under the CTA/Z accounts, effectively the TSA; consolidation takes place by definition every day and balances are calculated daily. Bank balances outside this arrangement, such as donor project and extra-budgetary fund accounts, are calculated regularly but not consolidated with the TSA balances.
-- BOFED FAPMD. -- IMF (East AFRITAC) draft technical assistance report: “Review of Cash Management and Banking Arrangements in the Federal Government of Ethiopia”, February 2010.
3.5.6. PI-18: Effectiveness of payroll controls
As a major component of expenditure, effective control of the payroll is an important
indicator of sound financial management. This indicator is concerned with the payroll of
public servants only; wages for casual labor and discretionary allowances are included in the
assessment of general internal controls ( PI-20).
Given the decentralised nature of personnel and payroll management, the assessment team
met officials from the SNNPR Education, Health, Water Resources Development and
Agriculture and Resources Development Bureaus as well as from BOFED; their observations
mainly match the observations of BOFED.
(i) Degree of integration and reconciliation between personnel records and payroll data
Payroll and personnel management are decentralized to budget institutions (BIs: bureaus,
offices, authorities, institutes) in the Ethiopian regions (which, in SNNPR, exclude the zonal
administrations, which are classified as the next lower level of government). The processes
for both, designed by BOFED, are the same in all BIs.24
Wages and salaries are paid by
Financial Administration and Property Management Departments (FAPMD) on the 24th
of
each month on the basis of the personnel contained in its payroll system (originally prepared
by Human Resource Departments, HRDs), adjusted for any changes submitted by the HRDs,
including attendance-related changes. In this regard, managers of departments are required to
submit to HRDs signed attendance records of the staff under them. From time to time, the
Civil Service Agency checks that the positions of the staff on the list is consistent with the list
of established positions.
(ii) Timeliness of changes to personnel records and the payroll
Changes to personnel records (hiring, firing, less than full attendance, retiring, promotions,
demotions, position shift) are the responsibility of HRDs, following notification by the head
of the employee’s department; attendance is monitored through the compulsory signing by
department managers of staff attendance sheets, which are then submitted to HRDs. In order
for changes to be reflected in the payroll for the month in which the change is made, HRDs
24 Teacher payrolls tend to be large in most countries, including Ethiopia and thus tight controls on them are particularly
important. In SNNPR, education sector payrolls fall under different BIs: the Education Bureau itself, and four teacher training colleges (see Annex 1) Secondary and primary schools fall under woreda governments. Most health care BIs (health service provision is also relatively labour-intensive) are at zonal administration and woreda level.

Southern Nations and Nationalities Peoples’ Regional Government –
PEFA Assessment
Page 52
need to send a revised list to FAPMDs by the 20th
or 21st of the month. Otherwise a
subsidiary payroll will be made later that month or early the next month, or in the next
month’s payroll.
(iii) Internal controls of changes to personnel records and the payroll
The main controls are: (i) the Heads of HRDs and FAPMDs and their subordinates (head of
personnel, the chief accountant and cashier); these have to sign off on the staff list and payroll
list, prepared by staff at lower levels, i.e. in line with the principle of the segregation of
duties; changes made by HRD to staff lists are sent by the Head of HRD to the Head of
FAPMD, who then submits the changes to the payroll officer; (ii) the staff member being paid
also has to sign off; (iii) only one or two employees are authorized by heads of budget
institutions to access the computerized (Excel spreadsheet) payroll system and then only
through the use of a password provided by the IT Department; (iv) the staff in charge of the
payroll cannot change the list of personnel provided by HRDs to FAPMDs. The Water
Resources Development Bureau FAPMD head showed the team examples of a monthly
payroll database form 25
(iv) Existence of payroll audits to identify control weaknesses and/or ghost workers
The internal audit function is only just getting off the ground in some of the SNNPRG BIs,
including the Agriculture and Resources Development, the Education, and Water Resource
Development Bureaus (PI-21). The IADs are required to audit the payroll every month, but
capacity constraints are precluding this. Instead, the Inspectorate Department in BOFED has
been auditing payrolls of bureaus, including that of the Health Bureau; its IAD has been
functional since 2006/07, but has been short of staff until 2009/10. The Office of the Regional
Auditor General (ORAG) (PI-26) also audits the payroll of bureaus as part of its audits of
bureaus.. ORAG covers all bureaus over a period of 2-3 years, the major ones, including the
ones visited by the assessment team, annually.
25
The Water Resources Development Bureau FAPMD head showed the team examples of a monthly payroll database form for a sample sub-agency, showing the name of each staff person, the number of days worked that month, the gross salary, allowances, deductions (income tax, pension contributions, loan servicing) and net income. Each staff person has to sign, and at the bottom of the form, the signatures of the Chief Accountant, the Administration and Finance Head and the Cashier are required.

Southern Nations and Nationalities Peoples’ Regional Government –
PEFA Assessment
Page 53
Score Minimum Requirements Justification Information
Sources B+
(M1)
B (i) Degree of integration and reconciliation between personnel records and payroll data Personnel data and payroll data are not directly linked, but the payroll is supported by full documentation for all changes made to personnel records each month and checked against the previous month’s payroll data.
The linkages between the personnel records and the payroll are manual, but the decentralized nature of the payroll system facilitates close linkages. Human Resources Departments notify the FAPMD of any changes to staff lists (through retirements, new recruitment, promotions, demotions, and insufficient attendance, monitored through attendance sheets -- department heads send attendance sheets to HRD each month). The Civil Service Agency also checks this list periodically (to check that staff positions are covered in the civil service establishment list).
-- BOFED FAPMD. -- FAPMDs of the Education, Health, Agriculture and Resources Development; and Water Resources Development Bureaus. - Payroll database form provided by Water Resources Development Bureau.
A (ii) Timeliness of changes
to personnel records and the payroll data Required changes to the personnel records and payroll are updated monthly, generally in time for the following month’s payroll. Retroactive adjustments are rare.
The decentralized nature of the payroll management system supports timely changes to personnel records followed by timely changes to the payroll. Changes made to personnel records after the 24th of each month are reflected before the end of the month or in next month’s payroll.
-- Ditto.
A (iii) Internal controls of changes to personnel records and the payroll Authority to change records and payroll is restricted and results in an audit trail.
Heads of HRDs and FAPMDs and their subordinates have to sign off on staff lists and payrolls lists, prepared by subordinates. Changes to staff lists are supported by documentation, including signed attendance lists. Requests for changes to the payroll are officially sent by Heads of HRDs to Heads of FAPMDs, who authorizes the payroll staff (one or two, designated by the Bureau Head) to make changes. The monthly payroll database form requires three signatures (and also the signature of the staff person).
-- Ditto
B (iv) Existence of payroll audits to identify control weaknesses and/or ghost workers A payroll audit covering central government entities has been conducted at least once in the past three years (whether in stages or as one single exercise).
IADs in sector bureaus are only just getting off the ground (since July 2009) except for the Health Bureau IAD, which has been functional since 2006/07. Payroll audits are supposed to be conducted every month by IADs, but capacity constraints are precluding this. The scope of ORAG’s annual audits of the major bureaus (including the four visited by the assessment team) includes payroll audits.
-- Inspection Department in BOFED; -- FAPMDs of the four bureaus visited. -- Auditor General, ORAG.
3.5.7. PI-19: Competition, value for money and controls in procurement
A well-functioning procurement ensures that money is used efficiently and effectively.
In rating this performance indicator, the assessment team visited the Education, Health, Water
Resource Development and Agriculture and Resources Development Bureaus in addition to
BOFED staff.
SNNPRG’s procurement legislation is governed by Proclamation 96 (March 2006) calendar),
itself based on the federal procurement proclamation (2005), and supporting directives and
Southern Nations and Nationalities Peoples’ Regional Government –
PEFA Assessment
Page 54
manuals. A major feature of the legislation was the introduction of standard bidding
documents. The Federal Government enacted a new procurement proclamation dated August
2009, the main difference being the extension of coverage to property administration (one of
the products of BPR). The SNNPRG is currently revising its procurement legislation to bring
it into line with the new federal government proclamation. In late 2009, it issued a directive
that requires budget institutions to follow the revised (higher) procurement thresholds
established under the new federal government proclamation.
Procurement responsibility was devolved to public bodies through the earlier federal
government proclamation. The FAPMD in BOFED handles bulk purchases for zones and
woredas (e.g. vehicles, machines, printing) and plays a regulatory, standard setting, technical
advisory, training, inspection, monitoring, and complaints addressing role. As a result of BPR
(completed in early 2009), the responsibility for procurement, previously under a separate
department, has been subsumed under newly created (as of the beginning of 2009/10)
Financial Administration and Property Management Departments (FAPMD), previously
known as Financial Administration Departments. Operational departments intending to
procure goods and services are now required to prepare annual procurement plans for
submission to FAPMDs. Some efficiency gains are being achieved, notably a sharp reduction
in the number of days required to procure goods and services. 26
(i) Use of open competition for award of contracts that exceed the nationally
established monetary threshold for small purchases
As specified in the procurement proclamation (Chapter IV, section 18), open competition is
the preferred method of tendering above ETB 5,000. Purchases up to this amount can be made
by the procuring entity without reference to the tendering committee of the budget institution
under which the procuring entity falls. Procurement methods other than through open
competition (international or national) can be used above this threshold under circumstances
specified in the legislation: request for quotations, direct procurement (sole source supplier,
for example, in the case of spare parts), two stage tendering (rarely used), and restricted
tendering. The FAPMD advises departments intending to procure goods and services on the
type of tendering method to use.
The maximum threshold for requests for quotations is ETB 50,000; at least three quotations
are required and have to be analysed by the procuring organisation’s tender committee and
then approved by the head of the procuring organization.
The maximum thresholds for restrictive tendering are ETB 2 million for construction
contracts (revised from ETB 1 million under the directive issued in September 2009), and
ETB 500,000 for goods and services (revised from ETB 250,000). Open competition –
national or international competitive bidding -- is compulsory above these thresholds, and
only international competitive bidding can be used for construction contracts above ETB 20
million, goods purchases more than ETB 5 million, consultancy services more than ETB 1
million and other services more than ETB 3 million (according to the September 2009
directive). Prior approval of the head of the procuring organization is required if restrictive
tendering is proposed.
26
Prior to the 2006 procurement proclamation, complaints were mainly handled by the Transport bureau in the context of vehicle purchases.

Southern Nations and Nationalities Peoples’ Regional Government –
PEFA Assessment
Page 55
In principle, procurement sections of FAPMDs in budget institutions can collate data on
contracts awarded, in terms of numbers, values and type of procurement method and send the
information to the procurement section in the BOFED FAPMD. In practice, with the
exception of the FAPMD Health Bureau, data is not collated systematically, due to capacity
constraints, although the information can be marshaled for auditing purposes. Thus BOFED is
unable to collate information on procurement, even though the procurement legislation
requires budget institutions to maintain procurement-related records and documents (Chapter
III, section 9) to send the information to BOFED if requested (Chapter II, section 9).
(ii) Justification for use of less competitive procurement methods above the threshold
The procurement legislation clearly outlines the criteria under which less competitive
procurement methods above the threshold can be used (Chapter IV). As indicated in (i),
BOFED does not keep an official record of contracts awarded and the extent and the reasons
for the use of less competitive procurement methods, notwithstanding its legislated inspection
role. The internal audit departments in the budget institutions are supposed, inter alia, to
assess how well the procurement law and its directives are being complied with by
procurement sections. As mentioned in PI-21, however, the internal audit function has only
recently started to function fully.
Nevertheless, the procurement section of BOFED claims, on the small sample of procurement
contract data that it obtains, that the use of restrictive tendering is generally well-justified, in
accordance with the legislation.
The FAPMD in the Health Bureau claims that the use of open competition has increased
sharply and, correspondingly the use of less competitive procurement methods has fallen
sharply since the BPR due to the streamlining measures taken; more than 20 contracts had
been awarded through open competition within the last nine months. Prior to BPR,
procurement was a long process (even purchasing small items such as pens could take
months). Nevertheless, the specific nature of health services justified use of less competitive
procurement methods for purchasing items such as medicines and condoms (the
Pharmaceutical Supply and Financing Agency responsible for purchasing such items is an
SNNPR government organization).
The FAPMD in the Water Resources Development Bureau informed the team that it rarely
uses open competition, as nearly all its large projects are financed by donors, who require that
their own procurement procedures have to be followed.27
For procurement using SNNPRG
procedures, it tends to use open competition for purchases above ETB 75,000, but purchases
of this scale were rare.
(iii) Existence and operation of a procurement complaints mechanism
The procurement legislation provides for a mechanism for submitting complaints (Chapter
VIII of procurement proclamation: Submission of Complaints on Public Procurement). In the
first instance, any complaints about the way the procurement process has been conducted are
submitted to the tender committee in the procuring organization, then, if the complaint is not
27
FAPMD also mentioned that procuring under World Bank and African Development Bank guidelines could take several months.

Southern Nations and Nationalities Peoples’ Regional Government –
PEFA Assessment
Page 56
addressed to the satisfaction of the complainant, to FAPMD, then to the head of the procuring
organization. The complaint has to be submitted within 5 days of the circumstances justifying
a complaint becoming known. The head of the procuring organization has up to 15 days to
reply. If he/she doesn’t reply or the complainant is not satisfied with the reply, the complaint
may be submitted to the procurement section of FAPMD in BOFED, which has 15 days to
reply. If still dis-satisfied, the complainant can take the matter to the Regional Council, and,
failing that, the courts.
FAPMD in BOFED informed the assessment team that it receives 6-10 complaints a year,
although the number of complaints has fallen sharply during 2009/10, partly due to the
streamlining achieved as a result of BPR. Zero complaints go to court (too time consuming).
In practice, most complaints are resolved within the procuring organization; the Education
Bureau informed the assessment team that no complaints go to BOFED. The Health Bureau
said that most complaints are resolved at an early stage, prior to reaching the head of the
bureau.
Although provided for in the procurement proclamation, it has taken until this year (2009/10)
for the procurement complaints mechanism to become fully operational.
At present, unlike at the Federal Government level, there is no procurement-specific external
body that can impartially review complaints (though the establishing of such a body is being
considered).
EMCP Assessment Study
The study indicates: (i) the procurement law and directives have been implemented region-
wide since 2005 (EFY 1998), procurement manuals distributed and training delivered; (ii) the
standard bid document distributed to all offices in the region and implemented by most of the
sector bureaus (less so for ZOFED and WOFEDs); (iii) BOFED approved a procurement
service structure comprising 5 staff, though the full complement of staff has not yet been
reached in some cases; (iv) a directive on pool procurement method for zones and woredas
was distributed; (v) the survey indicated perceived improvements in the system, but also
pointed out issues concerning inconsistency of rules as per the procurement manual and
directives, lack of flexibility on the procurement of urgently needed goods, repeated
cancellation of awards, lack of adequate training, absence of qualified experts, poor
procurement planning, lack of attention to quality of goods received, and insufficient
technical support from MOFED/BOFED.

Southern Nations and Nationalities Peoples’ Regional Government –
PEFA Assessment
Page 57
Score Minimum Requirements Justification Information Sources
C (M2)
D (i) Use of open competition for award of contracts that exceed the nationally established monetary threshold for small purchases Insufficient data exist to assess the method used to award public contracts.
Procurement is in most cases the responsibility of procuring entities established within budget institutions (e.g. sector bureaus). These do not send procurement information to FAPMD in BOFED, because capacity constraints within the budget institutions (except for the health bureau) hinder the collation of information, and also, it seems, because BOFED does not request it (although the legislation provides for such requests).
-- SNNPRG procurement proclamation. -- Head of procurement section in BOFED FAPMD. -- FAPMD staff in the four bureaus visited.
C (ii) Justification for use of less competitive procurement methods Justification for use of less competitive methods is weak or missing.
The procurement proclamation indicates clearly the criteria for using less competitive procurement methods above the threshold. As BOFED collects very little information on procurement, it does not have a good handle on whether use of less competitive procurement methods is justified. The bureaus visited by the assessment team claim that use of less competitive methods is justified when it happens (to a lesser extent now, since the BPR). FAPMD advises on types of procurement methods to use and the head of the procuring organization has to approve. IADs have a role in assessing whether justification has been demonstrated in terms of the criteria listed in the proclamation, but the internal audit function is still developing.
-- As above.
B (iii) Existence and operation of a procurement complaints mechanism A process (defined by legislation) for submitting and addressing procurement complaints is operative, but lacks ability to refer resolution of the complaint to an external higher authority.
The procurement legislation provides for a complaints submission mechanism. This is operative, though still in an early stage of use. A procurement-specific external higher authority is not provided for in the legislation; complaints above the level of BOFED have to go through the court system. In practice, most complaints are resolved within the procurement entity itself. The streamlining measures arising from BPR has led to a fall in the incidence of complaints.
-- As above.
3.5.8. PI-20: Effectiveness of internal controls for non salary expenditure
The control systems in the Federal Government date back to the time of Emperor Haile
Selassie, who adopted a mix of French and British-type systems. The regions, prior to
decentralization, used the same control systems and have continued to use them since
decentralization. The financial control systems are embedded in the Financial Regulations
(themselves derived from the Financial Administration Proclamation) and associated internal
directives and other control systems, such as those related to personnel management, are
embedded in the Civil Service regulations. The Internal Audit Manual of the Federal
Government, contains the basic principles of internal control systems. The recently (mainly
during 2008/09) BPR exercises are resulting in streamlined control systems in the interests of
greater efficiency.
(i) Effectiveness of expenditure commitment controls
Section 25 of the 2003 Federal Government Financial Administration Proclamation (the
regional government proclamations are virtually the same) and Section 32 of the 2009 Federal
Government Financial Administration Proclamation state that expenditure commitments
cannot be entered into without approval of the head of the public body (or a person authorized
by him) and without a “sufficient unencumbered balance from the budget to discharge any
debt that will be incurred during the fiscal year in which the contract or other arrangement is

Southern Nations and Nationalities Peoples’ Regional Government –
PEFA Assessment
Page 58
made”. Penalties for spending commitments entered into without supporting budget
appropriation are fines and up to 10 years’ imprisonment (Section 70 of the Financial
Administration Proclamation, paragraph 4).
As noted under PI-16 (ii), this means that commitments depend only on the approved budget,
not on actual cash availability. However, cash flow forecasting (PI-16 i), the quality of which
is gradually improving, and more efficient cash management on the basis of the expanded
Treasury Single Account system (PI-17 ii) help to reduce the risks of cash not being available
when the time comes up for payment (which may be a few months away, depending on the
nature of the commitment).
Managers in all the regional BOFEDs met by the assessment team strongly emphasized the
strength of the controls over expenditure commitments, in terms of compliance with the
approved budget.
(ii) Comprehensiveness, relevance and understanding of other internal controls and
processes
Basic internal controls in place are: segregation of duties and multiple signature systems (at
least two for each transaction), prompt and proper recording of transactions and events, pre-
numbering (sequentially) of originating documents (such as goods’ received notes, cash
receipts (as noted in PI-7) and invoices, and accounting for these; independent recording of
transactions in control accounts and periodic checking of these with the balances on the
appropriate ledger; reconciliation of cash books with bank statements; cross-checking of
documents (e.g. invoice with purchase order and goods received note); and verification of
physical assets.
The BPR is resulting in some streamlining of controls, for example, reduction in the number
of signatures required, accompanied by greater “pin-pointing of responsibilities” and greater
flexibility for department managers (e.g. a department manager can provide budget execution
information directly to the Accounts Section rather than go through the Bureau Head each
time). The streamlining was tested during May-June 2008/09 and rolled out at the beginning
of 2009/10. As the internal audit function develops (PI-21), further streamlining and
managerial flexibility will evolve.
With regard to personnel management, controls include: (i) Leave approval: 30 days annual
leave are allowed. Leave is approved by the Personnel Office and further approved by the
Bureau Head; (ii) Sick leave: a physicians note is required; (iii) Study Leave: if the study
leave is for one year, for example, the officer must return to service for at least two years,
otherwise he/she must pay back any public monies received to finance the study leave.
Standardised forms must be used for applying for the types of leave indicated above.
Use of government assets, such vehicles, is controlled, even more so since the emphasis on
good property management was strengthened as a result of BPR (through the Financial
Administration Department’s responsibilities being supplemented with property management
responsibilities). Use of vehicles is monitored in terms of who is using them, the time when
they leave the office and the time they return. A BOFED circular issued in 2009 stipulated
that government vehicles had to be parked on government premises during public holidays.

Southern Nations and Nationalities Peoples’ Regional Government –
PEFA Assessment
Page 59
Documentation on regulations and procedures covering virtually all processes is readily
accessible in offices and in documentation centres in budget institutions, enabling good
understanding by staff. Heads of departments ensure that all staff have access to the
documentation. Documentation also includes the IBEX manual, which helps staff understand
better the financial control system. HRDs brief new recruits on regulations and procedures
and organizes training courses, particularly on IBEX.
(iii) Degree of compliance with rules for processing and recording transactions
Compliance is good (according to FAPMD heads met by the assessment team), not just
because of a general culture of compliance that goes back several years, but also because of
administrative penalties that may apply if rules and procedures are violated; for example,
leave taken in excess of the approved amount without prior notification may be deducted from
salary payments.
Score Minimum Requirements
Justification Information Sources
B (M1)
Listed in PEFA Framework
B (i) Effectiveness of expenditure commitment controls Expenditure commitment controls are in place and effectively limit commitments to actual cash availability and approved budget allocations for most types of expenditure, with minor areas of exception.
Commitments are authorized on the basis of the approved budget allocations (as specified in the legislation).Good revenue performance (PI-3), Strengthened cash flow forecasting and cash management systems (PIs 16 and 17) help to minimize the risk of cash unavailability at the time of actual payment. In addition, if there is a serious risk of a cash shortfall, managers try to find offsetting adjustments in other parts of the budget.
-- Financial Administration proclamations (2003 and 2009) and Regulations (2003). -- BOFED FAPMD and Inspection Department staff.
B (ii) Comprehensiveness, relevance and understanding of other internal control rules/procedures Other internal control rules and procedures incorporate a comprehensive set of controls, which are widely understood, but may in some cases be excessive and lead to inefficiency.
Financial and non-financial control systems are comprehensive, well documented and generally understood. The BPR exercises identified areas where controls could be streamlined, resulting in efficiency gains, partly taking into account the embedding of IBEX. Some streamlining has already taken place (e.g. reduction in the number of signatures required) but the process is not yet finished, and an A rating would be premature.
-- As above. -- Information provided by Education, Health, Agriculture and Resources Development, and Water Resource Development Bureaus. -- Internal Audit Manual and associated training manual.
B (iii) Degree of compliance with rules for processing and recording transactions Compliance with rules is fairly high, but simplified/emergency procedures are used occasionally without adequate justification.
Heads of FAPMDs visited by the assessment team emphasized that compliance with rules is very strong. The annual report of ORAG for April 2007-March 2008 identified some areas of insufficient adherence to internal controls, particularly related to issuance of receipts for revenues collected, resulting in apparently incorrect cash counts.
-- As above; -- ORAG annual report to FBC,

Southern Nations and Nationalities Peoples’ Regional Government –
PEFA Assessment
Page 60
3.5.9 PI-21: Effectiveness of internal audit
Regular and adequate feedback to management is required on the performance of the internal
control systems, through an internal audit function (or equivalent systems monitoring
function).
The internal audit (IA) function is provided for in the Financial Administration Proclamations
and Financial Regulations, and its development is one of the components of the EMCP. The
pre-audit function was phased out during 2006/07 in tandem with the phasing in of the post-
audit function. Key features are:
• IA departments in sector bureaus formally report to both the heads of the bureaus in
which they are established and to the Inspection Department (ID) in BOFED (i.e. dual
subordination), which has overall responsibility for overseeing the development of the
IA function.
• An internal audit manual and training manuals have been developed (based on the
Federal Government IA manual and with help from an international consultant in
MOFED), with focus on meeting professional standards (as per the International
Standards for the Professional Practice in Internal Audit (ISPPIA), issued by the
Institute of Internal Auditors). The focus of internal audit is, accordingly, on system
issues.
• As a minimum qualification, internal auditors at sector bureau and zonal
administration level are required to have a bachelors of arts degree in Accounting,
Economics and Management; at woreda level, the minimum qualification is a
diploma.
• With help from ORAG, the ID has organized training courses, with the help of a
training manual for internal auditors. It monitors and evaluates audit reports and
provides technical assistance.
• Up to 2009/10, IADs were typically manned by only one staff person. As a result of
the BPR, the numbers of staff positions have been increased since the beginning of
2009/10. First grade bureaus (the largest, including the ones met by the assessment
team) have eight staff (5 professional, 2 support), second grade bureaus have five staff
(3 professional, 2 support) and the 22 smallest bureaus have two professional staff,
sharing the support staff between each other.
(i) Coverage and quality of the internal audit function.
According to the ID in BOFED, IA units are operational in all 34 regional bureaus. The
Single Pool system applies partly to internal audit at zonal administration/woreda level, but
health centres, hospitals, police, and high schools operate “out of pool”. Internal audit
departments generally meet professional standards as established by ISPPIA and focus on
systemic issues.

Southern Nations and Nationalities Peoples’ Regional Government –
PEFA Assessment
Page 61
On paper, this dimension would appear to score A or B. In practice, however, the IA function
is still developing and cannot be said to be fully operational, mainly because IA departments
have had insufficient numbers of staff until very recently and those who have been hired are
still being trained. Even with an increase in the number of positions as of the beginning of
2009/10, recruitment of staff to fill these positions is taking time.28
An issue constraining the
number of people who want to become internal auditors is the lack of an IA certification
process in Ethiopia. There are 235 certified internal auditors in Ethiopia, but they have
obtained their certifications abroad through their own efforts. As with the rest of the civil
service, pay and benefit levels are issues constraining the recruitment and retention of staff
(more so at woreda level).
(ii) Frequency and distribution of reports.
The Inspection Department (ID) in BOFED informed the assessment team that IADs in
regional bureaus are required to audit the payroll, procurement transactions, and the financial
accounts following the end of each month, and send quarterly reports to ID. In this regard, the
ID uses the experience of UK, South Korea and Malaysia. Apart from the Health Bureau,
however, this is only just getting off the ground in the other bureaus visited by the assessment
team (Education, Water Resources Development, Agriculture and Resources Development)
and capacity constraints may preclude the IADs from meeting these requirements for a while
longer. 29
30
31
There is no legal requirement to submit reports to ORAG (which is accountable to the
Regional Council and not the executive), but ORAG can (and does) obtain IA reports on
request (ORAG has a good relationship with ID).
(iii) Extent of management response to internal audit findings.
According to ID, most managers of budget institutions take actions in response to the findings
of internal audit reports. The speed and quality of response depends mainly on the nature of
the audit report findings (some issues can be resolved more quickly than others). Where,
according to the reports of IADs, managers do not respond, then the ID sends letters to them.
28 The Internal Audit Department in the Agriculture and Resources Development Bureau became fully staffed (5 professionals,
including the head) only January, 2010; prior to that only the head of the IAD was in post. The Education Bureau was in the same position, but is now fully staffed with 4 professionals including the Head and one support staff (as recommended by BPR). The Water Resource Development Bureau now has 5 professional staff (including the head), starting off the year with only one. Following a trial period between June and September, 2009, following the BPR, the IAD became operational in September, 2009, and, with the hiring of 2 staff in December, 2009, has been fully operational since then. Two of the staff have degrees, two others are studying for degrees. The Health Bureau became fully staffed earlier in 2009/10 (five professional auditors, including the head, 2 auditors under contract and one secretary), but, post-BPR, was not starting from only one staff person.
29 The IAD in Agriculture and Resources Development Bureau has audited the procurement system during 2009/10 and has drafted a report, which is not yet finalized. The IAD in the Education Bureau, in the same position, staff-wise, has conducted a financial audit and procurement audit, but has not yet finalized its reports. The IAD in the Water Resource Development Department has conducted two financial audits and one property audit so far during 2009/10, in line with its workplan, and sent the reports to the Bureau head and to BOFED. The IAD in the Health Bureau was preparing reports prior to the BPR. All four bureaus submit monthly activity reports (i.e. a summary of what they have been doing) to the Bureau head.
30 The Health Bureau, according to the head of its FAPMD, has been the best performing bureau in the region in terms of PFM, since the end of the pre-audit period.
31 In the case of the Water Resources Development Bureau, for example, auditing the financial accounts every month would require looking at 20 bank accounts (including for donor-financed projects).

Southern Nations and Nationalities Peoples’ Regional Government –
PEFA Assessment
Page 62
Given that the IA function and the recognition of its importance are still evolving, it is
doubtful that management response is always quick and comprehensive. Nevertheless, the
head of the IAD in the Health Bureau (which has been operational for longer than the other
bureaus) claims that its recommendations are followed up (for example, in the case of an issue
concerning the correctness of records of inventories). The IAD of the Water Resources
Development Bureau informed the assessment that the Bureau Head quickly followed up on
its identification of missing stores during its inventory audit, resulting in a staff member being
taken to court. The management also took some corrective measures in response to IAD’s
findings from its financial audit, but the response time was not as rapid.
EMCP Impact Assessment Study
The report notes the progress made in introducing the internal audit function. Better
transparency and service delivery, effective control, more accountability at the local level and
efficiency in audit report preparation, are among the results achieved by the internal audit
reform programme. Shortages of staff (including problems in retaining trained staff, except
for WOFEDs) and budget and insufficiency of continuous training are mentioned as
problems.
Score C+ M1
Scoring Criterion Justification Information
Sources
C (i) Coverage & quality of the internal audit function The function is operational for at least the most important government regional government entities and undertakes some systems review (at least 20 percent of staff time), but may not meet recognized professional standards.
On paper, the IA function is operational for all regional government entities, meets professional standards and focuses on systemic issues. In practice, insufficient numbers of positions (up until the end of 2008/09) and the time it takes for a pool of professional auditors to be established has resulted in the function only now beginning to be fully established. As a result of the BPR, the numbers of positions in IA departments has been sharply increased to 5-8 since the beginning of 2009/10 and the positions are gradually being filled. .
-- Federal Government internal audit manual. SNNPRG BOFED ID Training Manual for Internal Auditors. -- Meeting with ID (BOFED) staff. -- Meetings with FAPMD heads in the Education, Health, Agriculture and Resource Development, and Water Resource Development Bureaus.
C (ii) Frequency & distribution of reports Reports are issued regularly for most audited government entities, but may not be submitted to the Finance bureau (BOFED) and the SAI.
For most bureaus, a meaningful IA function has only been operational since the beginning of 2009/10 and the preparation of reports on a regular basis is only just beginning, with some first reports not yet finalized (e.g. Education and Agriculture and Resource Development bureaus). The pace is picking up, however. The reports are submitted to bureau management and to the ID in BOFED, and are available to ORAG upon request (legislation does not provide for mandatory submission of reports to ORAG, which is accountable to the Regional Council, and not the executive).
-- ID, BOFED -- FAPMD heads in the four bureaus referred to above.
C (iii) Extent of management response to internal audit findings A fair degree of action
With the IA function and the perception of its importance still evolving, and IADs understaffed until only recently, a B rating would be too high. . Managers are taking action in some instances, as noted by the Health bureau and the Water Resource Development bureau. The culture in Ethiopia of
-- Ditto.

Southern Nations and Nationalities Peoples’ Regional Government –
PEFA Assessment
Page 63
taken by many managers on major issues but often with delay.
following orders and rules indicates that IAD recommendations are unlikely to be largely ignored.
3.6 Accounting, recording and reporting
This set of indicators assesses the timeliness of accounting, recording and reporting. A summary of the
scores is tabulated below.
No. Accounting, Recording and Reporting
Score Dimensions Scoring Methodology
PI-22 Timeliness and regularity of accounts reconciliation B+ (i) B (ii) A
M2
PI-23 Availability of information on resources received by service delivery units
B (i)B
M1
PI-24 Quality and timeliness of in-year budget reports C+▲ (i) C (ii) A (iii) C▲
M1
PI-25 Quality and timeliness of annual financial statements C+▲ (i) B▲ (ii) B (iii) C▲
M1
3.6.1. PI-22: Timeliness and regularity of accounts reconciliation
This indicator is assessed on the basis of regularity of bank account reconciliations and
regularity and clearance of suspense accounts and advances.
(i) Regularity of bank reconciliations
Reconciliation between the Central Treasury Account (CTA) held in National Bank of
Ethiopia (NBE) and the general ledger (held in IBEX in BOFED) takes place (by the BOFED
FAPMD) on a monthly basis within 10 days of the end of the month.32
Most SNNPRG
deposits are held in CTA/Z accounts. Movements on the CTA account and Z accounts in CBE
(see PI-17) are reconciled daily (the CTA and Z accounts are effectively the TSA).
Reconciliation is at both aggregate and detailed level. The movement of the transfer accounts
(IBEX codes 4001-4017) and zero balance accounts are reconciled against the aggregate
balance of the CTA. Bureaus’ bank accounts are reconciled against the ledger by the
respective financial administration and property management departments in the bureaus.
There are no significant unreconciled differences between the bank accounts and the records
of the Treasury; the reconciliation items mainly consisting of unpresented cheques, deposits
and transfers made on the closing date, uncleared bank deposits and late recording by some
budgetary institutions. Differences are normally cleared within the same month and are not
carried forward.
BOFED requires monthly bank reconciliation reports in relation to donor-supported
programmes and funds, notably the Food Security, Safety Net, PSCAP and WaSH
programmes, and the Roads Fund (not, it seems, the Global Fund) and donor-supported
32
IBEX account 4105: “Cash at Bank at Central Treasury”.

Southern Nations and Nationalities Peoples’ Regional Government –
PEFA Assessment
Page 64
projects. Opening by donors of bank accounts for projects (known as A accounts) has to be
approved first by BOFED. These are under the control of sector bureaus. The BOFED
requires monthly bank reconciliation and submission of reconciliation reports to it by the
donors. This is more difficult to check at detailed level for projects being implemented by UN
agencies (e.g. UNICEF), which use their own charts of account, but nevertheless the agencies
perform the reconciliations at aggregate level. The frequency of bank reconciliation in
relation to donor projects using the Channel 2 and 3 funding methods is more difficult to
determine and, in relation to the Global Fund in particular, the amounts may be significant.
(ii) Regularity of reconciliation and clearance of suspense accounts and advances
Suspense accounts and advances from the point of view of rating this indicator are classified
in the Chart of Accounts under code item 4201 for suspense accounts, and code items 4203-
4205 for advances. Suspense accounts may include revenue deposits (held in ‘B’ bank
accounts) awaiting deposit into CTA. Advance accounts mainly represent advances to staff.
Staff advances are supposed (under the Financial Regulations) to be retired within a short
space of time (7 days for travel advances), and, according to BOFED, this requirement is
adhered to. For the purposes of scoring this dimension, advances exclude prepayments to
contractors, as these may not be retired until the end of a project, which may not be until the
following year.
The trial balance sheet for the regional bureaus at the end of 2008/09 (EFY 2001) -- and thus
the opening balance sheet for 2009/10 -- indicates zero amounts in suspense accounts
(recorded as debit) and zero outstanding advances to staff. The in-year trial balance sheets
show end-month balances in suspense accounts and advances outstanding, but it is not
possible to tell how much is cleared in each period and how much is carried over to the next
period, as the age profile is not shown (though such details are contained in the trial balance
sheets of individual bureaus, BOFED informed the assessment team, generating reports
through IBEX at the bureau level would be very time-consuming).
Score Minimum Requirements
Justification Information Sources
B+ (M2)
As listed in PEFA Framework
B (i) Regularity of bank reconciliations Bank reconciliation for all Treasury managed bank accounts take place at least monthly, usually within 4 weeks from the end of the month.
Reconciliation of the bank accounts held under CTA/Z accounts (representing most of SNNPRG deposits) with the ledger held in BOFED (in IBEX) takes place every month within 10 days of the end of the month. Reconciliation of other accounts (donor-supported programmes, funds and projects) also takes place every month (at least where Channel 1 disbursement modalities are used). Reconciliation statements are provided to BOFED, though not necessarily at detailed level. The frequency of bank reconciliation in regard to donor projects funded through Channel 2 or 3 is more difficult to determine.
-- BOFED Financial Administration and Property Management Department (FAPMD);
A (ii) Regularity of reconciliation and suspense accounts and advances Reconciliation and clearance of suspense accounts and advances take place at least quarterly, within a month from the end of the
BOFED claims speedy clearance of advances (within 7 days for travel advances, as required by the financial regulations). Suspense accounts, mainly representing temporary deposit of revenues in bank accounts (B accounts) may be carried forward, but are normally transferred to CTA within a month, according to BOFED (also see PI-15). The end-year trial balance sheet for 2008/09 indicates zero balances in suspense accounts and zero advances to staff outstanding, thus no balances are brought forwards. Reconciliation and clearance may happen frequently during
-- Trial balance sheet for total regional bureaus, end-2008/09 and opening balance sheet beginning 2009/10 (provided by BOFED FAPMD).

Southern Nations and Nationalities Peoples’ Regional Government –
PEFA Assessment
Page 65
Score Minimum Requirements
Justification Information Sources
period and with few balances brought forwards.
the year, as claimed by BOFED. , but it is difficult to show this from the trial balance sheets, as the age profile is not shown. The assessment team’s rating is therefore based on BOFED’s verbal assurances that suspense accounts and advances are cleared rapidly
3.6.2. PI-23 Availability of information on resources received by service delivery units
The primary education service delivery units (SDUs) at woreda government level are not cost
centres in terms of recurrent expenditure; they do not have individual budget classification
codes assigned to them. Thus recurrent budget execution reports cannot explicitly report on
the financial resources they receive relative to their approved budgets. Capital expenditure on
the other hand-- funded by the regional government -- on primary schools is captured in the
project codes in the budget classification system. With regard to primary health care, the
primary health centres (with in-patient units) are cost centres in terms of recurrent
expenditure, but the primary health posts (catering only to out-patients) are not. As with
primary education, capital expenditure-- funded by the regional government -- on primary
health care units (both centres and posts) is captured in the project codes in the budget
classification system.
The woreda education and health offices (which are cost centres) are responsible for
allocating the physical resources purchased under their budgets to the SDUs. In the case of
primary schools, the number of students enrolled is the main determinant for the allocation of
resources between schools. Manual ledgers capturing the flow of resources are maintained by
the education and health offices.
The Education Bureau informed the assessment team that it is the responsibility of zonal
administrations to track education expenditures at woreda level. This is done with a degree of
success through a UNICEF-supported project and the GEQIP. UNICEF funds elementary
schools in 45 woredas in SNNPR (about 30 percent all woredas) and zonal administrations
make sure that the physical resources purchased by the funds are received by the schools.
UNICEF funds a similar project for primary health care centres (in 15 woredas) with a similar
tracking system. The donor-supported GEQIP provides ETB 15 for each student (i.e. a
capitation grant) for all schools in all woredas to fund books and maintenance and woredas
check that the money is actually used for this.
The information on resources received that is generated through such tracking systems does,
not filter up to the regional bureau level. It does, however, filter up to zonal administration
level in the case of primary schools, and there does not seem to be any fundamental reason
preventing the information reaching the regional bureau level.
In addition, information is being disseminated through the media on resources being provided
to service delivery units. Moreover, a system for recording resources received, by type of
resource (e.g. teachers, books) relative to minimum standards established at federal level (and
adapted to regional level), on notice boards posted outside SDUs was developed under PBS

Southern Nations and Nationalities Peoples’ Regional Government –
PEFA Assessment
Page 66
(Financial Transparency and Accountability Project) during 2007-2009 and is being rolled
out. The system forms a good basis for monitoring resources received by SDUs.
Score Minimum Requirements Justification Information Sources
B Collection and processing of information to demonstrate the resources that were actually received (in cash and kind) by the most common front-end delivery units (focus on primary schools and primary health clinics) in relation to the overall resources made available to the sector (s), irrespective of which level of government is responsible for the operation and funding of those units. (i) Routine data collection or accounting systems provide reliable information on all types of resources received in cash and in-kind by either primary schools or primary health care clinics across most of the region with information compiled into reports at least annually.
Information provided by the SNNPR Education and Health bureaus, including in relation to the UNICEF education and health projects and to the multi-donor supported GEQIP. The GEQIP covers all woredas and tracks resources received. , A system for reporting by woreda offices to zonal administrations (and then to the regional bureaus) is formally in place, but functions imperfectly due to capacity constraints.
-- SNNPR Education and Health Bureaus, Heads, Planning and Budgeting Departments.
3.6.3. PI-24: Quality and timeliness of in year budget reports
This indicator assesses the scope of reports, their timeliness and the quality of information on
actual budget implementation.
(i) Scope of reports in terms of coverage and compatibility with budget estimates
Quarterly detailed budget performance reports are prepared by BOFED for senior
management and for MOFED for revenues, recurrent and capital expenditures for each
regional bureau (and sub-agencies within each bureau) according to economic classification.
The reports show actual expenditures but not expenditure commitments. The reports
submitted by the bureaus include the expenditure commitments, but these are recorded semi-
manually and thus cannot be automatically be reflected in IBEX-generated reports (IBEX is
still being rolled out to sector bureaus). They do not include all capital expenditure financed
through donor assistance; even for those donors providing assistance through Channel 1, they
do not necessarily use the government’s budget classification system. The reports are just
tables.
(ii) Timeliness of the issue of the reports
The reports covering the consolidated regional bureau, zonal administration and woreda
reports are issued quarterly, within two months of the end of the quarter. These are the main
reports used, but it is possible to produce reports on a regional bureau basis alone, and these
are available within a month of the end of the quarter (they are produced monthly). The
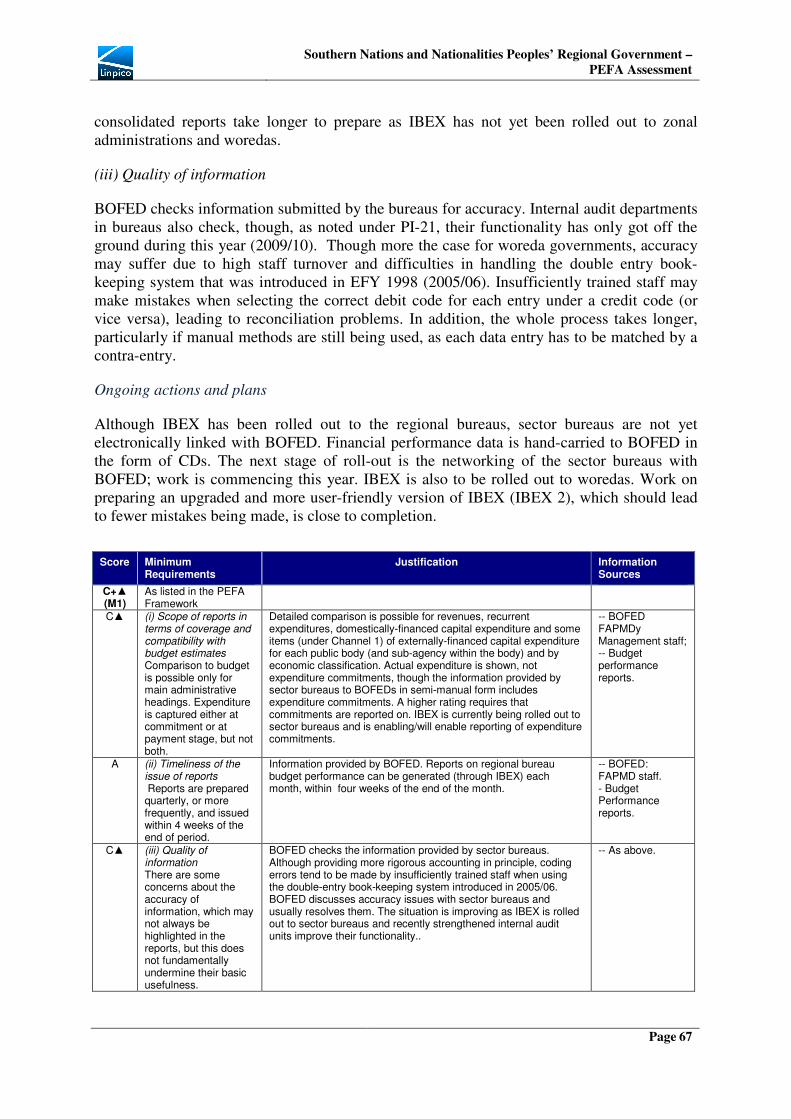
Southern Nations and Nationalities Peoples’ Regional Government –
PEFA Assessment
Page 67
consolidated reports take longer to prepare as IBEX has not yet been rolled out to zonal
administrations and woredas.
(iii) Quality of information
BOFED checks information submitted by the bureaus for accuracy. Internal audit departments
in bureaus also check, though, as noted under PI-21, their functionality has only got off the
ground during this year (2009/10). Though more the case for woreda governments, accuracy
may suffer due to high staff turnover and difficulties in handling the double entry book-
keeping system that was introduced in EFY 1998 (2005/06). Insufficiently trained staff may
make mistakes when selecting the correct debit code for each entry under a credit code (or
vice versa), leading to reconciliation problems. In addition, the whole process takes longer,
particularly if manual methods are still being used, as each data entry has to be matched by a
contra-entry.
Ongoing actions and plans
Although IBEX has been rolled out to the regional bureaus, sector bureaus are not yet
electronically linked with BOFED. Financial performance data is hand-carried to BOFED in
the form of CDs. The next stage of roll-out is the networking of the sector bureaus with
BOFED; work is commencing this year. IBEX is also to be rolled out to woredas. Work on
preparing an upgraded and more user-friendly version of IBEX (IBEX 2), which should lead
to fewer mistakes being made, is close to completion.
Score Minimum Requirements
Justification Information Sources
C+▲ (M1)
As listed in the PEFA Framework
C▲ (i) Scope of reports in terms of coverage and compatibility with budget estimates Comparison to budget is possible only for main administrative headings. Expenditure is captured either at commitment or at payment stage, but not both.
Detailed comparison is possible for revenues, recurrent expenditures, domestically-financed capital expenditure and some items (under Channel 1) of externally-financed capital expenditure for each public body (and sub-agency within the body) and by economic classification. Actual expenditure is shown, not expenditure commitments, though the information provided by sector bureaus to BOFEDs in semi-manual form includes expenditure commitments. A higher rating requires that commitments are reported on. IBEX is currently being rolled out to sector bureaus and is enabling/will enable reporting of expenditure commitments.
-- BOFED FAPMDy Management staff; -- Budget performance reports.
A (ii) Timeliness of the issue of reports Reports are prepared quarterly, or more frequently, and issued within 4 weeks of the end of period.
Information provided by BOFED. Reports on regional bureau budget performance can be generated (through IBEX) each month, within four weeks of the end of the month.
-- BOFED: FAPMD staff. - Budget Performance reports.
C▲ (iii) Quality of information There are some concerns about the accuracy of information, which may not always be highlighted in the reports, but this does not fundamentally undermine their basic usefulness.
BOFED checks the information provided by sector bureaus. Although providing more rigorous accounting in principle, coding errors tend to be made by insufficiently trained staff when using the double-entry book-keeping system introduced in 2005/06. BOFED discusses accuracy issues with sector bureaus and usually resolves them. The situation is improving as IBEX is rolled out to sector bureaus and recently strengthened internal audit units improve their functionality..
-- As above.

Southern Nations and Nationalities Peoples’ Regional Government –
PEFA Assessment
Page 68
3.6.4. PI-25: Quality and timeliness of annual financial statements
The dimensions to be assessed are: (i) Completeness of the financial statements; (ii)
timeliness of the submission of the financial statements; and (iii) accounting standards used.
(i) Completeness of the financial statements
BOFED prepares a consolidated government financial statement annually, covering both
regional bureaus and woredas. This contains mainly full information on revenues,
expenditures, financial assets and liabilities, but coverage of donor-funded projects and extra-
budgetary funds is not complete, particularly in the context of donor-funded funds (e.g.
Global Fund) and projects that use the Channel 2 mechanism (funds by-pass BOFED and go
straight to the sector bureaus) and which do not necessarily contain information on financial
assets and liabilities. It may also be incomplete in the context of some projects that use the
Channel 1 mechanism but not the SNNPRG’s budget classification system (the same as the
Federal Government’s system). But the situation is changing, and trial balances are covering
donor-funded projects to an increasing extent.
(ii) Timeliness of the submission of the financial statements
There used to be a 2-3 year lag between the end of the financial year and the submission of
annual financial statements to ORAG, but this has been reduced to between six months to one
year. The introduction of IBEX is one reason. The accounts for EFY 2001 (2008/09) were
finally closed in February 2010, and the financial statements were submitted to ORAG in
April 2010, 10 months after the end of the financial year ((the legal deadline is 3 months after
the end of the fiscal year). The financial statements cover the zonal administrations and
woreda governments as well as the regional government, so preparation takes longer than it
would if the statements covered only the regional government. Timeliness will strengthen
further as regional bureaus are networked to the IBEX electronically (during 2009/10 and
2010/2011), and as IBEX is rolled out to woredas (even more so, if it is rolled out using the
more user-friendly and upgraded IBEX 2 currently being tested).
(iii) Accounting standards used.
The accounting standards used are those of the Federal Government, consistent with
Generally Accepted Accounting Practices (GAAP). International Public Sector Accounting
Standards (IPSAS) are not yet used, nor are standards used that are consistent with IPSAS on
a cash basis. But IPSAS on a cash basis is not yet fully used. As noted in the PEFA
Secretariat’s “Clarifications to the PFM Performance Measurement Framework, June 2005
(updated September 2008), financial information on externally-funded projects should be
included in annual financial statements under IPSAS. If they are not, the statements are not
compliant with IPSAS. In the case of SNNPRG BOFED (and BOFEDs in other regional
states), information is lacking on actual expenditure under Channel 2-type projects, even
though these projects may appear in the approved budget proclamation, and even under
Channel 1 projects, information on actual expenditure is not complete if the projects do not
use the government’s budget classification system and therefore are not reported on and
accounted for.

Southern Nations and Nationalities Peoples’ Regional Government –
PEFA Assessment
Page 69
Ongoing actions and plans
A new financial statements model is being piloted by MOFED.
EMCP Assessment Study
SNNPRG introduced the modified cash basis for accounting and the double entry accounting
system in 2004/05 (EFY 1997). BOFED prepared the accounting manuals and training
modules and distributed to sector bureaus and woredas. The new accounting system has
improved the preparation of reports and closing of accounts, through less paperwork, fewer
processing steps, better tracking of expenditure items, greater accuracy and ease of
reconciling accounts (but note the comments under PI-24 dimension iii). IBEX has been used
for the accounting function since 2006/07 (EFY 1999), with many benefits reported. Lack of
ownership of IBEX, insufficient continuous training and problems in retaining trained staff
are noted as significant issues.
Score Minimum Requirements Justification Information
Sources
C+▲ (M1)
B▲ (i) Completeness of the financial statements A consolidated government statement is prepared annually. It includes, with few exceptions, full information on revenue, expenditure and financial assets/liabilities.
Full information is not yet provided on donor-supported projects, programmes and funds, with the partial exception of those that those that use the Channel 1 funding modality and the government’s budget classification system. Progress is being made on providing full information.
-- Head of BOFED FAPMD.
B (ii) Timeliness of submission of the financial statements The statements are submitted for external audit within 10 months of the end of the fiscal year.
The statements are submitted to ORAG between six months to 10 months after the end of the financial year.
-- Ditto.
C▲ (iii) Accounting Standards used Statements are presented in a consistent format over time with some disclosure of accounting standards.
The federal government standards are used, which meet Generally Accepted Accounting Practices (GAAP), which are not the same as IPSAS (required for a B rating), which requires full information on donor-funded projects, the budgeted expenditure amounts for which are included in the budget proclamations. Progress is being made towards meeting IPSAS.
-- Ditto.
3.7. External oversight and legislative scrutiny
This set of indicators looks at the quality and timeliness of external scrutiny of the
government’s budget estimates as well as the public accounts.

Southern Nations and Nationalities Peoples’ Regional Government –
PEFA Assessment
Page 70
No. External Scrutiny and Audit
Score Dimensions Scoring Methodology
PI-26 Scope, nature and follow-up of external audit C+ (i) C (ii) B (iii) B
M1
PI-27 Legislative scrutiny of the annual budget law
D+
(i) A (ii) C (iii) D (iv) B
M1
PI-28 Legislative scrutiny of external audit reports.
B (i) B (ii) B (iii) B
M1
3.7.1. PI-26: The scope, nature and follow up of external audit
A high quality external audit is an essential requirement for creating transparency in the use
of public funds. This dimension comprises three sub-dimensions. The lowest sub-dimension
score is the score for the dimension as a whole (i.e. if the lowest sub-dimension score is D, the
score for the dimension is D).
ORAG has 110 auditors, who all have the minimum required qualifications. Capacity has
been strengthened through training and the dissemination of audit manuals.
(i) Scope/nature of Audit
(a) Extent of audit coverage of regional government bureaus
The Office of the Regional Auditor General (ORAG) covers the 13 zonal administrations, the
six special woreda governments and the 157 woreda governments as well as the 34 regional
government bureaus (including their sub-agencies) and the Water Works Enterprise (ORAG
has the right to contract this out to a private sector auditor), totaling 195 entities. Donor
projects falling under regional bureaus are also audited, if the requirement is specified in the
donor-government agreement. Due to capacity constraints, about 50 entities are audited each
year, the larger bureaus, in terms of expenditure (Education, Health, Agriculture, Water,
South Roads Authority), usually audited every year or every other year; the size of the capital
budget of each bureau is also a sampling criterion due to the potentially higher risk involved.
ORAG plans to audit 100 public bodies this year. At woreda level, the Single Pool system,
introduced in 2006/07 (whereby the WOFED manages the finances of the woreda sector
offices) permits aggregation, so that an external audit can cover several public bodies as one
aggregate body. In monetary terms, about 50 percent of domestically-financed public
expenditure at regional bureau level is being covered under the audit for 2008/09.
(b) Nature of Audit
By far the main emphasis is on financial (covering revenue, expenditure, financial assets and
liabilities, and physical property) and compliance audits (covering internal controls, including
those for the payroll, procurement and property administration systems). ORAG is starting to
conduct performance audits. It has not yet conducted any IT audits and environmental audits.

Southern Nations and Nationalities Peoples’ Regional Government –
PEFA Assessment
Page 71
If requested by the Regional Council, it will conduct special audits where legal matters are
involved (e.g. covering suspected fraud). 33
c) Adherence to Auditing Standards
ORAG follows the audit standards of the federal level Office of the Auditor General (OFAG),
which is a member of INTOSAI.
Publication of Audit Reports (INTOSAI Standard):
Publication of audit reports is not prohibited by law, but in practice no reports have been
published, mainly because of resource constraints. The Regional Council can authorize
publication. ORAG is preparing an IT strategy and, as part of this, a web-site, which will
facilitate publishing.
Independence of ORAG from the Executive (INTOSAI Standard)
As noted above, ORAG is accountable to the Regional Council and thus is independent in
principle from SNNPRG. This independence is compromised to some extent, however, as
ORAG’s budget is included in the SNNPRG budget.
Co-operation and Public Relations
The law governing ORAG provides for the right to access to all the information required for
ORAG to fulfil its responsibilities, thus meeting another INTOSAI standard.
Audit Methodology
The focus is increasingly on audit of internal control systems (as stipulated in paragraph four
of Article 8 in the ORAG law on powers and duties of ORAG) as per INTOSAI/AFROSAI
standards rather than of individual transactions. Payroll systems, for example, are tested on a
sample basis.
(ii) Timeliness of submission of audit reports to legislature
By law, ORAG should audit the annual accounts of SNNPRS (i.e. regional bureaus, zonal
administrations and woreda governments) within 8 months of their submission by SNNPRG,
and then submit its opinion to BOFED. The law stipulates that ORAG submit an annual report
to the Regional Council covering its audit of BOFED’s annual financial statements and its
audits of public bodies, but no deadline is given. In practice, ORAG provides one annual
report close to the end of the fiscal year on its audits of the public bodies.
ORAG takes 3-4 months to audit the annual financial statements prepared by BOFED and,
starting in September, between 45 and 90 days to audit each of the public bodies selected for
audit. The prepared audit reports are then submitted to BOFED and the other public bodies,
33
ORAG’s annual reports to the Regional Council covering 2006/07 and 2007/08 indicate that: (i) 2006/07: 46 out of 50 audits were financial and compliance audits; 2 were audits of the AFS (for 2004/05 and 2005/06), one was a performance audit and four were special audits; (ii) 2007/08: 45 out of 53 audits were financial and compliance audits, 1 was audit of AFS, 3 were performance audits, and four were special audits.

Southern Nations and Nationalities Peoples’ Regional Government –
PEFA Assessment
Page 72
accompanied by a letter to the head of the bodies, who then has 45 days to respond. ORAG
then provides an audit opinion (following possibly another round of letters to management
and counter response) and submits the reports to the Regional Council (differences of opinion
between ORAG and the public bodies are mentioned in these reports).
Regarding the annual accounts for 2008/09, ORAG expects to start auditing these in April,
2010, once it has received the accounts from BOFED (as of the time of writing, they had still
not been received) and expects to finish in August; ORAG received the annual accounts for
2007/08 in late May, 2009 and completed its audit in August 2009.
(iii) Evidence of follow up on audit recommendations
As mentioned under dimension (ii), heads of public bodies are obliged to formally respond to
the audit reports prepared by ORAG within 45 days, outlining the measures it has taken to
resolve the issues raised in the audit report. Most public bodies comply.34
ORAG may then
get back to the public body if it has more queries, otherwise it produces its opinion and sends
its report to BOFED (including the management response), and BOFED then sends this to the
Regional Council. ORAG’s report for the following year indicates the extent to which
auditees responded to the audit reports.
Score Minimum Requirements Justification Information Sources
C+ (M1)
C (i) Scope/nature of audit performed (incl. Adherence to auditing standards). SNNPRS entities (regional bureaus and woredas) representing at least 50 percent of total expenditures are audited annually. Audits predominantly comprise transaction level testing, but reports identify significant issues. Audit standards may be disclosed to a limited extent only.
Out of 195 regional bureaus, zonal administrations and woreda offices in SNNPR, about 50 are audited every year on a rotating basis, except for the larger bureaus (in terms of their expenditure), which are audited every year. In this way, about 50 percent of SNNPRG domestically financed expenditure is covered each year. Full financial audits and compliance audits are conducted, broadly in compliance with INTOSAI standards (following OFAG), with the main focus on systemic issues. Audit reports are not published, thus violating one of INTOSAI standards. The limiting factors in rating this dimension are the scope of coverage, which is less than the 75 percent required for a B rating, and the non-publication of reports..
-- Auditor General, SNNPR ORAG. -- ORAG reports for 2006/07 and 2007/08.
B (ii) Timeliness of submission of audit reports to the legislature. Audit reports are submitted to the legislature within 8 months of the period covered and in the case of financial statements from their receipt by the audit office.
In the case of audit reports for each public body, ORAG starts the auditing process 3 months after the end of the fiscal year and takes between 1.5 - 3 months to audit, following which there is at least another 45 days (for management response) before the reports are finalized. Capacity constraints mean that the audits have to be staggered. The audit reports tend to be submitted to the Regional Council all in one go, towards the end of the fiscal year . In the case of the audit of the annual accounts, ORAG takes 3-4 months to audit them following their receipt from BOFED. ORAG received the 2007/08 accounts in May 2009 and finished auditing them in August 2009 (the 2008/09 accounts were received in April 2010) . The B rating represents a simple average of the rating for the annual accounts (A) and the audit reports as a whole (C).
-- Auditor General, SNNPRS ORAG.
B (iii) Evidence of follow-up on audit recommendations
Formal responses are made in a timely manner, as required under the ORAG proclamation (must be within 45 days). The responses may include evidence of action taken in response to
- Auditor General SNNPRS ORAG. -- ORAG report
34
According to ORAG’s report covering 2006/07 (EFY 1999), 13 organisations did not respond to ORAG’s audit findings. With the exception of the Justice and Security Bureau, the organizations belonged to levels of government below that of SNNPRG.

Southern Nations and Nationalities Peoples’ Regional Government –
PEFA Assessment
Page 73
Score Minimum Requirements Justification Information Sources
A formal response is made in a timely manner, but there is little evidence of systematic follow-up.
audit report finding, or they may indicate differences of opinion and limited action taken.
covering 2006/07.
3.7.2: Legislative scrutiny of the annual budget law
The power to give the government authority to spend rests with the legislature, and is
exercised through the passing of the budget law.
(i) Scope of the Legislature’s Scrutiny
The Economics Committee, one of four Standing Committees in the Regional Council, is
responsible for scrutinizing the draft budget documentation submitted to it by the Regional
Cabinet, including the draft proclamation, supporting notes to the proclamation, the macro-
fiscal framework and the fiscal transfers formula (as noted under PI-6)35
; it is also responsible
for scrutinizing ORAG’s audit reports.
(ii) Extent to which the legislature’s procedures are well-established and respected
The procedures of the Regional Council are similar to those of Amhara’s Regional Council,
and are contained in a proclamation (#83, 1998). The Economics Committee starts to examine
the draft budget proclamation after receiving it from the Speaker of the Regional Council, to
whom it has been submitted by the Regional Cabinet. The BOFED is invited to discuss the
draft budget in detail, and sector bureau managers may also be invited.. There is a public
hearing on the draft budget (broadcast on the radio). The draft budget is then submitted to the
Regional Council as a whole.
The Economic Committee’s procedures may not be always fully respected, mainly due to the
difficulties in convening all its members as and when they are required. This is because, apart
from the Chairman of the Committee, they tend to work in other jobs part-time and to live
elsewhere in SNNPR.
(iii) Adequacy of the time for the legislature to provide a response to budget proposals
The Economics Committee in principle has one month to review the budget documentation.
This tends to be insufficient, due to the difficulty of mobilizing all the members of the
Economics Committee, and in practice the time for review is only 10 days.
(iv) Rules for in-year amendments to the budget without ex-ante approval by the legislature
As per the Financial Administration Proclamation, based on the Federal Government’s
Financial Administration Proclamation, in-year amendments to the budget without ex-ante
approval by the legislature are permitted for transfer within public bodies and transfers
35
The Economics Committee has seven members; the chairperson is from the ruling political party. The other Standing Committees are: Social Affairs, Legal and Administrative Affairs, and Women and Children’s Affairs.

Southern Nations and Nationalities Peoples’ Regional Government –
PEFA Assessment
Page 74
between public bodies (the latter requiring prior approval of the Regional Cabinet) that do not
result in an increase in overall spending. As noted in PI-16 (iii) reallocations between public
bodies during the year are significant.
Ex-ante approval by the legislature of amendments is only required for supplementary
budgets that would result in an overall spending increase.
Score Minimum Requirements Justification Information Sources
D+ (M1)
Listed in PEFA Framework
A (i) Scope of the legislature’s scrutiny The legislature’s review covers fiscal policies, medium fiscal framework and medium term priorities, as well as details of expenditure and revenue.
The documentation submitted to the Economics Committee consists of the draft budget proclamation (containing detailed revenue and spending estimates for the next financial year), supporting notes, the macroeconomic and fiscal framework and the formula governing subsidies to zonal administrations..
-- Head, FAPMD, BOFED. -- Chairman, Economics Committee, SNNPR Regional Council.
C (ii) Extent to which the legislature’s procedures are well-established and respected. Some procedures exist for the legislature’s budget review, but they are not comprehensive and only partially respected.
The procedures are simple (as explained in the narrative) and prescribed in a proclamation. With most of the members of the Economics Committee appointed on an ad-hoc basis and tending to live elsewhere in SNNPR, the procedures are only partially respected.
-- Chairman, Economics Committee.
D (iii) Adequacy of time for the legislature to provide a response to budget proposals. The legislature has at least one month to review the budget proposals.
The budget calendar allows one month for the legislature to review the draft budget proclamation. In practice, only 10 days is allowed. The Chairman of the Economics Committee considers this to be insufficient time to review the draft budget proclamation, given the lack of explanatory narrative in the documentation.
-- Chairman, Economics Committee
B (iv) Rules for in-year amendments to the budget without ex-ante approval of the legislature. Clear rules exist for in-year budget amendments by the executive, and are usually respected, but they allow extensive administrative reallocations.
The rules are contained in the Financial Administrative Proclamation, which is based on the Federal Government equivalent. As indicated in PI-16 (iii), in-year reallocations between public bodies are permitted without ex-ante Regional Council as long as total spending does not increase. Such reallocations are extensive. Ex ante approval by the Regional Council is required (and adhered to) for proposed supplementary budgets, usually only one, that result in increased total spending.
-- Chairman, Economics Committee -- Financial Administration Proclamation.
.
3.7.3. PI-28: Legislative scrutiny of external audit reports
The legislature has a key role in exercising scrutiny over the execution of the budget that is
approved.
(i) Timeliness of examination of audit reports
The Economics Committee places greatest importance on reviewing ORAG’s audit of the
annual financial statements prepared by BOFED. The review takes 2.5 months on average.
With regard to the audit reports covering public bodies, given the large number of reports,
their staggered submission during the year (as ORAG does not have the capacity to conduct
the audits all at one time) and the fact that most of the members of the Economics Committee
attend meetings on an ad-hoc basis, more attention is given to the annual report prepared by
ORAG and submitted to the Economics Committee close to the end of the fiscal year (ORAG

Southern Nations and Nationalities Peoples’ Regional Government –
PEFA Assessment
Page 75
also submits quarterly activity reports to the Economics Committee that provide information
on what audit reports it is preparing).
(ii) Extent of hearings on key findings
The Economics Committee summons the Auditor General to discuss ORAG’s findings in
detail. The Economics Committee may summon bureau heads to discuss ORAG’s findings in
the case of reports with qualified or adverse opinions, or disclaimers of opinion (the worst
possible audit rating). Virtually all of these instances relate to lower levels of government, not
regional bureaus.36
The Committee may also visit bureaus to discuss audit findings.
(iii) Issuance of recommended actions by the legislature and implementation by the executive.
The Economics Committee has the power to make recommendations to bureaus and offices
on the basis of the audit reports it receives. These are usually the same recommendations
ORAG has already made in the previous year’s audit report but, which have not been
implemented, as noted in ORAG’s most recent audit report. The recommendations are
submitted to the Regional Council as a whole, which then issues them.
Score Minimum Requirements Justification Information Sources
B (M1) Listed in PEFA Framework B (i) Timeliness of
examination of audit reports by the legislature. Scrutiny of audit reports is usually completed by the legislature within 6 months from receipt of the reports.
The Economics Committee focuses its attention on review of ORAG’s audit of the annual financial statements prepared by BOFED. On average, it takes 2.5 months to review these. Audit reports tend to be reviewed in the context of the annual report submitted to the Economics Committee near the end of the fiscal year. The audit reports are submitted at different times during the year, starting about 6 months after the end of the year.
-- Chairman, Economics Committee, SNNPR Regional Council.
B (ii) Extent of hearings on key findings undertaken by the legislature. In-depth hearings on key findings take place with responsible officers from the audited entities as a routine, but may cover only some of the entities, which received a qualified or adverse opinion..
The Auditor General is summoned by the Economics Committee to discuss ORAG’s findings, with particular emphasis on entities that received qualified, or adverse or disclaimers of opinion. Nearly all of such entities are at levels of government below that of SNNPRG..
-- Ditto. -- ORAG annual report covering 2007/08 (EFY 2000).
B (iii) Issuance of recommended actions by the legislature and implementation by the executive. Actions are recommended to the executive, some of which are implemented, according to available evidence.
The actions recommended tend to be the same as the ones recommended by ORAG, but not yet implemented by the executive (as pointed out by ORAG in its next audit report). The rating is the same as under PI-26 (iii).
-- Ditto
36
According to the ORAG report covering 2007/08 (EFY 2000), 21 audited entities – 40 percent of the total number of entities
audited that year -- received qualified opinions (11) or disclaimers of opinion (10).

Southern Nations and Nationalities Peoples’ Regional Government –
PEFA Assessment
Page 76
3.8. Donor practices
No. Donor Practices
Score Dimensions Scoring Methodology
D-1 Predictability of direct budget support Not
applicable Not
applicable M1
D-2 Financial information provided by donors for budgeting and reporting on project and program aid
D+ (i) C (ii) D
M1
D-3 Proportion of aid managed by use of national procedures D (i) D M1
3.8.1. D-1: Predictability of Direct Budget Support
This indicator is not used as SNNPR Region does not receive direct budget support (i.e.
unearmarked funds that are deposited by donors into the Central Treasury Account and co-
mingled with domestic revenues). Budget support is provided to the Federal Government and
helps to finance the block grant from the Federal Government to the regional governments.
One of the conditions is adequate funding of the Protection for Basic Services (PBS)
programme; in effect, donors fund about one-third of PBS.
3.8.2: D-2: Financial information provided by donors for budgeting and reporting on
project and programme aid
The dimensions to be assessed are: (i) completeness and timeliness of budget estimates by
donors for project support; and (ii) frequency and coverage of reporting by donors on actual
donor flows for budget support.
A substantial proportion of donor aid is provided to SNNPR through Channel One, that is
assistance and loans provided to MOFED, which then channels this to BOFED (but the loans
are on the account of MOFED) and assistance provided directly to BOFED by donors, which
BOFED then passes on to sector bureaus. The proportion is not exactly known, as BOFED
has incomplete information on the amount of donor aid provided through Channel 2 (donor
aid provided to sector line ministries at federal level, which then channel the funds directly to
sector bureaus at regional level, plus donor aid provided directly to sector bureaus) and has
even less information on donor aid provided through Channel 3 (donor aid provided directly
to projects without going through sector bureaus; this includes NGO projects – though
increasingly these are being reported on to BOFED) and aid-in-kind). BOFED considers that
over 90 percent of assistance is provided through Channel 1, but, given the size of the Global
Fund (which uses the Channel 2 modality), this is probably an overestimate.
As noted under PI-7, the known largest donor agencies operating in SNNPR are: UN Ex-Com
agencies, Global Fund, World Bank, Asian Development Bank, DFID and Irish Aid (all
providing aid through Channel 1). 37
Donor agencies with suspected significant presence in
SNNPR include USAID, JICA, GTZ.
The budget proclamations include some donor projects funded through Channel 2, but the
budget performance reports do not capture project expenditure (and it is not clear if a large
37
Donor agencies also provide funding through PBS.

Southern Nations and Nationalities Peoples’ Regional Government –
PEFA Assessment
Page 77
difference between actual and budgeted expenditure reflects underperformance or under-
reporting).
(i) Completeness and timeliness of budget estimates by donors for project support
The budget proclamations include estimates of external loans and assistance, mainly in the
agriculture, water resources, education and health areas. This includes estimates of loans and
assistance to be provided through Channel 2. The donor agencies mentioned in the budget
proclamation (for 2009/10) are the ones referred to above, apart from Global Fund. They may
not be the largest ones (as expenditures funded by USAID and Global Fund may be large but
are not included in the budget proclamation and are not known). Only ADB and World Bank
(accounting for about 30 percent of the planned disbursements of Channel 1 donors) use the
Government’s budget classification system, according to the broad economic classification
categories.38
(ii) Frequency and coverage of reporting by donors on actual donor flows for project
support
Reporting can be provided in full in principle for those projects funded through Channel 1
modalities that use the SNNPRG’s budget classification system as they can be captured in the
IBEX system and therefore in the quarterly budget performance reports and monthly trial
balance sheets. This is only the case for ADB and World Bank projects. Quarterly reports are
produced under the WaSH programme, although these are not captured in IBEX budget
performance reports. Otherwise, only annual disbursements are reported on.
Score Minimum Requirements Justification Information Sources
D+ (M1)
As listed in PEFA Framework
C (i) Completeness & timeliness of budget estimates by donors for project support At least half of donors (including the five largest) provide complete budget estimates for disbursement of project aid for the government’s coming fiscal year, at least three months prior to its start. Estimates may use donor classification and not be consistent with the government’s budget classification system.
The budget proclamations indicate donor assistance and loans in aggregate and according to the projects they finance. They incorporate loans and assistance from the five largest donors for which information is available (it is possible that other donors, such as Global Fund, are larger, but no information is provided in the budget proclamations on its planned annual expenditures). Only ADB and World Bank use the government’s budget classification system; they account for about 30 percent of known donor aid.
-- Annual budget performance reports for capital expenditure funded by donor loans and assistance. -- FAPMD staff, BOFED
D (ii) Frequency & coverage of reporting by donors on actual project flows for project support Donors do not provide quarterly reports within two months of end-of-quarter on the disbursements made for at least 50 percent of the externally financed project estimates in the budget.
Quarterly expenditure reports are only provided under World Bank and ADB –funded projects (captured under IBEX as they use the government’s budget classification system) and the WASH programme (not captured under IBEX).
- End-2008/09 monthly trial balance sheet (codes 2001 and 2025 for ADB and UNICEF respectively).
38
According to BOFED’s aid projections for the 2010/11 budget, of these five donor agencies, UN Ex-Com assistance comprises about 50 percent of the total (the bulk provided by UNICEF), World Bank 20 percent, DFID 11 percent, AfDB 11 percent and Irish Aid 8 percent.

Southern Nations and Nationalities Peoples’ Regional Government –
PEFA Assessment
Page 78
The responsibility for monitoring donor-funded projects in the SNNPR BOFED is spread over
a number of offices. As a result it is difficult to obtain an overall picture on the amount and
type of project aid being provided. Moreover, it is incomplete, as donor-funded projects
executed through the Channel 2 and Channel 3 modalities are not reported to BOFED.
In this regard, the assessment team drafted a spreadsheet format designed to provide a
complete picture of donor aid flows to SNNPR. This is reproduced in Annex 2.
3.8.3. D-3: Proportion of aid that is managed by use of national procedures
The dimension to be assessed is the overall proportion of aid funds to central government that
are managed through national procedures (banking, authorization, procurement, accounting,
audit, disbursement and reporting).
Donors providing assistance through the Channel 1 modality are increasingly using country
financial management systems, though mainly only the accounting and reporting systems.
The UN Executing Agencies are, however, still using their own accounting systems (they use
a different COA). Donor agencies for the most part do not yet use the government’s budget
execution and banking systems, with the exception of Irish Aid, which uses the Z-account
system; Irish Aid comprises about 7.5 percent of total Channel 1 aid. In the case of other
donors, their project bank accounts controlled by BOFED are not yet part of the zero
balancing system, which is part and parcel of the budget execution system. Government
procurement systems are coming closer to international best practice standards, though donors
still mainly use their own procurement systems. Donors also tend to recruit their own external
auditors, mainly because of manpower constraints in the Office of the Regional Auditor
General (ORAG) rather than capability constraints.
Donors providing assistance through Channels 2 and 3 do not use SNNPRG PFM systems at all. The
Global Fund is a prominent Channel 2 donor and one of the largest donors overall.
Score Minimum Requirements Justification Information Sources
D Less than 50% of aid funds to regional government are managed through national procedures.
Donor-financed projects do not generally use the Government’s budget execution system, banking arrangements (project accounts are not part of the TSA), procurement systems and audit systems. Irish Aid, however, does use the Government’s budget execution system, including the TSA. Accounting and reporting systems are used, except by UN agencies, which use different COA. Even so, as not all donor projects are classified according to the Government’s budget classification system (only ADB and World Bank), expenditures under donor projects (apart from ADB and World Bank) can’t be reported on, according to this classification. Channel 2 and 3 donors do not use the the Government’s PFM systems.
-- BOFED FAPMD staff.
3.9. Predictability of Transfers from Federal Government
This indicator (HLG-1) assesses the predictability of funding from the Federal Government.
Most of the funding is in the form of the block grant. This is very predictable, the amount
provided being virtually equal to the budgeted amount. The disbursement during the year is

Southern Nations and Nationalities Peoples’ Regional Government –
PEFA Assessment
Page 79
also very predictable, as it is provided in 12 equal monthly installments. Other funding is in
the form of assistance and loans channeled from MOFED to BOFED, which then transfers the
funding to sector bureaus (Channel 1 funding). This is not so predictable. Actual amounts
transferred may be less than budgeted for, due to delays in disbursements by donors (perhaps
because conditionalities attached to the assistance are not being met). The federal government
block grant comprises 95 percent of the combined block grant and donor loan/assistance
resources, so this indicator rates A.

Southern Nations and Nationalities Peoples’ Regional Government PEFA
Assessment
Page 80
4. Government reform process
4.1 Recent and on-going reforms
As in other regions, PFM reforms have been ongoing for several years, led by the Federal
Government under the auspices of the EMCP and PSCAP. The EMCP covers the following
components: legal framework reform, procurement reform, budget reform, accounts reform,
internal audit reform, cash and disbursement reform, government property administration
reform, and information system reform. The reforms have focused on getting the basics right
first (thus, MTEFs, programme budgeting and full accrual accounting have not yet started,
and IBEX has only just been rolled out to regional bureaus), building enabling capacity and
attempting to ensure that the reforms under each component move in step with each other.
Recognising that slow business and administrative processes can undermine the success of
reforms, the Federal Government, followed by the regional governments, embarked on a
Business Process Re-engineering (BPR) exercise three years ago, looking at all business
processes. Implementation of the recommendations arising from this exercise started during
2008/09 and has continued into 2009/10. Examples of efficiency-improvement measures
taken are reorganisation of bureaus in some cases and reduction of the numbers of signatures
required for each process (e.g. payments approval).
4.2 Institutional factors supporting reform planning and implementation
Government leadership and ownership
The MOFED, with political support, has being in the driving seat of the PFM reform
programme. Through pushing through reforms at the federal level, preparing manuals and
methodological guidelines (e.g. accounting reform, cash management reform, budget
preparation) and taking the lead in introducing and then strengthening the IT system in
support of PFM reform, it paved the way for regions to implement the same reforms. The
reforms were not introduced to all the regions at once, the generally stronger ones being the
first candidates for reform. With line ministries and sector bureaus having considerable
responsibilities for public expenditure and finance management, the federal government
appears to have been successful in involving them in the implementation of the reform
programmes and thus winning their ‘buy-in’.
Technical assistance appears to have been used well by the Government in support of the
reforms: for example, the preparation of the various manuals through the Decentralisation
Support Activity (DSA) project during the early 2000s.
The Joint Budget and Aid Reviews have been a useful mechanism for federal and regional
governments to review the reform programmes with the donor partners and to resolve any
issues that have been identified.

Southern Nations and Nationalities Peoples’ Regional Government PEFA
Assessment
Page 81
Annex A: Calculation of Performance Indicator Two on
Budget Variance
Table A1: Budgeted and Allocated Expenditure by Public Body, 2006/07, ETB million
` Data for year = 2006/7 (EFY 1999)
Code Administrative Unit head Budget Actual Difference Absolute %
311 Education 53.2
97.4 44.2 44.2 83.1%
341 Health 36.2
25.7 (10.5) 10.5 29.0%
211 Agriculture & Resources Development
67.5
57.5 (10.0) 10.0 14.8%
122 Supreme Court 3.2
38.3 35.1 35.1 1097%
129 Prison Administration 37.2
32.8 (4.4) 4.4 11.8%
127 Police Commission 19.4
39.0 19.6 19.6 101.0%
111 Regional Council 9.7
4.6 (5.1) 5.1 52.6%
213 South Agriculture Research Institute 11.3
9.1 (2.2) 2.2 19.5%
221 Water Resources Development 17.0
11.4 (5.6) 5.6 32.9%
273 South Road Authority 58.3
36.9 (21.4) 21.4 36.7%
315 Hosahna Teachers' Training College 9.6
- (9.6) 9.6 100.0%
314 Bonga Teachers' Training College 8.1
- (8.1) 8.1 100.0%
313 Arbaminch Teachers' Training College
8.5
- (8.5) 8.5 100.0%
152 BOFED 31.8
13.0 (18.8) 18.8 59.1%
158 Mass Communications Enterprise 8.0
4.8 (3.2) 3.2 40.0%
238 Trade & Industry 48.2
6.6 (41.6) 41.6 86.3%
115 President's Office 4.1
7.4 3.3 3.3 80.5%
214 SNNPR Pastoral Area Dev. Commission
8.1
2.5 (5.6) 5.6 69.1%
239 Housing Development Project Office 8.0
7.8 (0.2) 0.2 2.5%
312 Awassa Teachers' Training College 16.6
11.3 (5.3) 5.3 31.9%
21 (= sum of rest) 65.7
178.9 113.2 113.2 172.3%
total expenditure
529.7 585.0 55.3 55.3 10.4%
composition variance 529.7
585.0 375.5 70.9%

Southern Nations and Nationalities Peoples’ Regional Government PEFA
Assessment
Page 82
Table A2: Budgeted and Allocated Expenditure by Public Body, 2007/08, ETB
Data for year =
2007/8 (EFY 2000)
Code Administrative Unit budget actual difference absolute Percent
311 Education
76.7 142.0 65.3 65.3 85.1%
341 Health 41.1
44.6 3.5 3.5 8.5%
211 Agriculture & Resources Development
69.3
71.2 2.0 2.0 2.8%
122 Supreme Court 5.8
15.8 10.1 10.1 174.8%
129 Prison Administration 44.5
51.6 7.1 7.1 16.0%
127 Police Commission 38.3
50.6 12.3 12.3 32.1%
111 Regional Council 33.9
42.8 8.9 8.9 26.3%
213 South Agriculture Research Institute
15.6
21.8 6.2 6.2 39.7%
221 Water Resources Development 41.1
49.9 8.8 8.8 21.4%
273 South Road Authority 44.9
56.9 12.0 12.0 26.7%
315 Hosahna Teachers' Training College
9.9
10.8 0.9 0.9 9.1%
314 Bonga Teachers' Training College 8.3
9.6 1.3 1.3 15.7%
313 Arbaminch Teachers' Training College
12.9
9.8 (3.1) 3.1 24.0%
152 BOFED 14.5
24.1 9.6 9.6 66.2%
158 Mass Communications Enterprise 14.3
13.3 (1.0) 1.0 7.0%
231 Trade & Industry 10.9
11.0 0.1 0.1 1.4%
115 President's Office 18.0
21.8 3.8 3.8 21.1%
232 Small Scale Enterprise Development
38.0
28.3 (9.7) 9.7 25.5%
277 Work & Urban Development 25.6
25.9 0.3 0.3 1.2%
312 Awassa Teachers' Training College 12.6
13.3 0.8 0.8 6.0%
21 (= sum of rest) 518.8
69.7 (449.1) 449.1 86.6%
total expenditure 1,094.8
784.8 (310.0) 310.0 28.3%
composition variance 1,094.8
784.8 615.8 56.2%

Southern Nations and Nationalities Peoples’ Regional Government PEFA
Assessment
Page 83
Table A3: Budgeted and Allocated Expenditure by Public Body, 2008/09, ETB
Data for year =
2008/9 (EFY 2001)
Code Administrative Unit budget actual difference absolute percent
311 Education 135.2
44.5 (90.7) 90.7 67.1%
341 Health 223.8
106.2 (117.6) 117.6 52.5%
211 Agriculture & Resources Development
95.9
60.5 (35.4) 35.4 36.9%
122 Supreme Court 19.7
16.3 (3.4) 3.4 17.3%
129 Prison Administration 59.7
43.8 (15.9) 15.9 26.6%
127 Police Commission 60.8
60.8 - - 0.0%
111 Regional Council 39.7
39.0 (0.7) 0.7 1.8%
213 South Agriculture Research Institute
21.0
18.1 (2.9) 2.9 13.8%
221 Water Resources Development 70.1
46.4 (23.7) 23.7 33.8%
273 South Road Authority 77.9
77.9 - - 0.0%
315 Hosahna Teachers' Training College
12.8
4.9 (7.9) 7.9 61.7%
314 Bonga Teachers' Training College 10.5
10.5 - - 0.0%
313 Arbaminch Teachers' Training College
13.0
11.8 (1.2) 1.2 9.2%
152 BOFED 45.1
26.7 (18.4) 18.4 40.8%
158 Mass Communications Enterprise 22.7
16.7 (6.0) 6.0 26.4%
231 Trade & Industry 9.2
10.6 1.4 1.4 15.2%
115 President's Office 15.5
16.1 0.6 0.6 3.9%
232 Small Scale Enterprise Development
66.4
62.5 (3.9) 3.9 5.9%
277 Work & Urban Development 30.2
11.7 (18.5) 18.5 61.3%
312 Awassa Teachers' Training College 16.8
15.6 (1.2) 1.2 7.1%
21 (= sum of rest) 141.5
92.6 (48.9) 48.9 34.5%
total expenditure 1,187.4
793.2 (394.2) 394.2 33.2%
composition variance 1,187.4
793.2 398.2 33.5%
Source: IBEX Tables, BOFED
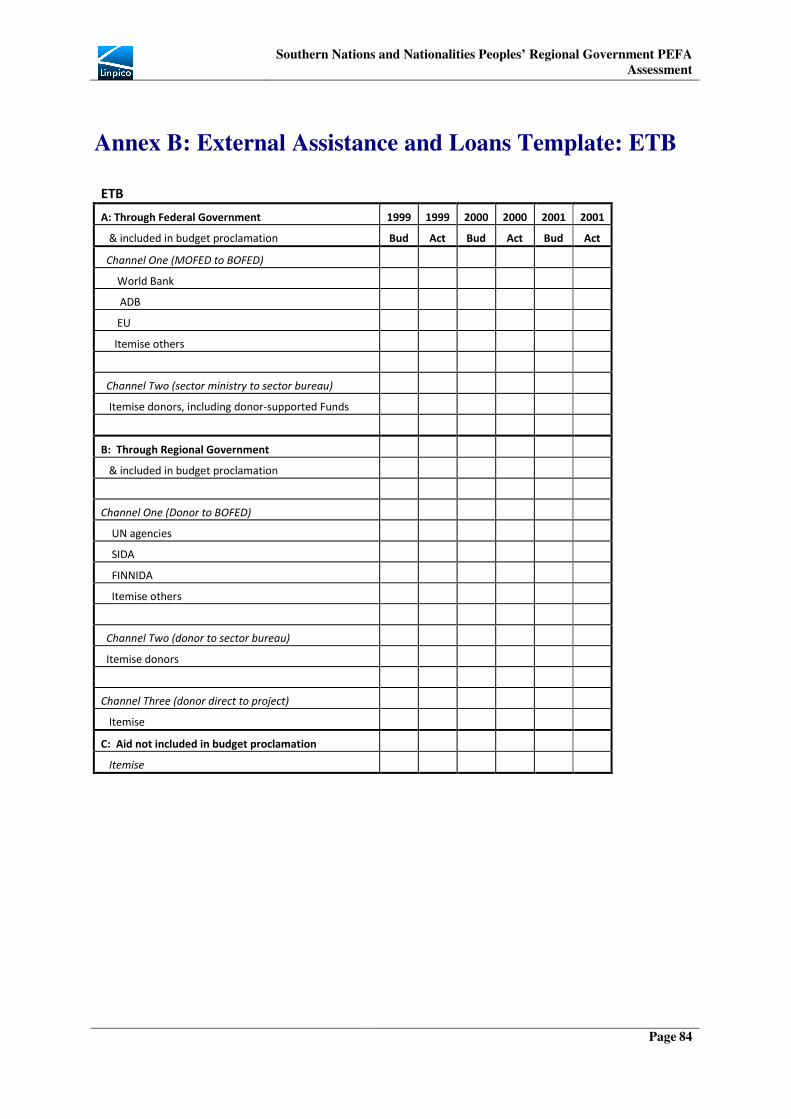
Southern Nations and Nationalities Peoples’ Regional Government PEFA
Assessment
Page 84
Annex B: External Assistance and Loans Template: ETB
ETB
A: Through Federal Government 1999 1999 2000 2000 2001 2001
& included in budget proclamation Bud Act Bud Act Bud Act
Channel One (MOFED to BOFED)
World Bank
ADB
EU
Itemise others
Channel Two (sector ministry to sector bureau)
Itemise donors, including donor-supported Funds
B: Through Regional Government
& included in budget proclamation
Channel One (Donor to BOFED)
UN agencies
SIDA
FINNIDA
Itemise others
Channel Two (donor to sector bureau)
Itemise donors
Channel Three (donor direct to project)
Itemise
C: Aid not included in budget proclamation
Itemise

LINPICO Southern Nations and Nationalities Peoples’ Regional Government PEFA
Assessment
Page 85
Annex C: List of People Met
Ato Berigude Bawcha: Head, BOFED
Ato Tsegaye Alemu, BOFED.
Ato Desalegne Tassew, Head, Monitoring and Evaluation Process
Ato Samuel Gondar, Head, Financial Administration and Property Management Department, BOFED
Ato Getu Esayas Atango, Head, Procurement, Disposal and Property Administration Process,
Education Bureau
Ato Moses Balcha, Head, Revenue Authority,
Heads, FAPMDss, Education, Health, Water Resources, and Agriculture Bureaus.
Ato Sahle Gebre Behutiya, Auditor General, ORAG
Chairman, Budget and Finance Committee, Regional Council.
Donor Agencies
Mr. Ephraim Zewdie, Economist, EU Delegation, Addis Ababa
Ms. Benedetta Musillo, Economic Attache, EU Delegation, Addis Ababa
Mr. Christoph Wagner, Head of Section, Economic, Trade, Social, Regional Integration, EU
Delegation, Addis Ababa
Ato Hiwot Mebrate, Social Development Advisor, Embassy of Ireland, Addis Ababa.
Mr. Hans Poley, First Secretary Economic Affairs, Netherlands Embassy, Addis Ababa
Dr. Paul Dorsey, Dulcian, Ethiopia (IBEX Project)
Dr. Stephen Peterson, former project manager of DSA project