Embed Size (px)
Citation preview

South Texas
Business
Recovery from
COVID-19
Progress Report
June 2020

South Texas COVID-19 Business Recovery
1
This report reviews changes in South Texas business conditions since the COVID-19 outbreak unfolded in the region. To monitor
how the business community has navigated the ongoing pandemic over time, we first compare key findings of the South Texas
COVID-19 Task Force surveys conducted in March, April, and June. Next, we supplement the survey results with daily foot traffic
and on-site employment data from various private data platforms, such as Google.
How is our regional economy performing today? Without timely official statistics on local business conditions, our survey and real-
time locational data offer a glimpse of the progress we’ve made in the past month as well as the challenges our businesses are
facing. Along with daily on-site and mobility data, the surveys represent snapshots of our regional economy that help us better
understand the impacts of statewide lockdown order and business performance after the state began reopening the economy.
Takeaways
• One month after the state’s lifting of its stay-at-home order, more than 90% of businesses in South Texas had reopened.
While the vast majority of businesses have returned, industries that are directed affected by the state’s social-distancing
requirements, including educational, and leisure and hospitality, have been operating well below their pre-pandemic
capacity. This has contributed to persistence in unemployment after a historic jump in April.
• The economic toll of COVID-19 is disparately spread across the business community, and various state executive orders
along with social distancing behavior since March have likely affected this. Industries that rely heavily on face-to-face
interaction with employees and customers have been hit hardest along with steepest revenue losses. The pandemic has
also continued to devastate businesses that are particularly vulnerable to supply chain disruptions.
• The COVID-19 economic crisis is likely hitting Corpus Christi and Victoria harder than other large metro areas in Texas. As
tourist destinations as well as energy hubs, these areas’ employment share of “high risk” industries (Moody Analytics, 2020)
at about 20% is among the highest in Texas, following only Midland, Odessa, and Laredo. The survey results indeed
underscore the vulnerability of their brick-and-mortar industries, particularly oil and gas extraction, and leisure and
hospitality.
• Essentially the entire United States is bearing the pandemic’s economic toll, but the burden is disproportionately steeper for
this South Texas community. It is now evident that simply reopening the economy is insufficient to restore employment.
Instead of one-size-fits-all policies, public officials must therefore attend to the distinctive regional and local impacts of the
national turmoil.
• The pandemic has hit the local economies in South Texas especially hard, creating unemployment rates higher than the
national average. Most businesses are back by now, but jobs are not. To quickly restore the regional economy and
employment, bold policy actions are required to boost spending, public or private, at the same time to incentivize the
unemployed to return to work.

South Texas COVID-19 Business Recovery
2
Background
According to Homebase’s daily geolocation data, the number of closed businesses began rising in response to the state governor’s
announcement of school closing effective March 20. Yet some businesses reopened their doors as soon as the second week of
April, long before the state lifted its ban on “nonessential” businesses’ operations by the end of that month. Gauged by foot traffic,
the economy has reopened slowly but steadily over time through today. Developments during the ongoing COVID-19 pandemic
underscore the importance of understanding geographical differences across the nation as well as the pandemic’s varying impacts
on different businesses and demographic groups.

South Texas COVID-19 Business Recovery
3
Texas Governor Greg
Abbott orders closing of
schools, gyms,
barbershops, and salons.
Texas begins
reopening the
economy in stages.
Texas stay-at-home order
with the exception of
essential activity is
effective for the entire
month of April. Schools
are closed until at least
May 4.
Texas state begins phase
2 of reopening
businesses: Restaurants
can operate at 50%
capacity.
Certain retailers are
allowed to reopen for
“pickup or delivery."
20
Mar
23
Mar 1 Apr
12
Apr
1 May
2020
Timeline of State Executive Orders
24
Apr
1 Jun
22
May
Phase 3 of reopening
businesses: Businesses
can operate at 50%
capacity; restaurants can
operate at 75% capacity
on June 12.
3 Jun

South Texas COVID-19 Business Recovery
4
Geographic Scope and Timing of Surveys
To gauge the immediate economic impact of the coronavirus outbreak,
particularly the unprecedented executive orders to shut down certain
businesses, the South Texas COVID-19 Task Force initiated a business survey
project in late March. Led by the Corpus Christi Regional Economic
Development Corporation, this task force consists of chambers of commerce,
economic development agencies, and public officials across the Coastal Bend
and Golden Crescent regions of South Texas.
The first survey was launched soon after Texas Governor Abbott issued
executive orders to close schools, gyms, and barbershops. Following the stay-
at-home orders from the governor and local officials across South Texas
effective April 1, the Task Force conducted a follow-up survey during the week
of April 13 to access further changes in local business conditions.
Governor Abbott lifted the statewide stay-at-home orders and began reopening
the economy in stages effective May 1. To evaluate the recovery progress and
the challenges that businesses were facing when they reopened their doors, the
Task Force launched its third survey.
The first two surveys each garnered about 900 completed and partially
completed returns. The third survey yielded 538 returns. Respondents spread across 11 counties between Kleberg and Victoria
counties. All three surveys yielded results within the 5% confidence level. The mix of business owners and managers who filled out
the surveys is representative of the overall profile of the business community in this region.
The summary reports for the three individual surveys document aggregate findings of all businesses, whereas the focus of this
report is the dispersion in business performance across different industries. In other words, we look at how businesses in different
sectors of the regional economy evolved at different stages of the pandemic underway.
Respondent Distribution

South Texas COVID-19 Business Recovery
5
Operations
More than one third of businesses were reportedly closed during the two survey periods in March and April. Closures were more
prevalent in some industries than others. By early June, more than 90% of businesses in the region had returned in response to the
state’s lifting of temporary closure orders. Most businesses in industries that are less affected by social distancing requirements,
such as financial and business services, are now open.
0% 20% 40% 60% 80% 100%
Agriculture
Mining, & Oil/Gas Extraction
Utilities
Construction
Manufacturing
Wholesale Trade
Retail Trade
Transportation & Warehousing
Information
Finance & Insurance
Real Estate
Professional Services
Administrative Support
Educational Services
Health Care & Social Assistance
Arts & Recreation
Accommodation & Food Services
Other Services
Public Administration
All Sectors
% of Open Businesses
March April June

South Texas COVID-19 Business Recovery
6
Operating Capacity
According to survey respondents, the average operating level among businesses in South Texas was 80% in March. It reduced to
65% in the second week of April. About one month after the stay-at-home orders were lifted, businesses on average were operating
at 80% of their normal levels. The data by industry reflect the impacts of government mandates, including school closings, capacity
restrictions on restaurants and bars, and arts and recreational facilities like museums and sports venues.
0% 20% 40% 60% 80% 100%
Agriculture
Mining, & Oil/Gas Extraction
Utilities
Construction
Manufacturing
Wholesale Trade
Retail Trade
Transportation & Warehousing
Information
Finance & Insurance
Real Estate
Professional Services
Administrative Support
Educational Services
Health Care & Social Assistance
Arts & Recreation
Accommodation & Food Services
Other Services
Public Administration
All Sectors
Average Operating Capacity Level
March April June

South Texas COVID-19 Business Recovery
7
Revenue Changes
On average, businesses in South Texas have sustained a 30% revenue loss since late March. According to the surveys, ending the
stay-at-home orders did not quickly erase those losses as businesses have still operated below their pre-pandemic capacity. In June,
some service industries, including arts and recreation, hotels/motels, and restaurants, suffered more losses than other industries as
distance travels remained limited.
-80%
-60%
-40%
-20%
0%
20%
Average Revenue % Change
March April June

South Texas COVID-19 Business Recovery
8
Business Challenges
The pandemic has created different challenges to different businesses. All else being equal, businesses that can more readily
operate online with their employees and customers were less vulnerable to the effects of stay-at-home orders and social distancing
guidelines. Those businesses are largely in educational, financial, and other professional services. On the contrary, businesses in the
hospitality sector rely heavily on face-to-face contact and thus have been particularly devasted by the pandemic. In addition to
requiring physical interactions with employees, some industries, such as oil and gas and manufacturing, are particularly subject to
supply chain disruptions that have been occurring nationally and globally.
-10% 10% 30% 50%
Agriculture
Mining, & Oil/Gas Extraction
Utilities
Construction
Manufacturing
Wholesale Trade
Retail Trade
Transportation & Warehousing
Information
Finance & Insurance
Real Estate
Professional Services
Administrative Support
Educational Services
Health Care & Social Assistance
Arts & Recreation
Accommodation & Food Services
Other Services
Public Administration
All Sectors
% of Remote Workforce
March June
0% 10% 20% 30% 40% 50%
Agriculture
Mining, & Oil/Gas Extraction
Utilities
Construction
Manufacturing
Wholesale Trade
Retail Trade
Transportation & Warehousing
Information
Finance & Insurance
Real Estate
Professional Services
Administrative Support
Educational Services
Health Care & Social Assistance
Arts & Recreation
Accommodation & Food Services
Other Services
Public Administration
All Sectors
Businesses with Supply Chain Disruptions
March June

South Texas COVID-19 Business Recovery
9
Staffing Level Changes
Despite the unprecedented federal relief programs under the CARES Act to help keep small businesses’ employees on payroll,
businesses have responded to the pandemic by reducing staffing levels. According to the June survey, slightly more than half (51%)
of businesses have received a forgivable PPP or EIDL loan, leaving almost half of local businesses without any federal aid to navigate
the shutdown period. While the share of local businesses that shredded part of their workforce has reduced from 92% in March to
62% in June, those businesses lacking government assistance were more likely to either layoff or terminate their employees.
0% 10% 20% 30% 40% 50% 60% 70% 80% 90% 100%
Agriculture
Mining, & Oil/Gas Extraction
Utilities
Construction
Manufacturing
Wholesale Trade
Retail Trade
Transportation & Warehousing
Information
Finance & Insurance
Real Estate
Professional Services
Administrative Support
Educational Services
Health Care & Social Assistance
Arts & Recreation
Accommodation & Food Services
Other Services
Public Administration
All Sectors
Businesses with Layoffs/Terminations
March April June

South Texas COVID-19 Business Recovery
10
Local Physical Mobility
State-ordered reopening of economy on May 1 did not have any immediate impact on Texans’ mobility behavior or employment.
Federal stimulus payments tended to increase consumer spending, while Paycheck Protection Program loans and other federal aid
provided liquidity to mitigate immediate economic hardship. These relief programs help explain the gradual but persistent rise in
the amounts of time local residents have spent in the workplace or anywhere away from home.
-70%
-60%
-50%
-40%
-30%
-20%
-10%
0%
10%
20%
30%
3/1 3/8 3/15 3/22 3/29 4/5 4/12 4/19 4/26 5/3 5/10 5/17 5/24 5/31 6/7
Source: Google Mobility Reports.
Nueces County Mobility
Workplace
Home
Away-from-Home
4/1TX Stay-at-Home Order
4/15StumulusPayments Start
5/1TX Reopens Select Businesses
3/21TX Public Schools Close
Data are relative to the baseline set at January 2020.
South Texas COVID-19 Business Recovery
11
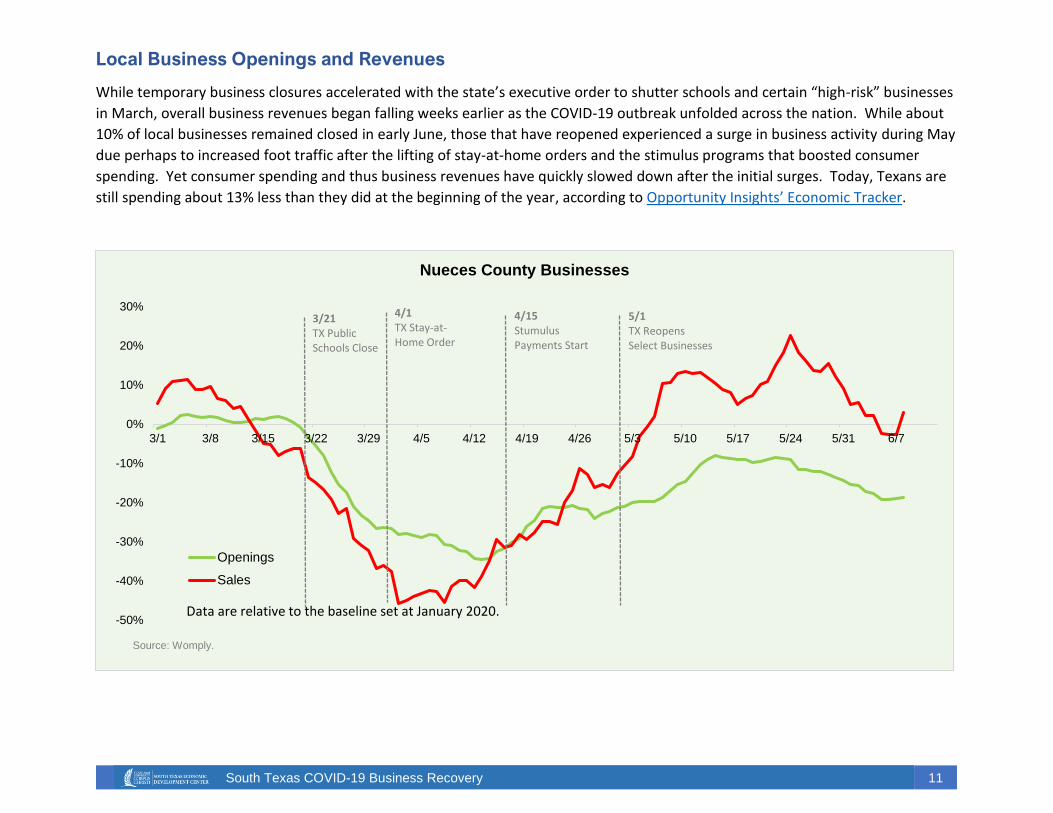
Local Business Openings and Revenues
While temporary business closures accelerated with the state’s executive order to shutter schools and certain “high-risk” businesses
in March, overall business revenues began falling weeks earlier as the COVID-19 outbreak unfolded across the nation. While about
10% of local businesses remained closed in early June, those that have reopened experienced a surge in business activity during May
due perhaps to increased foot traffic after the lifting of stay-at-home orders and the stimulus programs that boosted consumer
spending. Yet consumer spending and thus business revenues have quickly slowed down after the initial surges. Today, Texans are
still spending about 13% less than they did at the beginning of the year, according to Opportunity Insights’ Economic Tracker.
-50%
-40%
-30%
-20%
-10%
0%
10%
20%
30%
3/1 3/8 3/15 3/22 3/29 4/5 4/12 4/19 4/26 5/3 5/10 5/17 5/24 5/31 6/7
Source: Womply.
Nueces County Businesses
Openings
Sales
3/21TX Public Schools Close
4/15StumulusPayments Start
5/1TX Reopens Select Businesses
4/1TX Stay-at-Home Order
Data are relative to the baseline set at January 2020.

South Texas COVID-19 Business Recovery
12
Employment by Sector
Despite the rising number of reopened businesses and overall business revenues returning to the pre-COVID-19 levels, job losses
remained widespread across the region. The pandemic has hit some sectors of the economy harder than others. The hospitality
sector, which relies mostly in-person services and out-of-town visitors, has been hit hardest and thus has lost the most jobs in the
region, as evidenced by the on-site data and Texas Workforce Commission’s unemployment claim patterns. The retail trade sector,
on the contrary, have been overall less affected as grocery stores and supermarkets have in fact added workforce to meet rising
demand for household supplies and groceries as residents have spent more time at home.
-60%
-50%
-40%
-30%
-20%
-10%
0%
10%
3/1 3/8 3/15 3/22 3/29 4/5 4/12 4/19 4/26 5/3 5/10 5/17 5/24 5/31
Source: Homebase.
Nueces County Employment by Sector
Employment
Retail
Healthcare
Hospitality
3/21TX Public Schools Close
4/1TX Stay-at-Home Order
4/15Stumulus Payments Start
5/1TX Reopens SelectBusinesses
Data are relative to the baseline set at January 2020.

South Texas COVID-19 Business Recovery
13
Geographic Disparities
In addition to different sectors or industries, the pandemic has hit some businesses especially hard due to their particular clientele
or location within a region. As high-income households reduced spending more sharply than low-income households did, businesses
that catered primarily those customers were more likely to close down or reduce their staffing levels. In Nueces County,
employment and worker earnings among small businesses in the ZIP code areas with median household income on the top quartile
(25%) of the national average, such as 78413 of Southside, have exhibited steeper declines than the communities with lowest-
income households, such as 78405 of Westside. Business closures particularly in those high-income areas also impose trickle-down
effects on the rest of the region through terminations of low-wage workers.
-45%
-40%
-35%
-30%
-25%
-20%
-15%
-10%
-5%
0%
3/1 3/8 3/15 3/22 3/29 4/5 4/12 4/19 4/26 5/3 5/10 5/17 5/24 5/31
Source: Homebase.
Nueces County Employment
Employment
Areas in BottomIncome Quartile
Areas in MiddleIncome Quartiles
Areas in TopIncome Quartile
-50%
-45%
-40%
-35%
-30%
-25%
-20%
-15%
-10%
-5%
0%
3/1 3/8 3/15 3/22 3/29 4/5 4/12 4/19 4/26 5/3 5/10 5/17 5/24 5/31
Source: Homebase.
Nueces County Employee Earnings
Earnings
Areas in BottomIncome QuartileAreas in MiddleIncome QuartilesAreas in TopIncome Quartile
Data are relative to the baseline set at January 2020.Data are relative to the baseline set at January 2020.