Embed Size (px)
Citation preview

S O U T H S E A P E A R L
A N N U A L R E P O R T 2 0 1 0
For
per
sona
l use
onl
y

Corporate DirectoryDirectors
Stephen Paul BIRKBECK
Joseph James Uel TAYLOR
B.Sc. (Biology), Ph.D.
Simon Charles Bunbury ADAMS
B.Bus, M.Acc, A.C.I.S., A.I.C.D.
Geoff NEWMAN
B.Ec (Hons), MBA, F.C.P.A, F.A.I.C.D
Company Secretary
Cecilia Anna TYNDALL
B. Bus, C.A., A.C.I.S.
43 York Street
Subiaco
Western Australia 6008
P.O. Box 8015
Subiaco East
Western Australia 6008
T +61 (0) 8 9380 9444
F +61 (0) 8 9380 9970
W www.atlassouthseapearl.com.au
Auditors
BDO Audit (WA) Pty Ltd
38 Station Street
Subiaco WA 6008
Tax Advisers
BDO Tax (WA) Pty Ltd
38 Station Street
Subiaco WA 6008
Bankers
Commonwealth Bank of Australia
150 St Georges Terrace
Perth WA 6000
Share Registry
Computershare (WA) Pty Ltd
Level 2,
45 St George’s Terrace
Perth WA 6000
Home Exchange
Australian Securities Exchange Limited
Exchange Plaza
2 The Esplanade
Perth WA 6000
ASX Trading Code: ATP
For
per
sona
l use
onl
y

Chairman’s Report 2Directors’ Report 4Auditor’s Independence Declaration 32Consolidated Statement of Comprehensive Income 35Consolidated Statement of Financial Position 36Consolidated Statement of Changes in Equity 37Consolidated Statement of Cash Flows 38Notes to and Forming Part of the Consolidated Financial Statements 39Declaration by Directors’ 90Independent Auditor’s Report 91Shareholder Information 94
CONTENTS
For
per
sona
l use
onl
y

2 Chairman’s Report
2010
Chairman’s Report
Dear Shareholder,
The world economic crisis of 2009 changed the commercial environment significantly and the impact of a global downturn in the luxury sector is still affecting the pearling industry. In 2009 the price that South Sea pearl farmers received for their product halved. In 2010-11 the price has recovered slightly but for many producers the sale price is less than the cost of production, causing the wide spread closure or restructure of farms in Australia, Indonesia and the Philippines.
Atlas has made organisational changes in 2010, at the time of these low price points. We maintained a profitable margin on production, and we used our liquidity in an aggressive acquisition program. In 2010 we acquired a major pearling operation with leases spread over the islands of Flores and Alor. Combined with the existing pearl farms, this provides a base to double our pearl production with a good geographical spread for risk mitigation.
2010 saw the highest quantity of oyster seeded in the company’s history with 465,000 seeded and the instigation of operational and infrastructure changes to enable further significant expansion over 2011-2013 in order to reach the stated growth objectives. Our two hatcheries have achieved the production targets that will be the foundation of this ambitious expansion program.
Atlas continues to maintain high standards within its operations and management which, combined with its economies of scale in production, underwrites business profitability into the future. An ongoing focus on key performance measures and a review of strategic goals has maintained the focus of the management team over the last twelve months.
Central to the economic prosperity of Atlas is product quality and innovation, and a unique and compelling market proposition that is being reflected through strategic branding. In 2010, Atlas launched its new corporate brand and restructured its sales and marketing divisions. The group has established a strong loose pearl customer base and now has a profitable retail business with 5 outlets and two more being opened in 2011.
In the second half of 2011, a new state of the art corporate headquarters will open that will highlight the company’s products, vision and values to its key stakeholders. Atlas has reduced its gearing, increased its profitability, improved its liquidity whilst growing net assets to over $0.14 cents per share. A substantial increase in the asset base will be sustained over the next three years.
The company elected in 2010 to use its positive liquidity to reduce its bank debt and invest in the scale up of business capacity rather than pay dividends. I would ask for the Shareholders continued support for the prudent re-establishment of a dividend stream in 2011-2012 that ensures the company has the right balance between dispersion of its profits to Shareholders and re-investing in the expansion of the group’s activities.
As increasing volumes of pearl inventory (that take two years to harvest from seeding) work their way through the balance sheet, higher revenues which will result in improved profitability, will be utilised to grow a diverse and profitable company.
Leveraging off the luxury supply chain with these new concepts and products has already started through the groups extensive contacts in the twin engine rooms of the luxury sector, New York and Paris. As a founder of various ethical and environmental initiatives in the luxury perfume sector over the last 20 years, I believe Atlas provides a window into the consumer trends of the 21st century.
For
per
sona
l use
onl
y

3Chairman’s Report
2010
Chairman’s Report
GLOBAL LEADER IN ECO PEARLING
I am proud that our management team demand the Board and Shareholders’ support for a sustainable approach to the regional environments and cultures with-in which we operate. We take the Environmental Custodianship of our Oceans (ECO) seriously and view this as not only a social responsibility but as a good long term commercial strategy.
By adopting this approach, we create a win-win situation for the regional communities where we operate, for our environment and for Shareholders. Ethical business is not a social tax, it can be a prudent commercial investment.
UNLOCK THE TREASURES OF THE SOUTH SEAS
Innovation and research are central to the group’s core objectives. As well as the long term production research undertaken in relation to oyster genetics (James Cook University, Queensland) and farming methodologies, Atlas has started to do extensive product development research relating to by-product value adding. These investments are starting to produce tangible results.
CONCLUSION
I take this opportunity to encourage the ongoing support of Shareholders who have remained loyal to the company. The pearling business has a long product cycle that demands patience and the rewards for this are now being seen. It is my objective to ensure that we share the improved fortunes of our group with our Shareholders in a tangible financial way in the short to medium term as profitability grows. Results of the record 2010 seeding programme will come to fruition in 2012/13 with an increased pearl harvest.
Stephen Birkbeck
CHAIRMAN
31 March 2011
For
per
sona
l use
onl
y

4 Directors’ Report
2010
Directors’ Report
Your Directors present their report on the consolidated entity (referred to hereafter as the Company) consisting of Atlas South Sea Pearl Limited and the entities it controlled at the end of, or during, the year ended 31 December 2010.
1. DIRECTORSThe following persons were directors of Atlas South Sea Pearl Limited during all or part of the financial year and up to the date of this report except where stated:
STEPHEN PAUL BIRKBECK (Age – 50) CHAIRMAN OF THE BOARD (Audit Committee, Remuneration Committee)
Mr Birkbeck was the founder and former CEO of Mt Romance, an Australian company that has become one of the largest producers of sandalwood oil in the world. Mr Birkbeck has extensive marketing expertise, especially in the luxury goods markets. He has been presented with a number of excellence awards in relation to the success of Mt Romance and brings this extensive business development skill to the Board.
Appointed Director on 15 April 2005
Appointed Chairman of the board on 21 December 2009
(Last re-elected as a director – 18 May 2009)
Directorships of other listed companies held in the last three years:
• Nil
JOSEPH JAMES UEL TAYLOR, B.Sc. (Biology), Ph.D. (Age – 44) NON EXECUTIVE DIRECTOR, (Audit Committee)
Dr Taylor is a marine biologist and aquaculturist whose PhD research specialised in the husbandry of Pinctada maxima pearl oysters. Since 1989, Dr Taylor has been involved in the management of aquaculture operations, mainly associated with South Sea pearl farming. He has acquired extensive knowledge about the biology of pearl oysters and has presented many research papers on this subject. Dr Taylor commenced employment with the Company in 1996 as the Project Manager and has overseen the development of the business to its current level of production.
Appointed Director on 13 September 2000
Managing Director from 31 August 2001 to 1 June 2009
(Last re-elected as a director – 31 May 2010)
Directorships of other listed companies held in the last three years:
• Nil
SIMON CHARLES BUNBURY ADAMS B.Bus, M.Acc, A.C.I.S (Age – 45) MANAGING DIRECTOR
Mr Adams has been with Atlas South Sea Pearl Ltd since 2000 in the role of Company Secretary and CFO. He has a good working knowledge of the pearling operations in Indonesia and of the pearling industry. Mr Adams has worked in numerous Australian listed companies over the last 16 years in a range of industries including the resource, property, engineering and real estate finance sectors. He has experience in the areas of finance, corporate, compliance and planning.
Appointed Managing Director on 1 September 2010
(The constitution does not require the Managing Director to retire by rotation)
Directorships of other listed companies held in the last three years:
• Nil
For
per
sona
l use
onl
y

5Directors’ Report
2010
Directors’ Report
GEOFF NEWMAN, B.Ec (Hons),M.B.A, F.C.P.A ,F.A.I.C.D. (Age – 59) INDEPENDENT NON EXECUTIVE DIRECTOR (Chair of Audit Committee, Remuneration Committee)
Mr Newman has over 25 years experience in finance, marketing and general management roles in organisations either directly involved in the resources sector or providing services and products to businesses in that sector. In 1995, after managing Bunnings Pulpwood operations for a number of years, he joined Coogee Chemicals Pty Ltd as Commercial Manager and then was appointed to the Board as Finance Director in the following year. Until August 2005 he was Finance Director/CFO and Company Secretary of both Coogee Chemicals and its oil and gas subsidiary Coogee Resources Limited before he retired from the Coogee group of companies at the end of June 2006.
Director since 15 October 2010
Directorships of other listed companies held in the last three years:
• Mount Magnet South NL - appointed 31 May 2006 ,resigned 9 September 2010
• Neptune Marine Services Limited – appointed 16 October 2008
Retired Directors -
IAN McKENZIE MURCHISON B.Comm, F.C.A., Dip. Naut. Sc. (Age – 59) INDEPENDENT NON EXECUTIVE DIRECTOR (Chair of Audit Committee, Remuneration Committee)
Mr Murchison has had over 28 years experience in finance and investment, and has been a Director of both listed and unlisted companies in Australia and overseas. Mr Murchison was an investment director and founding partner of the West Australian based private equity investment fund, Foundation Capital. Mr Murchison was a founding partner of the national chartered accounting firm of Sothertons.
Appointed Director on 28 July 2004
Resigned on 15 October 2010
(Last re-elected as a director – 31 May 2010)
Directorships of other listed companies held in the last three years:
• TFS Corporation Ltd – appointed 27 February 2006
RICHARD ALLEN WRIGHT, B.Sc. (Chemical Engineering), M Marine Affairs. (Age - 58) MANAGING DIRECTOR
Mr Wright is a former US Navy Submarine Commander and has worked in the US Embassy (Jakarta) as Naval Attaché. He has filled numerous senior management roles in commerce and in the not-for-profit sector. Mr Wright lives in Indonesia and has a good understanding of the language and culture in Indonesia and other parts of South East Asia. He joined the Company in March 2008 as General Manager – Operations.
Appointed Director on 10 March 2009
Resigned 1 September 2010
Appointed Managing Director on 1 June 2009
(The constitution does not require the Managing Director to retire by rotation)
Directorships of other listed companies held in the last three years:
• Nil
For
per
sona
l use
onl
y

6 Directors’ Report
2010
Directors’ Report
2. COMPANY SECRETARYThe Company Secretary at the end of the financial year was Mrs Cecilia Tyndall. Mrs Tyndall has over 15 years experience working as an accounting and finance professional in public practice, publicly listed companies and other private organisations. Roles include responsibilities as a company secretary, financial controller and advisor to the Board and senior management. She is a member of Chartered Accountants Australia and Chartered Secretaries Australia.
Company Secretary since 15 November 2010.
The Company Secretary during the financial year until 15 November 2010 was Mr Simon C B Adams.
3. DIRECTORS’ MEETINGSThe attendance at meetings of the Company’s Directors including meetings of committees of Directors is shown below:
Director Period Directors’ Meetings Audit Committee Meetings
Held Attended Held Attended
S.P. Birkbeck 01/01/10 - 31/12/10 8 8 2 2
G. Newman 15/10/10 - 31/12/10 2 2 - -
J.J.U. Taylor 01/01/10 - 31/12/10 8 8 2 1
S.C.B. Adams 01/09/10 - 31/12/10 4 4 - -
R.A. Wright 01/01/10 - 01/09/10 4 4 2 1
I.M. Murchison 01/01/10 - 15/10/10 6 5 2 2
For
per
sona
l use
onl
y

7Directors’ Report
2010
Directors’ Report
4. CORPORATE GOVERNANCE STATEMENTAtlas South Sea Pearl Limited (the Company) and the board are committed to achieving and demonstrating the highest standards of corporate governance. The board continues to review the framework and practices to ensure they meet the interests of shareholders. The company and its controlled entities together are referred to as the Group in this statement.
A description of the Group’s main corporate governance practices is set out below. All these practices, unless otherwise stated, were in place for the entire year. They comply with the ASX Corporate Governance Principles and Recommendations (including 2010 amendments) where possible, given the size and resources of the Group. Where there is variation from these principles, an explanation is provided in this report.
4.1 Principle 1: Lay solid foundations for management and oversight The relationship between the board and senior management is critical to the Group’s long-term success. The directors are responsible to the shareholders for the performance of the Group in both the short and the longer term and seek to balance sometimes competing objectives in the best interests of the Group as a whole. Their focus is to enhance the interests of shareholders and other key stakeholders and to ensure the Group is properly managed.
Roles and responsibilities of the Board The Board of Directors is responsible for the following:
• Providing strategic guidance to the Group including approving the corporate strategy
• Reviewing and approving business plans, the annual budget and financial plans including available resources and major capital expenditure
• Overseeing and monitoring:
à organisational performance and the achievement of the Group’s strategic goals and objectives
à progress of major capital expenditures and other significant corporate projects
à monitoring financial performance including approval of the annual and half-year financial reports and liaison with the company’s auditors
à ratifying the appointment and/or removal and contributing to the performance assessment for the members of the senior management team including the Managing Director, COO, CFO and Company Secretary
à overseeing the operation of the Group’s system for compliance and risk management reporting to shareholders
à ensuring appropriate resources are available to senior management
Day to day management of the Group’s affairs and the implementation of the corporate strategy and policy initiatives are formally delegated by the board to the Managing Director and senior executives.
A performance assessment for senior executives takes place annually.
4.2 Principle 2: Structure of the board to add value
Composition of the Board and Directors independence The names of the directors of the Company in office at the date of this report are set out on page 4 & 5 of this report.
For
per
sona
l use
onl
y
8 Directors’ Report
2010
Directors’ Report
In accordance with the definitions of an independent director as set out in the ASX Corporate Governance Principles and Recommendations, Mr Newman is the only independent director. The Board is therefore not made up of a majority of directors who are independent. However, the directors believe that they can, and do, act independently making judgements that are in the best interest of the Company on all relevant issues.
Mr Birkbeck is a substantial shareholder owning 12.58% of the issued shares of the Company and therefore is not considered to meet the definition of an independent director. Mr Birkbeck and his fellow directors believe that he does act independently and in the best interests of the Company and all of its shareholders when dealing with issues that fall within the scope of the role of the Chairman.
Dr Taylor ceased employment with the Company in June 2009. As he has held an executive position with the Company within the last two years, he is not considered to meet the definition of an independent director. Dr Taylor’s knowledge and experience in the pearling industry and working in Indonesia provides strength to the functions of the Board of Directors.
The Board believes that its members represent a good balance of skills, knowledge and experience that are necessary to understand and manage the challenges faced in the pearling industry. It also believes that the size of the Board reflects the appropriate allocation of the Company’s resources and allows for effective decision making by its members.
Term of office
Non executive directors are appointed for a fixed term with their positions made vacant in accordance with the Company’s constitution. Reappointment of a Director at the time of their retirement is not automatic but they may renominate for their positions on the Board subject to the constitution and they are re-elected by the members at the Company’s annual general meeting.
Chairman of the board
The chair is responsible for leading the board, ensuring directors are properly briefed in all matters relevant to their role and responsibilities, facilitating board discussions and managing the board’s relationship with the Company’s senior executives. In accepting the position, the Chair has acknowledged that it will require a significant time commitment and has confirmed that other positions will not hinder his effective performance in the role of Chair.
The Managing Director is responsible for implementing group strategies and policies.
Induction
The induction provided to new directors and senior managers enables them to actively participate in board decision-making as soon as possible. It ensures they have full understanding of the Company’s financial position, strategies, operations, culture, values and risk management policies. It also explains the respective rights, duties, responsibilities, interaction and roles of the board and senior executives and the Company’s meeting arrangements.
Commitment
The board held eight board meetings during the year. The number of meetings of the company’s board of directors and of each board committee held during the year ended 31 December 2010, and the numbers of meetings attended by each director is disclosed on page 6.
The commitments of non-executive directors are considered by the board prior to the directors’ appointment to the board of the company and are reviewed each year as part of the annual performance assessment.
Prior to the appointment or being submitted for re-election, each non–executive director is required to specifically acknowledge that they have and will continue to have the time available to discharge their responsibilities to the company.F
or p
erso
nal u
se o
nly

9Directors’ Report
2010
Directors’ Report
Independent professional advice and access to company information
Each director has the right to access all relevant Company information and to the Company’s executives and, subject to prior consultation with the Chairman, may seek independent advice at the entity’s expense.
Board committees
The board has established committees to assist in the execution of its duties and to allow detailed consideration of complex issues. Current committees include audit and remuneration committees as detailed below.
Minutes of committee meetings are tabled at the subsequent board meeting.
Nomination Committee
The Board has not established a nomination committee as there are insufficient directors on the Board for the functions of such a committee to operate effectively as a sub-committee. A formal performance review of the board and its members has not been undertaken in the last financial year. Careful consideration is given to the appointment of the Company’s new directors to ensure that the Board is well served by their experience and skills. The Board remains open to appointing additional directors who may add value to the skill and knowledge base of the Board.
4.3 Principle 3: Promote ethical and responsible decision making
Code of conduct
There is no formal code of conduct in place for directors and senior executive officers. However, the Board and management do adhere to best practice principals which include the following:
(i) conflict of interest – managing situations where the interest of a private individual interferes or appears to interfere with the interests of the Company;
(ii) corporate opportunity – preventing directors and key executives from taking advantage of property, information or position, or opportunities arising from these, for personal gain;
(iii) confidentiality – restricting the use of non-public information except where disclosure is authorised or legally mandated;
(iv) fair dealing – by all employees with customers, suppliers, competitors and employees of the Company;(v) protection and proper use of assets of the Company – ensuring the protection of and efficient use of
assets for legitimate business purposes;(vi) compliance with laws and regulations – active promotion of compliance.
Trading in Company securities
The Company has a share trading policy. “Restricted Persons” including Directors and employees (and their associates) are permitted to own shares in the Company but they are prohibited from dealing in the Company’s securities during a closed and prohibited period, if the dealing constitutes short term or speculative trading, if neither of the above two prohibitions apply, without having first obtained the prior written consent of the Chairman. A prohibited period is set out in the Company’s share trading policy on its website and through its ASX announcements. Restricted persons must advise the Company of any trading of its securities within five (5) days of any such transaction.
For
per
sona
l use
onl
y

10 Directors’ Report
2010
Directors’ Report
Diversity policy
The Company values diversity and recognises the benefits it can bring to the organisation’s ability to achieve its goals. The Corporate Governance Principles and Recommendations (including 2010 Amendments) is mandatory for financial years commencing on or after 1 January 2011. Therefore the Company has not yet developed a diversity policy to outline its objectives in relation to gender, age, cultural background and ethnicity. The requirement for the board to establish measurable objectives for achieving diversity, and for the board to assess annually both the objectives, and the Company’s progress in achieving them will be addressed this financial year.
4.4 Principle 4: Safeguard integrity in financial reporting
Audit Committee
The audit committee is made up of three (3) non-executive directors. The chair of the audit committee is Mr Newman, an independent director who is not the Chairman of the Board. Mr Newman has extensive financial and economics experience. The other members of the audit committee have a good understanding of business and are financially literate. The size and makeup of the current Board does not allow for there to be a majority of independent members on the audit committee.
Details of these directors attendance at audit committee meetings are set out in the directors report on page 6.
The Chief Executive Officer and the Chief Financial Officer declare in writing to the Board that the financial records of the company have been properly maintained, comply with accounting standards and present a true and fair view of the company’s financial position prior to the signing of the accounts.
The main responsibilities of the committee are to:
(i) Review, assess and approve the annual report, the half-year financial report and all other financial information published by the Company or released to the market
(ii) Assist the board in reviewing the effectiveness of the organisation’s internal control environment covering:• Effectiveness and efficiency of operations
• Reliability of financial reporting
• Compliance with applicable laws and regulations
(iii) Oversee the effective operation of the risk management framework(iv) Recommend to the board the appointment, removal and remuneration of the external auditors and review
the terms of engagement, the scope and quality of the audit and assess performance(v) Consider the independence of the external auditor on an ongoing basis and review and approve the level
of non-audit services provided by the external auditors(vi) Review and monitor related party transactions
In fulfilling its responsibilities, the audit committee:
(i) Receives regular reports from management and the external auditors(ii) Meets with the external auditors at least twice a year, or more frequently if necessary(iii) Provides the external auditors with a clear line of direct communication
For
per
sona
l use
onl
y

11Directors’ Report
2010
Directors’ Report
External auditors
The company and audit committee policy is to appoint auditors who clearly demonstrate quality and independence. The performance of the external auditor is reviewed annually and applications for tender of external audit services are requested as deemed appropriate, taking into consideration assessment of performance, existing value and tender costs. BDO Audit (WA) Pty Ltd (“BDO”) is appointed as the current auditor of the Company. It is BDO’s policy to rotate audit engagement partners on listed companies at least every five years.
An analysis of fees paid to the external auditors , including a breakdown of fees for non audit services, is provided in the directors’ report and as a note to the financial statements. It is the policy of the external auditors to provide an annual declaration of their independence to the audit committee.
The external auditor will attend the annual general meeting and be available to answer shareholder questions about the conduct of the audit and the preparation and content of the audit report.
4.5 Principles 5 and 6: Make timely and balanced disclosures and respect the rights of shareholders
Continuous disclosure and shareholder communication
The Company does not have a written policy on disclosure requirements but it is compliant with the continuous disclosure rules of the Australian Securities Exchange which ensures that:
(i) all investors have equal and timely access to material information concerning the Company, including its financial situation, performance, ownership and governance; and
(ii) Company announcements are factual and presented in a clear and balanced way.
The Board aims to ensure that all shareholders are kept informed of the Company’s performance. Information is regularly communicated to shareholders through:
(i) Distribution of the annual report to all shareholders (other than those who do not elect to receive it) which is available online through the Company’s website;
(ii) Distribution of shareholder updates which provide additional operational, corporate and financial information relevant for that period;
(iii) The annual general meeting and other meetings where shareholders have the opportunity to approve various Board actions;
(iv) Company announcements, shareholder or stock broker briefings and press releases which are posted to the Company’s web site; and
(v) Direct shareholder liaison by authorised executives.
The Company Secretary has been nominated as the person responsible for communications with the Australian Securities Exchange (ASX). This role includes responsibility for ensuring compliance with the continuous disclosure requirements in the ASX Listing Rules and overseeing and co-ordinating information disclosure to the ASX, analysts, brokers, shareholders, the media and the public.
Stakeholders’ interests
The Company does not have a code of conduct to deal with the legal and other obligations to stakeholders.
Senior executives are required to identify strategic stakeholders and maintain close contact with these parties at all times. Such stakeholders include employees, local communities within which the pearl farming activities are operated, critical equipment and service suppliers, product distributors and local and regional government authorities.
Employees have the right, and are encouraged to alert management and the board in good faith to potential misconduct without fear of retribution. Where necessary, such reports must be recorded and investigated in full.F
or p
erso
nal u
se o
nly

12 Directors’ Report
2010
Directors’ Report
4.6 Principle 7: Recognise and manage risk
Risk Management
The Company addresses risk management through its ongoing review and prioritisation of operation activities and corporate compliance. The Board is made aware of issues that, in the opinion of management, require resources or actions to deal with the matter. This includes all aspects of the business including the financial, operational and compliance risks, both financial and non-financial.
Corporate reporting
The Managing Director and the Chief Financial Officer have made the following certifications to the board:
• That the company’s financial reports are complete and present a true and fair view, in all material aspects, of the financial condition and operational results of the company and Group and are in accordance with relevant accounting standards
• That the above statement is founded on a sound system of risk management and internal compliance and control which implements the policies adopted by the board and that the company’s risk management and internal compliance and control is operating efficiently and effectively in all material respects in relation to financial reporting risks.
4.7 Principle 8: Remunerate fairly and responsibly
Remuneration Committee
The remuneration committee reviews and makes recommendations to the board on remuneration packages and policies applicable to senior executives and directors of the Company and its subsidiaries. This includes the setting of incentive performance packages and share allocations under the Employee Share Plan.
The members of the remuneration committee during the year were Mr Birkbeck, Mr Newman and Mr Murchison. The managing director is invited to the remuneration committee meetings as required but does not attend the meetings that involve matters that pertain to him. The committee has met on an ad hoc basis when required during the year.
Each member of the senior executive team signs a formal employment contract at the time of their appointment covering a range of matters including their duties, rights, responsibilities and any entitlements on termination. The standard contract refers to a specific formal job description. This job description is reviewed by the remuneration committee on an ad hoc basis, and revised where necessary.
Further information on directors’ and executives’ remuneration, including principles used to determine remuneration, is set out in the directors report under the heading ‘Remuneration Report’.
The committee also assumes responsibility for overseeing management succession planning, including ensuring adequate arrangements are in place for appropriate candidates to be later promoted to senior positions.
For
per
sona
l use
onl
y

13Directors’ Report
2010
Directors’ Report
5. REMUNERATION REPORT (AUDITED)The remuneration report is set out under the following main headings:
5.1 Principles used to determine the nature and amount of remuneration 5.2 Details of remuneration 5.3 Share based compensation 5.4 Service agreements 5.5 Additional information
The information provided in this remuneration report has been audited as required by section 308(3C) of the Corporations Act 2001.
5.1 Principles used to determine the nature and amount of remuneration
The objectives of the Company’s remuneration framework is to ensure that reward for performance is competitive and appropriate for the results delivered and recognises the environment within which its executives operate. Remuneration of senior executives is set with the objectives of:
(i) retaining and motivating key staff;(ii) attracting quality management skills to the organisation; and (iii) alignment of executive reward with the achievement of strategic objectives and the creation of value for
shareholders.
The Board has established a remuneration committee which provides advice on remuneration and incentive policies and practices and specific recommendations on remuneration packages and other terms of employment for executive directors, other senior executives and non-executive directors. The Corporate Governance Statement provides further information on the role of this committee.
5.1.1 Remuneration structure of Non-Executive Directors
Fees and payments to non-executive directors reflect the demands which are made on, and the responsibilities of, the directors. Non-executive directors’ fees are reviewed annually by the Board. Consideration is given to the remuneration of comparable companies when setting fee levels.
The Non Executive Directors’ aggregate annual remuneration may not exceed $350,000 which is periodically recommended for approval by shareholders. This limit was approved by shareholders at the Annual General Meeting on 30th May 2007. In the year ending 2010, the total non-executive directors’ fees including retirement benefit contributions were $161,088.
The following fees have applied:
Base Fees for Non Executive Directors - $40,000 per annum plus superannuation Additional fees of $5,000 per annum plus superannuation for the Chairman of the Audit Committee Chairman’s fee is $80,000 per annum plus superannuation
In addition the Chairman receives $36,000 per annum for providing marketing advice to the Company. Other Non Executive Directors receive $20,000 per annum as technical director and $25,000 per annum for business development advice.
5.1.2 Remuneration Structure of Executives
Employment contracts are in place between the Company (or its subsidiaries) and all key management personnel. Under these contracts, key management personnel are paid a base salary (which may be provided in the form of cash or non-financial benefits) in accordance with their skills and experience as well as entitlements including superannuation and accrued annual leave and long service leave in the event of termination.
Employee salaries are reviewed annually and are adjusted to take into consideration the individuals’ responsibilities and skills compared to others within the Company and the industry. There are no guaranteed base pay increases in any executives contracts.
For
per
sona
l use
onl
y

14 Directors’ Report
2010
Directors’ Report
There were no short or medium term cash incentives provided to any executives of the company during the last financial year except where noted in section 5.4 of this report. Short or medium cash incentives are incorporated into some executives salary packages at the time of this report. The framework provides a mix of fixed and variable pay with short and medium term incentives. As executives gain seniority with the group, the balance of this mix shifts to a higher proportion of ‘at risk’ rewards.
An Employee Share Plan (ESP) provides some senior executives with incentive over and above their base salary (refer 5.3 below). The allocation of shares under the Employee Share Plan (ESP) is not subject to performance conditions of the Company. The reasons for establishing the ESP were:
• To align the interests of senior management with shareholders. The ESP provides employees with incentive to strive for long term profitability which is in line with shareholder objectives; and
• To provide an incentive for employees to extend their employment terms with the company. Pearl farming is a long term business and the experience of long serving senior employees is an important factor in the long term success of the Company.
5.2 Details of Remuneration
Amounts of remuneration
Details of the remuneration of the directors, the key management personnel of the Group (as defined in AASB 124 Related Party Disclosures) and the highest paid executives of Atlas South Sea Pearl Limited and the Atlas South Sea Pearl Limited Group are set out in the following tables.
The key management personnel of the Group are the directors of Atlas South Sea Pearl Limited (see pages 4 and 5) and those executives that report directly to the Managing Director being:
J Jorgensen - Pearl Production Manager (from 1 March 2010) (Appointed Chief Operating Officer 1 September 2010)
T Jones - Pearl Marketing and Distribution Manager ( from 15 March 2010)
In addition, the following persons must be disclosed under the Corporations Act 2001 as they are among the 5 highest remunerated Group and / or Company executives:
M Mau – Group Financial Controller C Triefus – Retail Production Manager C Tyndell – Company Secretary (appointed 15 November 2010)
For
per
sona
l use
onl
y

15Directors’ Report
2010
Directors’ Report
5.2 Details of Remuneration (Cont.)
Details of the nature and amount of each element of the remuneration of each key management personnel of the Group and other executives of the Company and the Group.
Name Cash salary &
fees
Short term benefits Total cash salary, fees and short
term benefits
Post-employment
benefits
Long term benefits
Share based compensation
Total
Short term incentive
cash bonus
Non-cash monetary
benefit
Super-annuation
benefit
Long service leave
$ $ $ $ $ $ $ $
Directors(Non-Executive)
S.P. Birkbeck 10 2010 98,000 - - 98,000 7,200 - - 105,200
2009 41,269 - - 41,269 3,714 - - 44,983
I.M. Murchison12 2010 42,500 - - 42,500 3,263 - - 45,763
2009 45,000 - - 45,000 4,050 - - 49,050
G. Newman 11 2010 9,375 - - 9,375 750 - - 10,125
2009 - - - - - - - -
G.R.W. Snow 10 2010 - - - - - - - -
2009 77,936 - - 77,936 7,014 - - 84,950
(Executive)
J.J.U. Taylor 1,2,8 2010 149,653 - - 149,653 15,600 - 884 166,137
2009 235,816 - 13,183 248,999 14,100 2,415 5,195 270,709
S.C.B. Adams 1,2,4,5,8 2010 169,000 10,000 - 179,000 15,210 3,072 48 197,330
2009 159,500 - - 159,500 14,355 4,625 787 179,267
R.A. Wright 2,5,6 2010 133,624 - 12,017 145,641 - - - 145,641
2009 168,750 - 4,072 172,822 - - 50,000 222,822
For
per
sona
l use
onl
y

16 Directors’ Report
2010
Directors’ Report
5.2 Details of Remuneration (Cont.)
Name Cash Salary &
Fees
Short term benefits Total cash
salary, fees and
short term
benefits
Post-employment
benefits
Long term
benefits
Share Based
Payments
Total
Short term incentive
cash bonus
Non-cash monetary
benefit
Super-annuation
benefit
Long service leave
Termination benefits
$ $ $ $ $ $ $ $ $
Key Management Personnel
J.S. Jorgensen 2,3,5,7,13 2010 180,130 - 22,404 202,534 16,211 - - - 218,745
2009 - - - - - - - - -
T Jones 5,7,8,14,17 2010 91,606 11,089 - 102,695 8,245 - - - 110,940
2009 - - - - - - - - -
Other Company and Group Executives
M Mau 7,8,9 2010 126,000 - 24,703 150,703 - - - - 150,703
2009 63,539 - 8,001 71,540 - - - - 71,540
C Triefus 7,15 2010 94,167 - 18,254 112,421 - - - - 112,421
2009 - - - - - - - - -
C Tyndall 7,8,16 2010 2,243 - - 2,243 - - - - 2,243
2009 - - - - - - - - -
S Cavanagh 7,8,9 2010 - - - - - - - - -
2009 102,934 - - 102,934 10,912 - 18,308 575 132,729
Notes:
1. Dr J Taylor and Mr S Adams are Directors of the Company’s Malaysian subsidiary Aspirasi Satria Sdn Bhd.2. Mr S Adams and Mr R Wright are key management personnel of the Group with the title of Managing Director.. Dr J Taylor resigned as
Managing Director on 1 June 2009. Mr R Wright resigned as Managing Director as at 1 September 2010. Mr S Adams was appointed Managing Director as at 1 September 2010.
3. Mr J Jorgensen is a key management personnel of the Group and was appointed to the position of Chief Operating Officer (COO) in September 2010.
4. Mr S Adams was the Company Secretary and General Manager (Corporate & Finance) of the Group and appointed Managing Director of the Group on 1 September 2010.He was Company Secretary until 15 November 2010.
5. It is the opinion of the Board that the only officers of the Group who meet the definition of key management personnel as set out by the Corporations Act 2001 or the Australian Accounting Standards are the Pearl Production Manager and the Pearl Marketing and Distribution Manager, and in 2009 General Manager- Operations and General Manager -Corporate and Finance.
6. Mr Wright was General Manager –Operations and commenced employment on 24 March 2008. Mr R Wright was appointed Director on 10 March 2009 and Managing Director on 1 June 2009.
7. Denotes one of the 5 highest paid executives of the Group, as required to be disclosed under the Corporations Act 20018. Denotes one of the 5 highest paid executives of the Company, as required to be disclosed under the Corporations Act 2001. 9. S Cavanagh was the Group Financial Controller. S Cavanagh resigned on 11 September 2009. M Mau was appointed Group Financial
Controller and commenced on 15 June 2009.10. G Snow resigned as Chairman on 21 December 2009 and S Birkbeck appointed Chairman.11. G Newman appointed 15 October 2010.12. I Murchison resigned 15 October 2010.13. Mr J Jorgensen is the Managing Director of the Company’s Indonesian subsidiary, P.T. Cendana Indopearls.14. Mr T Jones was appointed Pearl Marketing and Distribution Manager 15 March 2010.15. Mr C Triefus is the Retail production Manager, in 2009 he was not one of the Groups highest paid executives.16. Mrs C Tyndall was appointed Company Secretary on 15 November 2010.17. Mr T Jones was the only executive to receive a portion of his remuneration linked to performance – 90% of his remuneration was fixed
and 10% at risk as an incentive payment.
For
per
sona
l use
onl
y

17Directors’ Report
2010
Directors’ Report
5.3 Share based payments compensation
In 2006 and 2007 ordinary shares were issued to key management personnel of Atlas South Sea Pearl Ltd under an Employee Share Plan (ESP) that was approved by shareholders at the company’s annual general meeting in May 2006. These shares have been issued to employees under the following terms:
5.3.1 In 2007 shares were issued at a price of 40 cents each , 900,000 were issued on 17th April and 200,000 were issued on 10th May 2007 when the market price was 41 cents and 48 cents per share respectively . In 2006, 2,150,000 shares were issued at a price of 29 cents each on 30th May 2006 when the market price was 31 cents per share. The fair value of the shares is considered to be the difference between the market price on the date of issue and the employees purchase price of the shares.
5.3.2 Entitlement to 50% of the beneficial interest on the shares vested to employees after they have completed two (2) years of employment with the company from the date of issue of the shares, and entitlement to the remaining 50% of the beneficial interest in the shares vested to employees after they have completed three (3) years of employment with the company from the date of issue of the shares;
5.3.3 Shares issued under the ESP have been paid for by employees who have been provided with an interest free, non-recourse loan by the Company. This loan is to be repaid from the proceeds of dividends paid in relation to these shares;
5.3.4 The details relating to the allocation of shares to directors and key management personnel under the ESP are as follows:
Name Date of Issue No. of Shares Issued
Shares Vested to
end of 2010
Shares Forfeited in
the year
Financial Year in
which shares vested
Nature of shares
Minimum value of grant
yet to be vested (1)
Maximum value of grant
yet to be vested (2)
Joseph Taylor 10/5/07 200,000 100% 0%2009 – 50%2010 – 50%
Ordinary Shares
$- $-
30/5/06 1,000,000 100% 0% 2008 – 50%2009 – 50%
Ordinary Shares $- $-
Simon Adams 17/4/07 100,000 100% 0%2009 – 50%2010 – 50%
Ordinary Shares
$- $-
30/5/06 400,000 100% 0% 2008 – 50%2009 – 50%
Ordinary Shares $- $-
Notes:1. The minimum benefit is based on the fact that the vesting criteria for the shares on issue have not yet been met.2. The maximum value is based on the value that is associated with the discount to the market price at the time that the shares were
issued.
5.3.5 At the Annual General Meeting of Atlas South Sea Pearl Limited on 18 May 2009, shareholders approved the issue of shares to R Wright. R Wright was issued $50,000 of his first years remuneration in the form of ordinary shares in Atlas in lieu of this amount being paid in cash. These shares were issued at a price of $0.08 per share and were placed in escrow for one year. The total number of shares allocated was 625,000. A Further 250,000 shares were issued under the same terms and conditions to C Triefus, a senior manager who meets the definition of key management personnel. The total amount of $70,000 was expensed in the Statement of Comprehensive Income during the 2009 year.
For
per
sona
l use
onl
y
18 Directors’ Report
2010
Directors’ Report
5.4 Service Agreements
Details of key management personnel contracts are set out below:
5.4.1 Dr J Taylor (Non-executive Director)
• In 2009, Dr J Taylor had an employment agreement in place in relation to his Technical Advisor role to the Company.
• Commencement date of contract was 1 June 2009 and was reviewed within three months of the Commencement date.
• Remuneration of services for this contract was agreed at a gross daily rate of $750 per day for each day worked under this contract. It was intended that 100 days per calendar year will be provided in this role.
• Agreement was terminated by mutual agreement.
• Not entitled to any special termination payments under this contract.
5.4.2 Mr Richard Wright (Managing Director) ( Resigned 1 September 2010)
• Employed under a fixed term contract which was due to expire on 15 May 2012.
• Base salary of $225,000 for the last financial year, reviewed annually.
• At commencement of the contract it was agreed that $50,000 of the first years remuneration would be in the form of Ordinary shares in Atlas in lieu of this amount being paid in cash. These shares were issued at a price of $0.08 per share and were placed in escrow for one year. This was not linked to performance targets.
• Agreement may be terminated by mutual agreement by either party giving 6 months notice unless under specific circumstances as noted in the Agreement.
• Not entitled to any special termination payments under this contract.
5.4.3 Mr Simon Adams (Managing Director)
• Employed under a fixed term contract which was due to expire on 25 March 2014.
• Base salary inclusive of superannuation for the 2011 financial year of $200,000, reviewed annually.
• Bonus based on 2.5% of increase in EBITDA over next 3 years from base of 2010 financial year.
• Agreement may be terminated by mutual agreement by either party giving 6 months notice unless under specific circumstances as noted in the Agreement.
• Not entitled to any special termination payments under this contract.
5.4.4 Mr Jan Jorgensen (Chief Operating Officer)
• Employed under a fixed term contract which was due to expire on 25 March 2014.
• Base salary for the 2011 financial year of $225,000, reviewed annually and also subject to various non-financial allowances relating to living in Indonesia.
• Bonus based on 1% of increase in EBITDA over next year from base of 2010 financial year.
• Agreement may be terminated by mutual agreement by either party giving 6 months notice unless under specific circumstances as noted in the Agreement.
• Not entitled to any special termination payments under these contracts.
5.4.5 Mr Michael Mau (Group Financial Controller)
• Contract valid for a term of 3 years subject to termination notice below and extension to contract beyond the initial term subject to approval by both parties.
• Base salary for the 2011 financial year of $132,000, reviewed annually and also subject to various non-financial allowances relating to living in Indonesia.
• The Company may terminate the executive’s employment agreement by providing 2 months written notice or providing payment in lieu of the notice period.
• Not entitled to any special termination payments under these contracts.
For
per
sona
l use
onl
y

19Directors’ Report
2010
Directors’ Report
5.4.6 Mr Colin Triefus (Retail Production Manager)
• Contract valid for a term of 3 years subject to termination notice below and extension to contract beyond the initial term subject to approval by both parties.
• Base salary for the 2011 financial year of $107,000, reviewed annually and also subject to various non-financial allowances relating to living in Indonesia.
• Bonus incentive to earn up to 15% of gross salary.
• The Company may terminate the executive’s employment agreement by providing 2 months written notice or providing payment in lieu of the notice period.
• Not entitled to any special termination payments under these contracts.
5.4.7 Mr Tim Jones (Pearl Distribution and Marketing Manager)
• Contract valid for a term of 3 years subject to termination notice below and extension to contract beyond the initial term subject to approval by both parties.
• Base salary for the 2011 financial year of $135,000 and 9% superannuation reviewed annually.
• Bonus based on 1% of increase in EBITDA over next year from base of 2010 financial year.
• The Company may terminate the executive’s employment agreement by providing 3 months written notice or providing payment in lieu of the notice period.
• Not entitled to any special termination payments under these contracts.
5.4.8 Other executives (standard contracts)
• Contract terminates on retirement.
• The Company may terminate the executive’s employment agreement by providing 2 months written notice or providing payment in lieu of the notice period.
• Not entitled to any special termination payments under these contracts.
5.5 Additional Information not audited as part of remuneration report
5.5.1 Loans to Directors and Executives
Details relating to the loans to directors and key management personnel including amounts, interest rates and repayment terms are set out in note 25 to the financial statements.
5.5.2 Options
There were no options issued to directors or key management personnel in the financial year, or the previous financial year.
For
per
sona
l use
onl
y

20 Directors’ Report
2010
Directors’ Report
6. PRINCIPAL ACTIVITIES AND REVIEW OF OPERATIONS
6.1 Principal Activities
The principal activity of the Company is the operation of a pearl production and distribution business in Indonesia. The Company also manufactures and sells pearl jewellery primarily in Bali, Indonesia but this constitutes approximately 10% of its revenue base.
The economic entity’s objectives are to:
• Be a global leader in the production of high quality pearls;
• Enhance revenue potential through vertical integration and the expansion of its value adding opportunities;
• Provide a consistent quality of wholesale peals and retail and wholesale jewellery for its customers;
• Improve pearl production efficiency through the implementation of results from research and development programs to maximise gross return
6.2 Review of Operations and significant changes in the state of affairs
6.2.1 Year in Review
Following the global financial crisis (GFC) of 2009, the Company has had a year of revenue growth and rebuilding of its asset base. While maintaining a focus on cost controls, an investment in capital and management resources has been made in preparation of future growth. Farm acquisitions on the islands of Alor and Flores and the establishment of a green-field site on the island of Punggu in the west of the Province of West Nusa Tengara, Indonesia has ensured that there is sufficient infrastructure in place to achieve the stated expansion objectives of doubling pearl production by 2015.
The development of marketing and sales initiatives for the company’s loose pearls has resulted in improved prices and better control over receivables. Jewellery retail distribution increased substantially through the five outlets that are owned by the company in Bali, Indonesia which caters for a growing tourist market. The upstream distribution of pearls through the retail outlets increases margins and enhances the company’s brand recognition.
For
per
sona
l use
onl
y

21Directors’ Report
2010
Directors’ Report
6.2.2 Shareholder Returns
2010 2009 2008 2007
$ $ $ $
Net profit/(loss) after tax 2,359,974 (7,182,713) (275,994) 8,032,843
Basic EPS 0.0186 (0.0625) (0.0031) 0.089
Dividends paid Nil Nil 1,800,918 3,597,663
Dividends (per share) Nil Nil 0.020 0.040
Net tangible assets per share 0.142 0.133 0.248 0.260
Share price at 31 December 0.11 0.125 0.205 0.41
Normalised EBITDA and the adjustments from NPAT for these periods are shown below:
2010 2009 2008 2007
$ $ $ $
Normalised EBITDA 867,017 (1,159,324) 3,864,237 4,813,545
Tax (expense)/ benefit (395,139) 329,866 460,898 (3,463,022)
Interest income/(expense) (123,588) (64,328) (39,266) 65,289
Depreciation (53,849) (74,284) (72,604) (74,936)
Foreign Exchange gain/(loss) (411,839) 2,043,455 (3,885,061) (68,182)
Agriculture Standard revaluation gain/(loss) 2,718,863 (7,272,156) 744,301 6,091,812
Other Non-Operating income/(expense) (241,491) (985,942) (1,348,499) 668,337
6.2.3 Financial Position
There has been an increase in the net assets of the group of $2.63M in the year to 31 December 2010. Movements in the net worth of the economic entity are summarised below:
• Cash reserves have decreased from $2.509M to $0.998M. During 2010, $1.16M of capital was raised through a placement of 10 million shares. Working capital requirements of $0.734M, acquisition of new pearl farms of $0.577M and property, plant and equipment purchases of $0.587M contributed to the decrease in cash reserves during 2010.
• Trade receivables have decreased by $0.46M during 2010 to $0.17M with collection periods significantly reduced from prior years.
• Stock of pearls has increased in 2010 by $0.85M to $4.397M due to an increase in pearl stock levels as at 31 December 2010 compared to the prior year and a significantly lower provision for impairment.
• Jewellery stocks have increased by $0.926M in 2010 due to an increase in stock on hand from expanded ranges in the retail outlets and an expansion of stores to five in Bali.
• Oyster inventory valuations decreased by $0.835M during 2010. There was an increase in quantity of juvenile oysters and an overall decrease in seeded oysters which have a higher unit value.
• Borrowings decreased by $0.676M to $3.596M in 2010 due to repayment of some of the bank loan facility within the year.
• Tax accruals decreased by $0.983M in 2010, due mainly to the assessment made by the Indonesian Tax Authorities in relation to the groups 2007 tax year being paid in full within the year. The Company believes that this assessment is incorrect and an appeal has been lodged in Indonesia and also in Australia with the Australian Tax Office to seek a refund on double tax treaties between the two countries and this is still being assessed along with an appeal by the company against the assessment in Indonesia.
• There was an increase of $0.228M in the assets from the mark to market valuation of the foreign exchange hedging contracts due to the appreciation of the Australian Dollar against the Japanese Yen in 2010.
• Deferred tax liability has increased by $0.61M in 2010 as a result of the increase in the Agriculture Asset values for the group.
For
per
sona
l use
onl
y

22 Directors’ Report
2010
Directors’ Report
6.2.4 Operating Results
Atlas has recorded a net profit after tax for the year ended 31 December 2010 of $2,359,974 (2009 – net loss of $7,182,713).
The operating revenue increased by 42% to $9,841,695 in 2010 from $6,908,444 in 2009, of which pearl sales revenue represented an increase of $2,653,000 to $8,571,000 in 2010. The total number of pearls sold in 2010 was more than double the previous year but due to the higher number of lower grade pearls that were in stock from pervious years and that were harvested during 2010, the average sale price of the pearls sold in 2010 was 16% lower than in the prior year. The average sellable grade pearl price, which is a measure of the quality pearls produced, increased by 25% in 2010.
Revenue from the sale of pearl jewellery, mother of pearl and pearl oyster sea food products was $1,232,000 in 2010 (2009 - $939,171). The number of jewellery retail outlets in Bali increased to five (5) in 2010 (2009 – 4 outlets).
An appreciation in the value of the Australian Dollar resulted in foreign exchange gains against the Japanese Yen denominated loan and foreign exchange hedging contracts.
A significant increase in the value of biological assets (pearl oysters and loose pearls) during the period had the effect of increasing profits by $2.72M in 2010.
6.2.5 Pearl Oyster Production Results
The 2009/10 breeding season from the hatchery in North Bali was very successful resulting in a record number of unseeded oysters in stock at the end of 2010 (1.2 million). A second hatchery was acquired with the farming assets that were purchased at Alor in 2010. The strong juvenile inventory balance at the end of 2010 will enable expansion of seeding programs in future periods as forecast.
The company seeded a record number of oysters in 2010. 418,000 of the oysters were operated for the first time with 47,000 being reseeded for a second time after harvest of a pearl.
The facilities at N. Bali were used as the central virgin oyster seeding centre in 2010. The Alor facilities will compliment this in future periods. Harvest and second operations are undertaken at the Alyui farm site following transfer from N. Bali and growout of the pearls in the nutrient rich waters of Alyui Bay.
For
per
sona
l use
onl
y
23Directors’ Report
2010
Directors’ Report
6.2.6 Bali Project
The hatchery at N. Bali was relocated from Penyabangan to Gorokgak prior to the commencement of the 2009/10 breeding season. This was very successful and resulted in some very good spawnings and settlement of excess spat. This has resulted in a very healthy stock of juvenile oysters for future seeding expansion.
The N. Bali facilities continued to be the focus of first operation seedings. Operations are able to be closely supervised to ensure consistency of quality and ongoing training of new technicians as required. After X-Ray to determine the presence of a growing pearls, oysters are shipped to the Alyui Bay site for pearl growout where the waters are more suited to faster growth. Additional sites in the immediate vicinity of the existing N. Bali sites are being secured for expansion.
6.2.7 Alyui Bay Pearling Centre
Alyui continues to be the company’s major pearl growing site. The Alyui Bay site has been able to reduce its staffing, logistics support and overall costs as a result of realigning its functions to specialise in pearl production. There has been an improvement in the proportion of oysters that are reseeded after they produce their first pearl as a result of a review of operating procedures. One camp was temporarily decommissioned during the year as a cost saving measure. This will be returned to service as the quantity of oysters at this site increases.
6.2.8 Alor/Flores Facilities
These sites were acquired as a going concern in July 2010. The overall pearling operation was made up of seven (7) separate sites. These sites perform the full range of functions from hatchery production, juvenile growout, seeding and pearl growout. The Company has focused on the upgrade of infrastructure and reorganisation of farms to allow higher quality oysters to be imported from N. Bali and reared in the Alor hatchery for future seeding. The quality of oyster stock that were acquired has been found to be poor compared to the Company’s own stock in other sites.
A new site on the island of Punggu at the west end of Flores has also been established as a dedicated site for pearl growout. This is being established with relatively simple infrastructure which will ensure that pre-seeded oysters can be delivered and maintained safely.
6.2.9 Environment
It is the objective of Atlas to become the global leader of Eco pearling. Atlas’s continues to be involved in protecting and supporting the environment in all areas where farming operations are located. The Company remains an active partner with Conservation International and The Nature Conservancy in being an environmental custodian of the ocean (ECO) to ensure that coral reefs and marine fauna and flora are protected. Support continues for initiatives such as maintaining buoys so that tourist boats which frequent the area in the protected and biologically important areas of Raja Ampat no longer damage the eco systems by anchoring. The Company’s pearl farm in Alyui Bay is recognised as one of the top diving locations in Raja Ampat and is now routinely visited by various live-aboard dive boats, frequently carrying highly placed individuals from organisations such as Conservation International, The Nature Conservancy, World Wildlife Fund, NOAA (US National Oceanic and Aerospace Administration), World Conservation Society, Walton Family Foundation, as well as conservation minded actors and donors to various conservation organisations.
The Company supports numerous other recycling and environmental protection initiatives in N. Bali, Nusa Tengara Timor and Raja Ampat. It is critical that the Company supports and protects its local environment to ensure its long term success. Involvement of the local communities in the implementation of the culture of conservation and environmental protection ensure the long term successes of these eco-friendly initiatives.
For
per
sona
l use
onl
y
24 Directors’ Report
2010
Directors’ Report
6.2.10 Community Relations
The Company’s Corporate Social Responsibility program remains a key element in our successful engagement in Indonesia. We continue to assist local communities with the provision of medical support and transportation where this would normally not be available from the local government authorities in Indonesia. Local communities are also able to take advantage of surplus capacity that the company may have in relation to accessing technical skills and resources for the purpose of repairs and servicing of equipment such as power generators and water supplies. Through direct and indirect means , Atlas supports education for children who live close to the farm sites.
The Company also supports various cottage industries in villages located within close proximity to our farming operations. The economic support we provide to local citizens, primarily widows and retirees without a reasonable pension, is well received and supported by the community. The Company in turn benefits from these cottage industries as most are focused on repair and refurbishment of various farm equipment, thereby resulting in an expanded reuse/recycle program and additional cost savings to the Company or providing other direct support to the Company. An initiative to re-introduce traditional dancing and art into local communities has been well received and is used to entertain foreign tourists at Alyui Bay who travel on live-aboard dive boats.
6.2.11 Socio-Political and Security Situation
The Socio-political environment in Indonesia continues to improve, but the Company continues to maintain a high level of vigilance. We maintain open lines of communication with foreign embassies to provide early indications of socio-political unrest and strong communication is maintained with local, regional and national government officials. Indonesia has experienced strong economic growth in the last 12 months and its relatively new democratic system is maturing under stable leadership. Government bureaucracy continues to be an issue in Indonesia but consistent and proactive treatment of these challenges has prove successful in achieving results.
6.2.12 Personnel
Atlas continues to make necessary changes in staffing and management in order to more effectively face the challenges of a difficult world market and to ensure a more efficient and cost effective operation. With the expansion of pearling operations in Indonesia, staff numbers have increased significantly in 2010 as infrastructure is developed. Management continues to focus on ensuring that talented people are retained where possible and training and support is provided to Indonesian Nationals to promote them through the company.
Staff numbers at the end of the year were as follows:
2010 2009 2008 2007
Expatriates – Indonesia 15 12 13 14
Indonesian nationals – permanent 338 335 421 371
Indonesian nationals – part time 126 125 122 133
Australia 5 4 4 4
For
per
sona
l use
onl
y

25Directors’ Report
2010
Directors’ Report
6.2.13 Marketing
The Company launched a strong corporate brand in the first half of 2010. This was created to represent its image of strength and leadership in the industry. This was developed in line with a cultural shift within Atlas from being one of the best pearl producers in the world to also having a strong focus on its marketing culture.
Atlas was successful at establishing its own grading and marketing department for its loose pearls in 2010. The new sales team was able to develop a diverse client base which resulted in an improvement in price and quantity of pearls sold. The market for loose pearls in 2010 improved slightly with more confidence evident amongst wholesale traders. The grading capacity for the raw loose pearls in Indonesia and the merchandising skills for preparation for sale which is undertaken in Australia continues to improve. Atlas’s regular harvesting and consistent high quality pearl has made it attractive to many large buyers who want to be primary customers of the Company.
Retail operations in Bali performed very well in 2010 as record tourist numbers were seen there. Two new stores were opened in prime locations at Nusa Dua and Kuta. Quality jewellery products, a wide selection of South Sea inspired items and an attractive shopping environment in key locations has attracted an increased number of customers to the stores. Margins were maintained on sales and various marketing strategies including the use of tour operators and guides were used effectively to generate business. A sixth retail outlet is planned for Bali in 2011 and the Company’s first retail store in Australia will be opened in the second half of 2011.
Atlas has started developmental work to value add to its by-products such as mother of pearl (MOP) and oyster meat through the trial of various extraction processes. The initial research is very promising and it is expected that the commercialisation of a number of products will take place in 2011. These will show significant differentiation of Atlas as a leader in innovation within the pearling industry.
6.2.14 Research and Development
The genetics improvement programme continues to provide benefit to the Company with faster growing, strong oysters resulting from recent genetic spawning. We anticipate that this will provide for future benefit through better and more rapid pearl production and lowering costs of this production. Tagging and genetic marker identification is ensuring that the genetic diversity of our breeding oysters is maintained with distinct family groups created through our selective breeding process. Ongoing research projects, both in-house and with external partners is keeping the Company at the leading edge of product quality.
6.2.15 Conclusion
2010 was a watershed year for Atlas. In a difficult economic environment, the Company has been able to yield a profit and commence a bold expansion program for its pearling operations in Indonesia. A sound platform has been laid for the growth of the business.
Management has identified the critical issues that it needs to address in order to achieve its objectives. 2010 was the start of this process with strong operational results from the hatchery breeding program, a record quantity of oyster seedings, strong sales and market development and a focus on strategic investment while maintaining costs.
For
per
sona
l use
onl
y

26 Directors’ Report
2010
Directors’ Report
7. DIVIDENDSNo dividends were declared and paid by the Company during the financial year ended 31 December 2009 and 2010.
8. MATTERS SUBSEQUENT TO THE END OF THE FINANCIAL YEARAtlas South Sea Pearl Limited is currently undertaking a share placement to sophisticated investors. The Company will issue 6,400,000 fully paid ordinary shares in the capital of the Company at an issue price of $0.12 each, to raise $768,000 before costs. The new shares will rank equally with the Company’s existing issued shares.
The results of significant operating activities are made available to shareholders and other interested parties through announcements to the Australian Securities Exchange and through regular newsletters.
9. LIKELY DEVELOPMENTS AND EXPECTED RESULTS OF OPERATIONSAtlas will continue with the expansion of its farming operations in Indonesia during 2011. Infrastructure at the farm sites at Alor, East Flores and Punggu are being upgraded to enable increased quantities of oysters to be farmed.
With the second hatchery at Alor being introduced for the 2010/11 and future breading seasons, it is expected that juvenile oyster production will increase in 2011 to enable the expanded pearl production targets to be met. By the end of 2011, it is anticipated that there will be approximately 2-2.5 million unseeded oysters held in stock, approximately double the number that were in stock at the end of 2010. Based on breeding results to date for the 2010/11 hatchery season, the Alor hatchery has under-performed due to the a delay in equipment upgrades and poor brood stock preparation but the N. Bali hatchery has produced sufficient spat to make up any shortfall.
Oyster seedings in 2011 are expected to increase to between 550,000 to 600,000 depending on the availablity of suitable virgin oysters and the proportion of harvested oysters that are re-operated. Training programs for additional seeding technicians are ongoing with close supervision provided to ensure that quality control for this integral process is maintained. Management efforts are being focused on the quality of seeding and oyster husbandry to improve survival and retention of nuclei after operations and increase the percentage of high quality pearls that are harvested.
The Company’s loose pearl grading and sales division which was established in 2010 will continue to develop and improve its product merchandising capacity and customer relations. By matching customer specific requirements with inventory availability and keeping a close watch on market developments, Atlas will ensure that it is able to maximise its return from loose pearl sales.
A sixth retail outlet will be opened in Bali in the first half of 2011 taking the total number of outlets to six. Atlas is moving its Australian headquarters to a new premises in Perth which will incorporate a retail outlet, the first for the Company in Australia. There will be an improvement in branding and product marketing for the retail outlets as the Company rolls out its expanded retail strategy. Product development is continuing in relation to extracts from pearl by-product such as mother of pearl and oyster meat for the manufacture of value added products.
For
per
sona
l use
onl
y

27Directors’ Report
2010
Directors’ Report
Atlas consciously seeks to make a practical contribution to local communities and
is a major employer in some of South East Asia’s most remote regions. Over 80%
of pearl farm staff are sourced from the surrounding villages. This is a continuous
program of work for Atlas but a few initiatives established to date include.
• BuildingandrefurbishingschoolsinBaliandPapua.
• Establishingscholarshipprogrammesforunder-privilegedchildren.
• OfferingtransporttotheremoteislandsofRajaAmpatfromtheSorongmainland.
• HealthservicesincludingaccesstoafullyequippedmedicalclinicinAlyuiBay.
• TechnologyknowledgetransferandtrainingprogrammesforIndonesianNationalsparticularlyinhatcheryandpearlseeding.
• Thedevelopmentofarecyclingventurewithhalftheproceedsgoingtoastaffloanfacility.
For
per
sona
l use
onl
y

28 Directors’ Report
2010
Directors’ Report
Oyster panel cleaning boats at work on the Alyui Bay pearl farm in Raja Ampat,
Papua Province. This farm site is located 100 nautical miles from the nearest sea
port of Sorong. The nearest villages of Selpelle and Saleo are less than 5 nautical
miles from the farm and provide seafood and other food supplies for the farm
camps. This low level of human interference within close proximity of the oyster
farms ensures that pollution risk is minimised.
RajaAmpatisrenownedtohaveoneofthemostbiodiversemarine
environmentsintheworld.ConservationInternationalhasestablished
amarinepreservationareaclosetothepearlfarmsandAtlasprovides
assitancetothisorganisationintheformoflogisticssupportinthearea.
Theoysterfarmingactivitiescomplimentthebiodiversityoftheareaby
creatingenvironmentsthatencouragefloraandfaunatothriveonthe
longlinesandanchorsthatformtheholdingstructuresfortheoysters.
For
per
sona
l use
onl
y

29Directors’ Report
2010
Directors’ Report
10. DIRECTORS’ INTERESTSThe relevant interest of each current Director in the share capital of the Company, as notified by the Directors to the Australian Stock Exchange in accordance with S205G (1) of the Corporations Act 2001, at the date of this report is as follows:
Ordinary Shares
Direct Indirect
S.P. Birkbeck - 17,155,581
J.J.U. Taylor1 20,000 1,200,000
S.C.B. Adams1 166,666 500,000
G. Newman - 400,000
1. The 1,700,000 shares held indirectly by Dr J Taylor and Mr S Adams are held in trust under the rules of the Employee Share Plan. The ownership
of these shares does not vest to Dr Taylor and Mr Adams until certain employment conditions are met (Refer Note 23).
11. OPTIONSThe Company had no options granted over unissued shares during or since the end of the financial year.
12. INDEMNIFICATION AND INSURANCE OF DIRECTORS AND OFFICERS
12.1 Indemnification
The Company has agreed to indemnify the following current directors of the Company; Mr S Birkbeck ,Dr J Taylor, Mr S Adams and Mr G Newman and the following former directors;, Mr RP Poernomo , Mr G Snow, Mr R Wright and Mr I Murchison, against all liabilities to another person (other than the Company or a related body corporate) that may arise from their position as directors of the Company, except where the liability arises out of conduct which involves negligence, default, breach of duty or a lack of good faith. The agreement stipulates that the Company will meet the full amount of any such liabilities, including costs and expenses.
12.2 Insurance Premiums
Since the end of the previous financial year the Company has paid insurance premiums of $18,436 (2009 - $18,370) in respect of directors’ and officers’ liability and legal expenses insurance contracts, for current and former Directors and Officers.
13. PROCEEDINGS ON BEHALF OF THE COMPANYNo person has applied under section 237 of the Corporations Act 2001 for leave of court to bring proceedings on behalf of the Company or to intervene in any proceedings to which the Company is a party for the purpose of taking responsibility on behalf of the Company for all or part of those proceedings. The Company has not been a party to any proceedings during the year.F
or p
erso
nal u
se o
nly

30 Directors’ Report
2010
Directors’ Report
14. NON-AUDIT SERVICESThe company may decide to employ the auditor on assignments additional to their statutory audit duties where the auditor’s expertise and experience with the Company and/or the Group are important. Details of the amounts paid or payable to the auditor (BDO) for audit and non-audit services provided during the year are set out below.
The Board of Directors, in accordance with advice from the audit committee, is satisfied that the provision of non-audit services during the year is compatible with general standards of independence for auditors imposed by the Corporations Act 2001. The Directors are satisfied that the services disclosed below did not compromise the external auditor independence requirements of the Corporations Act 2001. The nature of the service provided do not compromise the general principles relating to auditor independence because they relate to tax advice in relation to compliance issues and review of the tax provisions prepared by the Company. None of the services undermine the general principles relating to auditor independence as set out in APES 110 Code of Ethics for Professional Accountants.
The following fees were paid or payable for services provided by the auditor of the parent entity, its related practices and non-related audit firms during the years ended 31 December:
Consolidated
2010 2009
AUDIT SERVICES $ $
BDO Australian Firm:
Audit and review of financial reports 66,858 70,326
Related practices of BDO Australian Firm 33,404 32,147
Total remuneration for audit services 100,262 102,473
NON-AUDIT SERVICES
Other assurance services
BDO Australian Firm:
Audit of regulatory returns - -
Related practices of BDO Australian Firm - -
Total remuneration for other assurance services - -
TAXATION SERVICES
BDO Australian Firm:
Tax compliance services and advice 37,783 21,449
Related practices of BDO Australian Firm 1,607 1,947
Total remuneration for taxation services 39,390 23,396
Total remuneration for non-audit and taxation services 39,390 23,396
For
per
sona
l use
onl
y
31Directors’ Report
2010
Directors’ Report
15. AUDITORS INDEPENDENCE DECLARATION
A copy of the auditors independence declaration as required under section 307C of the Corporations Act 2001 is set out on page 32.
Signed in accordance with a resolution of the Directors
S.P Birkbeck Chairman 31 March 2011
For
per
sona
l use
onl
y

32 Auditor’s Independence Declaration
2010
Auditor’s Independence Declaration
Tel: +8 6382 4600Fax: +8 6382 4601www.bdo.com.au
38 Station StreetSubiaco, WA 6008PO Box 700 West Perth WA 6872Australia
BDO Audit (WA) Pty Ltd ABN 79 112 284 787 is a member of a national association of separate entities which are all members of BDO (Australia) Limited ACN 050 110 275, an Australian company limited by guarantee. BDO Audit (WA) Pty Ltd and BDO (Australia) Limited are members of BDO International Limited, a UK company limited by guarantee, and form a part of the international BDO network of independent member firms. Liability limited by scheme approved under Professional Standards Legislation (other than for the acts or omissions of financial services licensees) in each State or Territory other than Tasmania.
31 March 2011
The Board of Directors Atlas South Sea Pearl Limited 43 York Street SUBIACO WA 6005
DECLARATION OF INDEPENDENCE BY GLYN O’BRIEN TO THE DIRECTORS OF ATLAS SOUTH SEA PEARL LIMITED
As lead auditor of Atlas South Sea Pearl Limited for the year ended 31 December 2010, I declare that, to the best of my knowledge and belief, there have been no contraventions of:
• the auditor independence requirements of the Corporations Act 2001 in relation to the audit; and
• any applicable code of professional conduct in relation to the audit.
This declaration is in respect of Atlas South Sea Pearl Limited and the entities it controlled during the year.
Glyn O’Brien Director
BDO Audit (WA) Pty Ltd Western Australian, Perth
For
per
sona
l use
onl
y

Such has been the success of Atlas’ existing three retail stores,
Atlas launched an additional two new retail stores in Bali during
2010 in the prime locations of Nusa Dua and Kuta. Offering
quality jewellery products, a wide selection of South Sea
inspired items and an attractive shopping environment in key
locations has attracted an increased number of customers to
the stores. A sixth retail outlet is planned for Bali in 2011 and
the Company’s first retail store in Australia will be opened in the
second half of 2011.
For
per
sona
l use
onl
y

Research and development has been the cornerstone of Atlas’ achievements. A
scientific approach to pearl oyster breeding and husbandry has seen Atlas produce
quality crops consisting almost entirely of beautiful silver and white pearls.
Atlas has embarked on an ambitious long-term breeding trial with geneticists from
Australia’s James Cook University. Through developing a unique DNA pedigree, this
project will further improve our breeding lines, increasing pearl quality and yield rates.
TheplethoraofresearchanddevelopmentworkaccomplishedbyAtlasover
manyyearsisrecognizedbyscientistsaroundtheworld.Atlasresearchers
havepresentedtheirscientificfindingsatmajorinternationalconferencesin
Europe,AsiaandAustraliaandanumberofkeypublicationshaveappearedin
leadingscientificjournals.
For
per
sona
l use
onl
y

35Consolidated Statement of Comprehensive Income
2010
Consolidated Statement of Comprehensive IncomeFOR THE YEAR ENDED 31 DECEMBER 2010
2010 2009
Note $ $
Revenue from continuing operations 2 9,841,695 6,908,444
Cost of goods sold (5,138,833) (3,511,366)
Gross profit 4,702,862 3,397,078
Other income 2 4,218,594 4,239,650
Marketing expenses (622,797) (859,683)
Administration expenses 3 (3,176,472) (5,378,281)
Finance costs 3 (191,971) (148,014)
Research and development (55,280) (50,000)
Other expenses 3 (2,119,823) (8,713,329)
Profit/(Loss) before income tax 2,755,113 (7,512,579)
Income tax (expense)/benefit 4 (395,139) 329,866
Profit/(Loss) for the year from continuing operations 2,359,974 (7,182,713)
Other comprehensive income/(expenses)
Exchange differences on translation of foreign operations (892,873) (1,139,891)
Income tax relating to components of other comprehensive
income - -
Other comprehensive income/(expenses) for the year, net of tax (892,873) (1,139,891)
Total comprehensive income/(expenses) for the year 1,467,101 (8,322,604)
Profit/(loss) is attributable to:
Owners of the Company 2,359,974 (7,182,713)
Total comprehensive income/(expenses) is attributable to:
Owners of the Company 1,467,101 (8,322,604)
Overall operations :
Earnings per share for profit/(loss) from continuing operations attributable to the ordinary equity holders of the Company
Basic earnings per share (cents) 5 1.86 (6.25)
Diluted earnings per share (cents) 5 1.86 (6.25)
The accompanying notes form part of these financial statements
For
per
sona
l use
onl
y

36 Consolidated Statement of Financial Position
2010
Consolidated Statement of Financial PositionAS AT 31 DECEMBER 2010
2010 2009
Note $ $
Current assets
Cash and cash equivalents 6 998,335 2,508,711
Trade and other receivables 7 1,239,095 1,451,355
Derivative financial instruments 8 240,053 12,468
Inventories 9 6,375,746 2,675,646
Biological assets 10 5,305,465 8,800,587
Total current assets 14,158,694 15,448,767
Non-current assets
Trade and other receivables 7 173,698 162,565
Inventories 9 83,415 103,913
Biological assets 10 8,476,047 5,816,129
Property, plant and equipment 11 2,217,156 2,195,780
Deferred tax assets 14(b) 1,430,258 1,040,645
Total non-current assets 12,380,574 9,319,032
Total assets 26,539,268 24,767,799
Current liabilities
Trade and other payables 12 1,743,239 1,440,904
Borrowings 13 3,596,120 4,271,994
Derivative financial instruments 8 - -
Current tax liabilities 14(a) 42,446 680,895
Short-term provisions 15 49,057 468,035
Total current liabilities 5,430,862 6,861,828
Non-current liabilities
Trade and other payables 12 - 24,679
Deferred tax liabilities 14(a) 1,800,493 1,187,607
Long term provisions 15 - 15,281
Total non-current liabilities 1,800,493 1,227,567
Total liabilities 7,231,355 8,089,395
Net assets 19,307,913 16,678,404
Equity
Contributed equity 16 23,234,922 22,073,494
Reserves 17 (7,082,381) (6,190,488)
Retained profits/(accumulated losses) 18 3,155,372 795,398
Total equity 19,307,913 16,678,404
The accompanying notes form part of these financial statements.
For
per
sona
l use
onl
y
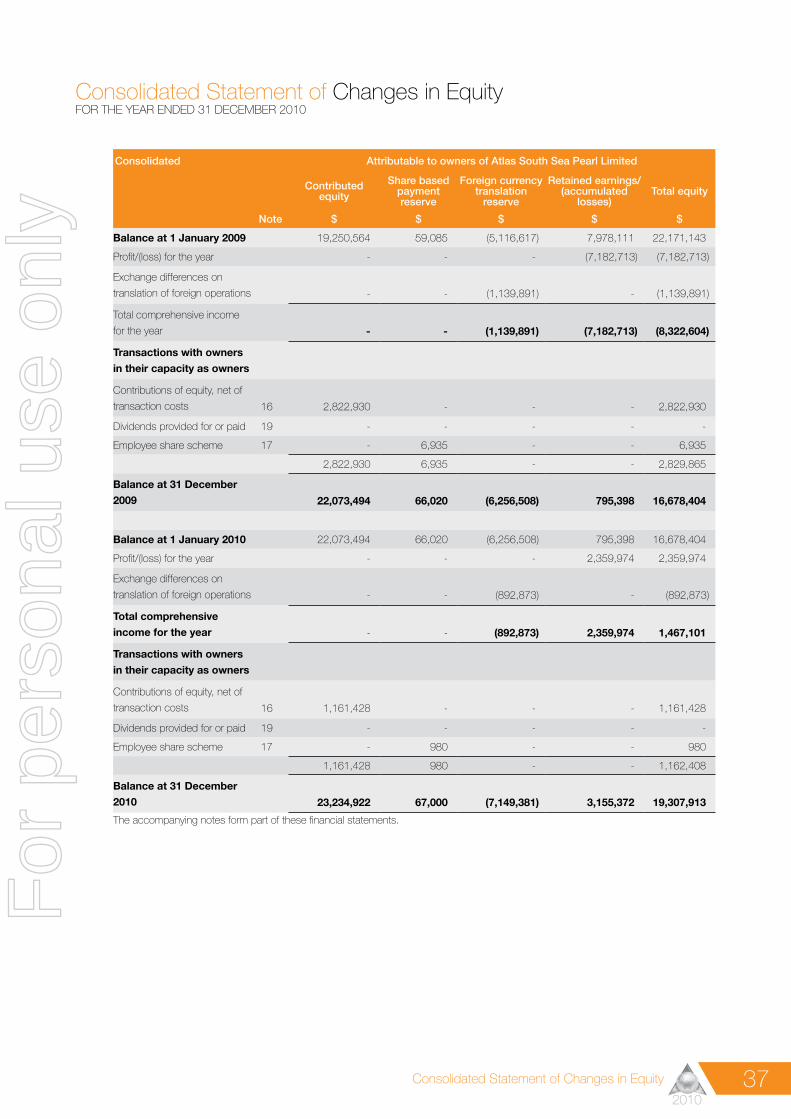
37Consolidated Statement of Changes in Equity
2010
Consolidated Statement of Changes in EquityFOR THE YEAR ENDED 31 DECEMBER 2010
Consolidated Attributable to owners of Atlas South Sea Pearl Limited
Contributed equity
Share based payment reserve
Foreign currency translation
reserve
Retained earnings/(accumulated
losses)Total equity
Note $ $ $ $ $
Balance at 1 January 2009 19,250,564 59,085 (5,116,617) 7,978,111 22,171,143
Profit/(loss) for the year - - - (7,182,713) (7,182,713)
Exchange differences on
translation of foreign operations - - (1,139,891) - (1,139,891)
Total comprehensive income
for the year - - (1,139,891) (7,182,713) (8,322,604)
Transactions with owners in their capacity as owners
Contributions of equity, net of
transaction costs 16 2,822,930 - - - 2,822,930
Dividends provided for or paid 19 - - - - -
Employee share scheme 17 - 6,935 - - 6,935
2,822,930 6,935 - - 2,829,865
Balance at 31 December 2009 22,073,494 66,020 (6,256,508) 795,398 16,678,404
Balance at 1 January 2010 22,073,494 66,020 (6,256,508) 795,398 16,678,404
Profit/(loss) for the year - - - 2,359,974 2,359,974
Exchange differences on
translation of foreign operations - - (892,873) - (892,873)
Total comprehensive income for the year - - (892,873) 2,359,974 1,467,101
Transactions with owners in their capacity as owners
Contributions of equity, net of
transaction costs 16 1,161,428 - - - 1,161,428
Dividends provided for or paid 19 - - - - -
Employee share scheme 17 - 980 - - 980
1,161,428 980 - - 1,162,408
Balance at 31 December 2010 23,234,922 67,000 (7,149,381) 3,155,372 19,307,913
The accompanying notes form part of these financial statements.
For
per
sona
l use
onl
y

38 Consolidated Statement of Cash Flows
2010
Consolidated Statement of Cash FlowsFOR THE YEAR ENDED 31 DECEMBER 2010
2010 2009
$ $
Cash flows from operating activities
Proceeds from pearl, jewellery and oyster sales 9,219,224 8,528,517
Proceeds from other operating activities 639,244 229,171
Interest paid (158,706) (112,805)
Interest received 39,004 46,093
Payments to suppliers and employees (9,233,196) (9,804,468)
Income tax( paid)/received (1,239,650) (341,729)
Net cash provided by/(used in) operating activities(Note 24.2) (734,080) (1,455,220)
Cash flows from investing activities
Acquisition of pearling operation (576,885) -
Payments for property, plant and equipment (587,284) (109,178)
Net cash provided by/(used in) investing activities (1,164,169) (109,178)
Cash flows from financing activities
Proceeds from borrowings 15,743,940 8,575,029
Repayment of borrowings (16,465,161) (7,733,109)
Proceeds from issue of shares 1,091,427 2,822,931
Repayment of loan to employees 47,250 -
Dividend payment - -
Net cash provided by/(used in) financing activities 417,456 3,664,851
Net increase/(decrease) in cash and cash equivalents (1,480,793) 2,100,453
Cash and cash equivalents at the beginning of the financial year 2,508,711 437,464
Effects of exchange rate changes on cash and cash equivalents (29,583) (29,206)
Cash and cash equivalents at the end of the financial year (Note 24.1) 998,335 2,508,711
The accompanying notes form part of these financial statements.
For
per
sona
l use
onl
y

39Notes to and Forming Part of the Consolidated Financial Statements
2010
Notes to and Forming Part of the Consolidated Financial StatementsFOR THE YEAR ENDED 31 DECEMBER 2010
1. STATEMENT OF SIGNIFICANT ACCOUNTING POLICIES
1.1 Basis of preparation
These general purpose financial statements have been prepared in accordance with Australian Accounting Standards, other authoritative pronouncements of the Australian Accounting Standards Board and the Corporations Act 2001.
The financial statements cover the consolidated entity of Atlas South Sea Pearl Ltd and its subsidiaries. Atlas South Sea Pearl Ltd is a listed public company, incorporated and domiciled in Australia.
A description of the nature of the consolidated entity’s operations and its principal activities is included in the review of operations and activities in the directors report which is not part of these financial statements.
The financial statements were authorised for issue by the directors on 31st March 2011. The directors have the power to amend and reissue the financial statements.
The principal accounting policies adopted in the preparation of these consolidated financial statements are set out below .The accounting policies have been consistently applied to all the years presented, unless otherwise stated.
The Group had to change some of its accounting policies as the result of new or revised accounting standards which became operative for the annual reporting period commencing on 1 January 2010. The affected policies and standards are:
AASB 2009-5 Amendment to Australian Accounting Standards arising from the Annual Improvements Project (AASB 5,101,107,117 and 136).
AASB 2009-8 Amendment to Australian Accounting Standards arising from the Annual Improvements Project – Group Cash-settled Share-based Payment Transactions.
The adoption of these standards did not have any impact on the current period or any prior period and is not likely to affect future periods.
The Group has not elected to early adopt any new standards or amendments.
1.2 Compliance with IFRS
The consolidated financial statements of the Atlas South Sea Pearl Limited group also comply with International Financial Reporting Standards (IFRS) as issued by the International Accounting Standards Board (IASB).
1.3 Historical Cost Convention
These financial statements have been prepared under the historical cost convention, as modified by the revaluation of available for sale financial assets, financial assets and liabilities (including derivative instruments and biological assets) at fair value through profit or loss.
1.4 Critical Accounting Estimates
The preparation of financial statements requires the use of certain critical accounting estimates. It also requires management to exercise its judgement in the process of applying the Group’s accounting policies. The areas involving a higher degree of judgement or complexity, or areas where assumptions and estimates are significant to the financial statements are disclosed in note 1.31.
1.5 Principles of consolidation
The consolidated financial statements incorporate the assets and liabilities of all subsidiaries of Atlas South Sea Pearl Limited (“Company” or “parent entity”) as at 31 December 2010 and the results of its subsidiaries for the year then ended. Atlas South Sea Pearl Ltd and its subsidiaries together are referred to in this financial statements as the consolidated entity.
Intercompany transactions, balances and unrealised gains on transactions between Group companies are eliminated. Unrealised losses are also eliminated unless the transaction provides evidence of the impairment of the asset transferred. Accounting policies of subsidiaries have been changed where necessary to ensure consistency with the policies adopted by the Group.
For
per
sona
l use
onl
y

40 Notes to and Forming Part of the Consolidated Financial Statements
2010
Notes to and Forming Part of the Consolidated Financial StatementsFOR THE YEAR ENDED 31 DECEMBER 2010
Subsidiaries are those entities over which the Group has the power to govern the financial and operating policies, generally accompanying a shareholding of more than one half of the voting rights.
Subsidiaries are fully consolidated from the date on which control is transferred to the Group. They are de-consolidated from the date that control ceases.
The acquisition method of accounting is used to account for the acquisition of subsidiaries by the Group.
1.6 Income tax
The income tax expense or revenue for the period is the tax payable on the current period’s taxable income based on the applicable tax rate for each jurisdiction adjusted by changes in deferred tax assets and liabilities attributable to temporary differences and to unused tax losses.
The current income tax charge is calculated on the basis of the tax laws enacted or substantively enacted at the end of the reporting period in the countries where the company’s subsidiaries operate and generate taxable income. It establishes provisions where appropriate on the basis of amounts expected to be paid to the tax authorities.
Deferred income tax is provided in full, using the liability method, on temporary differences arising between the tax bases of assets and liabilities and their carrying amounts in the consolidated financial statements. However, the deferred income tax is not accounted for if it arises from initial recognition of an asset or liability in a transaction other than a business combination that at the time of the transaction affects neither accounting nor taxable profit or loss. Deferred income tax is determined using tax rates (and laws) that have been enacted or substantially enacted by the reporting date and are expected to apply when the related deferred income tax asset is realised or the deferred income tax liability is settled.
Deferred tax is credited in the statement of comprehensive income except where it relates to items that may be credited directly to equity, in which case the deferred tax is adjusted directly against equity.
Deferred tax assets are recognised for deductible temporary differences and unused tax losses only to the extent that it is probable that future taxable amounts will be available to utilise those temporary differences and losses.
Deferred tax liabilities and assets are offset when there is a legally enforceable right to offset current tax assets and liabilities and when the deferred tax balances relate to the same taxation authority. Current tax assets and liabilities are offset where the entity has a legally enforceable right to offset and intends either to settle on a net basis, or to realise the asset and settle the liability simultaneously.
1.7 Inventories
(a) Pearls – The cost of pearls grown by the Group is the fair value less estimated point of sale costs at the time the pearls are harvested.
(b) Nuclei - quantities on hand at the year end are valued at the lower of cost and net realisable value.
(c) Oysters – refer note 1.8
(d) Other inventories – including jewellery, fuel, mechanical parts and farm spares at the period end are valued at the lower of cost and net realisable value.
Net realisable value is the estimated selling price in the ordinary course of business less the estimated costs necessary to make the sale.
1.8 Biological Assets
Oysters are measured at their fair value less estimated point of sale costs. The fair value of oysters is determined by using the present value of expected net cash flows from the oysters, discounted using a pre-tax market determined rate.
Changes in fair value less estimated point of sale costs of oysters are recognised in the statement of comprehensive income in the year they arise.
Pearls are initially measured at their fair value less estimated point of sale costs at the time of harvest. The fair value of pearls is determined by reference to market prices for pearls at the time of harvest.
The gain on initial recognition of pearls is recognised in the statement of comprehensive income in the year of harvest. At the time of harvest, pearls are recorded as inventory. The details of the Biological assets that are held by the economic entity as at 31 December are provided at Note 10.
For
per
sona
l use
onl
y

41Notes to and Forming Part of the Consolidated Financial Statements
2010
Notes to and Forming Part of the Consolidated Financial StatementsFOR THE YEAR ENDED 31 DECEMBER 2010
1.9 Property, Plant & Equipment
Each class of property, plant & equipment is stated at historical cost less, where applicable, any accumulated depreciation and impairment losses.
Property
Freehold land and buildings are shown at their fair value (being the amount for which an asset could be exchanged between knowledgeable willing parties in an arms length transaction), based on periodic valuations by external independent valuers, less subsequent depreciation for buildings.
Leasehold property is shown at cost and amortised over the shorter of the term of the unexpired lease on the property or the estimated useful life of the improvements on the property.
Plant and Equipment
Plant and equipment are measured on the cost basis less depreciation and impairment losses.
The carrying value of plant and equipment and their useful lives are reviewed annually by Directors to ensure it is not in excess of the recoverable amount of these assets which is assessed on the basis of the expected net cash flows that will be received from the assets employed and subsequent disposal.
The cost of fixed assets constructed within the economic entity includes the cost of materials and direct labour. Repairs and maintenance carried out on the assets are expensed unless there is a future economic benefit that will flow to the Group which can be reliably measured, in which case the value of the asset is increased.
Gains and losses on disposals are determined by comparing proceeds with carrying amount. These are included in the statement of comprehensive income.
Depreciation
Depreciation on property, plant and equipment is calculated on a straight line basis so as to write off the cost or valuation of property, plant and equipment over their estimated useful lives commencing from the time the asset is held ready for use.
The depreciation rates used for each class of depreciable assets are:
Class of fixed asset Depreciation rate
2010 2009
Leasehold land & buildings & improvements 5-10% 5-10%
Vessels 10% 10%
Plant & equipment 20-50% 20-50%
1.10 Investments and Other Financial Assets
The Group classifies its investments in the following categories: financial assets at fair value through profit or loss, loans and receivables, held-to-maturity investments, and available-for-sale financial assets. The classification depends on the purpose for which the investments were acquired. Management determines the classification of its investments at initial recognition and re-evaluates this designation at each reporting date.
(a) Financialassetsatfairvaluethroughprofitorloss
Financial assets at fair value through profit or loss are financial assets held for trading. A financial asset is classified in this category if acquired principally for the purpose of selling in the short term. Derivatives are classified as held for trading unless they are designated as hedges. Assets in this category are classified as current assets. Realised and unrealised gains and losses arising from changes in the fair value of these assets are included in the statement of comprehensive income in the period in which they arise.
(b) Loans and receivables
Loans and receivables are non derivative financial assets with fixed or determinable payments that are not quoted in an active market. They are included in current assets, except for those with maturities greater than 12 months after the balance sheet date which are classified as non-current assets. Loans and receivables are included in receivables in the statement of financial position.
For
per
sona
l use
onl
y

42 Notes to and Forming Part of the Consolidated Financial Statements
2010
Notes to and Forming Part of the Consolidated Financial StatementsFOR THE YEAR ENDED 31 DECEMBER 2010
(c) Held-to-maturity investments
Held-to-maturity investments are non-derivative financial assets with fixed or determinable payments and fixed maturities that the Group’s management has the intention and ability to hold to maturity.
(d) Available-for-salefinancialassets
Available-for-sale financial assets, comprising principally marketable equity securities, are non-derivatives that are either designated in this category or not classified in any of the other categories. They are included in non-current assets unless management intends to dispose of the investment within 12 months of the reporting date. Unrealised gains and losses arising from changes in fair value are taken directly to equity. Investments are designated as available-for-sale if they do not have fixed maturities and fixed or determinable payments and management intends to hold them for the medium to long term.
(e) Recognition and derecognition
Regular purchases and sales of financial assets are recognised on trade-date, the date on which the Group commits to purchase or sell the asset. Investments are initially recognised at fair value plus transaction costs for all financial assets not carried at fair value through profit or loss. Financial assets carried at fair value through profit or loss are initially recognised at fair value and transaction costs are expensed in the statement of comprehensive income. Financial assets are derecognised when the rights to receive cash flows from the financial assets have expired or have been transferred and the economic entity has transferred substantially all the risks and rewards of ownership.
(f) Measurement
At initial recognition, the group measures a financial asset at its fair value plus, in the case of a financial asset not at fair value through profit or loss, transaction costs that are directly attributable to the acquisition of the financial asset. Transaction costs of financial assets carried at fair value through profit or loss are expensed in the profit or loss.
Loans and receivables and held-to-maturity investments are carried at amortised cost using the effective interest rate method.
Available-for-sale financial assets and financial assets at fair value through profit and loss are subsequently carried at fair value. Gains or losses arising from changes in the fair value of the financial assets at fair value through profit or loss category are presented in the statement of comprehensive income within other income or other expenses in the period in which they arise.
(g) Impairment
The Group assesses at each reporting date whether there is objective evidence that a financial asset or group of financial assets is impaired. In the case of equity securities classified as available-for –sale, a significant or prolonged decline in the fair value of a security below its cost is considered as an indicator that the securities are impaired. A financial asset or a group of financial assets is impaired and impairment losses are incurred only if there is objective evidence of impairment as a result of one or more events that occurred after the initial recognition of the asset ( a ‘loss’ event) and that loss event (or events) has an impact on the estimated future cash flows of the financial asset or group of financial assets that can be reliably estimated.
If there is evidence of impairment for any of the Group’s financial assets carried at amortised cost, the loss is measured as the difference between the asset’s carrying amount and the present value of estimated future cash flows. The cash flows are discounted at the financial asset’s original effective interest rate. The loss is recognised in the statement of comprehensive income.
If, in a subsequent period, the amount of the impairment loss decreases and the decrease can be related objectively to an event occurring after the impairment was recognised, the reversal of the previously recognised impairment loss is recognised in the consolidated income statement.
1.11 Derivative instruments
Derivative instruments are initially measured at fair value on the date a derivative contract is entered into and are subsequently remeasured to their fair value at each reporting date. Gains and losses arising from changes in fair value are taken to the statement of comprehensive income.
For
per
sona
l use
onl
y

43Notes to and Forming Part of the Consolidated Financial Statements
2010
Notes to and Forming Part of the Consolidated Financial StatementsFOR THE YEAR ENDED 31 DECEMBER 2010
1.12 Impairment of assets
Other assets are tested for impairment whenever events or changes in circumstances indicate that the carrying amount may not be recoverable. An impairment loss is recognised for the amount by which the assets carrying amount exceeds its recoverable amount. The recoverable amount is the higher of an asset’s fair value less costs to sell and value in use. Non financial assets other than goodwill that suffered an impairment are reviewed for possible reversal of the impairment at each reporting date.
1.13 Foreign Currency Translation
(a) Functional and presentation currency
Items included in the financial statements of each of the subsidiaries within the Group’s entities are measured using the currency of the primary economic environment in which the entity operates (“the functional currency”). The consolidated financial statements are presented in Australian dollars, which is Atlas South Sea Pearl Ltd’s functional and presentation currency.
(b) Transactions and balances
Foreign currency transactions are translated into the functional currency using the exchange rates prevailing at the date of the transactions. Foreign exchange gains and losses resulting from the settlement of such transactions and from the translation at year end exchange rates of monetary assets and liabilities denominated in foreign currencies are recognised in the statement of comprehensive income, except when they are deferred in equity as qualifying cash flow hedges and qualifying net investment hedges or are attributable to part of the net investment in a foreign operation.
Translation differences on assets and liabilities carried at fair value are reported as part of the fair value gain or loss. Translation differences on non-monetary assets and liabilities such as equities held at fair value through profit or loss are recognised in profit or loss as part of the fair value gain or loss. Translation differences on non-monetary assets such as equities classified as available for sale financial assets are included in the fair value reserve in equity.
All foreign exchange gains and losses are presented in the income statement within other income or other expenses unless they relate to financial instruments.
(c) Group Companies
The results and financial position of all group entities (none of which has the currency of a hyperinflation economy) that have a functional currency different from the presentation currency are translated into the presentation currency as follows:
1. Assets and liabilities for each statement of financial position presented are translated at the closing rate at the date of that statement of financial position;
2. Income and expenses for each statement of comprehensive income are translated at average exchange rates;
3. and all resulting exchange differences are recognised as a separate component of equity.
On consolidation, exchange differences arising from the translation of any net investment in foreign entities, and of borrowings and other currency instruments designated as hedges of such investments, are taken to shareholders’ equity. When a foreign operation is sold or borrowings are repaid, a proportional share of such exchange differences are recognised in the statement of comprehensive income as part of the gain or loss on sale.
1.14 Employee Benefits
Wages and salaries, annual leave, sick leave and long service leave
Provision is made for the Group’s liability for employee entitlements arising from services rendered by employees to reporting date. Employee entitlements expected to be settled within one year together with entitlements arising from wages and salaries, annual leave and sick leave which will be settled after one year have been measured at their nominal amount. Other employee entitlements payable later than one year have been measured at the present value of the estimated future cash outflows to be made for those entitlements. Liabilities due to be paid within 12 months of the reporting date are recognised in other payables. The liability for long service leave is recognised in the provision for employee benefits.
For
per
sona
l use
onl
y
44 Notes to and Forming Part of the Consolidated Financial Statements
2010
Notes to and Forming Part of the Consolidated Financial StatementsFOR THE YEAR ENDED 31 DECEMBER 2010
Contributions are made by the Group to employee superannuation funds and are charged as expenses when incurred.
Share-based payments
Share-based compensation benefits are provided to employees via the Atlas South Sea Pearl Limited Employee Share Plan. Information relating to this scheme is set out in note 23.
The fair value of shares granted under the Employee Share Plan is recognised as an employee expense with a corresponding increase in equity. The fair value is measured at grant date and recognised over the period during which the employee becomes unconditionally entitled to the shares.
The fair value at grant date is considered to be the current share price on the date of granting.
1.15 Provisions
Provisions for legal claims, service warranties and make good obligations are recognised when the group has a present legal or constructive obligation as a result of a past event; it is more likely than not that an outflow of resources will be required to settle the obligation; and the amount has been reliably estimated.
1.16 Cash and cash equivalents
Cash and cash equivalents includes cash on hand, deposits held at call with financial institutions, other short-term, high liquid investments with original maturity or three months or less that are readily convertible to known amounts of cash and which are subject to an insignificant risk of change in value, and bank overdrafts.
1.17 Revenue recognition
Revenue is measured at the fair value of the consideration received or receivable. Amounts disclosed as revenue are net of returns, trade allowances, rebates and amounts collected on behalf of third parties.
Revenue is recognised to the extent that it is probable that the economic benefits will flow to the entity and the revenue can be reliably measured. The following specific recognition criteria must also be met before revenue is recognised:
(a) Sales Revenue comprises of revenue earned from the sale of products or services to entities outside the economic entity. Sales revenue is recognised when the goods are provided or when the fee in respect of services provided is receivable.
(b) Interest Income is recognised as it accrues.
(c) Asset Sales Revenue comprises of the gross proceeds of the assets. The profit and loss on disposal of assets is brought to account at the date on which an unconditional contract is signed.
1.18 Leases
Lease payments for operating leases, where substantially all the risk and benefits remain with the lessor, are charged as expenses in the period in which they are incurred.
1.19 Trade receivables
Trade receivables are recognised initially at fair value and subsequently measured at amortised cost using the effective interest method, less provision for impairment. All trade receivables are generally due for settlement within 30 days.
Collectibility of trade receivables is reviewed on an ongoing basis. Debts which are known to be uncollectible are written off by reducing the carrying amount directly. An allowance account – provision for impairment of trade receivables, is used when there is objective evidence that the Group will not be able to collect all amounts due according to the original terms of the receivables.
Significant financial difficulties of the debtor, financial reorganisation, and default and delinquency in payments, more than 30 days overdue, are considered indicators that the trade receivable is impaired. The Group also considers the long term history of the debtor. The amount of the impairment allowance is the difference between the assets carrying amount and the present value of estimated future cash flows, discounted at the effective interest rate. Cash flows relating to short term receivables are not discounted if the effect of discounting is immaterial.
For
per
sona
l use
onl
y

45Notes to and Forming Part of the Consolidated Financial Statements
2010
Notes to and Forming Part of the Consolidated Financial StatementsFOR THE YEAR ENDED 31 DECEMBER 2010
The amount of the impairment loss is recognised in the statement of comprehensive income within other expenses. When a trade receivable for which an impairment allowance had been recognised becomes uncollectible in a subsequent period, it is written off against the allowance account. Subsequent recoveries of amounts previously written off are credited against other expenses in the statement of comprehensive income.
1.20 Trade and other payables
These amounts represent liabilities for goods and services provided to the group prior to the end of financial year which are unpaid. The amounts are unsecured and are usually paid within 30 days of recognition.
1.21 Borrowings
Borrowings are initially recognised at fair value, net of transaction costs incurred. Borrowings are subsequently measured at amortised cost. Any difference between the proceeds and the redemption amount is recognised in the statement of comprehensive income over the period of the borrowings using the effective interest rate method. Fees paid on the establishment of loan facilities , which are not an incremental cost relating to the actual draw down of the facility, are recognised in the statement of comprehensive income.
Borrowings are removed from the statement of financial position when the obligation specified in the contract is discharged, cancelled or expired.
Borrowings are classified as current liabilities unless the Group has an unconditional right to defer settlement of the liability for at least 12 months after the reporting date.
1.22 Borrowing costs
Borrowing costs incurred for the construction of any qualifying asset are capitalised during the period of time that is required to complete and prepare the asset for its intended use or sale. Other borrowing costs are expensed.
1.23 Contributed Equity
Ordinary share capital is recognised at the fair value of the consideration received by the Company and recognised in equity.
Any transaction costs arising on the issue of ordinary shares are recognised directly in equity as a reduction of the share proceeds received.
1.24 Dividends
Provision is made for the amount of any dividend declared, being appropriately authorised and no longer at the discretion of the entity, on or before the end of the year but not distributed at reporting date.
1.25 Goods and Service Tax (GST)
Revenues, expenses and assets are recognised net of the amount of GST except where the GST incurred on a purchase of goods & services is not recoverable from the taxation authority, in which case the GST is recognised as part of the cost of acquisition of the asset or as part of the expense item as applicable; and where receivables and payables are stated with the amount of GST included.
The net amount of GST recoverable from, or payable to, the taxation authority is included as part of receivables in the statement of financial position.
Cash flows are included in the statement of cashflows on a gross basis and the GST component of cash flows arising from investing and financing activities, which is recoverable from, or payable to, the taxation authority are classified as operating cash flows.
Commitments and contingencies are disclosed net of the amount of GST recoverable from, or payable to, the taxation authority.F
or p
erso
nal u
se o
nly

46 Notes to and Forming Part of the Consolidated Financial Statements
2010
Notes to and Forming Part of the Consolidated Financial StatementsFOR THE YEAR ENDED 31 DECEMBER 2010
1.26 Earnings Per Share
(a) Basic earnings per share
Basic earnings per share is determined by dividing net profit after income tax attributable to members of the Company, excluding any costs of servicing equity other than ordinary shares, by the weighted average number of ordinary shares outstanding during the financial year, adjusted for bonus elements in ordinary shares issued during the year.
(b) Diluted earnings per share
Diluted earnings per share adjusts the figure used in determination of basic earnings per share to take into account the after income tax effect of interest and other financial costs associated with dilutive potential ordinary shares and the weighted average number of shares assumed to have been issued for no consideration in relation to dilutive potential ordinary shares.
1.27 Segment Reporting
The Group has identified its operating segments based on internal reports that are reviewed and used by the board of Directors and management team (the chief operating decision makers) in assessing performance and in determining the allocation of resources.
The operating segments are identified by management based on the manner in which the product is sold, whether retail or wholesale. Management also considers the business from a geographical perspective and has identified four reportable segments. Discrete financial information about each of these operating businesses is reported to the board of Directors and management team on at least a monthly basis.
The wholesale business is a producer and supplier of pearls within the wholesale market. The retail business is the manufacture and sale of pearl jewellery and related products within the retail market.
The accounting policies used by the Group in reporting segments are the same as those contained in note 1 to the accounts and in the prior period except as detailed below:
Inter-entity sales Inter-entity sales are recognised based on an internally set transfer price. These transactions are eliminated within the internal reports. The revenue from external parties reported to the chief operating decision maker is measured in a manner consistent with that in the statement of comprehensive income.
Biological assets and pearl inventories These are recognised at cost within the internal reports.
It is the Group’s policy that if items of revenue and expense are not allocated to operating segments then any associated assets and liabilities are also not allocated to segments. This is to avoid asymmetrical allocations within segments which management believe would be inconsistent.
1.28 Comparative Figures
When required by Accounting Standards, comparative figures have been adjusted to conform to changes in presentation for the current financial year.
1.29 Business combinations
The acquisition method of accounting is used to account for all business combinations, regardless of whether equity instruments or other assets are acquired. The consideration transferred for the acquisition of a subsidiary comprises the fair values of the assets transferred, the liabilities incurred and the equity interests issued by the group. The consideration transferred also includes the fair value of any asset or liability resulting from a contingent consideration arrangement and the fair value of any pre-existing equity interest in the subsidiary. Acquisition related costs are expensed as incurred. Identifiable assets acquired and liabilities and contingent liabilities assumed in a business combination are, with limited exceptions, measured initially at their fair values at the acquisition date. On an acquisition by acquisition basis, the group recognises any non – controlling interest in the acquiree either at fair value or at the non-controlling interest’s proportionate share of the acquiree’s net identifiable assets.
For
per
sona
l use
onl
y

47Notes to and Forming Part of the Consolidated Financial Statements
2010
Notes to and Forming Part of the Consolidated Financial StatementsFOR THE YEAR ENDED 31 DECEMBER 2010
The excess of the consideration transferred, the amount of any non-controlling interest in the acquiree and the acquisition date fair value of any previous equity interest in the acquiree over the fair value of the group’s share of the net identifiable assets acquired is recorded as goodwill. If those amounts are less than the fair value of the net identifiable assets of the subsidiary acquired and the measurements of all amounts have been reviewed, the difference is recognised directly in profit and loss as a bargain purchase.
1.30 Parent entity financial information
The financial information for the parent entity, Atlas South Sea Pearl Limited, disclosed in note 31 has been prepared on the same basis as the consolidated financial statements, except as set out below:
(i) Investments in subsidiaries
Investments in subsidiaries are accounted for at cost in the financial statements of Atlas South Sea Pearl Limited
(ii) Share-based payments
The grant by the company of ordinary shares to the employees of subsidiary undertakings in the group is treated as a capital contribution to that subsidiary undertaking. The fair value of employee services received, measured by reference to the grant date fair value , is recognised over the vesting period as an increase to investment in subsidiary undertakings, with a corresponding credit to equity.
1.31 Critical accounting estimates and judgments
The resulting accounting estimates will, by definition, seldom equal the related actual results. The estimates and assumptions that have a significant risk of causing a material adjustment to the carrying amounts of assets and liabilities within the next financial year are discussed below.
The directors evaluate estimates and judgements incorporated into the financial report based on historical knowledge and best available current information. Estimates assume a reasonable expectation of future events and are based on current trends and economic data, obtained both externally and within the Group.
Key estimates – Impairment
The group assesses impairment at each reporting date by evaluating conditions specific to the group that may lead to impairment of assets. Where an impairment trigger exists, the recoverable amount of the asset is determined. Value-in-use calculations performed in assessing recoverable amounts incorporate a number of key estimates.
Critical judgements in applying the entity’s accounting policies
– Doubtful debts provision
No provision has been recognised in respect of receivables owed to the group for the year ended 31 December 2010 or 2009.
–Impairmentoffinancialassets
In the 2009 and 2010 financial statements, the group made a significant judgment about the impairment of a number of its financial assets included within other receivables. These relate to loans to employees issued under the employee share plan .The shares issued to employees under the plan are held in trust until the loans are repaid in full. The group follows the guidance within AASB 139 Financial Instruments: Recognition and Measurement on determining when the financial assets are impaired. This determination requires significant judgement, the group evaluates, among other factors, the duration and extent to which the fair value of an investment is less than its cost. An impairment loss of $65,875 (2009:$84,875) has been expensed in the Statement of Comprehensive Income in the year.
– Impairment of biological assets
In the 2009 financial statements, the group made a significant judgement about the impairment of its biological assets. The group undertook an impairment review in relation to juvenile oysters as a result of unexpected mortalities in the month of December 2008 caused by environmental factors. The total impairment loss expensed in the Statement of Comprehensive Income in the 2009 financial year was $447,445. There was no impairment recognised in the 2010 financial year.
For
per
sona
l use
onl
y

48 Notes to and Forming Part of the Consolidated Financial Statements
2010
Notes to and Forming Part of the Consolidated Financial StatementsFOR THE YEAR ENDED 31 DECEMBER 2010
– Impairment of pearl inventories
In the 2009 financial statements, the group made a significant judgement about the impairment of its pearl inventory after taking into account the sales achieved in the beginning of the 2010 financial year. The impairment reflected the actual sales prices achieved on the stock held as at 31 December 2009. The total impairment loss expensed in the Statement of Comprehensive Income in the 2009 financial year was $522,042. In 2010 the group made a significant judgement about the impairment of its lower grade pearl inventory on hand at 31 December 2010 – an impairment provision was made for $224,087 in the Statement of Comprehensive Income in the year.
– Determination of net market value of inventories and biological assets
Agricultural assets include pearl oysters, both seeded and unseeded and pearls that have been harvested from the oysters which remain unsold. Seeded oysters are measured at their fair value using the net present value of expected future net cash flows attributed to this inventory less the estimated point of sale costs. The fair value of unseeded oysters is determined by reference to market prices for this type of asset in Indonesia. Pearls are measured at their fair value less estimated point of sale costs by reference to market prices for pearls.
Key assumptions that have been used to determine the fair market value of the oysters in 2010 are as follows:
2010 2009
Average selling price for pearls1 ¥6,600 per momme ¥6,600 per momme
¥ exchange rate ¥82.83:AUD1.00 ¥82.35:AUD1.00
Average pearl size 0.67 momme 0.67 momme
Proportion of market grade pearls 70% 70%
Discount rate applied to cash flow 20% 20%
Mortality & Rejection rates Historical comparison Historical comparison
Average unseeded oyster value2 $1.89 $2.80
1. Average pearl prices are based on historical averages discounted for potential market volatility2. The average value of unseeded oysters has decreased due to the higher portion of smaller juvenile
oysters compared to the overall unseeded quantity in 2010.
Biological assets are valued using estimated future yen rates. Biological assets recognised as current assets on the balance sheet represent the estimated value of the pearls to be harvested within the next 12 months. The yen rate used is based on the estimated yen rates for the next 18 months from Commonwealth Bank of Australia.
For
per
sona
l use
onl
y

49Notes to and Forming Part of the Consolidated Financial Statements
2010
Notes to and Forming Part of the Consolidated Financial StatementsFOR THE YEAR ENDED 31 DECEMBER 2010
2. REVENUE FROM CONTINUING OPERATIONS
2010 2009
$ $
Sales revenue
Sale of goods 9,544,904 6,762,305
Other revenue
Interest income 38,383 51,741
Other revenues 258,408 94,398
Revenue 9,841,695 6,908,444
Change in net market value of biological assets
Change in fair value less point of sale costs of oysters 331,297 -
Gain arising on initial recognition of harvested pearls 2,387,567 -
2,718,864 -
Other income
Foreign exchange gains 1,160,827 1,268,163
Gain on foreign currency derivatives not qualifying as hedges 287,853 2,971,487
Gain on bargain purchase of pearling operation 51,050 -
Other income 4,218,594 4,239,650
For
per
sona
l use
onl
y

50 Notes to and Forming Part of the Consolidated Financial Statements
2010
Notes to and Forming Part of the Consolidated Financial StatementsFOR THE YEAR ENDED 31 DECEMBER 2010
3. PROFIT/(LOSS) BEFORE INCOME TAX INCLUDES THE FOLLOWING SPECIFIC ITEMS
2010 2009
$ $
Administration expenses from ordinary activities
Salaries and wages 1,640,534 1,466,874
Depreciation property, plant and equipment 53,849 74,284
Loss on sale of property, plant and equipment - -
Loss on foreign currency derivatives not qualifying as hedges 87,665 1,261,416
Share based payment to employees 980 76,935
Operating lease rental costs 192,046 138,071
Provision for tax penalties - 400,656
Indirect taxes (previous years) - 428,917
Compliance and finance 478,849 315,624
Other 722,549 1,215,504
3,176,472 5,378,281
Other expenses
Foreign exchange loss 1,772,854 934,779
Provision for employee entitlements 57,007 45,479
Change in net market value of biological assets
Change in fair value less point of sale costs of oysters - 3,334,317
Loss arising on initial recognition of harvested pearls - 3,344,392
Impairment losses – financial assets
Other receivables (refer note 7) 65,875 84,875
Impairment of other assets - 447,445
Biological assets (refer note 10) 224,087 522,042
Pearl Inventories (refer note 9) 2,119,823 8,713,329
Finance costs
Interest and finance charges payable 191,971 148,014
191,971 148,014
Net loss on foreign currency derivatives not qualifying as hedges 200,188 1,710,071
For
per
sona
l use
onl
y

51Notes to and Forming Part of the Consolidated Financial Statements
2010
Notes to and Forming Part of the Consolidated Financial StatementsFOR THE YEAR ENDED 31 DECEMBER 2010
4. INCOME TAX EXPENSE
2010 2009
$ $
a) The components of tax expense/(benefit) comprise:
Current tax 171,866 1,587,490
Deferred tax 223,273 (1,917,356)
395,139 (329,866)
b) Deferred income tax (revenue) expense included in income tax expense comprises:
Decrease(increase) in deferred tax assets (note 14) (389,613) 137,395
(Decrease)increase in deferred tax liabilities (note 14) 612,886 (2,054,751)
223,273 (1,917,356)
c) Numerical reconciliation of income tax expense to prima facie tax payable:
Profit/(loss) before income tax expense 2,755,113 (7,512,579)
Tax at the Australian tax rate of 30%
Tax effect of amounts which are not deductible in calculating taxable income: 826,534 (2,253,774)
Non deductible expenses (37,377) 456,862
Tax losses not brought to account 2,717 3,950
Sundry items (5,183) (4,983)
Permanent Differences (Indonesia) (398,377) 226,409
Previously unrecognised tax losses used to reduce current tax expense - -
Difference in overseas tax rates (29,037) (821)
Income tax under/(over) provided in prior years 35,863 1,242,491
Income tax expense/(benefit) 395,139 (329,866)
Weighted average effective tax rates 16.7% N/A
Refer note 22 regarding income tax under/(over) provided for prior years for details in relation to double taxation relating to 2007 fiscal period.
In 2010 the effective tax rate for the consolidated entity has been affected by the corporation tax rate in Indonesia which has been reduced to 25% for the 2010 financial year, from 28% in 2009 and 30% previously. The rate has also been affected by the tax losses in Atlas recognised as deferred tax assets in the year.
For
per
sona
l use
onl
y
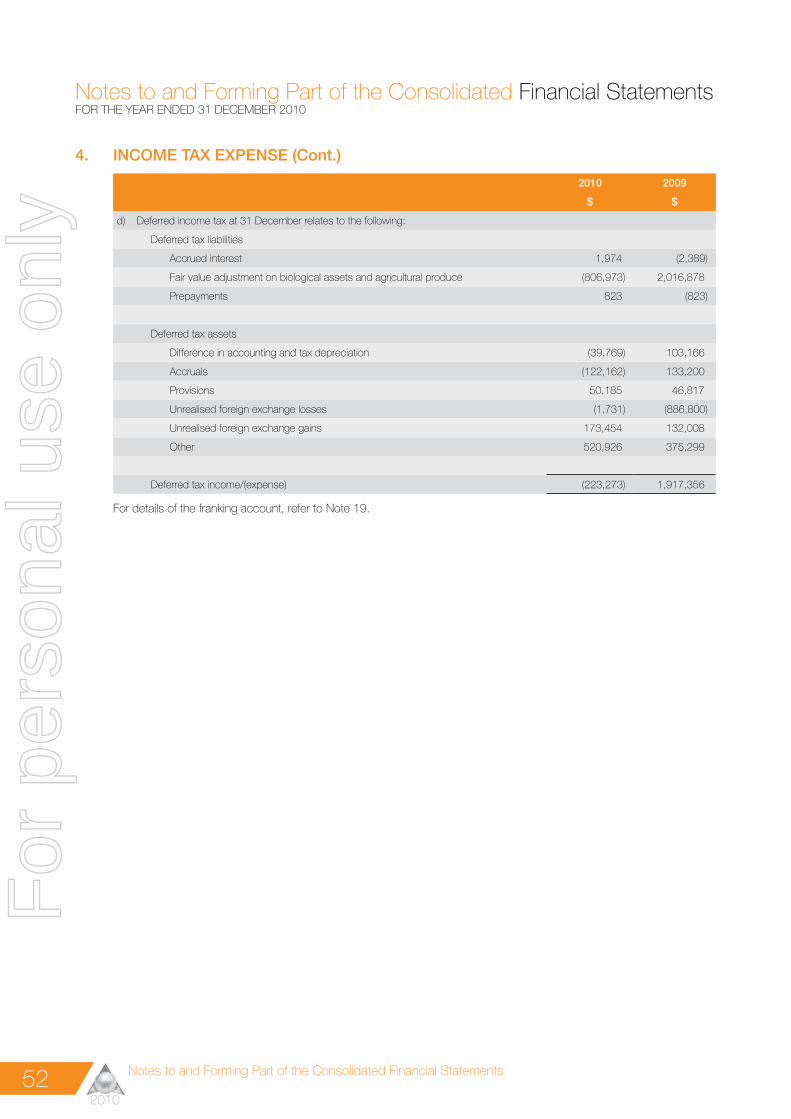
52 Notes to and Forming Part of the Consolidated Financial Statements
2010
Notes to and Forming Part of the Consolidated Financial StatementsFOR THE YEAR ENDED 31 DECEMBER 2010
4. INCOME TAX EXPENSE (Cont.)
2010 2009
$ $
d) Deferred income tax at 31 December relates to the following:
Deferred tax liabilities
Accrued interest 1,974 (2,389)
Fair value adjustment on biological assets and agricultural produce (806,973) 2,016,878
Prepayments 823 (823)
Deferred tax assets
Difference in accounting and tax depreciation (39,769) 103,166
Accruals (122,162) 133,200
Provisions 50,185 46,817
Unrealised foreign exchange losses (1,731) (886,800)
Unrealised foreign exchange gains 173,454 132,008
Other 520,926 375,299
Deferred tax income/(expense) (223,273) 1,917,356
For details of the franking account, refer to Note 19.
For
per
sona
l use
onl
y

53Notes to and Forming Part of the Consolidated Financial Statements
2010
Notes to and Forming Part of the Consolidated Financial StatementsFOR THE YEAR ENDED 31 DECEMBER 2010
5. EARNINGS /(LOSS)PER SHARE
2010 2009
$ $
Basic earnings /(loss)per share (cents per share) 0.0186 (0.0625)
Diluted earnings/(loss) per share (cents per share) 0.0186 (0.0625)
2010 2009
$ $
Earnings reconciliation
Net profit/(loss) used for basic earnings 2,359,974 (7,182,713)
After tax effect of dilutive securities - -
Diluted earnings/(loss) 2,359,974 (7,182,713)
Weighted average number of ordinary shares outstanding during the year used for calculation
of basic earnings per share 127,186,864 114,837,084
Weighted average number of potential ordinary shares outstanding during the year used for
calculation of diluted earnings per share 127,186,864 114,837,084
Diluted earnings per share is calculated after taking into consideration all options and any other securities that were on issue that remain unconverted at 31 December as potential ordinary shares which may have a dilutive effect on the profit of the Consolidated Group. There were no options or other equities on issue that would create a dilutive effect as at 31 December.
Ordinary shares issued to employees are included in the weighted average number of potential ordinary shares. They do not have a dilutive effect on earnings as they are already issued.
6. CASH AND CASH EQUIVALENTS
2010 2009
$ $
Cash at bank 998,335 2,508,711
998,335 2,508,711
Interest rate risk exposure
The Group’s exposure to interest rate risk is disclosed in note 32. The maximum exposure to credit risk at the reporting date is the carrying amount of each class of cash and cash equivalents mentioned above.
For
per
sona
l use
onl
y

54 Notes to and Forming Part of the Consolidated Financial Statements
2010
Notes to and Forming Part of the Consolidated Financial StatementsFOR THE YEAR ENDED 31 DECEMBER 2010
7. TRADE & OTHER RECEIVABLES
2010 2009
$ $
CURRENT
Trade receivables 170,280 629,585
Income tax receivable 73,224 198,653
Sundry debtors & prepayments 995,591 643,492
Impairment of sundry debtors - (88,375)
Loans to key management personnel and employees - 68,000
1,239,095 1,451,355
NON-CURRENT
Loans to key management personnel and employees 412,198 396,565
Impairment of employee loans (238,500) (234,000)
173,698 162,565
Details regarding loans to employees and key management personnel are set out in note 25.
(a) Impaired trade receivables
There were no impaired trade receivables for the group in 2010 or 2009.
(b) Impaired other receivables
As at 31 December 2010 current other receivables of the group with a value of $238,500 (2009: $322,375) were impaired. The receivables relate to debtors secured on shares of which the fair value is substantially lower than cost as at 31 December 2010. The ageing of these receivables is all due in more than 12 months. The impairment expense of $65,875 (2009:$84,875) for the period has been expensed within other expenses in the Statement of Comprehensive Income for the year.
For
per
sona
l use
onl
y

55Notes to and Forming Part of the Consolidated Financial Statements
2010
Notes to and Forming Part of the Consolidated Financial StatementsFOR THE YEAR ENDED 31 DECEMBER 2010
7. TRADE & OTHER RECEIVABLES (Cont.)Movements in the provision for impairment of other receivables are as follows:
2010 2009
$ $
As at 1 January 322,375 237,500
Provision for impairment recognised during the year 65,875 84,875
Receivables written off during the year as uncollectable (149,750) -
Unused amount reversed - -
238,500 322,375
(c) Past due but not impaired
As at 31 December 2010, trade receivables of $150,981, (2009:$429,609) were past due but not impaired in the Group. Within the Group these relate to a small number of independent customers for whom there is no recent history of default. Given the past history with this customer no impairment has been recognised in the financial period. The trade terms for Pearlautore have been extended as part of the finalisation of the marketing contract which was not renewed after 31 December 2009.The carrying value of these renegotiated receivables at 31 December 2010 was $149,564. This debt has been paid post year end. The ageing analysis of these trade receivables is as follows:
2010 2009
$ $
Up to one month - 91,374
2-3 months - 268,400
3 months and above 150,981 69,835
150,981 429,609
The other classes within trade and other receivables do not contain impaired assets other than those disclosed and are not past due. Based on the credit history of these other classes, and also that a majority is due from current employees, it is expected that these amounts will be received when due. The Group does not hold any collateral in relation to these receivables, other than $412,198 (2009:$464,565) for loans to employees where the shares are held in trust until the loans are repaid in full.
(d) Other receivables
These amounts generally arise from transactions outside the normal operating activities of the group. Collateral is not normally obtained.
(e) Foreign exchange and interest rate risk
The Group’s exposure to interest rate risk and foreign exchange risk in relation to trade and other receivables is disclosed in note 32.
(f) Fair value and credit risk
Due to the short term nature of these receivables, their carrying amount is assumed to approximate their fair value. The non current portion of key management personnel loans is also considered to be at its fair value at balance date.
The maximum exposure to credit risk at the reporting date is the carrying amount of each class of receivables mentioned above with the exception of key management personnel loans which are secured by the shares held in trust. Refer to note 32 for more information on the risk management policy of the Group and the credit quality of the entity’s trade receivables.
For
per
sona
l use
onl
y

56 Notes to and Forming Part of the Consolidated Financial Statements
2010
Notes to and Forming Part of the Consolidated Financial StatementsFOR THE YEAR ENDED 31 DECEMBER 2010
8. DERIVATIVE FINANCIAL INSTRUMENTS – Current
2010 2009
$ $
Forward foreign exchange contracts - assets 240,053 12,468
Forward foreign exchange contracts - liabilities - -
(a) Instruments used by the Group
The Group is party to derivative financial instruments in the normal course of business in order to hedge exposure to fluctuations in foreign exchange rates in accordance with the Groups financial risk policies (refer note 32)
Derivative financial assets and liabilities comprise forward exchange contracts and option contracts. Gains and losses arising from changes in fair value of foreign exchange hedging contracts are recognised in the statement of comprehensive income in the period in which they arise. These financial instruments are classed as held for trading.
The Groups operating expenses mainly consist of materials and services purchased in Indonesian Rupiah. In order to protect against exchange rate movements, the Group had entered into forward exchange contracts to purchase Indonesian Rupiah during the year. In addition the sale of pearls is denominated in Japanese Yen and so the Group has entered into forward exchange contracts and options to sell Japanese Yen and receive Australian Dollars.
See note 1.11 for details of accounting policy in relation to derivatives.
(b) Risk exposures
Information about the Group’s exposure to credit risk, foreign exchange risk and interest rate risk is provided in note 32.
For
per
sona
l use
onl
y
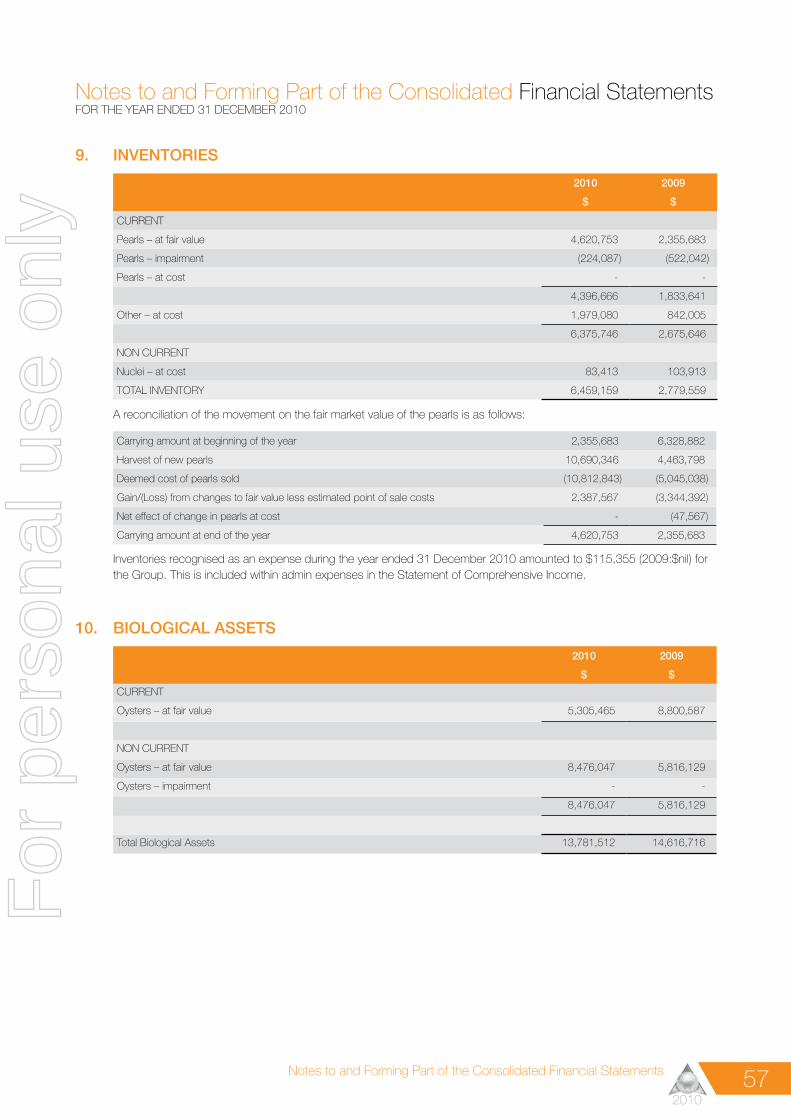
57Notes to and Forming Part of the Consolidated Financial Statements
2010
Notes to and Forming Part of the Consolidated Financial StatementsFOR THE YEAR ENDED 31 DECEMBER 2010
9. INVENTORIES
2010 2009
$ $
CURRENT
Pearls – at fair value 4,620,753 2,355,683
Pearls – impairment (224,087) (522,042)
Pearls – at cost - -
4,396,666 1,833,641
Other – at cost 1,979,080 842,005
6,375,746 2,675,646
NON CURRENT
Nuclei – at cost 83,413 103,913
TOTAL INVENTORY 6,459,159 2,779,559
A reconciliation of the movement on the fair market value of the pearls is as follows:
Carrying amount at beginning of the year 2,355,683 6,328,882
Harvest of new pearls 10,690,346 4,463,798
Deemed cost of pearls sold (10,812,843) (5,045,038)
Gain/(Loss) from changes to fair value less estimated point of sale costs 2,387,567 (3,344,392)
Net effect of change in pearls at cost - (47,567)
Carrying amount at end of the year 4,620,753 2,355,683
Inventories recognised as an expense during the year ended 31 December 2010 amounted to $115,355 (2009:$nil) for the Group. This is included within admin expenses in the Statement of Comprehensive Income.
10. BIOLOGICAL ASSETS
2010 2009
$ $
CURRENT
Oysters – at fair value 5,305,465 8,800,587
NON CURRENT
Oysters – at fair value 8,476,047 5,816,129
Oysters – impairment - -
8,476,047 5,816,129
Total Biological Assets 13,781,512 14,616,716
For
per
sona
l use
onl
y

58 Notes to and Forming Part of the Consolidated Financial Statements
2010
Notes to and Forming Part of the Consolidated Financial StatementsFOR THE YEAR ENDED 31 DECEMBER 2010
10. BIOLOGICAL ASSETS (Cont.)In 2008 the Company undertook an impairment test in relation to juvenile oysters as a result of unexpected mortalities in the month of December caused by environmental factors. Inventories recognised as an expense during the year ended 31 December 2008 amounted to $575,462 and consisted of the impairment charge recognised in relation to the unexpected mortalities of juvenile oysters. In relation to this same event a further $447,445 was expensed for the 2009 financial year.
The details of the Biological Assets that are held by the Group as at year end are as follows:
Nature:- Oysters (Pinctada Maxima)
2010 2009
No. No.
Quantity held within the Group operations:-
Juvenile and mature oysters which are not seeded 1,261,081 709,997
Nucleated oysters 743,537 775,806
2,004,618 1,485,803
During the year ended 31 December 2010, the Group harvested approximately 388,583 (2009:123,790) pearls. A reconciliation of the movement in the fair market value of the oysters during the year is reflected as follows:
2010 2009
$ $
Oysters
Carrying amount at beginning of the year 14,616,716 18,625,996
Value of new juvenile oysters recognised into stock 1,875,512 1,895,076
Increase in value of stock from change in pearl oyster development 11,362,695 7,103,059
Decrease in value through natural mortality (3,028,432) (3,319,168)
Decrease in value of Agriculture asset from harvest of pearls (10,690,346) (4,463,798)
Gain/(Loss) from changes to fair value less estimated point of sale costs 331,297 (3,344,392)
Exchange adjustment (1,170,199) (1,880,057)
Acquisition of pearling operation 484,269 -
Carrying amount at end of the year 13,781,512 14,616,716
For
per
sona
l use
onl
y

59Notes to and Forming Part of the Consolidated Financial Statements
2010
Notes to and Forming Part of the Consolidated Financial StatementsFOR THE YEAR ENDED 31 DECEMBER 2010
10. BIOLOGICAL ASSETS (Cont.)Sensitivity analysis The mark to market estimation of the value of the biological assets (Oysters) is determined using the net present value of expected future net cash flows attributed to this inventory less the estimated point of sale costs. The primary assumptions used for this estimate are shown in Note 1.31. The following table summarises the potential impact of changes in the key non-production related variables:
Selling Price (¥/momme)
-10% No Change +10%
¥5,940 ¥6,600 ¥7,260
Discount rate Profit $ Equity $ Profit $ Equity $ Profit $ Equity $
22% -2,149,581 -2,149,581 -442,816 -442,816 1,263,950 1,263,950
20% -1,940,756 -1,940,756 - - 1,541,813 1,541,813
18% -1,723,936 -1,723,936 53,212 53,212 1,830,360 1,830,360
Selling Price (¥/momme)
-10% No Change +10%
¥5,940 ¥6,600 ¥7,260
FX rate Profit $ Equity $ Profit $ Equity $ Profit $ Equity $
¥91.11 -3,429,010 -3,429,010 -1,853,087 -1,853,087 -277,165 -277,165
¥82.83 -1,940,756 -1,940,756 - - 1,541,813 1,541,813
¥74.55 -103,483 -103,483 1,841,942 1,841,942 3,787,368 3,787,368
The Group is exposed to financial risk in respect of its involvement in primary production which consists of the breeding and rearing of oysters for the purpose of producing pearls. The primary financial risk associated with this activity occurs due to the length of time between the expenditure of cash in relation to the operation of the farm and the harvesting of the pearls and realisation of cash receipts from the sales to third parties. The Group ensures that it maintains sufficient working capital to ensure that it can sustain its operation through any delays in cash flow that may be reasonably foreseen.
For
per
sona
l use
onl
y

60 Notes to and Forming Part of the Consolidated Financial Statements
2010
Notes to and Forming Part of the Consolidated Financial StatementsFOR THE YEAR ENDED 31 DECEMBER 2010
11. PROPERTY, PLANT AND EQUIPMENT2010 2009
$ $
(a) Non-Pearling Assets
Plant and equipment
- at cost 154,620 103,011
- accumulated depreciation (105,950) (99,357)
48,670 3,654
(b) Pearling project
Land (leasehold and freehold) and buildings
- at cost 1,463,012 1,299,687
- accumulated depreciation (689,192) (716,619)
773,820 583,068
Plant and equipment, vessels, vehicles
- at cost 4,643,388 4,805,119
- accumulated depreciation (3,248,722) (3,196,061)
1,394,666 1,609,058
Total pearling project 2,168,486 2,192,126
Total property, plant and equipment 2,217,156 2,195,780
Included in Pearling project land (leasehold and freehold) and buildings is $151,371 (2009 - $137,804) which represents construction of buildings in progress at cost.
Reconciliations of the carrying amount for each class of property, plant and equipment are set
out below:
(a) General
Carrying amount at beginning of the year 3,654 3,501
Additions 51,610 3,873
Disposals - -
Depreciation (6,594) (3,720)
Carrying amount at end of the year 48,670 3,654
b) Pearling project
Leasehold land and buildings
Carrying amount at beginning of the year 583,068 790,251
Additions 287,698 96,084
Acquisition of pearling operation 7,450 -
Disposals/writedowns - (182,399)
Depreciation (35,174) (44,948)
Foreign exchange movement (69,222) (75,920)
Carrying amount at end of the year 773,820 583,068For
per
sona
l use
onl
y
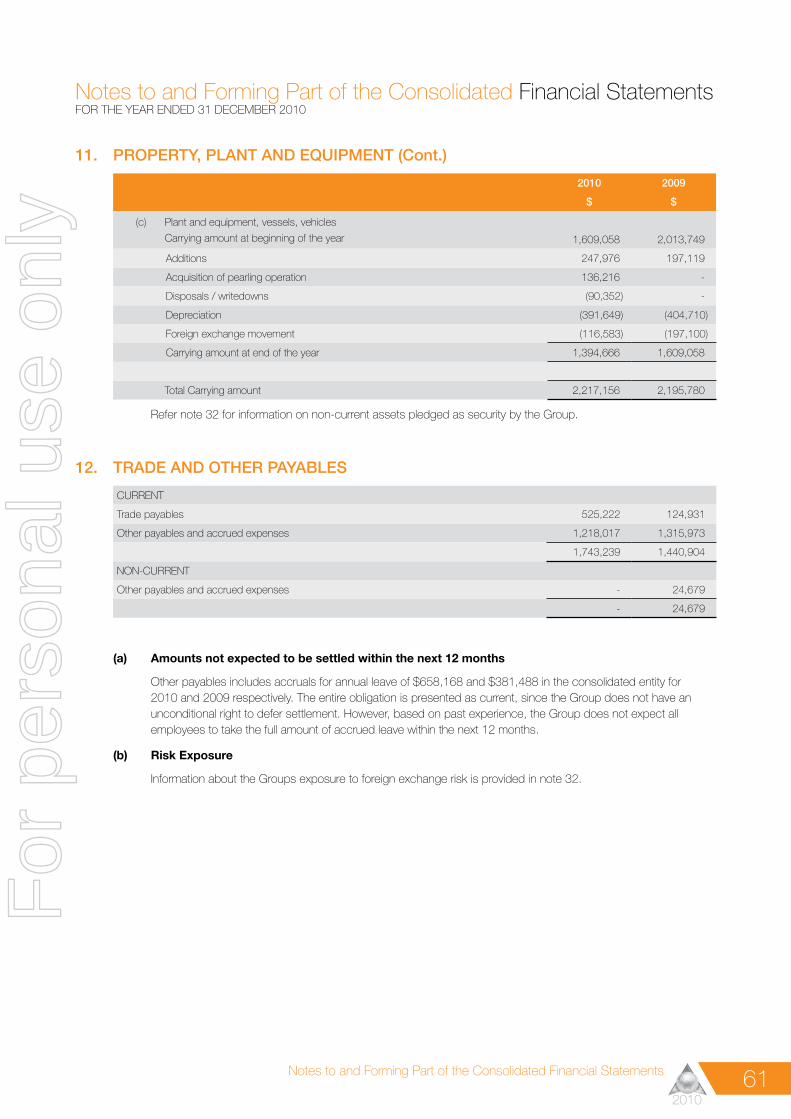
61Notes to and Forming Part of the Consolidated Financial Statements
2010
Notes to and Forming Part of the Consolidated Financial StatementsFOR THE YEAR ENDED 31 DECEMBER 2010
11. PROPERTY, PLANT AND EQUIPMENT (Cont.)
2010 2009
$ $
(c) Plant and equipment, vessels, vehicles
Carrying amount at beginning of the year 1,609,058 2,013,749
Additions 247,976 197,119
Acquisition of pearling operation 136,216 -
Disposals / writedowns (90,352) -
Depreciation (391,649) (404,710)
Foreign exchange movement (116,583) (197,100)
Carrying amount at end of the year 1,394,666 1,609,058
Total Carrying amount 2,217,156 2,195,780
Refer note 32 for information on non-current assets pledged as security by the Group.
12. TRADE AND OTHER PAYABLES
CURRENT
Trade payables 525,222 124,931
Other payables and accrued expenses 1,218,017 1,315,973
1,743,239 1,440,904
NON-CURRENT
Other payables and accrued expenses - 24,679
- 24,679
(a) Amounts not expected to be settled within the next 12 months
Other payables includes accruals for annual leave of $658,168 and $381,488 in the consolidated entity for 2010 and 2009 respectively. The entire obligation is presented as current, since the Group does not have an unconditional right to defer settlement. However, based on past experience, the Group does not expect all employees to take the full amount of accrued leave within the next 12 months.
(b) Risk Exposure
Information about the Groups exposure to foreign exchange risk is provided in note 32.
For
per
sona
l use
onl
y

62 Notes to and Forming Part of the Consolidated Financial Statements
2010
Notes to and Forming Part of the Consolidated Financial StatementsFOR THE YEAR ENDED 31 DECEMBER 2010
13. BORROWINGS
2010 2009
$ $
CURRENT
Secured
Bank loan 3,489,905 4,187,535
Total secured current borrowings 3,489,905 4,187,535
Unsecured
Other 106,215 84,459
Total current borrowings 3,596,120 4,271,994
(a) Security and fair value disclosure
Information about the security relating to secured liabilities and the fair value is provided in note 32.
(b) Risk Exposure
Information about the Groups exposure to risks arising from borrowings is provided in note 32.
14. TAX
(a) Liabilities
CURRENT
Income tax payable 42,446 680,895
NON-CURRENT
Deferred tax liabilities comprises temporary differences attributable to -
Agricultural and biological assets at fair value 1,713,304 924,167
Prepayments - 823
Accrued interest income 484 2,458
Unrealised foreign exchange gains 86,705 260,159
Total deferred tax liabilities 1,800,493 1,187,607
For
per
sona
l use
onl
y

63Notes to and Forming Part of the Consolidated Financial Statements
2010
Notes to and Forming Part of the Consolidated Financial StatementsFOR THE YEAR ENDED 31 DECEMBER 2010
14. TAX (Cont.)
2010 2009
$ $
(b) Assets
Deferred tax assets comprises temporary differences attributable to -
Tax allowances relating to property, plant & equipment 68,754 108,523
Agricultural and biological assets at fair value 73,087 90,923
Accruals 19,348 141,600
Provisions 233,330 183,145
Impairment of assets 71,550 253,326
Unrealised foreign exchange losses 2,079 3,810
Other 22,371 19,186
490,519 800,513
Tax losses recognised 939,739 240,132
Total deferred tax assets 1,430,258 1,040,645
The Company believes that the deferred tax asset relating to tax losses recognised is available to be carried forward based upon the Company’s projections of future taxable amounts.
(c) Reconciliations
The overall movement in deferred tax account is as follows:
Opening balance (146,962) (2,064,318)
(Charge)/credit to statement of comprehensive income (223,273) 1,917,356
Other movements - -
Closing balance (370,235) (146,962)
15. PROVISIONS
CURRENT
Employee benefits 49,057 67,379
Provision for tax penalties - 400,656
Total current 49,057 468,035
NON CURRENT
Employee benefits - 15,281
Total provisions 49,057 483,316
Number of employees 484 482
Employee benefits provisions have been recognised in relation to long service leave for Australian and expatriate employees.The current provision for long service leave includes all unconditional entitlements where employees have completed the required period of service and also those where employees are entitled to pro-rata payments in certain circumstances. The amount presented as non-current represents amounts where an agreement is in place to pay the entitlements over a period of time longer than the next 12 months.F
or p
erso
nal u
se o
nly

64 Notes to and Forming Part of the Consolidated Financial Statements
2010
Notes to and Forming Part of the Consolidated Financial StatementsFOR THE YEAR ENDED 31 DECEMBER 2010
15. PROVISIONS (Cont.)
2010 2009
$ $
Reconciliation of provisions:
Balance at beginning of year 483,316 97,014
Provision used (437,328) (21,393)
Unused provisions reversed - -
Provisions added 3,069 407,695
Closing balance 49,057 483,316
16. CONTRIBUTED EQUITY
2010 2009 2010 2009
No. of shares No. of shares $ $
Issued and fully paid-up capital 136,358,097 125,483,097 23,234,922 22,073,494
Reconciliation of Issued Capital -
Balance at beginning of year 125,483,097 89,220,890 22,073,494 19,250,564
Shares issued (1)(2)(3)(4) 10,875,000 36,262,207 1,161,428 2,822,930
Shares forfeiture (1) - - - -
Balance at end of year 136,358,097 125,483,097 23,234,922 22,073,494
(1) Refer Note 23 for details of shares issued to employees and employee shares forfeited.
(2) On 26 February 2009 the Company announced a Rights Issue. The Company issued fully paid ordinary shares in the capital of
the Company at an issue price of $0.08 each. The new shares were offered on the basis of 1 new share for every 3 fully paid
ordinary shares. 25,012,207 shares were issued under the Rights Issue. The balance of the shares, 4,728,090 shares were
placed with professional investors. In addition to this, the Company issued a further 6,521,910 shares to sophisticated investors
on the same terms as the shares offered under the Rights Issue. The total amount raised was $2,822,930 after associated
costs. The shares rank equally with the Company’s existing issued shares.
(3) On 15 November 2010 the Company issued fully paid ordinary shares in the capital of the Company at an issue price of $0.11
each. A total of 10,000,000 shares were issued to a sophisticated investor. The total amount raised after associated costs was
$1,091,428. The shares rank equally with the Company’s existing issued shares.
(4) In May 2010, 875,000 shares were issued to executives of the Company as a part of their remuneration package (refer 5.3.5 of
Directors’ Report)
(i) Rights
Holders of ordinary shares are entitled to receive dividends as declared from time to time and are entitled to one vote per share at shareholders’ meetings. In the event of winding up of the Company, ordinary shareholders rank after all other shareholders (where applicable) and creditors and are fully entitled to any proceeds of liquidation in proportion to the number of shares held.
(ii) Share Buyback
The share buy-back has been terminated as at the date of this report and no shares had been bought back during the financial year 2009 or 2010.
(iii) Capital Risk Management
The Group’s objectives when managing capital are to safeguard their ability to continue as a going concern, so that they can continue to provide returns to shareholders and benefits for other stakeholders and to maintain an optimal capital structure to reduce the cost of capital.
For
per
sona
l use
onl
y

65Notes to and Forming Part of the Consolidated Financial Statements
2010
Notes to and Forming Part of the Consolidated Financial StatementsFOR THE YEAR ENDED 31 DECEMBER 2010
16. CONTRIBUTED EQUITY (Cont.)In order to maintain or adjust the capital structure, the Group may adjust the amount of dividends paid to shareholders, return capital to shareholders, issue new shares or sell assets to reduce debt.
The Group has no external requirements imposed upon it in relation to capital structure except those noted in note 32 as part of the covenants relating to the financing arrangements with Commonwealth Bank and has no set gearing ratios upon which to monitor its capital.
17. RESERVES
2010 2009
$ $
Foreign Currency Translation Reserve (7,149,381) (6,256,508)
Employee Share Reserve 67,000 66,020
Total Reserves (7,082,381) (6,190,488)
Movements :
Foreign Currency Translation Reserve -
Balance at beginning of year (6,256,508) (5,116,617)
Currency translation differences arising during the year (892,873) (1,139,891)
Balance at end of year (7,149,381) (6,256,508)
The foreign currency translation reserve records exchange differences arising on translation of
foreign controlled subsidiaries to the reporting currency.
Employee Share Reserve -
Balance at beginning of year 66,020 59,085
Movement in Employee Share Reserve 980 6,935
Balance at end of year 67,000 66,020
The employee share reserve records the value of equity portion of remuneration paid to
employees in the form of shares or other equity instruments.
18. RETAINED PROFITS/(ACCUMULATED LOSSES)
Reconciliation of retained earnings/(Accumulated losses) :
Balance at beginning of year 795,398 7,978,111
Net profit/(loss) for the year 2,359,974 (7,182,713)
Dividends paid - -
Balance at end of year 3,155,372 795,398
For
per
sona
l use
onl
y

66 Notes to and Forming Part of the Consolidated Financial Statements
2010
Notes to and Forming Part of the Consolidated Financial StatementsFOR THE YEAR ENDED 31 DECEMBER 2010
19. DIVIDENDSNo dividends have been paid or declared in respect of the 2010 or 2009 financial year.
2010 2009
$ $
Dividend Franking Account
Franking credits available to shareholders of the Company for subsequent financial years based
on a tax rate of 30%. 1,351,929 1,341,808
The above amounts represent the balance of the franking account as at the end of the financial year adjusted for:
(i) Franking credits that will arise from the payment of the amount of the provision for income tax;
(ii) Franking debits that will arise from the payment of dividends recognised as a liability at the reporting date; and
(iii) Franking credits that will arise from the receipt of dividends recognised as receivables at the reporting date.
20. OPTIONSThere were no options that were issued or exercised during the financial years relating to this report. There are no options on issue by the Company as at the date of this report or any time during the period covered under this report.
For
per
sona
l use
onl
y
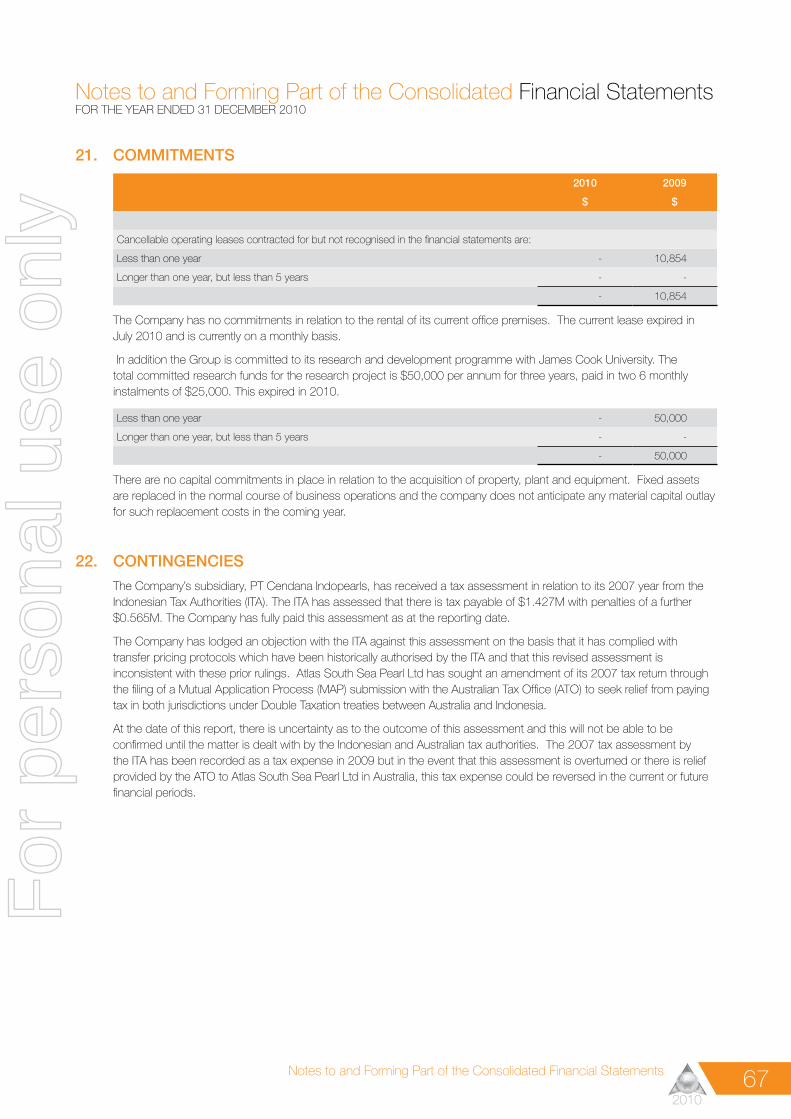
67Notes to and Forming Part of the Consolidated Financial Statements
2010
Notes to and Forming Part of the Consolidated Financial StatementsFOR THE YEAR ENDED 31 DECEMBER 2010
21. COMMITMENTS
2010 2009
$ $
Cancellable operating leases contracted for but not recognised in the financial statements are:
Less than one year - 10,854
Longer than one year, but less than 5 years - -
- 10,854
The Company has no commitments in relation to the rental of its current office premises. The current lease expired in July 2010 and is currently on a monthly basis.
In addition the Group is committed to its research and development programme with James Cook University. The total committed research funds for the research project is $50,000 per annum for three years, paid in two 6 monthly instalments of $25,000. This expired in 2010.
Less than one year - 50,000
Longer than one year, but less than 5 years - -
- 50,000
There are no capital commitments in place in relation to the acquisition of property, plant and equipment. Fixed assets are replaced in the normal course of business operations and the company does not anticipate any material capital outlay for such replacement costs in the coming year.
22. CONTINGENCIESThe Company’s subsidiary, PT Cendana Indopearls, has received a tax assessment in relation to its 2007 year from the Indonesian Tax Authorities (ITA). The ITA has assessed that there is tax payable of $1.427M with penalties of a further $0.565M. The Company has fully paid this assessment as at the reporting date.
The Company has lodged an objection with the ITA against this assessment on the basis that it has complied with transfer pricing protocols which have been historically authorised by the ITA and that this revised assessment is inconsistent with these prior rulings. Atlas South Sea Pearl Ltd has sought an amendment of its 2007 tax return through the filing of a Mutual Application Process (MAP) submission with the Australian Tax Office (ATO) to seek relief from paying tax in both jurisdictions under Double Taxation treaties between Australia and Indonesia.
At the date of this report, there is uncertainty as to the outcome of this assessment and this will not be able to be confirmed until the matter is dealt with by the Indonesian and Australian tax authorities. The 2007 tax assessment by the ITA has been recorded as a tax expense in 2009 but in the event that this assessment is overturned or there is relief provided by the ATO to Atlas South Sea Pearl Ltd in Australia, this tax expense could be reversed in the current or future financial periods.
For
per
sona
l use
onl
y

68 Notes to and Forming Part of the Consolidated Financial Statements
2010
Notes to and Forming Part of the Consolidated Financial StatementsFOR THE YEAR ENDED 31 DECEMBER 2010
23. SHARE BASED PAYMENTSIn May 2006, an employee share plan was established which entitles the Board of Directors to offer shares to key management personnel within the Group. A total of 1,100,000 shares were issued during 2007 to six (6) employees including the managing director at a price of 40 cents per share which was a one (1) cent and eight (8) cent discount to the market at the dates of issue being 17th April 2007 and 10th May 2007 respectively. An interest free, non-recourse loan was provided to the key management staff to pay for these shares. This loan will be repaid by the employees from the proceeds of dividends that they are entitled to from the ownership of the shares. 50% of the shares vested to the employees after two (2) years employment from the time of issuing the shares and the remaining 50% vested to the employees after they have completed three (3) years of employment from the time of issuing the shares. Employees are only entitled to the shares if the loan is repaid in full.
1,900,000 shares remain on issue as at 31 December 2010 with debt of $412,198 outstanding to employees from the initial loan of $1,063,500 that was made when the shares were allocated to employees. Refer note 25 for details of equity held and loans outstanding to Key Management Personnel.
Shares issued to the employees are acquired and held in trust for the employees. The shares are included within contributed equity in the consolidated financial report.
The fair value of shares issued under the scheme is measured at the market price at which the company’s shares are traded on the Australian Stock Exchange on the grant date. The fair value is recognised in the balance sheet as an issue of shares at issue price in equity and the fair value portion as reserves. A corresponding amount for the fair value is shown as part of employee costs in the period in which the shares vest.
The fair value of the shares is considered to be the difference between the market price on the date of grant and the employees purchase price of the shares.
There have been no shares issued under the plan in 2009 or 2010.
The shares rank equally with other fully paid ordinary shares.
Where shares are issued to employees of subsidiaries of the Group, the transactions are treated in accordance with the accounting policy at note 1.14.
At the company’s annual general meeting in May 2007, shareholders approved the allocation of a maximum of 4,000,000 shares to senior executives under the employee share plan within three years of the approval of the plan.
2010 2009
Number Number
Number of shares on issue under the employee share plan 1,900,000 2,425,000
1,900,000 2,425,000
During 2008 and 2009 S Cavanagh and J Jorgensen who were issued shares under the plan resigned from the company and a total of 525,000 shares with an issue price of $ 174,250 were reallocated in 2010.
For
per
sona
l use
onl
y

69Notes to and Forming Part of the Consolidated Financial Statements
2010
Notes to and Forming Part of the Consolidated Financial StatementsFOR THE YEAR ENDED 31 DECEMBER 2010
23. SHARE BASED PAYMENTS (Cont.)Expenses arising from share-based payment transactions
Total expenses arising from share-based payment transactions recognised during the period as part of employee benefit expense were as follows:
2010 2009
$ $
Shares issued under the employee share plan 980 6,936
980 6,936
At the Annual General Meeting of Atlas South Sea Pearl Limited on 18 May 2009, shareholders approved the issue of shares to R Wright. R Wright was issued $50,000 of his first years remuneration in the form of ordinary shares in Atlas in lieu of this amount being paid in cash. These shares will be issued at a price of $0.08 per share and will be placed in escrow for one year. The total number of shares allocated was 625,000. A further 250,000 shares were issued under the same terms and conditions to a senior manager who does not meet the definition of key management personnel. The total amount of $70,000 has been expensed in the Statement of Comprehensive Income during the 2009 year.
24. NOTES TO THE CASH FLOW STATEMENT
24.1 Reconciliation of cash
For the purposes of the cash flow statement, cash includes cash on hand and in banks, and investments in money market instruments, net of outstanding bank overdrafts. Cash at the end of the financial year as shown in the statement of cashflows is reconciled to the related items in the balance sheet as follows:-
2010 2009
$ $
Cash at bank (Note 6) 998,335 2,508,711
Balances per statement of cashflows 998,335 2,508,711
For
per
sona
l use
onl
y

70 Notes to and Forming Part of the Consolidated Financial Statements
2010
Notes to and Forming Part of the Consolidated Financial StatementsFOR THE YEAR ENDED 31 DECEMBER 2010
24. NOTES TO THE CASH FLOW STATEMENT (Cont.)
24.2 Reconciliation of profit/(loss) after income tax to net cash inflow from operating activities
2010 2009
$ $
Profit/(loss) after income tax 2,359,974 (7,182,713)
Inventories (1,385,921) 193,781
Increase/(decrease) in interest accrual 3,945 (2,422)
Non cash changes in debtors, prepayments and creditors 572,313 1,225,724
Provision for depreciation 433,417 453,378
Provision for impairment 289,962 1,054,362
Provision for employee entitlements 243,077 (68,506)
Share Based Remuneration 980 76,935
Amortisation of employee loans (15,632) 16,131
(Profit)/loss on disposal of fixed assets - -
(Increase)/decrease in value of financial assets (227,585) (2,968,568)
(Increase)/decrease in fair value of biological assets (2,718,864) 6,678,709
Increase/(decrease) in taxes payable (289,746) (932,031)
Net cash provided by/(used in) operating activities (734,080) (1,455,220)
As at the date of this report the Company has not entered into any non-cash financing or investing activities except as follows:
Property, plant and equipment was acquired through a bank facility totalling $21,255 in 2010.
During the 2009 year an amount of $60,012 was converted from debt to equity in the subsidiary company PT Cendana Indopearls.
24.3 Credit facilities
As at 31 December 2010, the Company had in place a loan facility with the Commonwealth Bank with a limit of $5,000,000. This facility has been utilised, see note 32 for further disclosure. Information about the security relating to secured liabilities and the fair value is provided in note 32.
For
per
sona
l use
onl
y

71Notes to and Forming Part of the Consolidated Financial Statements
2010
Notes to and Forming Part of the Consolidated Financial StatementsFOR THE YEAR ENDED 31 DECEMBER 2010
25. KEY MANAGEMENT PERSONNEL DISCLOSURE
(a) Key management personnel compensation -
2010 2009
$ $
Short-term employment benefits 929,398 745,526
Post-employment benefits 66,479 43,233
Long–term benefits 3,072 7,040
Share-based payments 932 55,982
999,881 851,781
Detailed remuneration disclosures are provided in section 5.2 of the remuneration report on pages 13 to 19.
(b) Equity instrument disclosures relating to key management personnel
(i) Options and rights granted as compensation
No options were issued to key management personnel as remuneration in 2010 or 2009.
(ii) Option holdings
There were no options on issue to key management personnel during 2010 or 2009.
(c) Loans to key management personnel
Details of loans made to directors of the company and other key management personnel of the Group, including their personally related parties, are set out below.
(i) Aggregates for key management personnel
Group Balance at the start of the year
Loans provided during the year
Interest paid and payable for
the year
Interest not charged
Balance at the end of the year
No in Group at the
$ $ $ $ $
2010 375,000 - - 23,813 375,000 2
2009 375,000 - - 19,688 375,000 2
(ii) Individuals with loans above $100,000 during the financial year
2010
Name
Balance at the start of the year
Loans provided during the year
Interest paid and payable for
the year
Interest not charged
Balance at the end of the year
Highest indebted-ness during the year
$ $ $ $ $ $
J. Taylor 263,000 - - 16,701 263,000 263,000
S. Adams 112,000 - - 7,112 112,000 112,000
375,000 - - 23,813 375,000 375,000
For
per
sona
l use
onl
y

72 Notes to and Forming Part of the Consolidated Financial Statements
2010
Notes to and Forming Part of the Consolidated Financial StatementsFOR THE YEAR ENDED 31 DECEMBER 2010
25. KEY MANAGEMENT PERSONNEL DISCLOSURE (Cont.)
2009
Name
Balance at the start of the year
Loans provided during the year
Interest paid and payable for
the year
Interest not charged
Balance at the end of the year
Highest indebted-ness during the year
$ $ $ $ $ $J. Taylor 263,000 - - 13,808 263,000 263,000S. Adams 112,000 - - 5,880 112,000 112,000
375,000 - - 19,688 375,000 375,000
All loans to key management persons are under terms and conditions as set out in note 23 relating to the employee share plan.
The amounts shown for interest not charged in the tables above represent the difference between the amount paid and payable for the year and the amount of interest that would have been charged on an arms length basis.
Impairment of receivables of $205,000 have been recognised in relation to loans made to key management personnel as noted in Note 7 as part of the provision for impairment on loans to employees and key management personnel.
(d) Shareholdings
The number of shares in the company held during the financial year by each director of the company and the other key management personnel of the Group, including their personally related parties, are set out below.
Details of shares that were granted as compensation during the reporting period are provided at note 23 and in the Remuneration Report contained at section 5 of the Directors’ Report.
Balance 1/1/10 Granted as compensation
Options Exercised Other Changes1 Balance
31/12/10
Parent Entity Directors
Mr S.P. Birkbeck 11,523,673 - - 4,231,382 15,755,055
Mr I.M. Murchison2 1,499,999 - - (1,499,999) -
Mr J.J.U. Taylor 1,220,000 - - - 1,220,000
Mr R.A. Wright2 625,000 - - (625,000) -
Mr S.C.B. Adams3 666,666 - - - 666,666
Mr G. Newman3 - - - 400,000 400,000
Other key management personnel
Mr J. Jorgensen - - - - -
Mr T. Jones - - - - -
15,535,338 - - 2,506,383 18,041,721
(1) Other changes refers to shares purchased or sold during the financial year
(2) Director retired or resigned in the financial year
(3) Director appointed in the financial year
For
per
sona
l use
onl
y

73Notes to and Forming Part of the Consolidated Financial Statements
2010
Notes to and Forming Part of the Consolidated Financial StatementsFOR THE YEAR ENDED 31 DECEMBER 2010
25. KEY MANAGEMENT PERSONNEL DISCLOSURE (Cont.)
Balance 1/1/09
Granted as compensation
Options Exercised
Other Changes1
Balance 31/12/09
Parent Entity Directors
Mr S.P. Birkbeck 400,000 - - 11,123,673 11,523,673
Mr I.M. Murchison 750,000 - - 749,999 1,499,999
Mr G.R.W Snow2 13,919,184 - - (13,919,184) -
Mr J.J.U. Taylor 1,220,000 - - - 1,220,000
Mr R.A. Wright - 625,000 - - 625,000
Other key management personnel
Mr S.C.B. Adams 500,000 - - 166,666 666,666
16,789,184 625,000 - (1,878,846) 15,535,338
(1) Other changes refers to shares purchased or sold during the financial year
(2) Director retired or resigned in the financial year
(e) Other transactions
Key management personnel
Payments were made in the year for additional marketing consultancy undertaken to Mr S Birkbeck for $nil (2009:$30,539) under normal commercial terms.
During the year, sales of individual pearls of small quantities were made to some staff and Directors on normal commercial terms.
Aggregate amounts of each of the above types of other transactions with key management personnel of the Group are:
2010 2009
$ $
Amounts recognised as expense
Marketing consultancy - 30,539
Amounts recognised as liability
Payables - -
26. RELATED PARTY TRANSACTIONSSubsidiaries
Interests in subsidiaries are set out in note 29.
The Company purchased pearls to the value of $8,681,941 (2009 - $3,372,673) from its wholly owned controlled subsidiary PT Cendana Indopearls. These transactions are in the normal course of business.
The Company purchased pearl jewellery to the value of $39,687 (2009 - $85,019) from its wholly owned controlled subsidiary PT Cendana Indopearls. These transactions are in the normal course of business.
No provisions for doubtful debts have been raised in relation to any outstanding balances during 2010 or 2009, and no expense has been recognised in respect of bad and doubtful debts due from related parties.
For
per
sona
l use
onl
y

74 Notes to and Forming Part of the Consolidated Financial Statements
2010
Notes to and Forming Part of the Consolidated Financial StatementsFOR THE YEAR ENDED 31 DECEMBER 2010
27. REMUNERATION OF AUDITORSDuring the year, the following fees were paid or payable for services provided by the auditor of the parent entity, its related practices and non-related audit firms:
2010 2009
$ $
(a) BDO Australia
Audit and other assurance services
Audit and review of financial reports 66,858 70,326
Total remuneration for audit and other assurance services 66,858 70,326
Taxation Services
Tax compliance services and advise 37,783 21,449
Total remuneration for taxation services 37,783 21,449
Total remuneration of BDO Australia 104,641 91,775
(b) Related practices of BDO Australia
Audit and other assurance services
Audit and review of financial reports 33,404 32,147
Total remuneration for audit and other assurance services 33,404 32,147
Taxation Services
Tax compliance services and advise 1,607 1,947
Total remuneration for taxation services 1,607 1,947
Total remuneration of related practices of BDO Australia 35,011 34,094
Total auditors remuneration 139,652 125,869
For
per
sona
l use
onl
y

75Notes to and Forming Part of the Consolidated Financial Statements
2010
Notes to and Forming Part of the Consolidated Financial StatementsFOR THE YEAR ENDED 31 DECEMBER 2010
28. SEGMENT REPORTING
(a) Segment information provided to the Board of Directors and management team
(i) The segment information provided to the Board of Directors and management team for the reportable segments for the year ended 31 December 2010 is as follows:
2010 Wholesale Loose Pearl Jewellery All other segments Total
Australia Indonesia Australia Indonesia
$ $ $ $ $ $
Total segment revenue 8,571,426 7,165,238 29,669 970,233 - 16,736,567
Inter-segment revenue - (7,165,238) - (39,687) - (7,204,925)
Revenue from external customers8,571,426 - 29,669 930,546 - 9,531,642
Adjusted net operating profit/ (loss) before income tax
(1,976,294) 550,626 12,374 416,213 - (997,081)
Depreciation and amortisation 6,594 22,895 - 24,360 - 53,849
Totals segment assets 1,968,798 14,444,622 - 2,185,812 - 18,599,233
Total assets includes:
Additions to non – current assets (other
than financial assets or deferred tax)51,610 572,793 - 106,547 - 730,950
Total segment liabilities 586,747 686,129 - 10,500 - 1,283,377
Included within the net operating profit for wholesale loose pearls in Indonesia is an impairment charge of $224,087 in relation to the impairment of loose pearl stock.
For
per
sona
l use
onl
y

76 Notes to and Forming Part of the Consolidated Financial Statements
2010
Notes to and Forming Part of the Consolidated Financial StatementsFOR THE YEAR ENDED 31 DECEMBER 2010
28. SEGMENT REPORTING (Cont.)(ii) The segment information provided to the Board of Directors and management team for the reportable
segments for the year ended 31 December 2009 is as follows:
2009 Wholesale Loose Pearl Jewellery All other segments
Total
Australia Indonesia Australia Indonesia
$ $ $ $ $ $
Total segment revenue 5,917,532 4,107,459 124,755 674,691 - 10,824,437
Inter-segment revenue - (4,107,459) (78,269) (6,750) - (4,192,478)
Revenue from external customers 5,917,532 - 46,486 667,941 - 6,631,959
Adjusted net operating profit/(loss) before income tax (921,475) (355,326) 93,025 (166,028) - (1,349,804)
Depreciation and amortisation 3,720 39,863 - 30,701 - 74,284
Totals segment assets 5,518,182 15,344,100 - 1,213,463 - 22,075,745
Total assets includes:
Additions to non – current assets
(other than financial assets or
deferred tax) 3,873 289,069 - 4,134 - 297,076
Total segment liabilities 748,321 716,607 - 28,113 - 1,493,041
(b) Other segment information
(i) Segment revenue Segment revenue reconciles to total revenue from continuing operations in the statement of comprehensive income as follows:
2010 2009
$ $
Total segment revenue 16,736,567 10,824,437
Intersegment eliminations (7,204,925) (4,192,478)
Interest income 38,383 51,741
Other revenues 271,670 224,744
Total revenue from continuing operations ( note 2) 9,841,695 6,908,444
Major customers The Company’s previous wholesale pearl agent accounted for 13% of external revenue in 2010 (2009: 61%). A Japanese wholesaler accounted for 37% of external revenue (2009: 11%). These revenues are attributable to the Australian wholesale loose pearl segment.F
or p
erso
nal u
se o
nly

77Notes to and Forming Part of the Consolidated Financial Statements
2010
Notes to and Forming Part of the Consolidated Financial StatementsFOR THE YEAR ENDED 31 DECEMBER 2010
28. SEGMENT REPORTING (Cont.)
(b) Other segment information (Cont.)
The entity is domiciled in Australia. The result of its revenue from third party customers in Australia is $928,950 (2009:$4,166,170) in relation to wholesale loose pearl sales. As noted above the majority of its sales in 2009 were sold through an Australian based loose pearl wholesale agent who sold pearls for the Company to a large number of clients but all receivables were underwritten by the agent. Revenue for wholesale loose pearls from third party customers based in other countries in 2010 was $6,929,679 (2009: $1,751,362). 81% of the total loose pearl sales revenue in 2010 was to Japanese based customers. In relation to retail jewellery sales the above segment reporting is based on the location of the sale, whether in Australia or Indonesia as the nature of the retail business relies on one off sales transactions with customers from a variety of locations.
(ii) Adjusted net operating profit Segment net operating profit/(loss) before income tax reconciliation to the statement of comprehensive income The Board of Directors and the management team review on a monthly basis the performance of each segment by analysing the segment’s net operating profit before tax. A segment’s net operating profit before tax excludes non-operating income and expense such as interest paid and received, foreign exchange gains and losses whether realised or unrealised,fair value gains and losses and impairment charges.
A reconciliation of adjusted net operating profit/(loss) before income tax is provided as follows:
2010 2009
$ $
Net operating profit /(loss) before tax (997,081) (1,349,804)
Intersegment eliminations 1,819,638 130,063
Changes in fair value of biological and agricultural assets 2,718,863 (6,678,710)
Interest revenue/(expense) (123,588) (64,328)
Gain on bargain purchase 51,050 -
Impairment expense (289,962) (1,054,362)
Foreign exchange gains 1,448,680 4,239,650
Foreign exchange losses (1,860,519) (2,196,194)
Other (11,968) (538,894)
Profit/(loss) before income tax from continuing operations 2,755,113 (7,512,579)
For
per
sona
l use
onl
y

78 Notes to and Forming Part of the Consolidated Financial Statements
2010
Notes to and Forming Part of the Consolidated Financial StatementsFOR THE YEAR ENDED 31 DECEMBER 2010
28. SEGMENT REPORTING (Cont.)(iii) Segment assets
Assets are allocated based on the operations of the segment and the physical location of the asset. Reportable segments’ assets are reconciled to total assets as follows:
2010 2009
$ $
Segment assets 18,599,233 22,075,745
Intersegment eliminations 270,734 (1,641,634)
Unallocated:
Other 251 700
Deferred tax assets 1,430,258 1,040,645
Fair value adjustments on biological and agricultural assets 5,998,739 3,279,875
Derivative financial instruments 240,053 12,468
Total assets as per the statement of financial position 26,539,268 24,767,799
The total of non-current assets other than financial instruments, deferred tax assets and fair value adjustments on biological and agricultural assets located in Australia is $222,368 (2009: $166,219). The total located in Indonesia is $ 8,335,382 (2009:$8,298,027).
(iv) Segment liabilities Liabilities are allocated based on the operations of the segment and the physical location of the asset. Reportable segments’ liabilities are reconciled to total liabilities as follows:
2010 2009
$ $
Segment liabilities 1,283,377 1,493,041
Intersegment eliminations 505,031 463,349
Unallocated:
Other 3,888 4,800
Current tax liabilities 42,446 668,604
Borrowings 3,596,120 4,271,994
Deferred tax liabilities 1,800,493 1,187,607
Derivative financial instruments - -
Total liabilities as per the statement of financial position 7,231,355 8,089,395
For
per
sona
l use
onl
y

79Notes to and Forming Part of the Consolidated Financial Statements
2010
Notes to and Forming Part of the Consolidated Financial StatementsFOR THE YEAR ENDED 31 DECEMBER 2010
29. SUBSIDIARIESThe consolidated financial statements incorporate the assets, liabilities and results of the following subsidiaries in accordance with the accounting policy described in note 1.5
Name of entity Class of shares Percentage owned Percentage owned Place of incorporation
2010 2009
Sharcon Pty Ltd Ord 100% 100% Australia
Tansim Pty Ltd Ord 100% 100% Australia
P.T. Cendana Indopearls Ord 100% 100% Indonesia
Aspirasi Satria Sdn Bhd Ord 100% 100% Malaysia
The ultimate parent entity, Atlas South Sea Pearl Limited, is incorporated in Australia.
30. BUSINESS COMBINATION
(a) Summary of acquisition
In July 2010 the subsidiary company PT Cendana Indopearls purchased an existing pearling operation in the area of Flores/Alor. The final purchase price represented the existing stock of seeded and unseeded oysters plus property, plant and equipment. The acquisition will ensure that there is sufficient land and water facilities to enable the implementation of the expansion of production which is under way. Hatchery, farming and seeding activities have already commenced at the Flores and Alor sites.
Details of the purchase consideration and the net assets acquired are as follows:
$
Purchase consideration (refer to (b) below):
Cash paid 576,885
Total purchase consideration 576,885
The assets and liabilities recognised as a result of the acquisition are as follows: Fair value $
Plant and equipment 143,666
Biological assets 484,269
Net identifiable assets acquired 627,935
For
per
sona
l use
onl
y

80 Notes to and Forming Part of the Consolidated Financial Statements
2010
Notes to and Forming Part of the Consolidated Financial StatementsFOR THE YEAR ENDED 31 DECEMBER 2010
30. BUSINESS COMBINATION (Cont.)The amount of gain recognised in relation to the business combination of $51,050 is included within other income as set out in note 2. The Company has reviewed procedures it used in identifying and measuring the assets acquired and the consideration transferred, and the procedures and measures were appropriate. The pearling operation had been operational for over 10 years in the production and selling of pearls, but lacked the technical expertise and management required to value add this core activity through production of quality pearls. The bargain purchase reflects this fact and represents the technical and management expertise Atlas can bring to this operation and improve the production of quality pearls.
There were no acquisitions in the year ending 31 December 2009.
Revenue and profit contribution
The acquired operations contributed revenues of $nil and net loss of $136,839 to the group for the period from 1 July 2010 to 31 December 2010. No revenues are attributed to this site for the 2010 financial year as no pearls harvested from this operation have yet been sold. This excludes the fair value adjustment of any oysters existing as at 31 December 2010 in which the Alor site represented a reduction in fair value of $25,937 in the period 1 July 2010- 31 December 2010.
It is not practical to state what the contribution to profit and revenue for the year would have been if the acquisition had occurred on 1 January 2010. This is due to purchasing the assets of the pearling operation rather than an existing business or subsidiary.
(b) Purchase consideration – cash outflow
$
Outflow of cash to acquire operations, net of cash acquired
Cash consideration 576,885
Less : balances acquired -
Outflow of cash – investing activities 576,885
Acquisition-related costs
Acquisition related costs of $8,879 are included in other expenses in profit and loss and in operating cash flows in the statement of cash flows.
For
per
sona
l use
onl
y

81Notes to and Forming Part of the Consolidated Financial Statements
2010
Notes to and Forming Part of the Consolidated Financial StatementsFOR THE YEAR ENDED 31 DECEMBER 2010
31. PARENT ENTITY FINANCIAL INFORMATION
(a) Summary financial information
The individual financial statements for the parent entity show the following aggregate amounts:
2010 2009
$ $
Statement of financial position
Current assets 19,702,348 21,192,811
Total assets 21,024,043 22,278,298
Current liabilities 4,369,646 5,322,393
Total liabilities 4,493,886 5,599,894
Shareholders equity
Issued capital 23,234,922 22,073,494
Reserves
Share-based payment reserve 67,000 66,020
Retained earnings (6,771,765) (5,461,110)
16,530,157 16,678,404
Profit / (loss ) for the year (1,310,654) (5,523,890)
Total comprehensive income (1,310,654) (5,523,890)
(b) Contingent liabilities
The parent entity did not have any contingent liabilities as at 31 December 2010 or 31 December 2009.
For
per
sona
l use
onl
y

82 Notes to and Forming Part of the Consolidated Financial Statements
2010
Notes to and Forming Part of the Consolidated Financial StatementsFOR THE YEAR ENDED 31 DECEMBER 2010
32. FINANCIAL RISK MANAGEMENTThe Group’s activities expose it to a variety of financial risks: market risk (including currency risk, interest rate risk and price risk), credit risk and liquidity risk. The Group’s overall risk management program focuses on the unpredictability of financial markets and seeks to minimise potential adverse effects on the financial performance of the Group. The Group uses derivative financial instruments such as foreign exchange contracts and options to hedge certain risk exposures. Derivatives are exclusively used for hedging purposes, ie not as trading or speculative instruments. The Group uses different methods to measure different types of risk to which it is exposed. The Group uses sensitivity analysis in the case of interest rate and foreign exchange risks and aging analysis for credit risk.
Risk management is carried out by the Board of Directors.
The Group holds the following financial instruments:
2010 2009
$ $
Financial Assets
Cash and cash equivalents 998,335 2,508,711
Trade and other receivables 945,730 1,077,440
Derivative financial instruments 240,053 12,468
2,184,118 3,598,619
Financial Liabilities
Trade and other payables 1,085,071 1,104,699
Borrowings 3,596,120 4,271,994
Derivative financial instruments - -
4,681,191 5,376,693
Market Risk
(i) Foreign exchange risk
The Group operates internationally and are exposed to foreign exchange risk arising from various currency exposures, primarily with respect to the Japanese Yen, Indonesian Rupiah and US Dollar.
Foreign exchange risk arises from future commercial transactions and recognised assets and liabilities denominated in a currency that is not the entity’s functional currency and net investments in foreign operations. The risk is measured using sensitivity analysis and cash flow forecasting.
Management manages their foreign exchange risk against their functional currency. Group companies are required to hedge their foreign exchange risk exposure arising from future commercial transactions and recognised assets and liabilities using forward exchange contracts and options under the guidance of the Board of Directors.
For
per
sona
l use
onl
y

83Notes to and Forming Part of the Consolidated Financial Statements
2010
Notes to and Forming Part of the Consolidated Financial StatementsFOR THE YEAR ENDED 31 DECEMBER 2010
32. FINANCIAL RISK MANAGEMENT (Cont.)The Groups exposure to foreign currency risk at the reporting date expressed in Australian dollars, was as follows:
31 December 2010 31 December 2009
JPY $ IDR $ USD $ EUR $ JPY $ IDR $ USD $
Cash and cash equivalents 85,576 168,052 74,390 15,232 191 113,652 107,406
Trade and other receivables 142,637 - - - 575,610 23,356 4,512
Trade and other payables 3,508 99,992 297,433 - - 56,324 32,925
Borrowings 3,465,813 - - - 4,187,535 - -
Forward exchange contracts – buy
foreign currency 240,053 - - - 12,468 - -
Forward exchange contracts – sell
foreign currency - - - - - - -
Group Sensitivity Analysis
Sensitivity analysis is based on exchange rates in US Dollars, Japanese Yen, and Indonesian Rupiah increasing or decreasing by 10% and the affect on profit and equity
Balance Sheet Amount
AUD
Foreign Exchange Rate Risk
31 December 2010 31 December 2009
-10% 10% -10% 10%
Profit Equity Profit Equity Profit Equity Profit Equity
2010 2009
Financial Assets
Cash 998,335 2,508,711 18,677 - (16,573) - 11,924 - (9,772) -
Trade and other receivables 945,730 1,077,440 15,524 - (13,054) - 64,669 - (52,566) -
Derivatives 240,053 12,468 (447,099) - 436,866 - (236,382) - 199,070 -
Financial Liabilities
Trade and other payables 1,085,071 1,104,699 (32,134) - 28,247 - (7,714) - (325) -
Borrowings 3,596,120 4,271,994 (370,425) - 327,073 - (465,282) - 380,685 -
Derivatives - - - - - - - - - -
Total Increase/(Decrease) (815,456) - 762,559 - (632,785) - 517,092 -For
per
sona
l use
onl
y
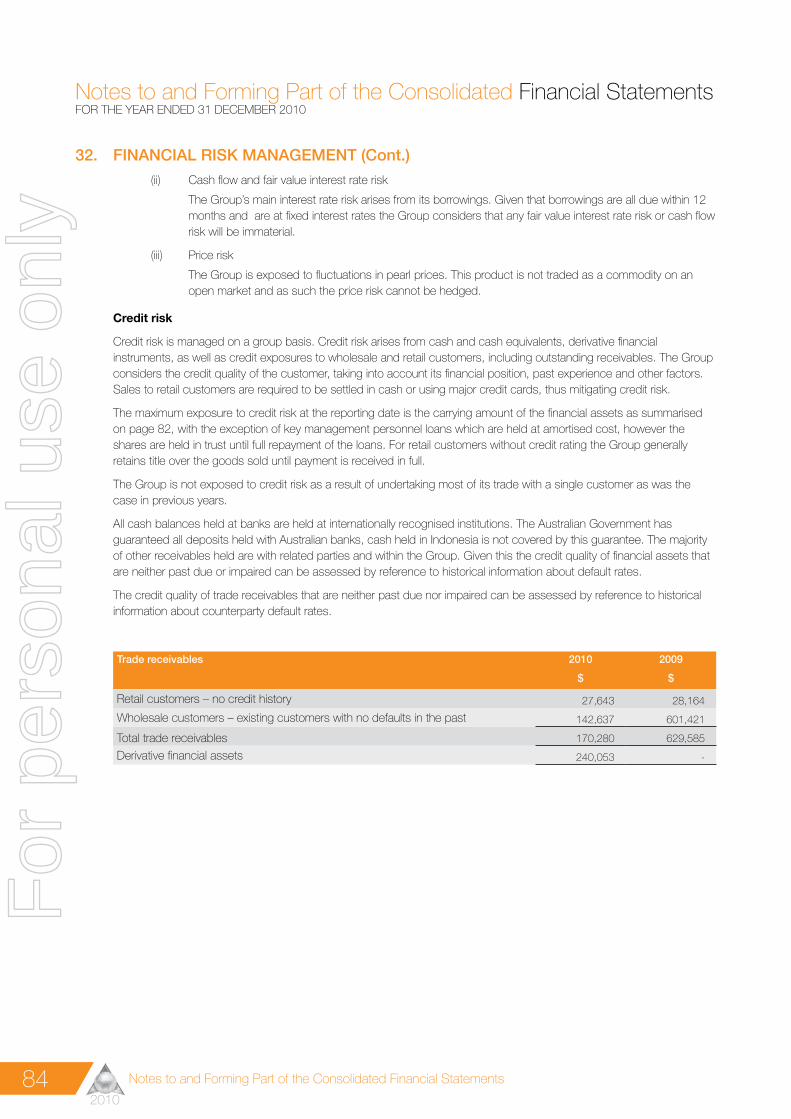
84 Notes to and Forming Part of the Consolidated Financial Statements
2010
Notes to and Forming Part of the Consolidated Financial StatementsFOR THE YEAR ENDED 31 DECEMBER 2010
32. FINANCIAL RISK MANAGEMENT (Cont.)(ii) Cash flow and fair value interest rate risk
The Group’s main interest rate risk arises from its borrowings. Given that borrowings are all due within 12 months and are at fixed interest rates the Group considers that any fair value interest rate risk or cash flow risk will be immaterial.
(iii) Price risk
The Group is exposed to fluctuations in pearl prices. This product is not traded as a commodity on an open market and as such the price risk cannot be hedged.
Credit risk
Credit risk is managed on a group basis. Credit risk arises from cash and cash equivalents, derivative financial instruments, as well as credit exposures to wholesale and retail customers, including outstanding receivables. The Group considers the credit quality of the customer, taking into account its financial position, past experience and other factors. Sales to retail customers are required to be settled in cash or using major credit cards, thus mitigating credit risk.
The maximum exposure to credit risk at the reporting date is the carrying amount of the financial assets as summarised on page 82, with the exception of key management personnel loans which are held at amortised cost, however the shares are held in trust until full repayment of the loans. For retail customers without credit rating the Group generally retains title over the goods sold until payment is received in full.
The Group is not exposed to credit risk as a result of undertaking most of its trade with a single customer as was the case in previous years.
All cash balances held at banks are held at internationally recognised institutions. The Australian Government has guaranteed all deposits held with Australian banks, cash held in Indonesia is not covered by this guarantee. The majority of other receivables held are with related parties and within the Group. Given this the credit quality of financial assets that are neither past due or impaired can be assessed by reference to historical information about default rates.
The credit quality of trade receivables that are neither past due nor impaired can be assessed by reference to historical information about counterparty default rates.
Trade receivables 2010 2009
$ $
Retail customers – no credit history 27,643 28,164
Wholesale customers – existing customers with no defaults in the past 142,637 601,421
Total trade receivables 170,280 629,585
Derivative financial assets 240,053 -
For
per
sona
l use
onl
y
85Notes to and Forming Part of the Consolidated Financial Statements
2010
Notes to and Forming Part of the Consolidated Financial StatementsFOR THE YEAR ENDED 31 DECEMBER 2010
32. FINANCIAL RISK MANAGEMENT (Cont.)Liquidity risk
Prudent liquidity risk management implies maintaining sufficient cash, the availability of funding through an adequate amount of committed credit facilities and the ability to close out market positions. The Group manages liquidity risk by continuously monitoring forecast and actual cash flows and matching the maturity profiles of financial assets and liabilities. Group management aims at maintaining flexibility in funding by keeping committed credit lines available. Surplus funds are generally only invested in instruments such as term deposits that are highly liquid.
Management monitors rolling forecasts of the Group’s liquidity reserve (comprising the undrawn borrowing facilities below) and cash and cash equivalents (note 6) on the basis of expected cash flows. This is generally carried out by the Board of Directors on a Group basis. In addition, the Group’s liquidity management policy involves projecting cash flows in major currencies and considering the level of liquid assets necessary to meet these and monitoring debt financing plans.
Financing arrangements
The Group had access to the following borrowing facilities at the reporting date.
Fixed rate 2010 2009
$ $
Expiring within one year – Foreign currency loan trade 5,000,000 5,500,000
5,000,000 5,500,000
This loan is secured by a registered company charge by Commonwealth Bank of Australia over the whole of the assets and undertakings including uncalled capital of Atlas South Sea Pearl Limited and its related entities. The bank loans are denominated in Japanese Yen with fixed interest rates varying from 4.93% to 5.15% and are repayable within the year. As at reporting date the Company had drawn down $3,465,813 (2009:$4,187,535) and had undrawn facilities available of $1,534,187 (2009: $1,312,465) This loan can be drawn at anytime and is subject to annual review.
The company is required to meet three financial undertakings to comply with the lending conditions as follows:
(i) Earnings before interest, tax, depreciation and amortisation (EBITDA) will be at least equal to, a profit of $800,000 for 2010 and a profit of $2,020,000 for 2011;
(ii) Minimum net worth of the borrower (Atlas) will at all times be greater than $16,000,000; and
(iii) The ratio of net worth of the borrower to total tangible assets of the borrower will at all times be equal to or greater than 60%.
The company also has a loan with St George Finance Limited for the purchase of a motor vehicle within the year. The value of the loan as at 31 December 2010 was $24,090. The loan is secured over the asset by a first priority mortgage. The carrying value of this asset at reporting date was $20,883.
The fair value of current borrowings equals their carrying amount, as the impact of discounting is not significant.
For
per
sona
l use
onl
y

86 Notes to and Forming Part of the Consolidated Financial Statements
2010
Notes to and Forming Part of the Consolidated Financial StatementsFOR THE YEAR ENDED 31 DECEMBER 2010
32. FINANCIAL RISK MANAGEMENT (Cont.)Maturities of financial liabilities
The table below analyses the Group’s financial liabilities, net and gross settled derivative financial instruments into relevant maturity groupings based on their remaining period at the reporting date to the contractual maturity date. The amounts disclosed in the table are the contractual undiscounted cashflows.
Balances due within 12 months equal their carrying balances as the impact of discounting is not significant.
31 December 2010 31 December 2009
CONSOLIDATED ENTITY
Less than 6 Months
6-12 months
Between 1 & 2 years
Between 2 & 5 years
Total contractual cash flows
Carrying amount (asset)/
Liabilities
Less than 6 Months
6-12 months
Total contractual cash flows
Carrying amount (asset)/
Liabilities
$ $ $ $ $ $ $ $
Non-Derivatives
Trade payables 1,085,071 - - - 1,085,071 1,085,071 1,104,699 - 1,104,699 1,104,699
Borrowings 3,555,291 19,186 4,896 16,728 3,596,101 3,596,101 4,271,994 - 4,271,994 4,271,994
Total non-derivatives 4,640,362 19,186 4,896 16,728 4,681,172 4,681,172 5,376,693 - 5,376,693 5,376,693
Derivatives
Net settled ( Non
deliverable forwards) (74,321) (54,383) - - (128,705) (125,613) - - - -
Gross settled
-(inflow) (3,050,000) (250,000) - - (3,300,000) (144,440) (972,102) (1,258,471) (2,230,573) (12,468)
-outflow 2,981,866 251,584 - - 3,233,450 - 969,638 1,248,958 2,218,596 -
Total Derivatives (142,455) (52,799) - - (195,255) (240,053) (2,464) (9,513) (11,977) (12,468)
Borrowings, includes the loan to the Commonwealth Bank (CBA), and is classified as an amount due within 6 months. This loan is drawn as a bank bill facility which has various maturity dates within the first six months of 2011. However the loan facility with CBA has an annual review which is due in May 2011. Bank bills which expire within the first six months of 2011 will be rolled over into a new loan with a revised maturity date within 6-12 months.
For
per
sona
l use
onl
y

87Notes to and Forming Part of the Consolidated Financial Statements
2010
Notes to and Forming Part of the Consolidated Financial StatementsFOR THE YEAR ENDED 31 DECEMBER 2010
32. FINANCIAL RISK MANAGEMENT (Cont.)Fair value measurements
The fair value of financial assets and liabilities must be estimated for recognition and measurement or for disclosure purposes.
AASB 7 Financial Instruments: Disclosures requires disclosure of fair value measurements by level of the following fair value measurement hierarchy:
(a) quoted prices (unadjusted) in active markets for identical assets or liabilities ( level 1)
(b) inputs other than quoted prices included within level 1 that are observable for the asset or liability, either directly (as prices) or indirectly (derived from prices) (level 2) ,and
(c) inputs for the asset or liability that are not based on observable market data (unobservable inputs) (level 3)
The following table presents the Group’s assets and liabilities measured and recognised at fair value at 31 December.
CONSOLIDATED ENTITY – as at 31 December 2010 Level 1 Level 2 Level 3 Total
$ $ $ $
Assets
Derivatives - 240,053 - 240,053
Total Assets - 240,053 - 240,053
CONSOLIDATED ENTITY – as at 31 December 2009
Assets
Derivatives - 12,468 - 12,468
Total Assets - 12,468 - 12,468
The fair value of financial instruments traded in active markets is based on quoted market prices at the reporting date. The quoted market prices used for financial assets held by the Group is the current bid price. These instruments are included in level 1.
The fair value of financial instruments that are not traded in an active market such as unlisted investments and subsidiaries is determined using valuation techniques where applicable. Where this is unable to be done they are held at cost.
The fair value of financial instruments that are not traded in an active market is determined using valuation techniques such as estimated discounted cash flows. The fair value of forward exchange contracts is determined using forward exchange market rates at the reporting date. These instruments are included in level 2 and comprise derivative financial instruments.
The carrying value of trade receivables and payables are assumed to approximate their fair values due to their short term nature. The fair value of financial liabilities for disclosure purposes is estimated by discounting the future contractual cash flows at the current market interest rate that is available to the Group for similar financial instruments. The fair value of current borrowings approximates the carrying amount, as the impact of discounting is not significant.
For
per
sona
l use
onl
y

88 Notes to and Forming Part of the Consolidated Financial Statements
2010
Notes to and Forming Part of the Consolidated Financial StatementsFOR THE YEAR ENDED 31 DECEMBER 2010
33. CHANGE IN ACCOUNTING POLICIESAustralian Accounting Standards and Interpretations that have recently been issued or amended but are not yet effective have not been adopted by the Group for the annual reporting period ending 31 December 2010 unless disclosed in Note 1. The Group’s and the parent entity’s assessment of the impact of these new standards and interpretations is set out below. The initial application of the following Standards and Interpretations is not expected to have any material impact on the financial report of the consolidated entity and the company.
AASB Amendment Affected Standard(s) Nature of Change to
Accounting PolicyApplication
Date of Standard*
Application Date for Group
AASB 2009-11Amendments to Australian Accounting Standards
arising from AASB 9.
Makes amendments to a number
of accounting standards and
Interpretations 10 and 12 arising
from AASB 9.
1 Jan 13 1 Jan 13
AASB 2009-12 Amendments to Australian Accounting StandardsVarious changes made to 16
standards and interpretations.1 Jan 11 1 Jan 11
AASB 2009-14
Amendments to Australian Interpretation-
prepayments of a Minimum Funding Requirement
(AASB Interpretation 14).
Requires long term employee benefit obligations by estimating the discount rate by reference to market yields instead of a government bond rate.
1 Jan 11 1 Jan 11
AASB 2010-3Amendments to Australian Accounting Standards
arising from the Annual Improvements Project.
Various changes made to 7
standards and interpretations.1 Jul 10 1 Jan 11
AASB 2010-4Amendments to Australian Accounting Standards
arising from the Annual Improvements Project.
Various changes made to 5
standards and interpretations.1 Jan 11 1 Jan 11
AASB 2010-6Amendments to Australian Accounting Standards
– Disclosures on Transfers of Financial Assets.
Additional disclosures required
including information about the
nature of financial assets involved
and the risks associated with them.
1 Jul 11 1 Jan 11
AASB 2010-7Amendments to Australian Accounting Standards
arising from AASB 9.
Makes amendments to a number
of accounting standards and
Interpretations arising from AASB 9.
1 Jan 13 1 Jan 13
AASB 2010-8Amendments to Australian Accounting Standards
– Deferred Tax: Recovery of Underlying Assets.
Makes amendments to the
treatment of deferred tax on
investment property measured using
the fair value model.
1 Jan 12 1 Jan 12
AASB
Interpretation 19Extinguishing Liabilities with Equity Instruments.
Changes the way that entities measure the equity instruments they issue to settle their debt obligations.
1 Jul 10 1 Jan 11
AASB 9 Financial Instruments.Changes to classification and measurement requirements of financial instruments.
1 Jan 13 1 Jan 13
AASB 124 Related Party Disclosures (2009).
The definition of a related party has been simplified eliminating inconsistencies – affects disclosure only.
1 Jan 11 1 Jan 11
Any other amendments are not applicable to the Group and therefore have no impact.
For
per
sona
l use
onl
y

89Notes to and Forming Part of the Consolidated Financial Statements
2010
Notes to and Forming Part of the Consolidated Financial StatementsFOR THE YEAR ENDED 31 DECEMBER 2010
34. POST BALANCE DATE EVENTSAtlas South Sea Pearl Limited are currently undertaking a share placement to sophisticated investors. The Company will issue 6,400,000 fully paid ordinary shares in the capital of the Company at an issue price of $0.12 each, to raise $768,000 before costs. The new shares will rank equally with the Company’s existing issued shares.
The results of significant operation activities are made available to shareholders and other interested parties through announcements to the Australian Securities Exchange and through regular newsletters.
35. ECONOMIC DEPENDENCYAll of the company’s pearls are purchased from its wholly owned subsidiary PT Cendana Indopearls.
For
per
sona
l use
onl
y

90 Declaration by Directors’
2010
Declaration by Directors’
The Directors of the Company declare that:
(a) the financial statements comprising the statement of comprehensive income, statement of financial position, statement of cash flows, statement of changes in equity and accompanying notes are in accordance with the Corporations Act 2001 and :
(i) give a true and fair view of the consolidated entity’s financial position as at 31 December 2010 and of the performance for the year ended on that date; and
(ii) comply with Accounting Standards, and the Corporations Regulations 2001.
(b) the Company has included in the notes to the financial statements an explicit and unreserved statement of com-pliance with International Financial Reporting Standards.
(c) the Directors have been given the declarations by the Chief Executive Officer and Chief Financial Officer required by section 295A.
(d) in the Directors opinion there are reasonable grounds to believe that the Company will be able to pay its debts as and when they become due and payable.
(e) the remuneration disclosures included on pages 13 to 19 of the Directors’ Report (as part of audited remuneration report) for the year ended 31 December 2010 comply with section 300A of the Corporations Act 2001.
This declaration is made in accordance with a resolution of the Board of Directors and is signed for and on behalf of the Directors by:
S.P. Birkbeck Chairman Perth, Western Australia
31 March 2011
For
per
sona
l use
onl
y

91Independent Auditor’s Report
2010
Independent Auditor’s Report
INDEPENDENT AUDITOR’S REPORT TO THE MEMBERS OF ATLAS SOUTH SEA PEARL LTD
We have audited the accompanying financial report of Atlas South Sea Pearl Limited, which comprises the consolidated statement of financial position as at 31 December 2010, the consolidated statement of comprehensive income, the consolidated statement of changes in equity and the consolidated statement of cash flows for the year then ended, notes comprising a summary of significant accounting policies and other explanatory information, and the directors’ declaration of the consolidated entity comprising the company and the entities it controlled at the year’s end or from time to time during the financial year.
Directors’ Responsibility for the Financial Report
The directors of the company are responsible for the preparation of the financial report that gives a true and fair view in accordance with Australian Accounting Standards and the Corporations Act 2001 and for such internal control as the directors determine is necessary to enable the preparation of the financial report that is free from material misstatement, whether due to fraud or error. In Note 1, the directors also state, in accordance with Accounting Standard AASB 101 Presentation of Financial Statements, that the financial statements comply with International Financial Reporting Standards.
Auditor’s Responsibility
Our responsibility is to express an opinion on the financial report based on our audit. We conducted our audit in accordance with Australian Auditing Standards. Those standards require that we comply with relevant ethical requirements relating to audit engagements and plan and perform the audit to obtain reasonable assurance about whether the financial report is free from material misstatement.
An audit involves performing procedures to obtain audit evidence about the amounts and disclosures in the financial report. The procedures selected depend on the auditor’s judgement, including the assessment of the risks of material misstatement of the financial report, whether due to fraud or error. In making those risk assessments, the auditor considers internal control relevant to the entity’s preparation of the financial report that gives a true and fair view in order to design audit procedures that are appropriate in the circumstances, but not for the purpose of expressing an opinion on the effectiveness of the entity’s internal control. An audit also includes evaluating the appropriateness of accounting policies used and the reasonableness of accounting estimates made by the directors, as well as evaluating the overall presentation of the financial report.
We believe that the audit evidence we have obtained is sufficient and appropriate to provide a basis for our audit opinion.
Independence
In conducting our audit, we have complied with the independence requirements of the Corporations Act 2001. We confirm that the independence declaration required by the Corporations Act 2001, which has been given to the directors of Atlas South Sea Pearl Limited, would be in the same terms if given to the directors as at the time of this auditor’s report.
Tel: +8 6382 4600Fax: +8 6382 4601www.bdo.com.au
38 Station StreetSubiaco, WA 6008PO Box 700 West Perth WA 6872Australia
BDO Audit (WA) Pty Ltd ABN 79 112 284 787 is a member of a national association of independent entities which are all members of BDO (Australia) Ltd ABN 77 050 110 275, an Australian company limited by guarantee. BDO Audit (WA) Pty Ltd and BDO (Australia) Ltd are members of BDO International Ltd, a UK company limited by guarantee, and form part of the international BDO network of independent member firms. Liability limited by a scheme approved under Professional Standards Legislation (other than for the acts or omissions of financial services licensees) in each State or Territory other than Tasmania.
For
per
sona
l use
onl
y

92 Independent Auditor’s Report
2010
Independent Auditor’s Report
Opinion
In our opinion:
(a) the financial report of Atlas South Sea Pearl Limited is in accordance with the Corporations Act 2001, including:
(i) giving a true and fair view of the consolidated entity’s financial position as at 31 December 2010 and of its performance for the
year ended on that date; and
(ii) complying with Australian Accounting Standards and the Corporations Regulations 2001; and
(b) the financial report also complies with International Financial Reporting Standards as disclosed in Note 1.
Report on the Remuneration Report
We have audited the Remuneration Report included in the Directors’ Report page 13 to 19 for the year ended 31 December 2010. The directors of the company are responsible for the preparation and presentation of the Remuneration Report in accordance with section 300A of the Corporations Act 2001. Our responsibility is to express an opinion on the Remuneration Report, based on our audit conducted in accordance with Australian Auditing Standards.
Opinion
In our opinion, the Remuneration Report of Atlas South Sea Pearl Limited for the year ended 31 December 2010 complies with section 300A of the Corporations Act 2001.
BDO Audit (WA) Pty Ltd
Glyn O’Brien Director
Perth, Western Australia Dated this 31st day of March 2011
For
per
sona
l use
onl
y

93Shareholder Information
2010
Shareholder Information
Additional information required by the Australian Securities Exchange Limited Listing Rules and not disclosed elsewhere in this report is set out below.
Shareholdings (as at 15 March 2011)
Substantial shareholders
The number of shares held by substantial shareholders and their associates are set out below:
Shareholder Ordinary shares Percentage of Capital Held
Raintree Pearls and Perfumes Pty Ltd * 17,155,581 12.58%
Mr W G & Ms B M Martin ** 12,800,000 9.38%
Warman (Nominees) Pty Ltd 8,453,552 6.20%
* Includes shares held by SP & K Birkbeck Holdings Pty Ltd
** Includes shares held by Jingie Investments Pty Ltd
Voting rights
Ordinary shares
Refer to note 16
Distribution of shareholders – Ordinary Shares
Category Number of holders
1 - 1,000 125
1,001 – 5,000 557
5,001 – 10,000 425
10,001 – 100,000 965
100,001 and over 170
2,242
Number holdings less than a marketable parcel 568
For
per
sona
l use
onl
y

94 Shareholder Information
2010
Shareholder Information
Twenty largest shareholders
Number of ordinary shares held
Percentage of capital held
Raintree Pearls and Perfumes Pty Ltd 10,000,000 7.33
Mr W G & Ms B M Martin 10,000,000 7.33
Warman ( Nominees) Pty Ltd 8,453,552 6.20
SP & K Birkbeck Holdings Pty Ltd 7,155,581 5.25
Farjoy Pty Ltd 4,470,000 3.28
Mr C and Mrs B Carr 3,000,000 2.20
Dorran Pty Ltd 3,000,000 2.20
Jingie Investments Pty Ltd 2,800,000 2.05
Sharcon Pty Ltd 2,425,000 1.78
Capital Property Finance Pty Ltd 1,866,464 1.37
Forbar Custodians Limited 1,571,826 1.15
Arrow Pearl Co Pty Ltd 1,508,089 1.11
Five Talents Limited 1,418,879 1.04
Tenalga Pty Ltd 1,366,666 1.00
Nejeka Pty Limited 1,196,888 0.88
Citicorp Nominees Pty Ltd 1,141,962 0.84
Mr T J Martin and Mr W G Martin 1,000,000 0.73
JR & TC Stuart 1,000,000 0.73
Mr P F Murray 942,275 0.69
S.A.R Hoogenberg 866,666 0.64
65,183,848 47.80
Total number of shares on issue 136,358,097 (as at 15th March 2011)
Included in the shares on issue are 1,900,000 shares which are held in trust under the Employee Share Plan .The debt owed by the employees to the company for the purchase of these shares must be repaid in full before ownership of the shares can be transferred to the employees.
Other information
Atlas South Sea Pearl Limited, incorporated and domiciled in Australia, is a publicly listed company on the Australian Stock Exchange. The company’s home exchange in Australia is Perth.
There is currently no on-market buyback of the Company’s shares in place.
Company Secretary
Mrs Cecilia Anna Tyndall
For
per
sona
l use
onl
y
95Shareholder Information
2010
Shareholder Information
Registered Office
43 York Street
Subiaco
Western Australia 6008
Telephone: +61 8 9380 9444
Facsimile: +61 8 9380 9970
Share Registry
Computershare
Level 2, 45 St George’s Terrace
Perth
Western Australia 6000
Telephone: +61 8 9323 2000 or 1300 557 010 (from within Australia)
Facsimile: +61 8 9323 2033
For
per
sona
l use
onl
y

For
per
sona
l use
onl
y
43 York Street, Subiaco WA 6008 Australia
T +61 8 9380 9444 F +61 8 9380 9970 E [email protected]
www.atlassouthseapearl.com.au
S O U T H S E A P E A R L
For
per
sona
l use
onl
y