Embed Size (px)
Citation preview

SOUTH DAKOTA SALES and USE TAX REPORT
Figures compiled byThe South Dakota
Department of RevenuePierre, SD
COUNTY Statistics by Standard Industrial Classification (SIC) Major Group broken down by CITY
RETURNS FILED: JANUARY 2013
2. GROSS SALES: This is the amount reported on Line 1 of the South Dakota Sales and Use Tax Return.3. USE TAXABLE: This is the amount reported on Line 2 of the South Dakota Sales and Use Tax Return.
5. All figures are compiled by location zip code within a county. Some businesses may not be within City limits. These are State taxable figures only!
4. TAXABLE SALES: This is the amount of sales and use taxable sales subject to state tax or reservation tax.
6. Some cities may fall into more than one county.
ITEMS OF NOTE:
8. City, County, and State Totals include 'Other' categories.
7. Whenever there are less than 3 licenses in any one classification, the information is combined into an 'Other' category.
1. Report is NOT based on City tax collections or remittances. Report shows state taxable sales by zip code for each city.
9. No Contractors Excise taxes are included.
02/12/13Page 1SD Dept. of Revenue

SIC Division Gross Sales Use Taxable Taxable Sales
COUNTY Statistics by Standard Industrial Classification (SIC) Major Group broken down by CITYReturns Filed: January 2013
AURORACounty:Plankinton
Agriculture, Forestry, & Fishing 442,010.83 7,025.97 118,807.85AManufacturing 6,756.14 11,488.71 16,891.49DTransportation & Public Utilities 120,682.41 36.23 113,542.64EWholesale Trade 52,032.22 115.09 16,393.55FRetail Trade 2,684,886.36 1,844.64 467,057.51GFinance, Insurance, & Real Estate 10,285.20 2,191.55 6,280.89HServices 532,948.65 28,927.92 539,354.09I
Total for Plankinton 3,849,601.81 51,630.11 1,278,328.02Stickney
Agriculture, Forestry, & Fishing 105,460.76 0.00 12,410.76AWholesale Trade 2,785,722.07 5,714.09 85,457.48FRetail Trade 338,614.26 215.96 146,066.00GServices 628,475.48 3,908.61 320,630.89IOther 5,460.71 861.61 6,223.00
Total for Stickney 3,863,733.28 10,700.26 570,788.13White Lake
Agriculture, Forestry, & Fishing 267,495.77 47,078.85 314,574.62AWholesale Trade 274,483.65 2,562.54 38,364.90FRetail Trade 137,772.58 1,046.19 119,491.66GServices 913,444.44 4,372.62 232,780.76IOther 28,543.94 14.16 28,008.32
Total for White Lake 1,621,740.38 55,074.36 733,220.26Other Cities
Other 32,408.82 0.00 25,551.00
Total for Other Cities 32,408.82 0.00 25,551.00
Total for AURORA County 9,367,484.29 117,404.74 2,607,887.41
**************************************************************** COUNTY RECAP ***************************************************************
****************************************************************************************************************************************************
AuroraCounty:Agriculture, Forestry, & Fishing 814,967.36 54,104.82 445,793.23AManufacturing 13,130.86 12,347.32 23,475.71DTransportation & Public Utilities 128,778.74 53.40 121,656.14EWholesale Trade 3,119,095.77 8,391.72 140,215.93FRetail Trade 3,169,299.03 3,106.79 740,641.00GFinance, Insurance, & Real Estate 10,285.20 2,191.55 6,280.89HServices 2,086,625.74 37,209.15 1,104,522.91IOther N/A N/A N/A
Total for Aurora County 9,367,484.29 117,404.74 2,607,887.41
02/12/13Page 2SD Dept. of Revenue

SIC Division Gross Sales Use Taxable Taxable Sales
COUNTY Statistics by Standard Industrial Classification (SIC) Major Group broken down by CITYReturns Filed: January 2013
BEADLECounty:Cavour
Transportation & Public Utilities 3,998.18 24.61 3,913.00EWholesale Trade 5,418.92 0.22 30.35FRetail Trade 434,776.48 338.24 85,387.95GServices 825,969.62 1,614.74 589,055.24IOther N/A N/A N/A
Total for Cavour 1,270,163.20 7,838.81 684,247.54Hitchcock
Agriculture, Forestry, & Fishing 5,504.58 0.00 5,504.58ATransportation & Public Utilities 9,903.37 59.30 9,707.60EWholesale Trade 8,048.65 26.30 3,940.60FRetail Trade 39,392.51 589.73 33,862.22GServices 49,946.90 0.00 27,282.98IOther 4,393.80 93.02 2,492.96
Total for Hitchcock 117,189.80 768.34 82,790.94Huron
Agriculture, Forestry, & Fishing 1,083,696.90 37,494.17 324,691.20AConstruction 41,865.69 0.00 14,784.14CManufacturing 32,844,747.74 502,274.69 1,210,513.75DTransportation & Public Utilities 3,723,481.28 94,673.48 2,892,874.28EWholesale Trade 12,224,985.52 44,205.84 952,682.64FRetail Trade 38,842,531.86 103,259.67 17,885,039.83GFinance, Insurance, & Real Estate 510,126.38 1,906.04 399,819.43HServices 6,534,540.21 61,161.50 2,809,262.12IOther N/A N/A N/A
Total for Huron 95,878,549.32 847,698.72 26,518,705.31Virgil
Services 32,551.80 0.00 32,551.80IOther N/A N/A N/A
Total for Virgil 33,651.80 0.00 33,651.80Wessington
Agriculture, Forestry, & Fishing 20,502.00 0.00 20,502.00ATransportation & Public Utilities 4,582.22 24.13 3,804.20EWholesale Trade 66,100.78 4,296.84 60,563.88FRetail Trade 977,295.16 711.08 309,317.40GServices 301,919.25 8,656.51 77,047.02IOther N/A N/A N/A
Total for Wessington 1,385,223.50 13,785.58 484,029.61Wolsey
Transportation & Public Utilities 17,041.24 113.69 16,326.23EWholesale Trade 1,121,736.31 453.00 30,396.80FRetail Trade 1,037,116.63 296.71 189,029.35GServices 79,660.37 80.59 79,052.72IOther 6,181.13 970.37 3,909.83
Total for Wolsey 2,261,735.69 1,914.36 318,714.93Yale
Transportation & Public Utilities 2,641.58 5.99 2,021.00ERetail Trade 34,299.49 234.24 19,091.62GServices 495.83 8.14 489.60IOther 2,156,401.84 9,516.20 106,134.29
Total for Yale 2,193,838.74 9,764.57 127,736.51
02/12/13Page 3SD Dept. of Revenue

SIC Division Gross Sales Use Taxable Taxable Sales
COUNTY Statistics by Standard Industrial Classification (SIC) Major Group broken down by CITYReturns Filed: January 2013
Other CitiesRetail Trade 59,560.21 9,660.09 42,328.01GServices 19,659.45 38.48 19,697.93IOther 14,016.33 0.00 14,016.33
Total for Other Cities 93,235.99 9,698.57 76,042.27
Total for BEADLE County 103,233,588.04 891,468.95 28,325,918.91
**************************************************************** COUNTY RECAP ***************************************************************
****************************************************************************************************************************************************
BeadleCounty:Agriculture, Forestry, & Fishing 1,122,918.48 43,355.17 369,773.78AConstruction 41,865.69 0.00 14,784.14CManufacturing 32,858,406.87 502,614.04 1,217,152.18DTransportation & Public Utilities 3,761,647.87 94,901.20 2,928,646.31EWholesale Trade 15,584,593.36 58,498.40 1,155,649.89FRetail Trade 41,424,972.33 115,089.77 18,564,056.38GFinance, Insurance, & Real Estate 521,866.28 2,727.10 412,378.90HServices 7,844,743.43 71,559.97 3,634,439.41IOther N/A N/A N/A
Total for Beadle County 103,233,588.04 891,468.95 28,325,918.91
02/12/13Page 4SD Dept. of Revenue
SIC Division Gross Sales Use Taxable Taxable Sales
COUNTY Statistics by Standard Industrial Classification (SIC) Major Group broken down by CITYReturns Filed: January 2013
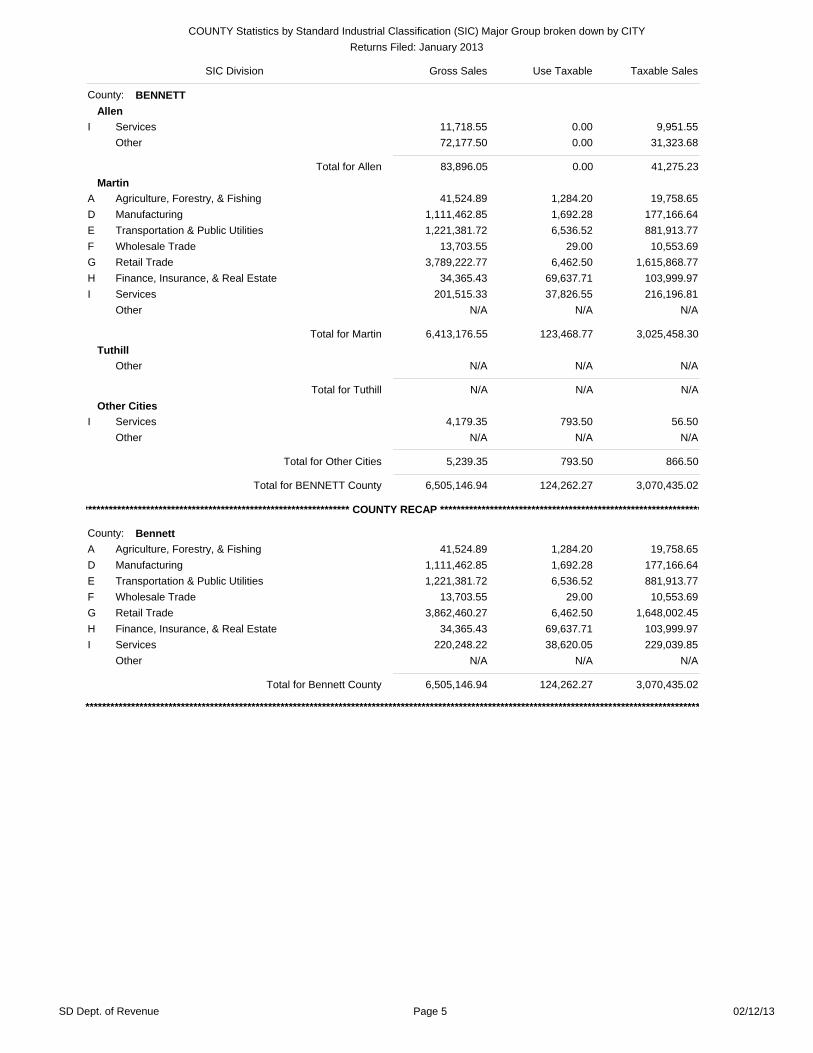
BENNETTCounty:Allen
Services 11,718.55 0.00 9,951.55IOther 72,177.50 0.00 31,323.68
Total for Allen 83,896.05 0.00 41,275.23Martin
Agriculture, Forestry, & Fishing 41,524.89 1,284.20 19,758.65AManufacturing 1,111,462.85 1,692.28 177,166.64DTransportation & Public Utilities 1,221,381.72 6,536.52 881,913.77EWholesale Trade 13,703.55 29.00 10,553.69FRetail Trade 3,789,222.77 6,462.50 1,615,868.77GFinance, Insurance, & Real Estate 34,365.43 69,637.71 103,999.97HServices 201,515.33 37,826.55 216,196.81IOther N/A N/A N/A
Total for Martin 6,413,176.55 123,468.77 3,025,458.30Tuthill
Other N/A N/A N/A
Total for Tuthill N/A N/A N/AOther Cities
Services 4,179.35 793.50 56.50IOther N/A N/A N/A
Total for Other Cities 5,239.35 793.50 866.50
Total for BENNETT County 6,505,146.94 124,262.27 3,070,435.02
**************************************************************** COUNTY RECAP ***************************************************************
****************************************************************************************************************************************************
BennettCounty:Agriculture, Forestry, & Fishing 41,524.89 1,284.20 19,758.65AManufacturing 1,111,462.85 1,692.28 177,166.64DTransportation & Public Utilities 1,221,381.72 6,536.52 881,913.77EWholesale Trade 13,703.55 29.00 10,553.69FRetail Trade 3,862,460.27 6,462.50 1,648,002.45GFinance, Insurance, & Real Estate 34,365.43 69,637.71 103,999.97HServices 220,248.22 38,620.05 229,039.85IOther N/A N/A N/A
Total for Bennett County 6,505,146.94 124,262.27 3,070,435.02
02/12/13Page 5SD Dept. of Revenue

SIC Division Gross Sales Use Taxable Taxable Sales
COUNTY Statistics by Standard Industrial Classification (SIC) Major Group broken down by CITYReturns Filed: January 2013
BON HOMMECounty:Avon
Manufacturing 6,772.86 1.92 244.92DTransportation & Public Utilities 21,128.77 143.06 21,271.83EWholesale Trade 748,957.96 96.81 133,648.53FRetail Trade 482,512.02 38,394.48 415,170.96GServices 189,101.13 514.56 166,998.19IOther 24,973.00 1,773.83 20,446.83
Total for Avon 1,473,445.74 40,924.67 757,781.26Scotland
Manufacturing 2,477,878.29 60,824.92 145,782.20DTransportation & Public Utilities 11,517.96 64.48 11,575.14EWholesale Trade 48,577.11 88.77 18,005.62FRetail Trade 864,051.86 2,998.57 472,907.27GServices 92,668.14 1,774.87 83,016.45IOther N/A N/A N/A
Total for Scotland 3,504,437.40 65,751.61 738,376.39Springfield
Agriculture, Forestry, & Fishing 0.00 0.00 0.00AManufacturing 135,898.55 7,201.86 101,578.74DTransportation & Public Utilities 6,124.80 65.20 6,190.00EWholesale Trade 1,119,667.35 19.13 52,824.32FRetail Trade 873,665.35 851.51 361,499.88GServices 248,853.62 3,799.65 206,781.71IOther N/A N/A N/A
Total for Springfield 2,384,346.91 11,937.34 729,011.90Tabor
Transportation & Public Utilities 719,113.61 29,747.48 658,451.75EWholesale Trade 94,630.61 41.01 4,352.83FRetail Trade 205,852.65 35,237.25 159,937.01GServices 115,253.73 365.78 71,405.70IOther 17,442.18 0.00 5,178.48
Total for Tabor 1,152,292.78 65,391.52 899,325.77Tyndall
Agriculture, Forestry, & Fishing 3,700.00 0.00 3,700.00AManufacturing 76,112.31 63.89 2,084.00DTransportation & Public Utilities 135,470.55 90.31 90,102.14EWholesale Trade 16,949.03 13.32 9,645.58FRetail Trade 2,717,322.00 5,378.10 670,490.25GServices 545,115.33 6,435.54 178,083.52IOther N/A N/A N/A
Total for Tyndall 3,524,123.39 11,981.17 966,438.31Other Cities
Other N/A N/A N/A
Total for Other Cities N/A N/A N/A
02/12/13Page 6SD Dept. of Revenue
SIC Division Gross Sales Use Taxable Taxable Sales
COUNTY Statistics by Standard Industrial Classification (SIC) Major Group broken down by CITYReturns Filed: January 2013
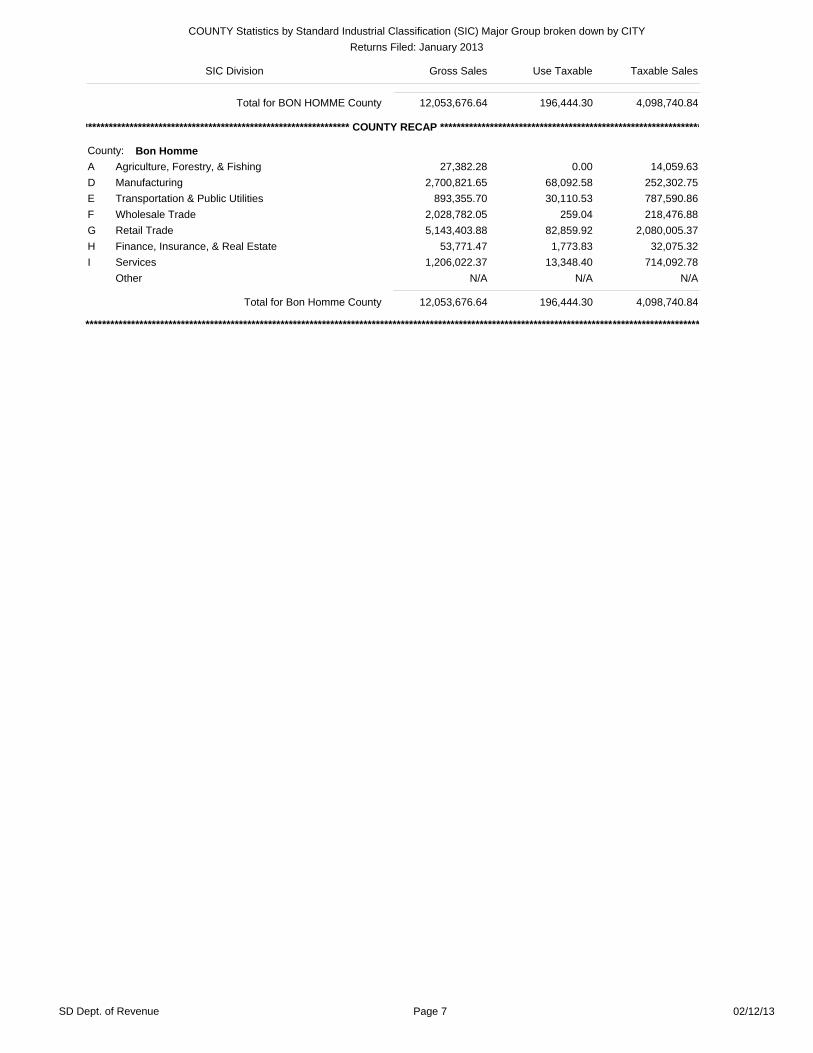
Total for BON HOMME County 12,053,676.64 196,444.30 4,098,740.84
**************************************************************** COUNTY RECAP ***************************************************************
****************************************************************************************************************************************************
Bon HommeCounty:Agriculture, Forestry, & Fishing 27,382.28 0.00 14,059.63AManufacturing 2,700,821.65 68,092.58 252,302.75DTransportation & Public Utilities 893,355.70 30,110.53 787,590.86EWholesale Trade 2,028,782.05 259.04 218,476.88FRetail Trade 5,143,403.88 82,859.92 2,080,005.37GFinance, Insurance, & Real Estate 53,771.47 1,773.83 32,075.32HServices 1,206,022.37 13,348.40 714,092.78IOther N/A N/A N/A
Total for Bon Homme County 12,053,676.64 196,444.30 4,098,740.84
02/12/13Page 7SD Dept. of Revenue

SIC Division Gross Sales Use Taxable Taxable Sales
COUNTY Statistics by Standard Industrial Classification (SIC) Major Group broken down by CITYReturns Filed: January 2013
BROOKINGSCounty:Aurora
Transportation & Public Utilities 62,513.47 235.82 61,570.69EWholesale Trade 83,186.90 833.34 17,146.33FRetail Trade 221,316.24 1,482.08 131,052.91GServices 118,432.45 293.21 98,711.66IOther 33,989,579.49 2,074,435.47 2,082,199.78
Total for Aurora 34,475,028.55 2,077,279.93 2,390,681.37Brookings
Agriculture, Forestry, & Fishing 757,269.84 676.85 300,676.68AConstruction 35,134.69 0.00 22,390.74CManufacturing 18,630,525.13 7,888,378.49 8,317,606.66DTransportation & Public Utilities 5,288,754.69 496,438.99 3,568,739.33EWholesale Trade 3,593,880.78 51,589.82 1,186,187.27FRetail Trade 44,205,970.36 210,312.39 30,507,163.51GFinance, Insurance, & Real Estate 1,031,431.68 103,431.64 764,539.30HServices 9,109,222.71 333,900.13 5,826,904.34IOther N/A N/A N/A
Total for Brookings 82,652,189.89 9,084,728.31 50,494,207.83Bruce
Agriculture, Forestry, & Fishing 15,313.38 112,731.84 128,045.22ATransportation & Public Utilities 41,875.97 191.84 35,175.05EWholesale Trade 328,059.38 679.21 8,387.72FRetail Trade 216,874.52 77.52 178,794.12GServices 65,419.65 0.00 48,794.24IOther N/A N/A N/A
Total for Bruce 667,542.91 117,460.32 402,976.25Elkton
Manufacturing 1,556,634.52 9,845.93 14,593.45DTransportation & Public Utilities 27,634.31 38,702.16 65,684.86EWholesale Trade 1,792,475.76 9,269.45 64,356.64FRetail Trade 788,256.54 37,721.55 490,530.18GServices 160,984.96 203,211.59 249,503.95IOther 8,504.25 61,266.31 69,770.56
Total for Elkton 4,334,490.34 360,016.99 954,439.64Sinai
Retail Trade 2,070.78 202.50 1,553.28GOther 1,356,040.49 0.00 10,326.51
Total for Sinai 1,358,111.27 202.50 11,879.79Volga
Agriculture, Forestry, & Fishing 100,309.84 8,770.78 108,173.08AManufacturing 175,940.05 109,619.54 143,294.24DTransportation & Public Utilities 1,485,665.70 1,028.77 399,384.96EWholesale Trade 1,212,046.37 5,637.57 59,356.15FRetail Trade 1,503,274.88 1,306.38 476,298.34GServices 464,620.50 13,241.78 218,035.01IOther 14,418.62 0.00 14,417.32
Total for Volga 4,956,275.97 139,604.81 1,418,959.10
02/12/13Page 8SD Dept. of Revenue

SIC Division Gross Sales Use Taxable Taxable Sales
COUNTY Statistics by Standard Industrial Classification (SIC) Major Group broken down by CITYReturns Filed: January 2013
WhiteAgriculture, Forestry, & Fishing 37,211.94 59,622.21 95,832.57AManufacturing 1,231.41 2,705.73 3,167.64DTransportation & Public Utilities 51,221.58 141.43 46,483.93EWholesale Trade 164,025.55 1,787.67 21,749.43FRetail Trade 610,363.19 10,731.83 203,034.94GServices 131,993.98 13,582.98 120,438.12I
Total for White 996,047.65 88,571.84 490,706.63Other Cities
Agriculture, Forestry, & Fishing 162,716.09 0.00 144,295.69ARetail Trade 21,786.41 270.13 18,768.08GServices 43,452.07 0.00 41,856.67IOther N/A N/A N/A
Total for Other Cities 227,954.57 86,869.99 291,520.30
Total for BROOKINGS County 129,667,641.14 11,954,734.69 56,455,370.91
**************************************************************** COUNTY RECAP ***************************************************************
****************************************************************************************************************************************************
BrookingsCounty:Agriculture, Forestry, & Fishing 1,092,217.98 238,049.08 852,667.53AConstruction 39,460.22 0.00 26,716.27CManufacturing 54,346,162.46 10,084,737.76 10,552,866.24DTransportation & Public Utilities 6,957,665.73 623,338.87 4,263,638.68EWholesale Trade 8,521,618.73 69,797.06 1,359,413.54FRetail Trade 47,569,912.92 262,104.39 32,007,195.36GFinance, Insurance, & Real Estate 1,046,476.78 112,477.85 788,629.30HServices 10,094,126.33 564,229.69 6,604,243.99IOther N/A N/A N/A
Total for Brookings County 129,667,641.14 11,954,734.69 56,455,370.91
02/12/13Page 9SD Dept. of Revenue

SIC Division Gross Sales Use Taxable Taxable Sales
COUNTY Statistics by Standard Industrial Classification (SIC) Major Group broken down by CITYReturns Filed: January 2013
BROWNCounty:Aberdeen
Agriculture, Forestry, & Fishing 343,697.99 5,892.16 257,418.38AConstruction 122,360.95 0.00 100,147.69CManufacturing 31,789,094.91 1,350,772.96 2,613,124.17DTransportation & Public Utilities 5,336,171.16 197,988.50 2,413,067.89EWholesale Trade 27,546,998.41 78,184.89 3,968,376.98FRetail Trade 151,382,183.15 620,371.00 54,580,899.80GFinance, Insurance, & Real Estate 1,636,754.62 36,203.10 1,471,244.29HServices 19,532,569.52 708,344.21 9,649,228.71IOther 31,788.05 13,013.34 21,280.59
Total for Aberdeen 237,721,618.76 3,010,770.16 75,074,788.50Barnard
Other N/A N/A N/A
Total for Barnard N/A N/A N/ABath
Retail Trade 517,130.35 15.00 91,579.44GServices 335,579.00 184.08 107,990.49IOther 2,650,369.17 -74,464.41 2,228,942.94
Total for Bath 3,503,078.52 -74,265.33 2,428,512.87Claremont
Retail Trade 83,614.13 3,476.79 30,469.87GServices 46,212.22 0.00 24,271.58IOther N/A N/A N/A
Total for Claremont 129,826.35 3,476.79 54,741.45Columbia
Retail Trade 21,111.70 1,180.10 22,291.80GServices 150,044.14 392.17 141,596.90IOther N/A N/A N/A
Total for Columbia 179,514.09 1,572.27 172,246.95Ferney
Other 1,673,460.23 12,603.92 660,959.51
Total for Ferney 1,673,460.23 12,603.92 660,959.51Frederick
Transportation & Public Utilities 5,841.34 44.66 5,799.00EWholesale Trade 14,411,508.35 9.23 3,170.18FRetail Trade 53,416.65 409.63 51,620.97GServices 390,485.72 75.85 385,699.11IOther 180,811.46 255.03 110,260.48
Total for Frederick 15,042,063.52 794.41 556,549.74Groton
Agriculture, Forestry, & Fishing 156,701.75 1,889.30 147,182.05AManufacturing 1,929,504.27 50,972.20 55,670.56DTransportation & Public Utilities 689,424.34 9,494.35 634,049.83EWholesale Trade 60,692.15 274.92 36,466.48FRetail Trade 4,824,328.75 9,876.13 1,224,796.04GFinance, Insurance, & Real Estate 4,167.00 0.00 4,163.15HServices 535,281.61 12,948.67 312,337.58IOther N/A N/A N/A
Total for Groton 8,226,102.54 85,455.57 2,427,319.68
02/12/13Page 10SD Dept. of Revenue

SIC Division Gross Sales Use Taxable Taxable Sales
COUNTY Statistics by Standard Industrial Classification (SIC) Major Group broken down by CITYReturns Filed: January 2013
HeclaAgriculture, Forestry, & Fishing 731,856.03 401.50 14,340.63ATransportation & Public Utilities 108,255.53 10.44 36,856.49EWholesale Trade 867,259.69 4.90 1,155.48FRetail Trade 461,150.84 4,253.27 292,352.89GServices 50,198.74 109.21 37,672.78IOther N/A N/A N/A
Total for Hecla 2,220,508.57 4,779.31 382,528.27Houghton
Other 129,571.52 26,000.00 63,069.24
Total for Houghton 129,571.52 26,000.00 63,069.24Mansfield
Retail Trade 39,368.29 103.00 866.50GServices 3,511.00 0.00 3,511.00IOther N/A N/A N/A
Total for Mansfield 408,287.29 103.00 4,453.50Stratford
Retail Trade 26,862.15 290.49 18,732.87GServices 652,546.75 56.55 110,922.79IOther N/A N/A N/A
Total for Stratford 692,865.27 351.05 141,916.04Warner
Transportation & Public Utilities 29,565.83 1,925.22 29,311.83EWholesale Trade 64,945.00 948.19 7,459.85FRetail Trade 86,773.14 34.67 40,998.36GServices 51,722.10 173.27 44,469.86IOther 2,608.80 17.26 541.00
Total for Warner 235,614.86 3,098.61 122,780.90Westport
Retail Trade 122,447.20 511.53 36,485.57GServices 14,497.82 0.00 14,415.82IOther N/A N/A N/A
Total for Westport 136,945.02 511.53 50,901.39Other Cities
Retail Trade 22,839.87 0.00 5,476.87GServices 87,110.89 27.00 87,072.89IOther N/A N/A N/A
Total for Other Cities 294,213.41 27.00 276,812.41
02/12/13Page 11SD Dept. of Revenue

SIC Division Gross Sales Use Taxable Taxable Sales
COUNTY Statistics by Standard Industrial Classification (SIC) Major Group broken down by CITYReturns Filed: January 2013
Total for BROWN County 271,337,569.96 3,442,298.55 83,528,500.69
**************************************************************** COUNTY RECAP ***************************************************************
****************************************************************************************************************************************************
BrownCounty:Agriculture, Forestry, & Fishing 1,565,698.44 8,423.11 732,449.32AConstruction 148,363.62 0.00 112,801.68CManufacturing 34,243,234.38 1,401,777.31 2,820,527.89DTransportation & Public Utilities 8,479,133.86 135,002.78 5,232,416.13EWholesale Trade 43,316,811.59 79,422.13 4,016,704.97FRetail Trade 160,059,776.66 1,046,145.78 58,195,640.94GFinance, Insurance, & Real Estate 1,643,003.84 36,203.10 1,477,489.66HServices 21,849,759.51 722,311.00 10,919,189.51IOther 31,788.05 13,013.34 21,280.59
Total for Brown County 271,337,569.96 3,442,298.55 83,528,500.69
02/12/13Page 12SD Dept. of Revenue

SIC Division Gross Sales Use Taxable Taxable Sales
COUNTY Statistics by Standard Industrial Classification (SIC) Major Group broken down by CITYReturns Filed: January 2013
BRULECounty:Chamberlain
Agriculture, Forestry, & Fishing 975,146.91 780.00 287,832.63AManufacturing 156,823.44 37.76 89,761.66DTransportation & Public Utilities 143,490.71 982.97 128,647.97EWholesale Trade 753,184.34 2,655.55 102,697.13FRetail Trade 12,043,654.41 16,832.51 7,212,899.78GFinance, Insurance, & Real Estate 65,822.73 0.00 29,322.30HServices 1,391,267.90 34,526.94 1,153,407.03IOther N/A N/A N/A
Total for Chamberlain 15,531,505.44 55,815.73 9,006,683.50Kimball
Agriculture, Forestry, & Fishing 656,896.64 38,574.82 687,398.31AManufacturing 34,082.43 11.56 2,351.18DTransportation & Public Utilities 562,196.36 76,006.46 565,538.37EWholesale Trade 769,186.91 220,415.49 298,833.35FRetail Trade 1,144,907.69 29,004.31 495,165.49GServices 714,778.73 11,990.52 515,624.21IOther N/A N/A N/A
Total for Kimball 4,017,703.07 376,663.16 2,595,522.72Pukwana
Agriculture, Forestry, & Fishing 117,210.02 0.00 81,288.77ARetail Trade 484,897.90 15,246.43 76,415.26GServices 44,529.63 243.98 39,448.86IOther N/A N/A N/A
Total for Pukwana 698,714.09 15,490.41 213,782.23Other Cities
Retail Trade 2,671.00 0.00 1,681.60GServices 121,852.41 0.00 121,852.41IOther N/A N/A N/A
Total for Other Cities 124,523.41 600.00 124,134.01
Total for BRULE County 20,372,446.01 448,569.30 11,940,122.46
**************************************************************** COUNTY RECAP ***************************************************************
****************************************************************************************************************************************************
BruleCounty:Agriculture, Forestry, & Fishing 1,749,253.57 39,354.82 1,056,519.71AManufacturing 190,905.87 49.32 92,112.84DTransportation & Public Utilities 757,763.61 76,989.43 710,815.68EWholesale Trade 1,522,371.25 223,071.05 401,530.48FRetail Trade 13,676,131.01 61,083.25 7,786,162.13GFinance, Insurance, & Real Estate 65,822.73 600.00 29,922.30HServices 2,272,428.67 46,761.44 1,830,332.51IOther 137,769.31 660.00 32,726.81
Total for Brule County 20,372,446.01 448,569.30 11,940,122.46
02/12/13Page 13SD Dept. of Revenue

SIC Division Gross Sales Use Taxable Taxable Sales
COUNTY Statistics by Standard Industrial Classification (SIC) Major Group broken down by CITYReturns Filed: January 2013
BUFFALOCounty:Fort Thompson
Services 114,499.39 0.00 111,591.12IOther N/A N/A N/A
Total for Fort Thompson 690,180.36 0.00 433,741.12Gann Valley
Other 3,203.26 0.00 3,203.26
Total for Gann Valley 3,203.26 0.00 3,203.26Other Cities
Services 86,699.67 0.00 84,534.67IOther N/A N/A N/A
Total for Other Cities 86,699.67 0.00 84,534.67
Total for BUFFALO County 780,083.29 0.00 521,479.05
**************************************************************** COUNTY RECAP ***************************************************************
****************************************************************************************************************************************************
BuffaloCounty:Retail Trade 576,224.23 0.00 322,693.26GServices 203,859.06 0.00 198,785.79IOther N/A N/A N/A
Total for Buffalo County 780,083.29 0.00 521,479.05
02/12/13Page 14SD Dept. of Revenue
SIC Division Gross Sales Use Taxable Taxable Sales
COUNTY Statistics by Standard Industrial Classification (SIC) Major Group broken down by CITYReturns Filed: January 2013
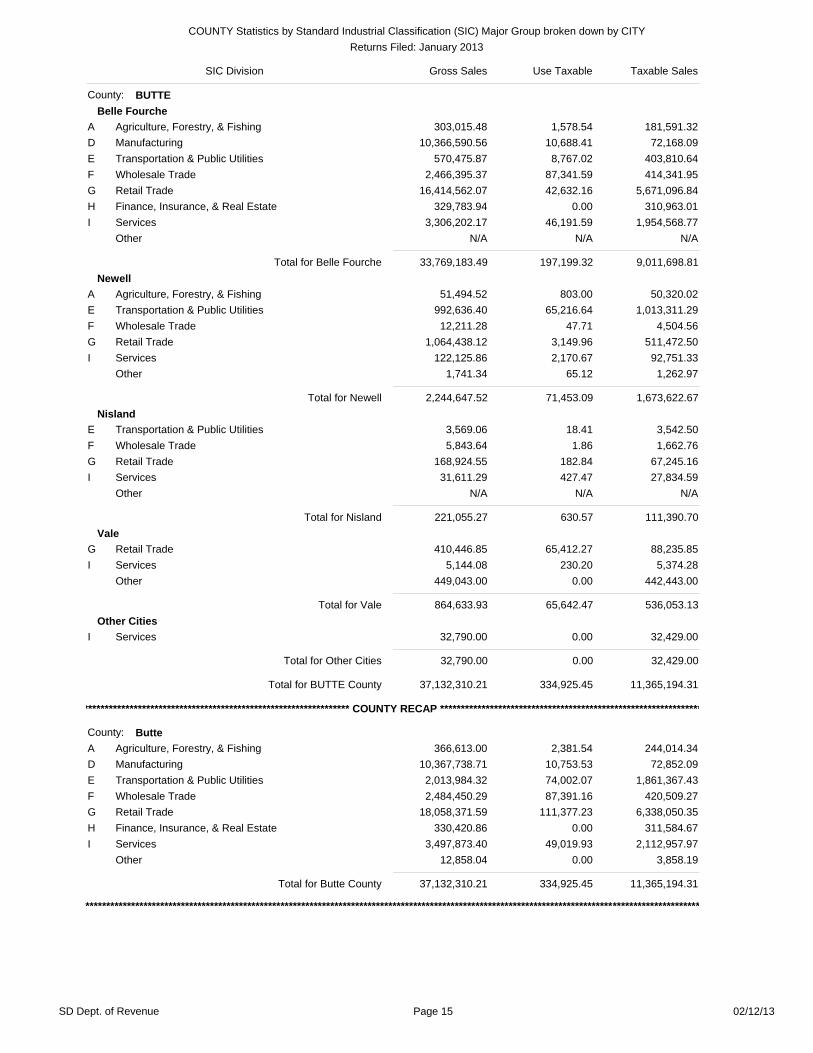
BUTTECounty:Belle Fourche
Agriculture, Forestry, & Fishing 303,015.48 1,578.54 181,591.32AManufacturing 10,366,590.56 10,688.41 72,168.09DTransportation & Public Utilities 570,475.87 8,767.02 403,810.64EWholesale Trade 2,466,395.37 87,341.59 414,341.95FRetail Trade 16,414,562.07 42,632.16 5,671,096.84GFinance, Insurance, & Real Estate 329,783.94 0.00 310,963.01HServices 3,306,202.17 46,191.59 1,954,568.77IOther N/A N/A N/A
Total for Belle Fourche 33,769,183.49 197,199.32 9,011,698.81Newell
Agriculture, Forestry, & Fishing 51,494.52 803.00 50,320.02ATransportation & Public Utilities 992,636.40 65,216.64 1,013,311.29EWholesale Trade 12,211.28 47.71 4,504.56FRetail Trade 1,064,438.12 3,149.96 511,472.50GServices 122,125.86 2,170.67 92,751.33IOther 1,741.34 65.12 1,262.97
Total for Newell 2,244,647.52 71,453.09 1,673,622.67Nisland
Transportation & Public Utilities 3,569.06 18.41 3,542.50EWholesale Trade 5,843.64 1.86 1,662.76FRetail Trade 168,924.55 182.84 67,245.16GServices 31,611.29 427.47 27,834.59IOther N/A N/A N/A
Total for Nisland 221,055.27 630.57 111,390.70Vale
Retail Trade 410,446.85 65,412.27 88,235.85GServices 5,144.08 230.20 5,374.28IOther 449,043.00 0.00 442,443.00
Total for Vale 864,633.93 65,642.47 536,053.13Other Cities
Services 32,790.00 0.00 32,429.00I
Total for Other Cities 32,790.00 0.00 32,429.00
Total for BUTTE County 37,132,310.21 334,925.45 11,365,194.31
**************************************************************** COUNTY RECAP ***************************************************************
****************************************************************************************************************************************************
ButteCounty:Agriculture, Forestry, & Fishing 366,613.00 2,381.54 244,014.34AManufacturing 10,367,738.71 10,753.53 72,852.09DTransportation & Public Utilities 2,013,984.32 74,002.07 1,861,367.43EWholesale Trade 2,484,450.29 87,391.16 420,509.27FRetail Trade 18,058,371.59 111,377.23 6,338,050.35GFinance, Insurance, & Real Estate 330,420.86 0.00 311,584.67HServices 3,497,873.40 49,019.93 2,112,957.97IOther 12,858.04 0.00 3,858.19
Total for Butte County 37,132,310.21 334,925.45 11,365,194.31
02/12/13Page 15SD Dept. of Revenue

SIC Division Gross Sales Use Taxable Taxable Sales
COUNTY Statistics by Standard Industrial Classification (SIC) Major Group broken down by CITYReturns Filed: January 2013
CAMPBELLCounty:Herreid
Agriculture, Forestry, & Fishing 56,888.74 0.00 46,689.94AManufacturing 39,474.78 796.04 26,299.00DTransportation & Public Utilities 262,562.07 11,239.22 257,451.67EWholesale Trade 690,764.99 14,215.85 159,816.38FRetail Trade 1,458,428.39 18,465.18 768,553.70GServices 232,036.46 737.64 148,381.68IOther 31,159.30 0.00 13,568.32
Total for Herreid 2,771,314.73 45,453.93 1,420,760.69Mound City
Wholesale Trade 362,524.64 206.96 5,766.21FRetail Trade 48,182.78 409.73 29,546.13GServices 8,627.66 0.00 4,484.43IOther 816,548.03 5,153.67 10,471.70
Total for Mound City 1,235,883.12 5,770.36 50,268.47Pollock
Manufacturing 54,915.83 579,349.32 583,184.96DWholesale Trade 214,987.70 3,508.66 21,952.08FRetail Trade 316,879.35 372.61 224,492.00GServices 37,235.23 250.00 35,323.07IOther N/A N/A N/A
Total for Pollock 660,384.67 583,830.35 901,495.92Other Cities
Services 32,363.76 0.00 4,306.36I
Total for Other Cities 32,363.76 0.00 4,306.36
Total for CAMPBELL County 4,699,946.27 635,054.64 2,376,831.44
**************************************************************** COUNTY RECAP ***************************************************************
****************************************************************************************************************************************************
CampbellCounty:Agriculture, Forestry, & Fishing 839,110.74 5,141.05 51,830.99AManufacturing 98,270.61 580,145.36 609,483.96DTransportation & Public Utilities 304,732.66 11,601.59 299,326.13EWholesale Trade 1,268,277.34 17,931.48 187,534.67FRetail Trade 1,823,490.52 19,247.52 1,022,591.83GFinance, Insurance, & Real Estate 51,752.98 0.00 9,520.00HServices 310,263.11 987.64 192,495.54IOther N/A N/A N/A
Total for Campbell County 4,699,946.27 635,054.64 2,376,831.44
02/12/13Page 16SD Dept. of Revenue

SIC Division Gross Sales Use Taxable Taxable Sales
COUNTY Statistics by Standard Industrial Classification (SIC) Major Group broken down by CITYReturns Filed: January 2013
CHARLES MIXCounty:Dante
Retail Trade 28,093.45 100.00 26,006.98GServices 3,035.41 0.00 3,035.41IOther N/A N/A N/A
Total for Dante 36,214.86 100.00 34,128.39Geddes
Transportation & Public Utilities 6,208.47 4.97 6,213.44ERetail Trade 1,836,139.91 246.98 69,806.54GServices 25,651.50 11.92 25,189.02IOther N/A N/A N/A
Total for Geddes 15,313,448.14 263.86 102,826.33Lake Andes
Agriculture, Forestry, & Fishing 1,322,454.18 25.00 9,629.88ATransportation & Public Utilities 829,549.65 13,097.00 486,646.42EWholesale Trade 470,783.93 11,551.48 305,834.55FRetail Trade 612,508.44 12,164.26 260,824.58GFinance, Insurance, & Real Estate 3,030.98 0.00 3,026.84HServices 300,054.55 46,267.37 201,977.40IOther N/A N/A N/A
Total for Lake Andes 3,594,455.82 83,105.11 1,324,013.76Pickstown
Wholesale Trade 7,854.37 7.06 5,272.81FRetail Trade 108,910.04 21.16 82,789.15GServices 31,433.85 0.00 28,606.70IOther 8,180.02 81.28 8,069.50
Total for Pickstown 156,378.28 109.50 124,738.16Platte
Agriculture, Forestry, & Fishing 1,526,774.01 235,834.87 413,790.19AConstruction 19,631.60 0.00 19,631.60CManufacturing 11,638.93 134.23 9,710.33DTransportation & Public Utilities 54,206.26 90.92 48,454.46EWholesale Trade 41,093,340.56 57.62 197,276.58FRetail Trade 5,998,943.96 85,204.28 2,917,357.70GFinance, Insurance, & Real Estate 190,013.81 0.00 27,197.19HServices 3,628,363.82 69,180.16 1,181,957.86IOther N/A N/A N/A
Total for Platte 52,539,403.57 390,502.07 4,831,193.84Wagner
Agriculture, Forestry, & Fishing 92,670.32 0.00 92,570.32AManufacturing 51,178.74 12.50 8,385.84DTransportation & Public Utilities 564,597.28 57,379.05 520,262.65EWholesale Trade 902,172.59 971.33 118,046.81FRetail Trade 5,374,229.83 9,692.38 3,376,334.27GFinance, Insurance, & Real Estate 6,544.38 1,052.16 7,588.46HServices 528,841.22 35,749.64 497,389.11IOther N/A N/A N/A
Total for Wagner 7,542,464.36 104,857.07 4,636,926.06Other Cities
Services 15,918.00 0.00 15,918.00IOther 476,812.09 0.00 476,812.09
Total for Other Cities 492,730.09 0.00 492,730.09
02/12/13Page 17SD Dept. of Revenue

SIC Division Gross Sales Use Taxable Taxable Sales
COUNTY Statistics by Standard Industrial Classification (SIC) Major Group broken down by CITYReturns Filed: January 2013
Total for CHARLES MIX County 79,675,095.13 578,937.61 11,546,556.63
**************************************************************** COUNTY RECAP ***************************************************************
****************************************************************************************************************************************************
Charles MixCounty:Agriculture, Forestry, & Fishing 3,417,838.60 235,859.87 991,930.48AConstruction 42,726.60 0.00 36,845.20CManufacturing 63,662.67 146.73 18,941.17DTransportation & Public Utilities 1,467,663.08 70,653.21 1,074,572.47EWholesale Trade 55,919,064.75 12,587.49 627,528.08FRetail Trade 13,958,852.63 107,429.07 6,733,146.22GFinance, Insurance, & Real Estate 200,288.73 1,052.16 38,492.49HServices 4,533,298.35 151,209.08 1,954,073.50IOther N/A N/A N/A
Total for Charles Mix County 79,675,095.13 578,937.61 11,546,556.63
02/12/13Page 18SD Dept. of Revenue

SIC Division Gross Sales Use Taxable Taxable Sales
COUNTY Statistics by Standard Industrial Classification (SIC) Major Group broken down by CITYReturns Filed: January 2013
CLARKCounty:Bradley
Retail Trade 137,029.36 150.00 59,786.25GServices 48,003.09 288.42 18,360.84IOther N/A N/A N/A
Total for Bradley 187,540.45 438.42 80,655.09Carpenter
Retail Trade 30,430.24 96,213.73 125,357.60GServices 58,554.37 1,594.33 60,148.70IOther N/A N/A N/A
Total for Carpenter 91,010.11 121,232.71 210,956.45Clark
Agriculture, Forestry, & Fishing 275,190.07 113.98 234,076.28AManufacturing 1,191,270.23 70,186.03 89,871.19DTransportation & Public Utilities 187,766.98 1,654.36 87,336.00EWholesale Trade 1,275,695.47 154.98 140,691.85FRetail Trade 4,470,317.56 82,069.80 3,301,394.82GFinance, Insurance, & Real Estate 4,652.84 582.66 5,235.50HServices 997,639.28 21,453.40 633,831.28IOther N/A N/A N/A
Total for Clark 8,402,779.44 176,215.22 4,492,683.92Garden City
Other 241,517.44 43,906.45 139,761.64
Total for Garden City 241,517.44 43,906.45 139,761.64Raymond
Retail Trade 314,419.59 0.00 141,452.88GServices 9,697.11 0.00 9,697.11IOther N/A N/A N/A
Total for Raymond 329,905.86 0.00 156,939.15Vienna
Retail Trade 156,880.62 0.00 111,367.65GOther 136,862.86 1,053.59 69,819.57
Total for Vienna 293,743.48 1,053.59 181,187.22Willow Lake
Manufacturing 648,124.03 100.60 94,455.01DTransportation & Public Utilities 19,666.81 85.41 10,086.44EWholesale Trade 480,038.09 669.91 5,434.66FRetail Trade 1,214,669.40 212,996.17 628,647.52GServices 38,237.59 82.56 33,256.15IOther N/A N/A N/A
Total for Willow Lake 2,400,735.92 215,570.04 773,515.17Other Cities
Other 10,745.60 0.00 119.00
Total for Other Cities 10,745.60 0.00 119.00
02/12/13Page 19SD Dept. of Revenue

SIC Division Gross Sales Use Taxable Taxable Sales
COUNTY Statistics by Standard Industrial Classification (SIC) Major Group broken down by CITYReturns Filed: January 2013
Total for CLARK County 11,957,978.30 558,416.43 6,035,817.64
**************************************************************** COUNTY RECAP ***************************************************************
****************************************************************************************************************************************************
ClarkCounty:Agriculture, Forestry, & Fishing 285,993.89 24,695.74 269,461.86AManufacturing 1,841,419.77 70,764.91 186,829.98DTransportation & Public Utilities 225,943.36 1,739.77 115,932.01EWholesale Trade 1,858,835.06 1,585.64 147,436.51FRetail Trade 6,453,606.57 391,878.15 4,487,688.37GFinance, Insurance, & Real Estate 4,652.84 582.66 5,235.50HServices 1,287,279.81 67,169.55 822,986.41IOther N/A N/A N/A
Total for Clark County 11,957,978.30 558,416.43 6,035,817.64
02/12/13Page 20SD Dept. of Revenue

SIC Division Gross Sales Use Taxable Taxable Sales
COUNTY Statistics by Standard Industrial Classification (SIC) Major Group broken down by CITYReturns Filed: January 2013
CLAYCounty:Beresford
Other N/A N/A N/A
Total for Beresford N/A N/A N/ABurbank
Retail Trade 276,485.27 300.01 67,514.17GServices 43,020.32 0.00 479.00IOther 10,426.28 0.00 10,281.28
Total for Burbank 329,931.87 300.01 78,274.45Irene
Manufacturing 2,863.12 22.39 386.00DWholesale Trade 2,383.39 3.55 1,114.75FRetail Trade 226,347.03 2,227.51 81,695.71GServices 458,995.09 6,171.65 89,527.60IOther N/A N/A N/A
Total for Irene 743,468.48 8,908.25 224,256.43Vermillion
Agriculture, Forestry, & Fishing 119,177.22 105.00 118,962.22AConstruction 64,069.29 0.00 37,601.43CManufacturing 5,757,114.57 18,589.94 476,364.71DTransportation & Public Utilities 9,230,447.09 40,035.75 1,577,998.13EWholesale Trade 3,168,132.53 43,933.34 273,733.86FRetail Trade 11,640,229.27 90,493.79 7,601,228.04GFinance, Insurance, & Real Estate 225,766.60 26,370.74 246,688.36HServices 1,679,444.72 73,665.64 1,125,934.22IOther 3,480.00 0.00 0.00
Total for Vermillion 31,887,861.29 293,194.20 11,458,510.97Wakonda
Manufacturing 7,271.07 200.06 4,623.55DRetail Trade 110,104.98 584.39 59,282.05GServices 776,354.57 4,030.10 131,694.34IOther 5,728.49 7.08 3,878.45
Total for Wakonda 899,459.11 4,821.63 199,478.39Other Cities
Retail Trade 3,344,518.66 35.00 103,421.66GOther N/A N/A N/A
Total for Other Cities 3,394,938.66 35.00 103,841.66
Total for CLAY County 37,257,485.92 307,259.09 12,066,188.40
**************************************************************** COUNTY RECAP ***************************************************************
****************************************************************************************************************************************************
ClayCounty:Agriculture, Forestry, & Fishing 131,543.50 105.00 129,743.50AConstruction 66,704.29 0.00 40,236.43CManufacturing 5,767,798.76 18,812.38 481,924.26DTransportation & Public Utilities 9,283,967.31 40,525.53 1,630,177.50EWholesale Trade 3,171,029.04 43,937.34 274,945.06FRetail Trade 15,597,685.21 93,640.70 7,913,141.63GFinance, Insurance, & Real Estate 275,766.60 26,370.74 246,688.36HServices 2,959,511.21 83,867.39 1,349,331.66IOther 3,480.00 0.00 0.00
Total for Clay County 37,257,485.92 307,259.09 12,066,188.40
02/12/13Page 21SD Dept. of Revenue
SIC Division Gross Sales Use Taxable Taxable Sales
COUNTY Statistics by Standard Industrial Classification (SIC) Major Group broken down by CITYReturns Filed: January 2013
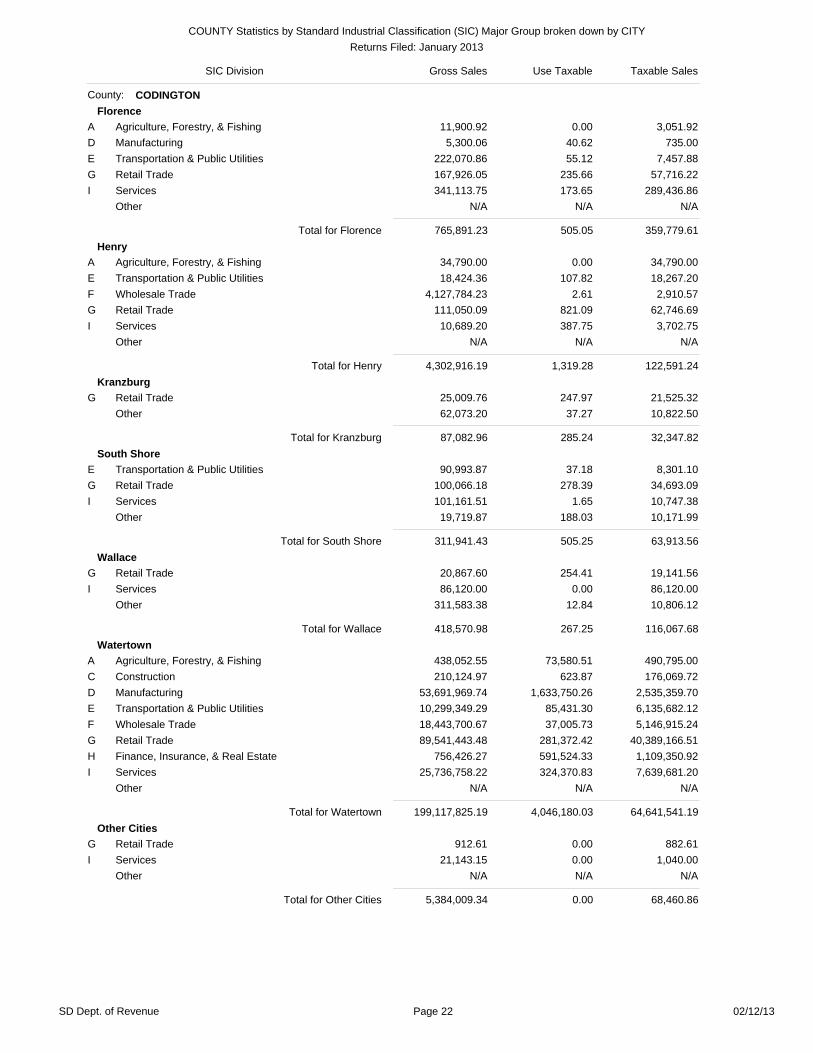
CODINGTONCounty:Florence
Agriculture, Forestry, & Fishing 11,900.92 0.00 3,051.92AManufacturing 5,300.06 40.62 735.00DTransportation & Public Utilities 222,070.86 55.12 7,457.88ERetail Trade 167,926.05 235.66 57,716.22GServices 341,113.75 173.65 289,436.86IOther N/A N/A N/A
Total for Florence 765,891.23 505.05 359,779.61Henry
Agriculture, Forestry, & Fishing 34,790.00 0.00 34,790.00ATransportation & Public Utilities 18,424.36 107.82 18,267.20EWholesale Trade 4,127,784.23 2.61 2,910.57FRetail Trade 111,050.09 821.09 62,746.69GServices 10,689.20 387.75 3,702.75IOther N/A N/A N/A
Total for Henry 4,302,916.19 1,319.28 122,591.24Kranzburg
Retail Trade 25,009.76 247.97 21,525.32GOther 62,073.20 37.27 10,822.50
Total for Kranzburg 87,082.96 285.24 32,347.82South Shore
Transportation & Public Utilities 90,993.87 37.18 8,301.10ERetail Trade 100,066.18 278.39 34,693.09GServices 101,161.51 1.65 10,747.38IOther 19,719.87 188.03 10,171.99
Total for South Shore 311,941.43 505.25 63,913.56Wallace
Retail Trade 20,867.60 254.41 19,141.56GServices 86,120.00 0.00 86,120.00IOther 311,583.38 12.84 10,806.12
Total for Wallace 418,570.98 267.25 116,067.68Watertown
Agriculture, Forestry, & Fishing 438,052.55 73,580.51 490,795.00AConstruction 210,124.97 623.87 176,069.72CManufacturing 53,691,969.74 1,633,750.26 2,535,359.70DTransportation & Public Utilities 10,299,349.29 85,431.30 6,135,682.12EWholesale Trade 18,443,700.67 37,005.73 5,146,915.24FRetail Trade 89,541,443.48 281,372.42 40,389,166.51GFinance, Insurance, & Real Estate 756,426.27 591,524.33 1,109,350.92HServices 25,736,758.22 324,370.83 7,639,681.20IOther N/A N/A N/A
Total for Watertown 199,117,825.19 4,046,180.03 64,641,541.19Other Cities
Retail Trade 912.61 0.00 882.61GServices 21,143.15 0.00 1,040.00IOther N/A N/A N/A
Total for Other Cities 5,384,009.34 0.00 68,460.86
02/12/13Page 22SD Dept. of Revenue

SIC Division Gross Sales Use Taxable Taxable Sales
COUNTY Statistics by Standard Industrial Classification (SIC) Major Group broken down by CITYReturns Filed: January 2013
Total for CODINGTON County 210,388,237.31 4,049,062.09 65,404,701.96
**************************************************************** COUNTY RECAP ***************************************************************
****************************************************************************************************************************************************
CodingtonCounty:Agriculture, Forestry, & Fishing 5,847,162.05 73,580.51 595,640.17AConstruction 218,880.97 623.87 183,626.72CManufacturing 53,708,015.70 1,633,973.19 2,538,437.70DTransportation & Public Utilities 10,641,062.22 85,681.07 6,179,981.80EWholesale Trade 22,895,200.54 37,014.51 5,156,559.66FRetail Trade 89,967,275.77 283,209.94 40,585,872.00GFinance, Insurance, & Real Estate 756,799.23 591,524.33 1,109,714.94HServices 26,353,720.84 324,933.88 8,036,228.19IOther N/A N/A N/A
Total for Codington County 210,388,237.31 4,049,062.09 65,404,701.96
02/12/13Page 23SD Dept. of Revenue

SIC Division Gross Sales Use Taxable Taxable Sales
COUNTY Statistics by Standard Industrial Classification (SIC) Major Group broken down by CITYReturns Filed: January 2013
CORSONCounty:Keldron
Services 16,507.99 0.00 16,507.99IOther 12,367.16 0.00 12,272.16
Total for Keldron 28,875.15 0.00 28,780.15Mcintosh
Wholesale Trade 137,821.43 126.23 90,957.29FRetail Trade 478,109.87 6,523.50 50,427.96GServices 13,061.74 51.52 13,011.94IOther 47,562.80 17.42 567.78
Total for Mcintosh 676,555.84 6,718.67 154,964.97Mclaughlin
Agriculture, Forestry, & Fishing 130,402.24 0.00 119,222.24ATransportation & Public Utilities 179,429.58 14.97 62,400.96EWholesale Trade 2,826,008.06 3,998.55 34,794.49FRetail Trade 1,119,282.64 11,547.32 517,564.42GServices 51,902.98 47.12 39,652.99IOther 368,690.84 102.81 3,496.06
Total for Mclaughlin 4,675,716.34 15,710.77 777,131.16Morristown
Retail Trade 14,574.74 8.85 14,549.48GOther 17,448.72 1,296.58 18,560.76
Total for Morristown 32,023.45 1,305.43 33,110.24Watauga
Other N/A N/A N/A
Total for Watauga N/A N/A N/AOther Cities
Services 26,971.09 281.85 27,252.94IOther 10,983.20 7,485.17 15,114.07
Total for Other Cities 37,954.29 7,767.02 42,367.01
Total for CORSON County 5,681,047.17 31,813.89 1,047,789.63
**************************************************************** COUNTY RECAP ***************************************************************
****************************************************************************************************************************************************
CorsonCounty:Agriculture, Forestry, & Fishing 150,160.23 6,985.17 142,516.10AManufacturing 410,800.38 114.67 4,293.45DTransportation & Public Utilities 179,991.52 23.53 62,971.46EWholesale Trade 2,963,829.49 4,124.78 125,751.78FRetail Trade 1,615,559.61 18,579.67 586,634.23GServices 354,878.15 1,986.06 125,483.24IOther N/A N/A N/A
Total for Corson County 5,681,047.17 31,813.89 1,047,789.63
02/12/13Page 24SD Dept. of Revenue

SIC Division Gross Sales Use Taxable Taxable Sales
COUNTY Statistics by Standard Industrial Classification (SIC) Major Group broken down by CITYReturns Filed: January 2013
CUSTERCounty:Buffalo Gap
Retail Trade 307,510.80 24.00 25,915.09GServices 55,273.28 0.00 37,895.97IOther N/A N/A N/A
Total for Buffalo Gap 365,934.08 24.00 66,606.06Custer
Agriculture, Forestry, & Fishing 64,369.57 334.35 54,267.54AManufacturing 172,396.88 970.62 38,585.12DTransportation & Public Utilities 1,544,865.09 52,553.83 1,495,941.95EWholesale Trade 133,663.52 419.88 57,224.92FRetail Trade 4,003,088.27 20,991.32 2,288,301.68GFinance, Insurance, & Real Estate 706,638.50 66.00 84,804.21HServices 1,717,464.68 82,134.61 868,515.36IOther 320,390.34 6,332.24 75,825.40
Total for Custer 8,662,876.85 163,802.86 4,963,466.18Fairburn
Services 6,814.50 582.99 7,397.49IOther N/A N/A N/A
Total for Fairburn 8,744.50 582.99 8,737.49Hermosa
Agriculture, Forestry, & Fishing 16,860.04 402.59 16,925.13AManufacturing 80,728.67 138.02 6,872.75DTransportation & Public Utilities 21,382.56 130.06 17,988.28EWholesale Trade 15,120.51 35.64 7,902.11FRetail Trade 1,148,273.87 540.90 369,137.70GServices 342,084.27 7,480.36 104,064.10IOther 44,690.54 0.00 41,726.54
Total for Hermosa 1,669,140.47 8,727.56 564,616.61Pringle
Retail Trade 79,682.91 65.10 69,030.92GServices 10,196.26 2.64 10,137.55IOther 21,676.20 1.86 2,091.56
Total for Pringle 111,555.37 69.60 81,260.03Other Cities
Agriculture, Forestry, & Fishing 11,302.14 35.00 2,401.07ARetail Trade 585,633.08 21,981.82 93,711.22GOther 21,831.30 0.00 0.00
Total for Other Cities 618,766.52 22,016.82 96,112.29
02/12/13Page 25SD Dept. of Revenue

SIC Division Gross Sales Use Taxable Taxable Sales
COUNTY Statistics by Standard Industrial Classification (SIC) Major Group broken down by CITYReturns Filed: January 2013
Total for CUSTER County 11,437,017.79 195,223.83 5,780,798.66
**************************************************************** COUNTY RECAP ***************************************************************
****************************************************************************************************************************************************
CusterCounty:Agriculture, Forestry, & Fishing 111,936.75 771.94 76,533.74AMining 275,129.58 6,146.74 27,415.14BManufacturing 253,125.56 1,108.64 45,457.87DTransportation & Public Utilities 1,568,082.80 52,684.75 1,514,011.23EWholesale Trade 176,131.39 456.52 68,332.59FRetail Trade 6,124,188.93 43,603.14 2,846,096.61GFinance, Insurance, & Real Estate 729,737.49 66.00 107,903.20HServices 2,131,832.99 90,200.59 1,028,010.47IOther N/A N/A N/A
Total for Custer County 11,437,017.79 195,223.83 5,780,798.66
02/12/13Page 26SD Dept. of Revenue

SIC Division Gross Sales Use Taxable Taxable Sales
COUNTY Statistics by Standard Industrial Classification (SIC) Major Group broken down by CITYReturns Filed: January 2013
DAVISONCounty:Ethan
Transportation & Public Utilities 5,660.83 45.84 5,706.67EWholesale Trade 15,195.18 96.80 7,097.24FRetail Trade 336,423.18 4,743.23 223,549.55GServices 35,519.31 1,741.62 30,312.75IOther 4,495.01 50.50 637.50
Total for Ethan 397,293.52 6,677.98 267,303.71Mitchell
Agriculture, Forestry, & Fishing 424,316.00 30,599.29 354,657.06AConstruction 26,993.35 0.00 25,577.24CManufacturing 37,611,266.66 512,672.03 1,467,162.25DTransportation & Public Utilities 4,428,296.07 50,696.02 3,997,096.49EWholesale Trade 14,163,549.77 168,599.84 1,468,496.05FRetail Trade 64,885,135.63 332,211.39 35,774,627.55GFinance, Insurance, & Real Estate 613,394.17 43,120.34 425,021.17HServices 14,689,437.60 452,178.38 5,287,075.41IOther N/A N/A N/A
Total for Mitchell 136,842,389.24 1,590,077.30 48,799,713.22Mount Vernon
Agriculture, Forestry, & Fishing 66,359.55 1,815.00 44,736.55ATransportation & Public Utilities 8,226.51 51.95 7,867.50EWholesale Trade 5,808,254.86 4.69 5,853.18FRetail Trade 445,783.60 5,381.18 181,351.80GServices 148,816.78 454.41 120,746.14IOther N/A N/A N/A
Total for Mount Vernon 6,487,820.81 7,707.25 370,934.67Other Cities
Services 429.00 0.00 429.00IOther N/A N/A N/A
Total for Other Cities 25,130.83 200.00 25,330.83
Total for DAVISON County 143,752,634.40 1,604,662.53 49,463,282.43
**************************************************************** COUNTY RECAP ***************************************************************
****************************************************************************************************************************************************
DavisonCounty:Agriculture, Forestry, & Fishing 494,805.55 32,414.29 399,793.61AConstruction 26,993.35 0.00 25,577.24CManufacturing 37,612,031.67 512,722.53 1,467,799.75DTransportation & Public Utilities 4,442,183.41 50,793.82 4,010,670.66EWholesale Trade 19,986,999.82 168,701.33 1,481,446.47FRetail Trade 65,691,644.24 342,535.80 36,204,030.73GFinance, Insurance, & Real Estate 623,773.67 43,120.34 435,400.67HServices 14,874,202.69 454,374.41 5,438,563.30IOther N/A N/A N/A
Total for Davison County 143,752,634.40 1,604,662.53 49,463,282.43
02/12/13Page 27SD Dept. of Revenue

SIC Division Gross Sales Use Taxable Taxable Sales
COUNTY Statistics by Standard Industrial Classification (SIC) Major Group broken down by CITYReturns Filed: January 2013
DAYCounty:Andover
Manufacturing 17,036.81 425.51 1,576.00DTransportation & Public Utilities 1,639,429.81 164,230.19 166,606.00ERetail Trade 13,569.96 35.34 13,167.36GServices 21,736.15 47.66 19,526.71IOther N/A N/A N/A
Total for Andover 1,692,359.35 164,739.00 200,918.57Bristol
Transportation & Public Utilities 16,708.09 823.08 16,511.17EWholesale Trade 3,388,720.68 4,220.26 18,729.69FRetail Trade 220,440.97 415.30 165,658.06GServices 24,353.20 2,914.99 26,422.05IOther N/A N/A N/A
Total for Bristol 3,651,430.95 9,061.64 229,216.97Grenville
Retail Trade 36,957.16 91.87 33,191.90GServices 65,969.49 44.10 14,566.66IOther 32,853.39 18.04 1,589.41
Total for Grenville 135,780.04 154.01 49,347.97Pierpont
Transportation & Public Utilities 9,587.22 1.66 2,039.76ERetail Trade 740,941.37 2,063.61 41,846.21GServices 5,582.71 3.36 5,416.17I
Total for Pierpont 756,111.29 2,068.63 49,302.14Roslyn
Transportation & Public Utilities 6,240.80 541.03 6,781.83EWholesale Trade 107,267.71 4.43 3,217.95FRetail Trade 652,165.72 193.36 246,838.00GServices 4,936.88 0.00 4,636.23IOther N/A N/A N/A
Total for Roslyn 770,613.56 786.37 261,524.01Waubay
Agriculture, Forestry, & Fishing 61,281.82 197.00 61,306.82AManufacturing 27,624.65 258.03 4,430.09DTransportation & Public Utilities 165,589.34 1,113.99 21,418.84EWholesale Trade 26,503.27 23.86 7,397.18FRetail Trade 598,204.57 801.38 221,448.23GServices 116,433.30 5,632.50 82,616.58I
Total for Waubay 995,636.95 8,026.76 398,617.74Webster
Agriculture, Forestry, & Fishing 95,420.49 1,118.78 94,742.32AManufacturing 1,474,349.71 93,701.48 81,625.21DTransportation & Public Utilities 1,531,635.21 9,080.63 1,469,703.95EWholesale Trade 7,516,641.04 88.75 17,428.83FRetail Trade 8,145,105.50 67,201.57 4,562,655.53GFinance, Insurance, & Real Estate 83,394.57 21.40 64,667.70HServices 1,518,996.25 2,098.00 362,549.51IOther N/A N/A N/A
Total for Webster 20,365,542.77 173,310.61 6,653,373.05
02/12/13Page 28SD Dept. of Revenue

SIC Division Gross Sales Use Taxable Taxable Sales
COUNTY Statistics by Standard Industrial Classification (SIC) Major Group broken down by CITYReturns Filed: January 2013
Other CitiesServices 2,471.98 0.00 2,471.98IOther 1,409.37 0.00 1,409.37
Total for Other Cities 3,881.35 0.00 3,881.35
Total for DAY County 28,371,356.26 358,147.02 7,846,181.80
**************************************************************** COUNTY RECAP ***************************************************************
****************************************************************************************************************************************************
DayCounty:Agriculture, Forestry, & Fishing 157,910.31 2,003.78 157,945.14AManufacturing 1,549,819.69 94,393.81 87,841.10DTransportation & Public Utilities 3,369,408.65 175,792.90 1,683,282.05EWholesale Trade 11,041,222.85 4,344.54 47,659.85FRetail Trade 10,408,794.62 70,802.44 5,286,214.66GFinance, Insurance, & Real Estate 83,720.19 68.94 65,033.11HServices 1,760,479.95 10,740.61 518,205.89IOther N/A N/A N/A
Total for Day County 28,371,356.26 358,147.02 7,846,181.80
02/12/13Page 29SD Dept. of Revenue

SIC Division Gross Sales Use Taxable Taxable Sales
COUNTY Statistics by Standard Industrial Classification (SIC) Major Group broken down by CITYReturns Filed: January 2013
DEUELCounty:Astoria
Wholesale Trade 2,749.77 26.54 656.22FRetail Trade 8,311.39 171.29 2,694.90GServices 28,502.02 10.98 23,025.75IOther N/A N/A N/A
Total for Astoria 43,885.86 240.38 30,731.12Brandt
Retail Trade 37,977.58 131.93 32,440.94GOther 4,346,975.85 41,585.24 46,694.72
Total for Brandt 4,384,953.43 41,717.17 79,135.66Clear Lake
Agriculture, Forestry, & Fishing 1,075,445.56 2,032.16 433,269.44AManufacturing 185,257.06 174,991.42 189,007.88DTransportation & Public Utilities 1,878,745.25 160,355.17 1,966,807.03EWholesale Trade 147,506.93 247.84 54,962.39FRetail Trade 2,340,778.08 5,488.54 854,441.30GFinance, Insurance, & Real Estate 53,963.92 1,510.28 45,038.77HServices 384,818.48 3,661.28 159,117.06IOther N/A N/A N/A
Total for Clear Lake 6,087,459.05 348,286.69 3,707,038.64Gary
Manufacturing 12,989.09 4.65 885.14DTransportation & Public Utilities 16,131.03 127.40 16,084.43ERetail Trade 276,512.60 656.47 183,107.38GServices 1,851,352.64 32,775.99 217,224.09IOther 7,523.90 2,988.89 9,140.22
Total for Gary 2,164,509.26 36,553.40 426,441.26Goodwin
Manufacturing 19,799.49 0.00 19,799.49DRetail Trade 7,089.30 139.00 6,569.11GOther 30,363.59 250.00 30,613.59
Total for Goodwin 57,252.38 389.00 56,982.19Toronto
Manufacturing 38,867.07 0.00 1,315.82DTransportation & Public Utilities 15,601.31 886.79 5,168.07ERetail Trade 2,840,559.40 1,904.75 357,527.53GServices 44,442.53 272.99 42,668.15IOther N/A N/A N/A
Total for Toronto 2,956,481.76 3,283.20 408,791.57Other Cities
Retail Trade 13,339.47 162.50 13,501.97GServices 3,347.65 0.00 3,347.65IOther 8,537.91 0.00 8,031.01
Total for Other Cities 25,225.03 162.50 24,880.63
02/12/13Page 30SD Dept. of Revenue

SIC Division Gross Sales Use Taxable Taxable Sales
COUNTY Statistics by Standard Industrial Classification (SIC) Major Group broken down by CITYReturns Filed: January 2013
Total for DEUEL County 15,719,766.77 430,632.35 4,734,001.07
**************************************************************** COUNTY RECAP ***************************************************************
****************************************************************************************************************************************************
DeuelCounty:Agriculture, Forestry, & Fishing 5,425,052.11 5,305.74 456,450.27AManufacturing 273,079.09 175,096.47 215,608.04DTransportation & Public Utilities 1,917,527.90 161,430.55 1,995,171.03EWholesale Trade 169,242.03 502.90 58,767.91FRetail Trade 5,524,567.81 8,654.48 1,450,283.13GFinance, Insurance, & Real Estate 55,163.95 42,670.97 86,973.33HServices 2,328,489.91 36,971.24 461,159.29IOther 26,643.97 0.00 9,588.07
Total for Deuel County 15,719,766.77 430,632.35 4,734,001.07
02/12/13Page 31SD Dept. of Revenue

SIC Division Gross Sales Use Taxable Taxable Sales
COUNTY Statistics by Standard Industrial Classification (SIC) Major Group broken down by CITYReturns Filed: January 2013
DEWEYCounty:Eagle Butte
Manufacturing 671,769.85 262.76 26,513.58DTransportation & Public Utilities 429,267.81 337.74 185,556.51EWholesale Trade 17,776.78 97.88 3,852.64FRetail Trade 4,657,809.78 8,636.02 2,150,084.52GServices 121,958.20 271.48 87,499.19IOther 448.82 2,984.68 3,422.74
Total for Eagle Butte 5,899,031.24 12,590.56 2,456,929.18Glencross
Services 7,765.25 0.00 7,765.25IOther N/A N/A N/A
Total for Glencross 12,929.33 0.00 12,929.33Isabel
Wholesale Trade 36,793.65 6,887.97 17,155.15FRetail Trade 2,596,207.62 2,848.90 1,302,159.63GServices 57,542.07 198.61 42,456.90IOther 1,208.65 4.54 1,035.00
Total for Isabel 2,691,751.99 9,940.03 1,362,806.68Lantry
Other N/A N/A N/A
Total for Lantry N/A N/A N/ARidgeview
Retail Trade 4,622.96 74.95 2,359.05GOther N/A N/A N/A
Total for Ridgeview 6,502.52 74.95 3,074.05Timber Lake
Manufacturing 630,869.06 1,202.69 71,589.03DTransportation & Public Utilities 22,250.77 20.93 5,101.76EWholesale Trade 189,222.93 108.69 39,286.21FRetail Trade 729,574.47 6,082.23 457,639.80GFinance, Insurance, & Real Estate 45,695.90 0.00 41,195.90HServices 150,130.62 789.69 74,348.82I
Total for Timber Lake 1,767,743.75 8,204.23 689,161.52Trail City
Services 15,441.24 0.00 15,441.24IOther N/A N/A N/A
Total for Trail City 17,591.24 0.00 17,591.24Whitehorse
Other N/A N/A N/A
Total for Whitehorse N/A N/A N/AOther Cities
Retail Trade 23,983.65 100.94 22,990.50GOther N/A N/A N/A
Total for Other Cities 34,728.86 647.89 34,282.66
02/12/13Page 32SD Dept. of Revenue

SIC Division Gross Sales Use Taxable Taxable Sales
COUNTY Statistics by Standard Industrial Classification (SIC) Major Group broken down by CITYReturns Filed: January 2013
Total for DEWEY County 10,430,678.93 31,457.66 4,577,174.66
**************************************************************** COUNTY RECAP ***************************************************************
****************************************************************************************************************************************************
DEWEYCounty:Manufacturing 1,303,213.40 1,465.45 98,677.11DTransportation & Public Utilities 452,152.73 363.22 191,118.77EWholesale Trade 245,672.92 7,094.54 61,009.00FRetail Trade 8,019,912.57 17,743.04 3,942,947.58GFinance, Insurance, & Real Estate 46,144.72 2,984.68 44,618.64HServices 363,582.60 1,806.73 238,803.56IOther N/A N/A N/A
Total for DEWEY County 10,430,678.93 31,457.66 4,577,174.66
02/12/13Page 33SD Dept. of Revenue

SIC Division Gross Sales Use Taxable Taxable Sales
COUNTY Statistics by Standard Industrial Classification (SIC) Major Group broken down by CITYReturns Filed: January 2013
DOUGLASCounty:Armour
Agriculture, Forestry, & Fishing 3,551,205.66 41,841.45 76,834.36AManufacturing 44,461.35 -15.45 9,708.03DTransportation & Public Utilities 302,802.66 2,349.63 288,716.50EWholesale Trade 1,078,327.90 329.02 50,711.93FRetail Trade 851,120.11 1,311.89 469,831.62GFinance, Insurance, & Real Estate 2,658.99 0.00 2,574.02HServices 2,326,786.58 61,427.08 384,902.32I
Total for Armour 8,157,363.24 107,243.61 1,283,278.78Corsica
Agriculture, Forestry, & Fishing 36,170.69 11,410.59 47,502.53AManufacturing 267,482.02 1,110.26 4,616.01DTransportation & Public Utilities 33,938.20 151.63 28,675.64EWholesale Trade 618,065.68 10,740.99 191,781.34FRetail Trade 5,364,271.59 80,122.64 3,718,106.47GServices 1,465,825.32 6,491.49 243,526.89I
Total for Corsica 7,785,753.50 110,027.60 4,234,208.88Delmont
Retail Trade 389,413.83 6,529.38 137,445.20GServices 14,983.85 0.00 14,012.83IOther 39,674.50 82.02 17,502.82
Total for Delmont 444,072.18 6,611.40 168,960.85Harrison
Services 8,875.72 2,800.00 11,675.72IOther 44.00 0.00 44.00
Total for Harrison 8,919.72 2,800.00 11,719.72New Holland
Services 78,205.14 0.00 59,736.95IOther N/A N/A N/A
Total for New Holland 286,461.34 0.00 63,138.91Other Cities
Retail Trade 5,526.18 0.00 -4,913.52GOther N/A N/A N/A
Total for Other Cities 17,119.18 0.00 6,679.48
Total for DOUGLAS County 16,699,689.17 226,682.61 5,767,986.62
**************************************************************** COUNTY RECAP ***************************************************************
****************************************************************************************************************************************************
DouglasCounty:Agriculture, Forestry, & Fishing 3,587,376.35 53,252.04 124,336.89AManufacturing 311,943.36 1,094.81 14,324.04DTransportation & Public Utilities 347,556.16 2,583.28 328,289.46EWholesale Trade 1,725,122.09 11,070.00 248,968.08FRetail Trade 6,818,631.92 87,963.91 4,323,915.73GFinance, Insurance, & Real Estate 2,789.68 0.00 2,704.71HServices 3,906,269.61 70,718.57 725,447.71I
Total for Douglas County 16,699,689.17 226,682.61 5,767,986.62
02/12/13Page 34SD Dept. of Revenue

SIC Division Gross Sales Use Taxable Taxable Sales
COUNTY Statistics by Standard Industrial Classification (SIC) Major Group broken down by CITYReturns Filed: January 2013
EDMUNDSCounty:Bowdle
Agriculture, Forestry, & Fishing 61,777.31 0.00 59,788.08ATransportation & Public Utilities 16,103.59 1,314.10 17,386.19EWholesale Trade 25,588.24 221.63 9,348.34FRetail Trade 2,933,771.87 4,909.19 356,275.08GServices 680,013.10 36.36 48,800.60IOther 16,021.22 15,451.56 19,141.56
Total for Bowdle 3,733,275.33 21,932.82 510,739.85Hosmer
Transportation & Public Utilities 5,925.03 25.59 4,212.83EWholesale Trade 1,936.58 4.75 572.73FRetail Trade 114,141.04 127.42 67,183.80GServices 27,878.26 58.89 26,795.75IOther 135,445.48 1,678.60 136,327.12
Total for Hosmer 285,326.40 1,895.26 235,092.23Ipswich/Mina
Agriculture, Forestry, & Fishing 568,129.93 9,405.00 216,880.60AConstruction 49,437.09 0.00 35,543.70CManufacturing 34,891.61 2,131.84 16,870.10DTransportation & Public Utilities 1,656,157.58 5,489.81 1,283,666.03EWholesale Trade 2,993,452.73 25,798.38 102,114.51FRetail Trade 5,718,051.63 22,694.37 1,166,910.88GFinance, Insurance, & Real Estate 7,920.93 0.00 5,668.23HServices 544,491.27 22,790.26 441,712.67IOther N/A N/A N/A
Total for Ipswich/Mina 11,572,532.77 224,291.18 3,405,348.24Mina
Other N/A N/A N/A
Total for Mina N/A N/A N/ARoscoe
Transportation & Public Utilities 13,697.92 953.33 14,538.57EWholesale Trade 5,088,568.96 6,131.88 23,994.10FRetail Trade 6,307,769.93 4,336.56 434,520.05GServices 90,262.05 300.71 72,506.69IOther 1,123.39 64,507.41 64,770.00
Total for Roscoe 11,501,422.25 76,229.89 610,329.41Other Cities
Retail Trade 14,552.43 0.00 12,159.43GServices 89,963.23 22,854.62 107,982.14IOther 0.00 103.15 103.15
Total for Other Cities 104,515.66 22,957.77 120,244.72
02/12/13Page 35SD Dept. of Revenue

SIC Division Gross Sales Use Taxable Taxable Sales
COUNTY Statistics by Standard Industrial Classification (SIC) Major Group broken down by CITYReturns Filed: January 2013
Total for EDMUNDS County 27,197,697.42 347,306.93 4,882,379.45
**************************************************************** COUNTY RECAP ***************************************************************
****************************************************************************************************************************************************
EdmundsCounty:Agriculture, Forestry, & Fishing 764,666.01 74,495.36 475,726.81AConstruction 52,162.09 0.00 38,268.70CManufacturing 49,857.92 2,149.30 18,655.91DTransportation & Public Utilities 1,691,884.13 7,885.98 1,319,906.77EWholesale Trade 8,109,546.51 32,156.64 136,029.68FRetail Trade 15,088,286.90 32,067.54 2,037,049.24GFinance, Insurance, & Real Estate 8,060.93 16,529.74 22,337.97HServices 1,433,232.92 46,040.84 698,422.85IOther N/A N/A N/A
Total for Edmunds County 27,197,697.42 347,306.93 4,882,379.45
02/12/13Page 36SD Dept. of Revenue

SIC Division Gross Sales Use Taxable Taxable Sales
COUNTY Statistics by Standard Industrial Classification (SIC) Major Group broken down by CITYReturns Filed: January 2013
FALL RIVERCounty:Edgemont
Agriculture, Forestry, & Fishing 51,094.40 342.39 50,712.54AWholesale Trade 9,802.38 705.99 4,692.48FRetail Trade 2,176,189.19 1,379.59 535,676.61GServices 162,286.54 8,084.49 95,186.05IOther 118,711.14 40.98 48,441.61
Total for Edgemont 2,518,083.65 10,553.44 734,709.29Hot Springs
Agriculture, Forestry, & Fishing 103,405.94 27,245.48 108,354.61AMining 8,691.09 0.00 2,847.13BConstruction 25,126.32 0.00 21,629.82CManufacturing 267,263.76 859.53 1,350.32DTransportation & Public Utilities 219,919.18 481.08 207,041.17EWholesale Trade 88,928.05 1,743.02 28,730.33FRetail Trade 6,659,917.71 88,460.54 3,146,413.54GFinance, Insurance, & Real Estate 65,564.46 0.00 48,573.99HServices 1,181,942.07 21,385.31 616,281.06I
Total for Hot Springs 8,620,758.58 140,174.96 4,181,221.97Oelrichs
Retail Trade 136,882.89 0.00 77,238.50GServices 1,512.06 0.00 716.31IOther N/A N/A N/A
Total for Oelrichs 138,394.95 0.00 77,954.81Oral
Services 76,210.82 0.00 22.00IOther 376,700.17 0.00 166,236.43
Total for Oral 452,910.99 0.00 166,258.43Smithwick
Other N/A N/A N/A
Total for Smithwick N/A N/A N/AOther Cities
Services 10,089.33 0.00 10,089.33IOther N/A N/A N/A
Total for Other Cities 11,976.33 0.00 11,976.33
Total for FALL RIVER County 11,742,124.50 150,728.40 5,172,120.83
**************************************************************** COUNTY RECAP ***************************************************************
****************************************************************************************************************************************************
Fall RiverCounty:Agriculture, Forestry, & Fishing 302,540.53 27,587.87 307,107.34AMining 17,091.09 0.00 11,247.13BConstruction 25,126.32 0.00 21,629.82CManufacturing 267,428.23 872.77 1,481.32DTransportation & Public Utilities 330,065.84 508.81 246,951.78EWholesale Trade 310,078.44 2,449.01 34,482.08FRetail Trade 8,992,188.75 89,840.13 3,778,352.62GFinance, Insurance, & Real Estate 65,564.46 0.00 48,573.99HServices 1,432,040.82 29,469.80 722,294.75I
Total for Fall River County 11,742,124.50 150,728.40 5,172,120.83
02/12/13Page 37SD Dept. of Revenue

SIC Division Gross Sales Use Taxable Taxable Sales
COUNTY Statistics by Standard Industrial Classification (SIC) Major Group broken down by CITYReturns Filed: January 2013
FAULKCounty:Chelsea
Services 29,813.61 58.11 29,871.72IOther 387,386.97 2,308.25 55,214.75
Total for Chelsea 417,200.58 2,366.36 85,086.47Cresbard
Retail Trade 72,107.17 243.00 55,948.89GServices 204,995.59 9,293.00 130,987.22IOther 5,932.50 0.00 5,932.50
Total for Cresbard 283,035.26 9,536.00 192,868.61Faulkton
Agriculture, Forestry, & Fishing 95,251.12 91.26 72,554.21AManufacturing 656,458.58 68,136.40 160,572.98DTransportation & Public Utilities 110,831.88 546.30 103,204.38EWholesale Trade 807,349.64 9,654.04 132,004.39FRetail Trade 1,644,672.39 60,731.45 1,001,524.74GServices 853,435.63 54,135.27 809,311.73IOther N/A N/A N/A
Total for Faulkton 4,188,998.51 193,452.89 2,292,370.23Onaka
Retail Trade 26,618.49 880.85 27,499.34GServices 48,047.47 0.00 48,047.47IOther N/A N/A N/A
Total for Onaka 76,640.36 880.85 76,167.21Orient
Retail Trade 365,071.22 1,398.56 105,763.69GServices 6,878.35 19.21 6,061.85IOther 3,289.34 16.24 3,104.60
Total for Orient 375,238.91 1,434.01 114,930.14Rockham
Other 54,319.82 0.00 36,708.44
Total for Rockham 54,319.82 0.00 36,708.44Seneca
Retail Trade 875,666.03 2,105.07 736,179.19GOther 519,160.70 1,254.00 37,610.14
Total for Seneca 1,394,826.73 3,359.07 773,789.33Other Cities
Other 0.00 37,461.00 37,461.00
Total for Other Cities 0.00 37,461.00 37,461.00
02/12/13Page 38SD Dept. of Revenue
SIC Division Gross Sales Use Taxable Taxable Sales
COUNTY Statistics by Standard Industrial Classification (SIC) Major Group broken down by CITYReturns Filed: January 2013
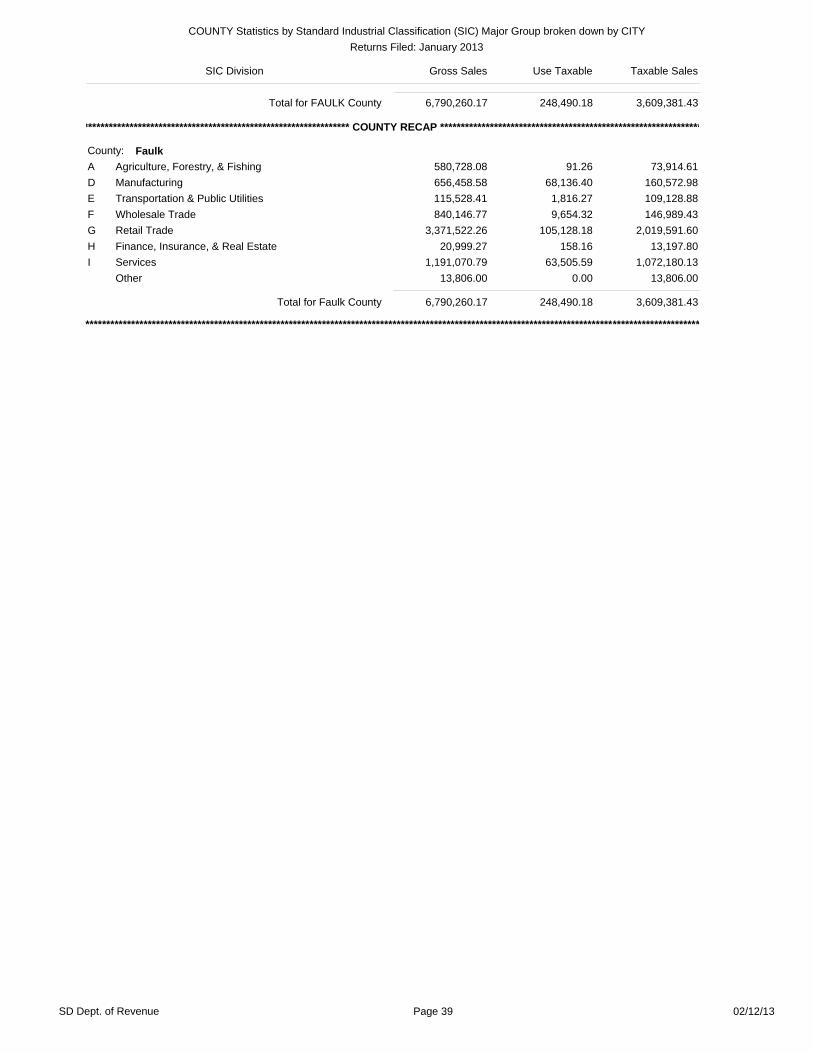
Total for FAULK County 6,790,260.17 248,490.18 3,609,381.43
**************************************************************** COUNTY RECAP ***************************************************************
****************************************************************************************************************************************************
FaulkCounty:Agriculture, Forestry, & Fishing 580,728.08 91.26 73,914.61AManufacturing 656,458.58 68,136.40 160,572.98DTransportation & Public Utilities 115,528.41 1,816.27 109,128.88EWholesale Trade 840,146.77 9,654.32 146,989.43FRetail Trade 3,371,522.26 105,128.18 2,019,591.60GFinance, Insurance, & Real Estate 20,999.27 158.16 13,197.80HServices 1,191,070.79 63,505.59 1,072,180.13IOther 13,806.00 0.00 13,806.00
Total for Faulk County 6,790,260.17 248,490.18 3,609,381.43
02/12/13Page 39SD Dept. of Revenue

SIC Division Gross Sales Use Taxable Taxable Sales
COUNTY Statistics by Standard Industrial Classification (SIC) Major Group broken down by CITYReturns Filed: January 2013
GRANTCounty:Big Stone City
Agriculture, Forestry, & Fishing 7,449.35 172.39 7,621.74AConstruction 4,116.92 0.00 4,116.92CManufacturing 1,774,506.72 121,595.07 138,422.97DTransportation & Public Utilities 95,176.42 1.76 89,826.28EWholesale Trade 114,304.58 117.52 28,589.93FRetail Trade 328,947.63 2,214.63 282,957.85GServices 932,833.64 586.85 779,213.26IOther 60.00 90,995.73 91,055.73
Total for Big Stone City 3,257,395.26 215,683.96 1,421,804.68Labolt
Retail Trade 107,776.38 8.72 93,921.90GServices 2,375.00 88.00 2,463.00IOther N/A N/A N/A
Total for Labolt 778,711.20 103.34 98,750.30Marvin
Retail Trade 6,996.20 1,332.25 3,326.95GOther N/A N/A N/A
Total for Marvin 8,690.20 1,332.25 5,020.95Milbank
Agriculture, Forestry, & Fishing 407,275.20 13,426.50 300,056.76AConstruction 6,840.60 0.00 4,962.10CManufacturing 29,181,777.12 220,741.64 340,332.55DTransportation & Public Utilities 1,270,864.51 40,173.25 1,108,135.60EWholesale Trade 2,624,981.43 14,332.27 562,302.19FRetail Trade 12,733,410.77 26,470.63 6,385,467.13GFinance, Insurance, & Real Estate 55,262.66 0.00 55,262.66HServices 5,711,571.23 89,822.83 1,625,629.42IOther N/A N/A N/A
Total for Milbank 51,991,983.52 404,967.11 10,382,148.41Revillo
Retail Trade 110,032.15 328.82 68,369.22GServices 63,921.77 325.00 16,182.39IOther 849,124.89 2,543.82 18,832.32
Total for Revillo 1,023,078.81 3,197.63 103,383.93Stockholm
Retail Trade 145,684.25 290.29 86,444.82GOther 62,061.20 2,318.47 60,284.82
Total for Stockholm 207,745.45 2,608.76 146,729.64Strandburg
Other 4,193.26 18.00 4,211.26
Total for Strandburg 4,193.26 18.00 4,211.26Twin Brooks
Wholesale Trade 956,754.13 0.00 0.00FRetail Trade 93,996.12 1,762.41 32,958.48GServices 23,500.09 20.50 23,405.59IOther N/A N/A N/A
Total for Twin Brooks 1,091,678.34 1,782.91 73,792.07Other Cities
Services 128,326.67 73.98 14,146.78IOther 47,204.14 0.00 47,204.14
Total for Other Cities 175,530.81 73.98 61,350.9202/12/13Page 40SD Dept. of Revenue
SIC Division Gross Sales Use Taxable Taxable Sales
COUNTY Statistics by Standard Industrial Classification (SIC) Major Group broken down by CITYReturns Filed: January 2013
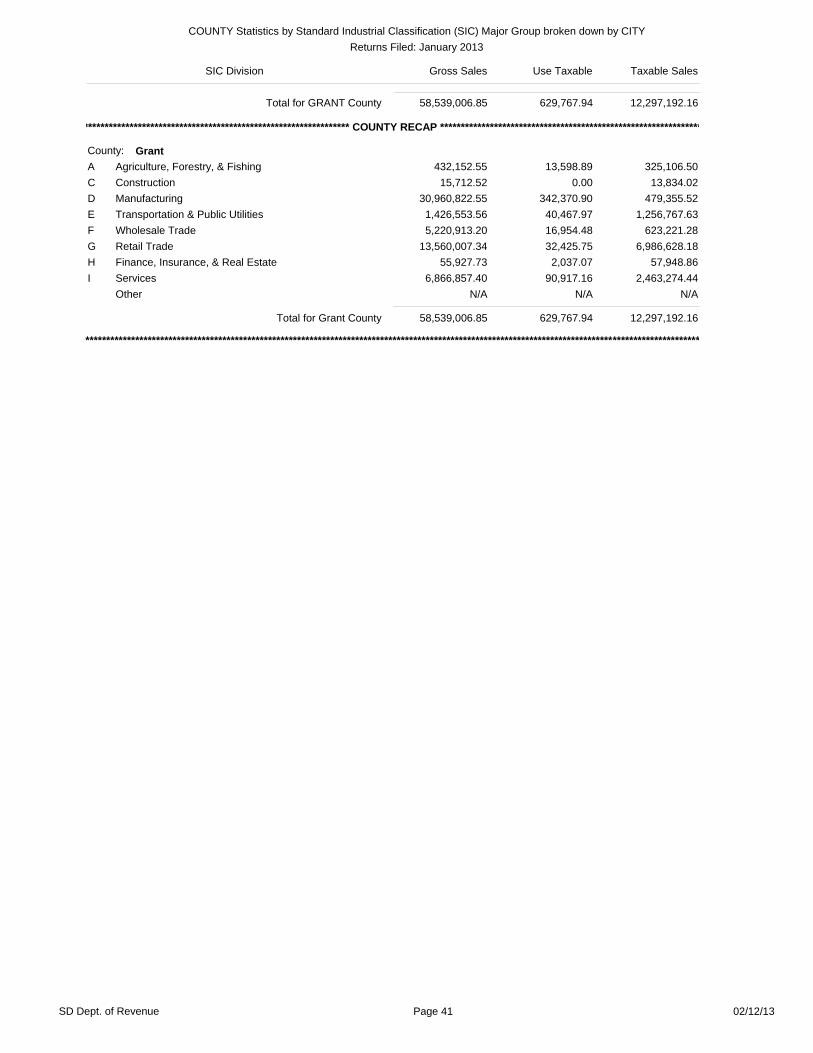
Total for GRANT County 58,539,006.85 629,767.94 12,297,192.16
**************************************************************** COUNTY RECAP ***************************************************************
****************************************************************************************************************************************************
GrantCounty:Agriculture, Forestry, & Fishing 432,152.55 13,598.89 325,106.50AConstruction 15,712.52 0.00 13,834.02CManufacturing 30,960,822.55 342,370.90 479,355.52DTransportation & Public Utilities 1,426,553.56 40,467.97 1,256,767.63EWholesale Trade 5,220,913.20 16,954.48 623,221.28FRetail Trade 13,560,007.34 32,425.75 6,986,628.18GFinance, Insurance, & Real Estate 55,927.73 2,037.07 57,948.86HServices 6,866,857.40 90,917.16 2,463,274.44IOther N/A N/A N/A
Total for Grant County 58,539,006.85 629,767.94 12,297,192.16
02/12/13Page 41SD Dept. of Revenue

SIC Division Gross Sales Use Taxable Taxable Sales
COUNTY Statistics by Standard Industrial Classification (SIC) Major Group broken down by CITYReturns Filed: January 2013
GREGORYCounty:Bonesteel
Agriculture, Forestry, & Fishing 14,300.75 0.00 14,300.75ATransportation & Public Utilities 11,626.79 96.97 9,448.00ERetail Trade 615,494.93 339.54 393,314.15GServices 47,691.53 0.00 42,071.23IOther 108,958.13 2.02 76,503.71
Total for Bonesteel 798,072.12 438.53 535,637.84Burke
Agriculture, Forestry, & Fishing 220,675.71 187.87 104,409.46AManufacturing 35,643.33 532.50 23,513.19DTransportation & Public Utilities 120,335.76 124.96 56,742.93EWholesale Trade 70,249.89 69.79 13,360.85FRetail Trade 1,523,908.97 16,653.32 938,204.20GFinance, Insurance, & Real Estate 8,275.16 16,776.35 25,051.51HServices 1,661,553.83 1,985.56 273,786.94IOther N/A N/A N/A
Total for Burke 3,680,519.40 36,330.35 1,435,069.08Dallas
Agriculture, Forestry, & Fishing 23,945.86 0.00 20,535.86ARetail Trade 92,859.48 2,549.17 95,077.74GServices 159,831.88 0.00 159,831.82IOther 10,764.20 13.16 1,643.58
Total for Dallas 287,401.42 2,562.33 277,089.00Fairfax
Transportation & Public Utilities 3,610.31 33.31 3,607.04EWholesale Trade 490,232.20 1,576.67 53,789.17FRetail Trade 308,123.51 204.76 250,216.43GServices 29,927.40 68.29 12,411.15IOther 10,430.52 336.47 5,373.68
Total for Fairfax 842,323.94 2,219.50 325,397.47Gregory
Agriculture, Forestry, & Fishing 369,426.33 118,229.44 359,116.42AManufacturing 168,580.15 162.54 40,976.11DTransportation & Public Utilities 134,144.57 853.05 123,387.80EWholesale Trade 2,233,987.67 6,180.83 288,283.30FRetail Trade 2,260,671.35 3,266.66 1,390,487.80GFinance, Insurance, & Real Estate 31,715.00 404.80 32,119.80HServices 2,563,559.97 44,973.55 1,004,679.10IOther N/A N/A N/A
Total for Gregory 8,154,171.66 177,363.27 3,334,991.69Herrick
Retail Trade 10,548.36 2,644.21 12,257.10GServices 879.25 0.00 879.25IOther N/A N/A N/A
Total for Herrick 76,873.98 2,644.21 16,387.82Saint Charles
Other N/A N/A N/A
Total for Saint Charles N/A N/A N/A
02/12/13Page 42SD Dept. of Revenue

SIC Division Gross Sales Use Taxable Taxable Sales
COUNTY Statistics by Standard Industrial Classification (SIC) Major Group broken down by CITYReturns Filed: January 2013
Total for GREGORY County 13,839,362.52 221,558.19 5,924,572.90
**************************************************************** COUNTY RECAP ***************************************************************
****************************************************************************************************************************************************
GregoryCounty:Agriculture, Forestry, & Fishing 629,389.06 118,580.41 499,566.00AManufacturing 297,616.93 868.41 134,464.84DTransportation & Public Utilities 336,629.07 1,121.44 197,708.34EWholesale Trade 2,821,180.37 7,829.32 364,354.34FRetail Trade 4,811,606.60 25,657.66 3,079,557.42GFinance, Insurance, & Real Estate 39,990.16 17,181.15 57,171.31HServices 4,463,443.86 47,027.40 1,493,659.49IOther 439,506.47 3,292.40 98,091.16
Total for Gregory County 13,839,362.52 221,558.19 5,924,572.90
02/12/13Page 43SD Dept. of Revenue

SIC Division Gross Sales Use Taxable Taxable Sales
COUNTY Statistics by Standard Industrial Classification (SIC) Major Group broken down by CITYReturns Filed: January 2013
HAAKONCounty:Midland
Agriculture, Forestry, & Fishing 30,173.69 0.00 20,432.69ATransportation & Public Utilities 16,008.08 158.10 16,082.33EWholesale Trade 163,594.38 3.70 69,136.75FRetail Trade 259,245.99 307.85 42,729.92GServices 78,801.01 253.45 44,079.91IOther N/A N/A N/A
Total for Midland 548,145.05 726.13 192,533.60Milesville
Other 72,412.83 95,407.26 158,860.35
Total for Milesville 72,412.83 95,407.26 158,860.35Philip
Agriculture, Forestry, & Fishing 61,132.38 0.00 58,061.13AManufacturing 62,705.05 668.11 8,506.83DTransportation & Public Utilities 52,085.47 416.45 45,691.01EWholesale Trade 2,990,494.75 48,904.84 398,022.95FRetail Trade 5,575,852.01 14,716.48 3,101,414.43GFinance, Insurance, & Real Estate 9,829.03 729.65 4,090.97HServices 789,649.81 17,423.23 413,325.12IOther N/A N/A N/A
Total for Philip 9,549,206.29 82,858.76 4,031,632.40Other Cities
Services 4,510.56 0.00 4,510.56I
Total for Other Cities 4,510.56 0.00 4,510.56
Total for HAAKON County 10,174,274.74 178,992.16 4,387,536.91
**************************************************************** COUNTY RECAP ***************************************************************
****************************************************************************************************************************************************
HaakonCounty:Agriculture, Forestry, & Fishing 103,236.10 95,407.26 183,532.33AManufacturing 63,026.96 671.14 8,578.83DTransportation & Public Utilities 68,093.55 574.55 61,773.34EWholesale Trade 3,154,089.13 48,908.54 467,159.70FRetail Trade 5,844,363.50 15,024.33 3,146,748.89GFinance, Insurance, & Real Estate 9,829.03 729.65 4,090.97HServices 924,178.68 17,676.68 513,132.89IOther N/A N/A N/A
Total for Haakon County 10,174,274.74 178,992.16 4,387,536.91
02/12/13Page 44SD Dept. of Revenue

SIC Division Gross Sales Use Taxable Taxable Sales
COUNTY Statistics by Standard Industrial Classification (SIC) Major Group broken down by CITYReturns Filed: January 2013
HAMLINCounty:Bryant
Transportation & Public Utilities 54,297.08 111.04 52,550.73EWholesale Trade 5,478.99 13.08 3,767.28FRetail Trade 987,234.82 2,043.86 576,997.04GServices 52,089.49 2,259.19 53,890.13IOther 4,344.37 528.69 1,159.21
Total for Bryant 1,103,444.76 4,955.85 688,364.39Castlewood
Agriculture, Forestry, & Fishing 14,625.00 700.00 15,325.00AManufacturing 106,522.47 303.97 6,691.54DTransportation & Public Utilities 253,124.14 259.83 34,470.22EWholesale Trade 559,739.45 10.71 194,571.49FRetail Trade 1,670,150.06 4,113.83 763,656.36GServices 84,512.21 134.19 69,152.74I
Total for Castlewood 2,688,673.33 5,522.54 1,083,867.35Estelline
Transportation & Public Utilities 79,696.43 246.83 68,331.91EWholesale Trade 292,354.11 50.90 4,287.61FRetail Trade 752,268.82 4,014.40 342,694.83GServices 133,059.87 706.65 114,731.63IOther 3,970.56 0.00 3,294.72
Total for Estelline 1,261,349.79 5,018.78 533,340.70Hayti
Transportation & Public Utilities 4,259,436.57 89.31 35,434.96EWholesale Trade 734.19 5.69 528.99FRetail Trade 926,224.49 10,433.89 267,429.79GServices 193,379.09 5,136.11 126,442.68IOther 47,068.68 254.03 25,336.73
Total for Hayti 5,426,843.02 15,919.02 455,173.15Hazel
Agriculture, Forestry, & Fishing 2,967.92 174,042.70 176,610.62ATransportation & Public Utilities 1,888.55 15.23 1,709.00EWholesale Trade 414,179.15 2.01 5,420.79FRetail Trade 117,068.20 45.47 28,124.46GServices 87,756.20 6.30 47,417.99I
Total for Hazel 623,860.01 174,111.71 259,282.86Lake Norden
Agriculture, Forestry, & Fishing 38,165.67 870.46 38,981.17AManufacturing 2,790.71 130,669.94 132,891.83DTransportation & Public Utilities 45,221.65 391.42 44,168.24EWholesale Trade 2,636,402.34 545.15 27,385.51FRetail Trade 4,606,502.99 5,762.32 889,237.83GServices 43,260.87 7,861.37 42,492.68IOther N/A N/A N/A
Total for Lake Norden 7,372,344.24 146,100.66 1,175,157.26Other Cities
Retail Trade 258,641.33 342.79 139,790.22GServices 11,910.90 0.00 6,548.60I
Total for Other Cities 270,552.23 342.79 146,338.82
02/12/13Page 45SD Dept. of Revenue

SIC Division Gross Sales Use Taxable Taxable Sales
COUNTY Statistics by Standard Industrial Classification (SIC) Major Group broken down by CITYReturns Filed: January 2013
Total for HAMLIN County 18,747,067.37 351,971.35 4,341,524.53
**************************************************************** COUNTY RECAP ***************************************************************
****************************************************************************************************************************************************
HamlinCounty:Agriculture, Forestry, & Fishing 71,180.40 175,613.16 246,338.60AManufacturing 126,042.22 131,075.08 143,802.53DTransportation & Public Utilities 4,693,664.41 1,113.67 236,665.06EWholesale Trade 3,908,888.23 627.52 235,961.67FRetail Trade 9,318,090.71 26,756.57 3,007,930.53GFinance, Insurance, & Real Estate 23,232.77 681.55 10,149.69HServices 605,968.63 16,103.80 460,676.45I
Total for Hamlin County 18,747,067.37 351,971.35 4,341,524.53
02/12/13Page 46SD Dept. of Revenue

SIC Division Gross Sales Use Taxable Taxable Sales
COUNTY Statistics by Standard Industrial Classification (SIC) Major Group broken down by CITYReturns Filed: January 2013
HANDCounty:Miller
Agriculture, Forestry, & Fishing 1,378,711.97 122.45 79,250.39AManufacturing 7,790,134.49 244,124.92 463,442.49DTransportation & Public Utilities 308,958.55 10,216.91 275,927.77EWholesale Trade 1,108,345.75 44,293.19 105,475.64FRetail Trade 4,550,722.99 11,930.67 2,020,761.99GFinance, Insurance, & Real Estate 112,501.77 7,272.80 65,843.61HServices 1,934,782.80 11,374.95 497,033.73IOther N/A N/A N/A
Total for Miller 17,184,158.31 329,335.89 3,507,735.62Ree Heights
Retail Trade 116,346.25 98.97 24,904.44GServices 15,283.92 0.00 15,283.92IOther 68,361.77 200.00 68,561.77
Total for Ree Heights 199,991.94 298.97 108,750.13Saint Lawrence
Transportation & Public Utilities 31,947.06 18.44 29,575.50EWholesale Trade 176,011.52 221.88 2,420.01FRetail Trade 214,849.73 699.27 188,823.61GServices 110,880.19 169.52 95,302.38IOther N/A N/A N/A
Total for Saint Lawrence 548,508.50 1,109.11 330,941.50Other Cities
Agriculture, Forestry, & Fishing 24,707.34 0.00 23,940.78AServices 93,802.34 72.80 89,617.97IOther 4,541.65 0.00 405.25
Total for Other Cities 123,051.33 72.80 113,964.00
Total for HAND County 18,055,710.09 330,816.77 4,061,391.25
**************************************************************** COUNTY RECAP ***************************************************************
****************************************************************************************************************************************************
HandCounty:Agriculture, Forestry, & Fishing 1,486,601.08 322.45 186,572.94AManufacturing 7,790,134.49 244,124.92 463,442.49DTransportation & Public Utilities 340,905.61 10,235.34 305,503.27EWholesale Trade 1,288,643.67 44,515.07 108,045.65FRetail Trade 4,882,174.22 12,728.91 2,234,745.29GFinance, Insurance, & Real Estate 112,501.77 7,272.80 65,843.61HServices 2,154,749.25 11,617.27 697,238.00IOther N/A N/A N/A
Total for Hand County 18,055,710.09 330,816.77 4,061,391.25
02/12/13Page 47SD Dept. of Revenue

SIC Division Gross Sales Use Taxable Taxable Sales
COUNTY Statistics by Standard Industrial Classification (SIC) Major Group broken down by CITYReturns Filed: January 2013
HANSONCounty:Alexandria
Agriculture, Forestry, & Fishing 37,554.29 9,339.74 46,876.03AManufacturing 2,238,368.70 44,561.70 77,971.61DTransportation & Public Utilities 74,728.36 41.84 21,282.68EWholesale Trade 54,015.88 25,592.74 65,073.99FRetail Trade 621,607.70 38,768.55 243,822.34GServices 58,578.12 985.07 54,802.70I
Total for Alexandria 3,084,853.04 119,289.64 509,829.35Emery
Manufacturing 89,405.57 25.34 14,223.58DWholesale Trade 155,985.93 5,631.77 87,244.20FRetail Trade 536,897.09 1,814.62 180,372.03GServices 144,103.03 9.02 129,020.10IOther 41,258.81 3,986.86 22,817.31
Total for Emery 967,650.43 11,467.61 433,677.22Fulton
Retail Trade 21,201.15 0.00 11,999.71GServices 4,878.87 65.27 4,944.14IOther 1,566,795.06 386.60 7,553.12
Total for Fulton 1,592,875.08 451.87 24,496.97Other Cities
Retail Trade 64,603.06 418.90 14,922.77GServices 20,177.75 0.00 19,539.59IOther 405,450.41 4,243.02 38,693.36
Total for Other Cities 490,231.22 4,661.92 73,155.72
Total for HANSON County 6,135,609.77 135,871.04 1,041,159.26
**************************************************************** COUNTY RECAP ***************************************************************
****************************************************************************************************************************************************
HansonCounty:Agriculture, Forestry, & Fishing 63,316.11 13,223.38 59,655.40AManufacturing 2,360,903.77 44,876.72 112,097.22DTransportation & Public Utilities 92,676.37 172.30 38,547.01EWholesale Trade 2,134,745.04 35,177.85 164,717.44FRetail Trade 1,244,309.00 41,002.07 451,116.85GServices 227,737.76 1,059.36 208,306.53IOther 11,921.72 359.36 6,718.81
Total for Hanson County 6,135,609.77 135,871.04 1,041,159.26
02/12/13Page 48SD Dept. of Revenue

SIC Division Gross Sales Use Taxable Taxable Sales
COUNTY Statistics by Standard Industrial Classification (SIC) Major Group broken down by CITYReturns Filed: January 2013
HARDINGCounty:Buffalo
Mining 8,294,411.87 0.00 13,128.04BTransportation & Public Utilities 15,376.17 125.71 15,411.88EWholesale Trade 138,853.46 617.80 74,251.37FRetail Trade 1,273,363.30 906.68 696,402.72GServices 84,181.25 132.38 66,762.90IOther 10,432.33 0.00 10,254.75
Total for Buffalo 9,816,618.37 1,782.57 876,211.66Camp Crook
Retail Trade 28,005.58 133.56 27,579.99GServices 14,111.28 0.00 11,711.28IOther N/A N/A N/A
Total for Camp Crook 42,116.86 133.56 39,291.27Ludlow
Retail Trade 117,887.55 16,855.00 92,874.05GOther 10,049.73 0.00 10,049.73
Total for Ludlow 127,937.28 16,855.00 102,923.78Ralph
Retail Trade 17,791.83 1,500.00 19,291.83G
Total for Ralph 17,791.83 1,500.00 19,291.83Redig
Other N/A N/A N/A
Total for Redig N/A N/A N/AReva
Retail Trade 145,061.00 1,790.50 38,504.53GServices 34,060.50 0.00 30,246.52IOther N/A N/A N/A
Total for Reva 179,121.50 1,790.50 68,751.05Other Cities
Other 27,780.10 0.00 23,474.92
Total for Other Cities 27,780.10 0.00 23,474.92
Total for HARDING County 10,211,983.36 22,131.22 1,130,631.52
**************************************************************** COUNTY RECAP ***************************************************************
****************************************************************************************************************************************************
HardingCounty:Agriculture, Forestry, & Fishing 10,015.50 0.00 10,015.50AMining 8,299,461.87 0.00 18,178.04BTransportation & Public Utilities 15,376.17 125.71 15,411.88EWholesale Trade 138,853.46 617.80 74,251.37FRetail Trade 1,598,736.77 21,255.33 887,045.05GServices 149,122.76 132.38 125,490.43IOther 416.83 0.00 239.25
Total for Harding County 10,211,983.36 22,131.22 1,130,631.52
02/12/13Page 49SD Dept. of Revenue

SIC Division Gross Sales Use Taxable Taxable Sales
COUNTY Statistics by Standard Industrial Classification (SIC) Major Group broken down by CITYReturns Filed: January 2013
HUGHESCounty:Blunt
Transportation & Public Utilities 573,110.93 2,918.79 572,862.94EWholesale Trade 42,399.99 259.77 30,130.21FRetail Trade 521,502.78 44.08 99,939.53GServices 124,326.94 516.14 124,664.78IOther 6,153.00 9,504.29 15,557.29
Total for Blunt 1,267,493.64 13,243.06 843,154.75Harrold
Agriculture, Forestry, & Fishing 87,785.03 3,769.43 91,554.46ATransportation & Public Utilities 12,339.91 16.83 2,806.27EWholesale Trade 23,211,469.64 0.73 3,334.82FRetail Trade 321,296.70 91.16 37,893.38GServices 34,127.84 1.70 33,865.33IOther N/A N/A N/A
Total for Harrold 23,667,019.12 3,879.85 169,454.26Pierre
Agriculture, Forestry, & Fishing 467,697.92 9,295.93 444,718.16AManufacturing 459,441.54 5,949.37 240,942.37DTransportation & Public Utilities 3,405,436.02 74,079.56 1,387,804.20EWholesale Trade 2,884,835.83 12,687.40 793,829.52FRetail Trade 38,899,880.98 161,717.06 22,538,121.79GFinance, Insurance, & Real Estate 482,385.76 82,126.64 422,804.69HServices 9,556,009.23 281,505.71 4,799,291.40IPublic Administration 1,905.18 0.00 1,785.18JOther N/A N/A N/A
Total for Pierre 56,185,241.12 627,361.67 30,637,297.31
Total for HUGHES County 81,119,753.88 644,484.59 31,649,906.32
**************************************************************** COUNTY RECAP ***************************************************************
****************************************************************************************************************************************************
HughesCounty:Agriculture, Forestry, & Fishing 561,635.95 13,065.36 542,325.62AManufacturing 459,441.54 5,949.37 240,942.37DTransportation & Public Utilities 3,990,886.86 77,015.18 1,963,473.41EWholesale Trade 26,138,705.46 12,947.90 827,294.55FRetail Trade 39,742,680.47 161,852.30 22,675,954.70GFinance, Insurance, & Real Estate 482,385.76 91,630.93 432,308.98HServices 9,714,464.01 282,023.54 4,957,821.51IPublic Administration 1,905.18 0.00 1,785.18JOther N/A N/A N/A
Total for Hughes County 81,119,753.88 644,484.59 31,649,906.32
02/12/13Page 50SD Dept. of Revenue

SIC Division Gross Sales Use Taxable Taxable Sales
COUNTY Statistics by Standard Industrial Classification (SIC) Major Group broken down by CITYReturns Filed: January 2013
HUTCHINSONCounty:Dimock
Retail Trade 332,041.68 819.41 135,954.37GServices 58,333.63 0.00 47,399.42IOther 207,214.81 478.38 5,527.94
Total for Dimock 597,590.11 1,297.80 188,881.73Freeman
Agriculture, Forestry, & Fishing 6,370.94 13,438.99 19,154.21AManufacturing 64,042.89 254.58 34,110.78DTransportation & Public Utilities 173,451.53 53.15 25,937.17EWholesale Trade 1,084,279.16 7,793.28 294,057.76FRetail Trade 8,115,381.13 18,152.53 3,187,170.57GServices 678,252.86 8,519.76 388,812.35IOther N/A N/A N/A
Total for Freeman 10,141,838.27 48,212.29 3,966,418.60Kaylor
Retail Trade 114,277.62 763.75 88,915.42GOther N/A N/A N/A
Total for Kaylor 1,728,119.37 1,095.48 96,497.65Menno
Agriculture, Forestry, & Fishing 67,719.03 9,521.00 14,914.33AManufacturing 368,506.96 636.88 20,319.08DTransportation & Public Utilities 36,848.72 9.50 15,183.22EWholesale Trade 1,198,668.54 14,547.72 144,901.87FRetail Trade 1,139,667.61 1,588.06 844,933.96GFinance, Insurance, & Real Estate 10,007.66 100.00 370.08HServices 132,904.10 2,502.05 119,181.31I
Total for Menno 2,954,322.62 28,905.21 1,159,803.85Olivet
Manufacturing 109,671.61 0.00 105,633.63DWholesale Trade 1,452.27 1.01 335.84FRetail Trade 844,522.90 11,620.31 26,959.74GServices 21,005.94 8,105.62 16,962.05IOther 59,522.83 0.96 50,101.99
Total for Olivet 1,036,175.55 19,727.90 199,993.25Parkston
Agriculture, Forestry, & Fishing 324,430.24 432.79 212,116.38AManufacturing 212,939.83 7.84 14,593.18DTransportation & Public Utilities 96,846.84 485.52 62,923.37EWholesale Trade 5,515,159.08 4,343.12 35,719.33FRetail Trade 6,530,123.96 14,347.50 3,718,800.88GFinance, Insurance, & Real Estate 22,541.30 0.00 14,481.80HServices 1,147,830.34 39,119.61 815,549.72IOther N/A N/A N/A
Total for Parkston 13,931,245.47 58,736.39 4,914,921.97Tripp
Agriculture, Forestry, & Fishing 7,699.50 2,207.28 9,906.78AWholesale Trade 1,816.14 10,646.00 11,477.08FRetail Trade 544,466.23 274.72 185,123.64GServices 149,517.47 9,452.67 106,742.29IOther N/A N/A N/A
Total for Tripp 712,510.42 22,676.59 322,356.79
02/12/13Page 51SD Dept. of Revenue

SIC Division Gross Sales Use Taxable Taxable Sales
COUNTY Statistics by Standard Industrial Classification (SIC) Major Group broken down by CITYReturns Filed: January 2013
Other CitiesRetail Trade 1,832,489.33 35,075.55 98,998.49GServices 94,099.91 234,841.96 325,589.98IOther 124,779.55 68,065.27 90,952.47
Total for Other Cities 2,051,368.79 337,982.78 515,540.94
Total for HUTCHINSON County 33,153,170.59 518,634.44 11,364,414.78
**************************************************************** COUNTY RECAP ***************************************************************
****************************************************************************************************************************************************
HutchinsonCounty:Agriculture, Forestry, & Fishing 458,191.15 25,874.08 308,337.16AManufacturing 784,426.98 68,696.26 251,898.17DTransportation & Public Utilities 321,174.76 682.01 118,205.26EWholesale Trade 9,696,946.60 37,916.58 491,821.05FRetail Trade 19,452,970.45 82,641.84 8,286,857.07GFinance, Insurance, & Real Estate 52,413.76 100.00 25,294.88HServices 2,285,613.25 302,723.67 1,824,088.12IOther N/A N/A N/A
Total for Hutchinson County 33,153,170.59 518,634.44 11,364,414.78
02/12/13Page 52SD Dept. of Revenue

SIC Division Gross Sales Use Taxable Taxable Sales
COUNTY Statistics by Standard Industrial Classification (SIC) Major Group broken down by CITYReturns Filed: January 2013
HYDECounty:Highmore
Agriculture, Forestry, & Fishing 432,567.21 10,087.64 215,684.73AManufacturing 25,898.09 439.41 6,353.00DTransportation & Public Utilities 1,099,664.60 55,873.78 1,016,148.75EWholesale Trade 1,955,746.35 9,033.99 95,905.89FRetail Trade 2,582,301.06 2,681.65 655,537.29GFinance, Insurance, & Real Estate 21,714.34 0.00 21,714.34HServices 111,035.65 2,165.55 91,254.86IOther N/A N/A N/A
Total for Highmore 6,273,919.45 80,282.02 2,147,591.01Holabird
Other N/A N/A N/A
Total for Holabird N/A N/A N/AStephan
Other N/A N/A N/A
Total for Stephan N/A N/A N/AOther Cities
Other N/A N/A N/A
Total for Other Cities N/A N/A N/A
Total for HYDE County 6,459,882.49 80,582.02 2,213,845.95
**************************************************************** COUNTY RECAP ***************************************************************
****************************************************************************************************************************************************
HydeCounty:Agriculture, Forestry, & Fishing 432,567.21 10,087.64 215,684.73AManufacturing 25,898.09 439.41 6,353.00DTransportation & Public Utilities 1,099,664.60 55,873.78 1,016,148.75EWholesale Trade 1,955,746.35 9,033.99 95,905.89FRetail Trade 2,758,464.10 2,981.65 711,992.23GFinance, Insurance, & Real Estate 21,714.34 0.00 21,714.34HServices 120,835.65 2,165.55 101,054.86IOther N/A N/A N/A
Total for Hyde County 6,459,882.49 80,582.02 2,213,845.95
02/12/13Page 53SD Dept. of Revenue

SIC Division Gross Sales Use Taxable Taxable Sales
COUNTY Statistics by Standard Industrial Classification (SIC) Major Group broken down by CITYReturns Filed: January 2013
JACKSONCounty:Belvidere
Transportation & Public Utilities 269.89 2.24 243.00ERetail Trade 17,861.75 415.52 16,465.50GOther 16,872.13 155.88 16,565.89
Total for Belvidere 35,003.77 573.65 33,274.39Interior
Retail Trade 123,367.09 583.46 88,143.83GServices 11,939.59 1.74 8,922.05IOther 11,948.96 20.55 10,122.85
Total for Interior 147,255.64 605.75 107,188.73Kadoka
Agriculture, Forestry, & Fishing 36,556.05 485.66 23,750.38AManufacturing 472,462.37 90.34 10,446.95DTransportation & Public Utilities 17,553.40 159.86 17,382.10EWholesale Trade 2,528.79 114.20 2,642.99FRetail Trade 1,897,267.43 2,541.69 587,738.74GServices 121,723.44 137.45 103,206.45I
Total for Kadoka 2,548,091.47 3,529.19 745,167.61Other Cities
Agriculture, Forestry, & Fishing 1,831.21 0.00 1,831.21ARetail Trade 317,034.38 441.16 142,582.91GServices 13,786.11 0.00 13,786.11IOther N/A N/A N/A
Total for Other Cities 332,651.70 441.16 158,200.23
Total for JACKSON County 3,063,002.58 5,149.75 1,043,830.96
**************************************************************** COUNTY RECAP ***************************************************************
****************************************************************************************************************************************************
JacksonCounty:Agriculture, Forestry, & Fishing 52,341.15 641.54 38,558.24AManufacturing 472,775.33 93.28 10,516.95DTransportation & Public Utilities 19,826.38 179.71 19,474.05EWholesale Trade 4,377.33 114.20 3,733.53FRetail Trade 2,355,530.65 3,981.83 834,930.98GServices 158,151.74 139.19 136,617.21IOther N/A N/A N/A
Total for Jackson County 3,063,002.58 5,149.75 1,043,830.96
02/12/13Page 54SD Dept. of Revenue

SIC Division Gross Sales Use Taxable Taxable Sales
COUNTY Statistics by Standard Industrial Classification (SIC) Major Group broken down by CITYReturns Filed: January 2013
JERAULDCounty:Alpena
Manufacturing 22,618,773.15 440,144.69 598,191.55DTransportation & Public Utilities 29,057.85 114.03 27,894.20EWholesale Trade 1,301,483.64 1,444.32 13,486.44FRetail Trade 3,260,158.91 1,927.43 265,457.50GServices 151,742.84 264.76 45,470.49IOther 698.10 394.40 1,092.50
Total for Alpena 27,361,914.49 444,289.62 951,592.68Lane
Other 13,092.96 334.33 13,427.29
Total for Lane 13,092.96 334.33 13,427.29Wessington Springs
Agriculture, Forestry, & Fishing 204,388.80 0.00 203,175.81AManufacturing 32,363.44 67.77 15,325.11DTransportation & Public Utilities 153,606.13 218.01 130,276.77EWholesale Trade 1,075,777.94 4,395.38 194,910.28FRetail Trade 2,323,840.91 1,657.50 749,884.22GFinance, Insurance, & Real Estate 15,943.44 6,729.89 13,847.99HServices 455,075.87 8,328.02 310,148.71I
Total for Wessington Springs 4,260,996.52 21,396.57 1,617,568.89Other Cities
Services 131,314.49 0.00 131,314.49IOther 4,844.14 307.00 5,151.14
Total for Other Cities 136,158.63 307.00 136,465.63
Total for JERAULD County 31,772,162.60 466,327.52 2,719,054.49
**************************************************************** COUNTY RECAP ***************************************************************
****************************************************************************************************************************************************
JerauldCounty:Agriculture, Forestry, & Fishing 204,967.80 0.00 203,754.81AManufacturing 22,651,136.58 440,212.46 613,516.66DTransportation & Public Utilities 185,311.98 332.04 160,818.97EWholesale Trade 2,380,787.72 5,959.69 212,042.86FRetail Trade 5,595,696.55 4,106.26 1,027,559.78GFinance, Insurance, & Real Estate 16,062.54 7,124.29 14,361.49HServices 738,199.42 8,592.78 486,999.92I
Total for Jerauld County 31,772,162.60 466,327.52 2,719,054.49
02/12/13Page 55SD Dept. of Revenue

SIC Division Gross Sales Use Taxable Taxable Sales
COUNTY Statistics by Standard Industrial Classification (SIC) Major Group broken down by CITYReturns Filed: January 2013
JONESCounty:Draper
Agriculture, Forestry, & Fishing 6,375.00 0.00 6,375.00ARetail Trade 15,574.36 0.00 15,574.36GServices 492,801.41 28.11 57,480.64IOther 6,857.00 59.50 769.50
Total for Draper 521,607.77 87.61 80,199.50Murdo
Agriculture, Forestry, & Fishing 48,543.67 91.59 45,024.21AManufacturing 12,123.06 43.74 6,101.65DTransportation & Public Utilities 1,180,814.40 22,880.89 1,020,294.14EWholesale Trade 142,744.83 881.48 24,239.51FRetail Trade 4,036,493.75 4,559.59 970,409.31GServices 797,748.86 5,102.04 256,216.63IOther N/A N/A N/A
Total for Murdo 6,218,468.57 33,559.33 2,322,285.45Okaton
Services 1,754.24 180.00 1,674.67IOther 19,688.19 0.00 2,627.40
Total for Okaton 21,442.43 180.00 4,302.07Other Cities
Other 17,992.50 0.00 17,967.00
Total for Other Cities 17,992.50 0.00 17,967.00
Total for JONES County 6,779,511.27 33,826.94 2,424,754.02
**************************************************************** COUNTY RECAP ***************************************************************
****************************************************************************************************************************************************
JonesCounty:Agriculture, Forestry, & Fishing 61,015.82 91.59 56,551.61AManufacturing 12,123.06 43.74 6,101.65DTransportation & Public Utilities 1,181,174.40 22,880.89 1,020,654.14EWholesale Trade 149,241.83 881.48 24,589.51FRetail Trade 4,083,559.15 4,559.59 1,001,358.67GServices 1,292,397.01 5,310.15 315,438.94IOther N/A N/A N/A
Total for Jones County 6,779,511.27 33,826.94 2,424,754.02
02/12/13Page 56SD Dept. of Revenue

SIC Division Gross Sales Use Taxable Taxable Sales
COUNTY Statistics by Standard Industrial Classification (SIC) Major Group broken down by CITYReturns Filed: January 2013
KINGSBURYCounty:Arlington
Agriculture, Forestry, & Fishing 2,160.00 76,279.00 78,439.00AManufacturing 745,588.85 20,493.29 47,930.98DTransportation & Public Utilities 235,797.87 123,125.28 331,872.80EWholesale Trade 453,828.48 3,862.23 79,535.58FRetail Trade 2,185,070.86 12,982.41 457,793.68GFinance, Insurance, & Real Estate 3,380.69 665.61 4,015.60HServices 333,505.07 6,052.31 197,048.18IOther N/A N/A N/A
Total for Arlington 3,961,417.82 243,460.13 1,198,721.82Badger
Retail Trade 570,391.75 986.27 170,730.27GServices 2,502.83 0.00 1,902.83IOther N/A N/A N/A
Total for Badger 3,084,951.11 986.27 187,142.84Desmet
Agriculture, Forestry, & Fishing 63,966.60 18.53 62,834.85AManufacturing 2,518,541.33 44,862.57 66,998.17DTransportation & Public Utilities 417,036.79 13,094.12 414,327.46EWholesale Trade 16,078.66 23.73 5,808.12FRetail Trade 2,827,262.47 2,296.97 1,534,137.68GFinance, Insurance, & Real Estate 16,022.31 1,378.84 17,024.60HServices 1,171,902.00 26,518.45 345,153.10IOther N/A N/A N/A
Total for Desmet 7,032,870.38 88,193.22 2,448,344.20Erwin
Other N/A N/A N/A
Total for Erwin N/A N/A N/AIroquois
Manufacturing 11,679.29 188.91 7,834.92DTransportation & Public Utilities 13,230.41 60.45 10,984.20EWholesale Trade 2,549,050.47 106.68 29,258.41FRetail Trade 1,189,773.62 31,412.76 554,335.74GServices 403,772.73 13,549.23 62,698.78IOther N/A N/A N/A
Total for Iroquois 4,806,321.39 45,526.03 669,971.81Lake Preston
Agriculture, Forestry, & Fishing 6,078.43 0.00 6,078.43AManufacturing 17,105.31 8,880.34 12,481.82DTransportation & Public Utilities 208,633.02 627.97 66,855.38EWholesale Trade 6,592,659.72 3,434.05 187,615.70FRetail Trade 405,381.11 2,746.74 305,578.75GServices 60,354.41 432.05 51,393.84IOther 5,995.86 0.00 5,994.40
Total for Lake Preston 7,296,207.85 16,121.15 635,998.32Oldham
Retail Trade 771,933.67 243.68 112,458.10GServices 8,192.95 79.54 7,819.92IOther 5,324,294.94 11.48 7,081.51
Total for Oldham 6,104,421.56 334.70 127,359.53
02/12/13Page 57SD Dept. of Revenue

SIC Division Gross Sales Use Taxable Taxable Sales
COUNTY Statistics by Standard Industrial Classification (SIC) Major Group broken down by CITYReturns Filed: January 2013
Other CitiesOther 470,667.13 979.12 45,369.87
Total for Other Cities 470,667.13 979.12 45,369.87
Total for KINGSBURY County 32,765,386.10 395,600.62 5,319,132.62
**************************************************************** COUNTY RECAP ***************************************************************
****************************************************************************************************************************************************
KingsburyCounty:Agriculture, Forestry, & Fishing 713,569.90 76,505.53 154,762.04AConstruction 4,146.22 0.00 4,146.22CManufacturing 3,292,914.78 74,425.11 135,245.89DTransportation & Public Utilities 889,366.45 136,919.17 838,563.08EWholesale Trade 17,429,646.09 7,426.81 305,631.48FRetail Trade 8,417,930.61 51,647.96 3,177,854.09GFinance, Insurance, & Real Estate 29,053.19 2,044.45 30,688.94HServices 1,988,758.86 46,631.59 672,240.88IOther N/A N/A N/A
Total for Kingsbury County 32,765,386.10 395,600.62 5,319,132.62
02/12/13Page 58SD Dept. of Revenue

SIC Division Gross Sales Use Taxable Taxable Sales
COUNTY Statistics by Standard Industrial Classification (SIC) Major Group broken down by CITYReturns Filed: January 2013
LAKECounty:Chester
Agriculture, Forestry, & Fishing 15,620.00 0.00 620.00ARetail Trade 440,732.79 476.00 220,329.24GServices 46,653.30 228.90 23,824.68IOther N/A N/A N/A
Total for Chester 508,522.93 704.90 250,290.76Madison
Agriculture, Forestry, & Fishing 1,512,023.12 5,327.25 345,000.60AManufacturing 5,183,274.62 64,210.07 1,392,395.20DTransportation & Public Utilities 17,178,328.69 540,834.23 1,699,608.06EWholesale Trade 16,716,321.26 111,787.09 568,131.14FRetail Trade 22,835,259.89 63,203.27 10,161,025.28GFinance, Insurance, & Real Estate 95,976.44 3,361.97 98,328.28HServices 3,056,510.87 176,460.40 1,040,757.50IOther N/A N/A N/A
Total for Madison 66,595,994.31 965,184.27 15,311,344.29Nunda
Other 10,119.75 10.00 10,129.75
Total for Nunda 10,119.75 10.00 10,129.75Ramona
Agriculture, Forestry, & Fishing 185,519.06 5,586.08 13,786.08ARetail Trade 287,502.34 117.26 51,919.53GServices 16,608.58 0.00 9,304.75IOther 3,055,267.81 46.72 14,066.95
Total for Ramona 3,544,897.79 5,750.06 89,077.31Rutland
Services 31,943.83 1,241.81 19,763.68IOther N/A N/A N/A
Total for Rutland 85,083.64 1,241.81 46,599.34Wentworth
Agriculture, Forestry, & Fishing 94,616.48 358.05 31,665.97AManufacturing 10,035,777.78 19,243.79 134,564.43DWholesale Trade 74,755.48 0.27 1,282.30FRetail Trade 111,791.84 952.86 97,003.20GServices 753,101.56 27,952.68 289,157.90IOther 7,575.35 18.76 7,594.11
Total for Wentworth 11,077,618.49 48,526.42 561,267.91Winfred
Retail Trade 135,003.85 0.00 128,157.56GOther 80,067.18 17,632.92 43,677.50
Total for Winfred 215,071.03 17,632.92 171,835.06Other Cities
Other N/A N/A N/A
Total for Other Cities N/A N/A N/A
02/12/13Page 59SD Dept. of Revenue

SIC Division Gross Sales Use Taxable Taxable Sales
COUNTY Statistics by Standard Industrial Classification (SIC) Major Group broken down by CITYReturns Filed: January 2013
Total for LAKE County 82,038,308.24 1,039,431.81 16,441,698.34
**************************************************************** COUNTY RECAP ***************************************************************
****************************************************************************************************************************************************
LakeCounty:Agriculture, Forestry, & Fishing 1,831,551.27 11,271.38 414,095.26AManufacturing 15,294,426.93 101,493.79 1,560,925.64DTransportation & Public Utilities 17,189,776.74 540,874.13 1,711,096.01EWholesale Trade 19,828,295.02 111,787.36 571,332.19FRetail Trade 23,871,534.27 64,759.39 10,693,384.22GFinance, Insurance, & Real Estate 99,606.44 3,361.97 101,958.28HServices 3,904,818.14 205,883.79 1,382,808.51IOther N/A N/A N/A
Total for Lake County 82,038,308.24 1,039,431.81 16,441,698.34
02/12/13Page 60SD Dept. of Revenue

SIC Division Gross Sales Use Taxable Taxable Sales
COUNTY Statistics by Standard Industrial Classification (SIC) Major Group broken down by CITYReturns Filed: January 2013
LAWRENCECounty:Deadwood
Agriculture, Forestry, & Fishing 35,042.81 0.00 35,042.81AManufacturing 87,107.56 560.89 32,084.91DTransportation & Public Utilities 147,403.09 4,474.22 145,858.20EWholesale Trade 129,451.00 199.79 45,263.92FRetail Trade 4,924,766.55 110,437.39 2,005,057.62GFinance, Insurance, & Real Estate 122,124.21 0.00 122,124.21HServices 10,043,240.47 421,663.18 3,071,027.05IOther 4,962.30 0.00 4,466.35
Total for Deadwood 15,494,097.99 537,335.47 5,460,925.07Lead/Central City
Agriculture, Forestry, & Fishing 4,270.40 100.00 4,330.40AMining 0.00 174,902.50 174,902.50BManufacturing 81,176.82 1,201.40 6,425.15DTransportation & Public Utilities 139,304.05 5,858.82 131,527.11EWholesale Trade 375,760.28 21.36 12,461.43FRetail Trade 2,094,731.89 3,718.72 1,489,314.33GFinance, Insurance, & Real Estate 201,008.55 1,576.58 197,618.81HServices 1,572,990.53 17,225.65 1,375,493.77I
Total for Lead/Central City 4,469,242.50 204,605.02 3,392,073.50Nemo
Retail Trade 13,950.25 89.11 12,436.44GServices 1,026,694.25 0.00 46,086.88IOther N/A N/A N/A
Total for Nemo 1,042,842.00 89.11 60,720.82Saint Onge
Retail Trade 41,066.50 0.00 30,988.20GServices 183,224.47 0.00 159,576.97IOther 78,422.50 0.00 77,654.50
Total for Saint Onge 302,713.47 0.00 268,219.67Spearfish
Agriculture, Forestry, & Fishing 418,955.75 47,048.15 294,835.51AMining 16,167.35 0.00 11,996.07BManufacturing 10,471,986.00 114,768.13 319,248.77DTransportation & Public Utilities 2,753,623.94 33,889.48 800,907.07EWholesale Trade 1,785,110.15 4,682.08 270,344.82FRetail Trade 49,207,889.89 117,626.18 19,504,029.82GFinance, Insurance, & Real Estate 1,966,549.90 21,453.07 708,117.89HServices 5,321,259.22 389,756.80 3,580,654.20IOther N/A N/A N/A
Total for Spearfish 71,991,108.47 729,223.89 25,506,689.66Whitewood
Agriculture, Forestry, & Fishing 5,407.49 0.00 5,407.49AManufacturing 311,483.30 767.21 69,881.88DTransportation & Public Utilities 61,415.85 741.73 60,260.85EWholesale Trade 383,224.39 1,000.57 331,735.38FRetail Trade 1,078,784.98 2,656.42 447,444.47GFinance, Insurance, & Real Estate 839.57 0.00 838.62HServices 601,167.89 27,719.13 471,323.20IOther N/A N/A N/A
Total for Whitewood 2,471,726.91 32,885.06 1,388,401.46
02/12/13Page 61SD Dept. of Revenue

SIC Division Gross Sales Use Taxable Taxable Sales
COUNTY Statistics by Standard Industrial Classification (SIC) Major Group broken down by CITYReturns Filed: January 2013
Other CitiesRetail Trade 19,207.05 343.00 11,227.77GFinance, Insurance, & Real Estate 359,427.06 6,743.46 295,837.67HServices 59,728.53 176.80 33,964.09IOther N/A N/A N/A
Total for Other Cities 446,947.21 7,272.19 349,623.03
Total for LAWRENCE County 96,218,678.54 1,511,410.74 36,426,653.21
**************************************************************** COUNTY RECAP ***************************************************************
****************************************************************************************************************************************************
LawrenceCounty:Agriculture, Forestry, & Fishing 542,098.95 47,148.15 417,270.71AMining 18,611.54 174,902.50 188,517.06BConstruction 80,769.52 0.00 20,194.65CManufacturing 10,951,753.68 117,297.63 427,640.71DTransportation & Public Utilities 3,106,413.92 44,964.25 1,143,220.23EWholesale Trade 2,677,463.39 5,912.74 663,732.05FRetail Trade 57,380,397.11 234,870.82 23,500,498.65GFinance, Insurance, & Real Estate 2,652,146.79 29,773.11 1,326,734.70HServices 18,808,305.36 856,541.55 8,738,126.16IOther N/A N/A N/A
Total for Lawrence County 96,218,678.54 1,511,410.74 36,426,653.21
02/12/13Page 62SD Dept. of Revenue

SIC Division Gross Sales Use Taxable Taxable Sales
COUNTY Statistics by Standard Industrial Classification (SIC) Major Group broken down by CITYReturns Filed: January 2013
LINCOLNCounty:Beresford
Manufacturing 154,949.99 3,366.71 76,219.85DTransportation & Public Utilities 11,870.07 125.11 11,979.17EWholesale Trade 90,547.86 865.95 39,252.99FRetail Trade 1,510,859.65 2,945.56 676,829.28GServices 395,707.97 498.95 246,311.68IOther 175,365.60 0.00 144,632.59
Total for Beresford 2,339,301.15 7,802.28 1,195,225.56Canton
Agriculture, Forestry, & Fishing 36,635.40 0.00 35,708.94AManufacturing 32,363,337.31 1,686,367.23 1,742,754.56DTransportation & Public Utilities 120,136.45 5,373.65 119,264.90EWholesale Trade 446,951.16 249.78 40,351.23FRetail Trade 5,871,279.54 288,951.93 2,546,349.03GFinance, Insurance, & Real Estate 106,898.53 923.50 40,797.42HServices 10,089,340.37 107,446.93 778,936.09IOther 895.17 0.00 895.17
Total for Canton 49,035,473.93 2,089,313.04 5,305,057.34Fairview
Retail Trade 8,413.30 0.00 4,726.45GServices 11,178.97 0.00 11,178.97IOther 13,724.49 0.00 13,724.49
Total for Fairview 33,316.76 0.00 29,629.91Harrisburg
Agriculture, Forestry, & Fishing 523,623.50 2,955.73 492,725.79AConstruction 155,572.18 0.00 25,660.47CManufacturing 83,985,365.48 47,067.25 168,530.66DTransportation & Public Utilities 179,284.94 7,774.09 166,854.17EWholesale Trade 136,028.38 102.58 99,193.73FRetail Trade 4,545,697.14 9,087.08 1,709,418.00GFinance, Insurance, & Real Estate 15,505.79 45.99 15,320.64HServices 809,479.27 17,941.61 444,648.65IOther N/A N/A N/A
Total for Harrisburg 90,350,781.67 85,024.33 3,122,402.11Hudson
Manufacturing 12,821,320.03 62,512.86 64,155.46DTransportation & Public Utilities 6,651.18 26.81 6,603.74EWholesale Trade 85,778.15 4.01 2,908.58FRetail Trade 2,433,541.08 3,117.99 235,671.87GFinance, Insurance, & Real Estate 5,835.25 0.00 1,681.30HServices 37,070.89 49,613.84 77,280.87IOther 4,115.50 3,900.00 7,603.50
Total for Hudson 15,394,312.08 119,175.52 395,905.32Lennox
Agriculture, Forestry, & Fishing 73,336.62 1,024.23 72,735.85AManufacturing 655,499.03 27,120.76 80,556.95DTransportation & Public Utilities 190,851.72 2,341.92 173,903.37EWholesale Trade -83,325.48 -4,521.37 43,919.26FRetail Trade 4,498,522.72 6,940.28 1,207,853.06GFinance, Insurance, & Real Estate 14,476.46 249.38 14,612.39HServices 2,496,624.06 18,875.62 458,338.65I
Total for Lennox 7,845,985.13 52,030.82 2,051,919.53
02/12/13Page 63SD Dept. of Revenue
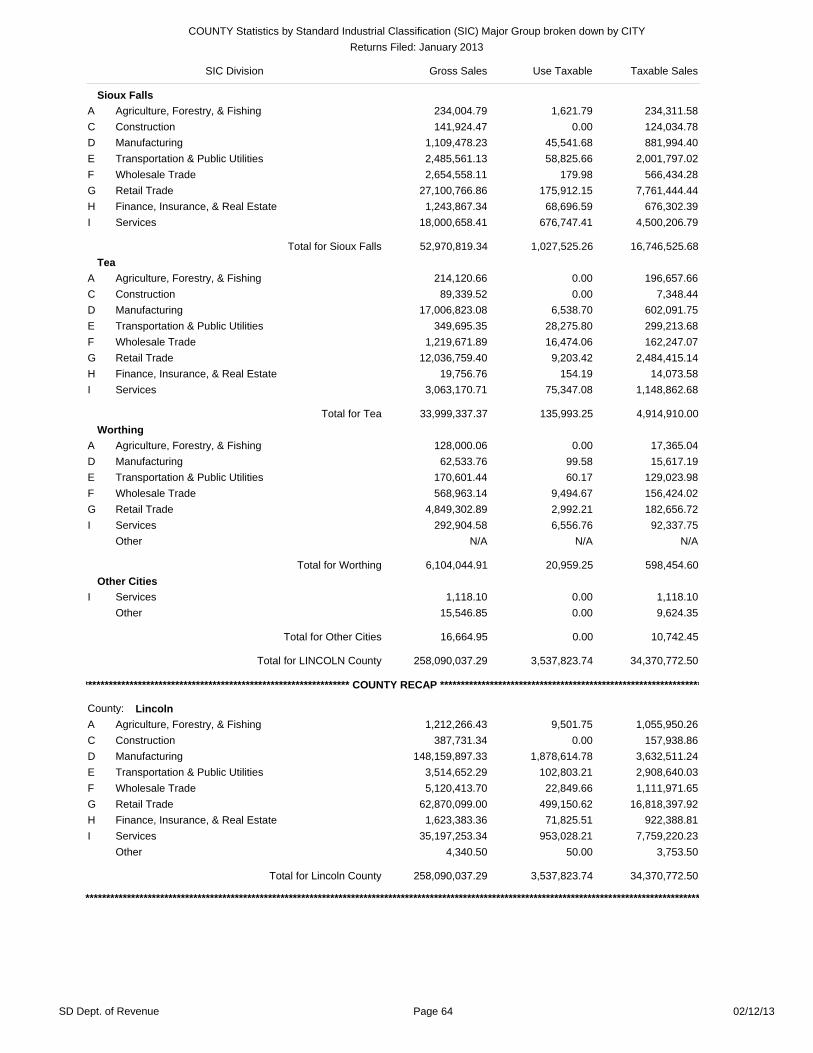
SIC Division Gross Sales Use Taxable Taxable Sales
COUNTY Statistics by Standard Industrial Classification (SIC) Major Group broken down by CITYReturns Filed: January 2013
Sioux FallsAgriculture, Forestry, & Fishing 234,004.79 1,621.79 234,311.58AConstruction 141,924.47 0.00 124,034.78CManufacturing 1,109,478.23 45,541.68 881,994.40DTransportation & Public Utilities 2,485,561.13 58,825.66 2,001,797.02EWholesale Trade 2,654,558.11 179.98 566,434.28FRetail Trade 27,100,766.86 175,912.15 7,761,444.44GFinance, Insurance, & Real Estate 1,243,867.34 68,696.59 676,302.39HServices 18,000,658.41 676,747.41 4,500,206.79I
Total for Sioux Falls 52,970,819.34 1,027,525.26 16,746,525.68Tea
Agriculture, Forestry, & Fishing 214,120.66 0.00 196,657.66AConstruction 89,339.52 0.00 7,348.44CManufacturing 17,006,823.08 6,538.70 602,091.75DTransportation & Public Utilities 349,695.35 28,275.80 299,213.68EWholesale Trade 1,219,671.89 16,474.06 162,247.07FRetail Trade 12,036,759.40 9,203.42 2,484,415.14GFinance, Insurance, & Real Estate 19,756.76 154.19 14,073.58HServices 3,063,170.71 75,347.08 1,148,862.68I
Total for Tea 33,999,337.37 135,993.25 4,914,910.00Worthing
Agriculture, Forestry, & Fishing 128,000.06 0.00 17,365.04AManufacturing 62,533.76 99.58 15,617.19DTransportation & Public Utilities 170,601.44 60.17 129,023.98EWholesale Trade 568,963.14 9,494.67 156,424.02FRetail Trade 4,849,302.89 2,992.21 182,656.72GServices 292,904.58 6,556.76 92,337.75IOther N/A N/A N/A
Total for Worthing 6,104,044.91 20,959.25 598,454.60Other Cities
Services 1,118.10 0.00 1,118.10IOther 15,546.85 0.00 9,624.35
Total for Other Cities 16,664.95 0.00 10,742.45
Total for LINCOLN County 258,090,037.29 3,537,823.74 34,370,772.50
**************************************************************** COUNTY RECAP ***************************************************************
****************************************************************************************************************************************************
LincolnCounty:Agriculture, Forestry, & Fishing 1,212,266.43 9,501.75 1,055,950.26AConstruction 387,731.34 0.00 157,938.86CManufacturing 148,159,897.33 1,878,614.78 3,632,511.24DTransportation & Public Utilities 3,514,652.29 102,803.21 2,908,640.03EWholesale Trade 5,120,413.70 22,849.66 1,111,971.65FRetail Trade 62,870,099.00 499,150.62 16,818,397.92GFinance, Insurance, & Real Estate 1,623,383.36 71,825.51 922,388.81HServices 35,197,253.34 953,028.21 7,759,220.23IOther 4,340.50 50.00 3,753.50
Total for Lincoln County 258,090,037.29 3,537,823.74 34,370,772.50
02/12/13Page 64SD Dept. of Revenue

SIC Division Gross Sales Use Taxable Taxable Sales
COUNTY Statistics by Standard Industrial Classification (SIC) Major Group broken down by CITYReturns Filed: January 2013
LYMANCounty:Kennebec
Agriculture, Forestry, & Fishing 230,974.36 0.00 217,460.36ATransportation & Public Utilities 130,317.64 68,549.18 167,064.67EWholesale Trade 723,609.07 989.49 6,814.07FRetail Trade 284,146.76 1,849.36 129,339.13GServices 97,092.79 3,605.34 80,428.43IOther 42,623.92 6.14 35,821.67
Total for Kennebec 1,508,764.54 74,999.50 636,928.33Lower Brule
Other 14,183.66 504.40 14,438.06
Total for Lower Brule 14,183.66 504.40 14,438.06Oacoma
Transportation & Public Utilities 9,119.41 63.36 6,525.00EWholesale Trade 9,370.25 513.05 6,915.20FRetail Trade 2,763,318.27 11,232.28 1,163,276.63GServices 300,545.41 1,101.92 220,099.13IOther 32,240.74 0.00 14,126.66
Total for Oacoma 3,114,594.09 12,910.61 1,410,942.62Presho
Agriculture, Forestry, & Fishing 322,542.84 1,177.00 323,719.84ATransportation & Public Utilities 138.03 1.47 139.50EWholesale Trade 85,138.52 16.38 1,935.25FRetail Trade 749,741.46 3,796.06 237,977.33GServices 313,102.07 2,132.08 311,919.79IOther 37,016.14 847.72 11,716.91
Total for Presho 1,507,679.05 7,970.70 887,408.62Reliance
Wholesale Trade 424,264.72 3,250.44 9,391.17FRetail Trade 483,196.20 1,479.35 157,705.30GServices 41,353.24 7.37 41,344.79IOther 7,201.92 60.35 7,262.27
Total for Reliance 956,016.07 4,797.51 215,703.53Vivian
Retail Trade 2,070,129.18 1,545.60 149,661.30GServices 265,052.54 1,147.98 140,202.14I
Total for Vivian 2,335,181.72 2,693.58 289,863.44Other Cities
Agriculture, Forestry, & Fishing 18,120.00 0.00 18,120.00AOther 36,993.75 0.00 36,993.75
Total for Other Cities 55,113.75 0.00 55,113.75
02/12/13Page 65SD Dept. of Revenue

SIC Division Gross Sales Use Taxable Taxable Sales
COUNTY Statistics by Standard Industrial Classification (SIC) Major Group broken down by CITYReturns Filed: January 2013
Total for LYMAN County 9,491,532.87 103,876.30 3,510,398.35
**************************************************************** COUNTY RECAP ***************************************************************
****************************************************************************************************************************************************
LymanCounty:Agriculture, Forestry, & Fishing 590,157.13 1,177.00 574,859.13AManufacturing 51,060.60 6.14 9,747.27DTransportation & Public Utilities 145,244.73 68,674.36 179,459.17EWholesale Trade 1,242,382.55 4,769.36 25,055.69FRetail Trade 6,360,496.61 19,902.64 1,847,924.44GFinance, Insurance, & Real Estate 43,832.54 847.72 37,891.31HServices 1,058,358.70 8,499.08 835,461.34IOther N/A N/A N/A
Total for Lyman County 9,491,532.87 103,876.30 3,510,398.35
02/12/13Page 66SD Dept. of Revenue
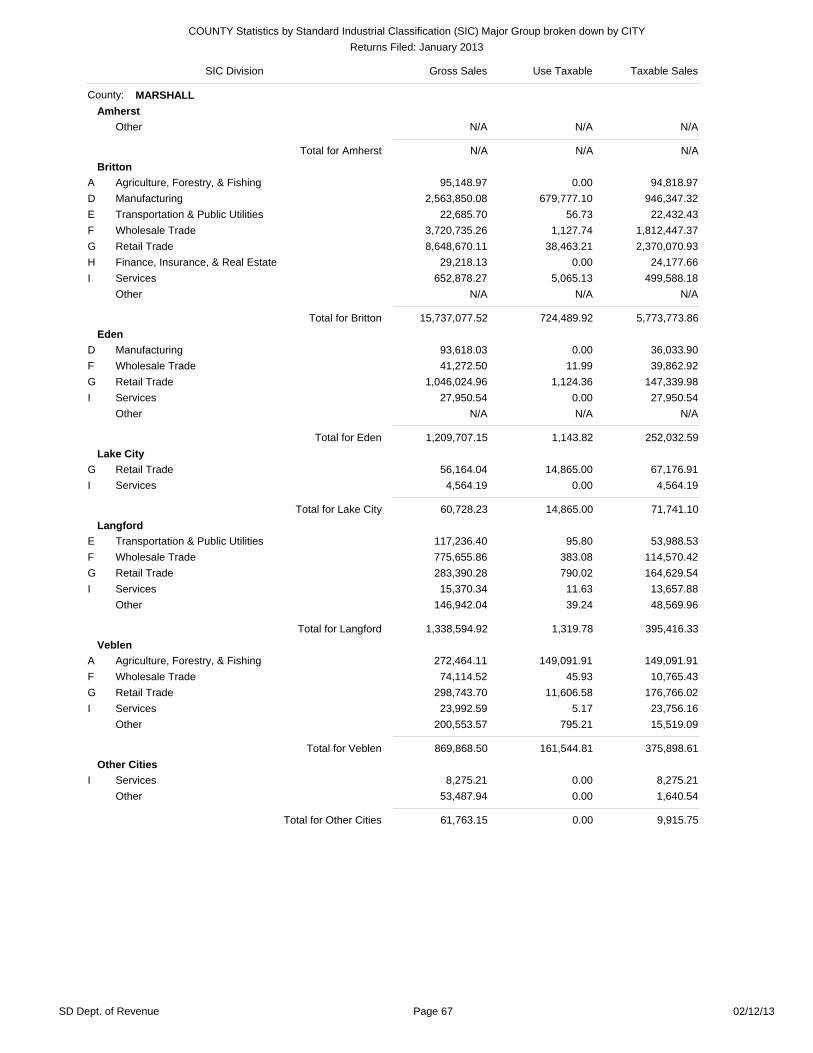
SIC Division Gross Sales Use Taxable Taxable Sales
COUNTY Statistics by Standard Industrial Classification (SIC) Major Group broken down by CITYReturns Filed: January 2013
MARSHALLCounty:Amherst
Other N/A N/A N/A
Total for Amherst N/A N/A N/ABritton
Agriculture, Forestry, & Fishing 95,148.97 0.00 94,818.97AManufacturing 2,563,850.08 679,777.10 946,347.32DTransportation & Public Utilities 22,685.70 56.73 22,432.43EWholesale Trade 3,720,735.26 1,127.74 1,812,447.37FRetail Trade 8,648,670.11 38,463.21 2,370,070.93GFinance, Insurance, & Real Estate 29,218.13 0.00 24,177.66HServices 652,878.27 5,065.13 499,588.18IOther N/A N/A N/A
Total for Britton 15,737,077.52 724,489.92 5,773,773.86Eden
Manufacturing 93,618.03 0.00 36,033.90DWholesale Trade 41,272.50 11.99 39,862.92FRetail Trade 1,046,024.96 1,124.36 147,339.98GServices 27,950.54 0.00 27,950.54IOther N/A N/A N/A
Total for Eden 1,209,707.15 1,143.82 252,032.59Lake City
Retail Trade 56,164.04 14,865.00 67,176.91GServices 4,564.19 0.00 4,564.19I
Total for Lake City 60,728.23 14,865.00 71,741.10Langford
Transportation & Public Utilities 117,236.40 95.80 53,988.53EWholesale Trade 775,655.86 383.08 114,570.42FRetail Trade 283,390.28 790.02 164,629.54GServices 15,370.34 11.63 13,657.88IOther 146,942.04 39.24 48,569.96
Total for Langford 1,338,594.92 1,319.78 395,416.33Veblen
Agriculture, Forestry, & Fishing 272,464.11 149,091.91 149,091.91AWholesale Trade 74,114.52 45.93 10,765.43FRetail Trade 298,743.70 11,606.58 176,766.02GServices 23,992.59 5.17 23,756.16IOther 200,553.57 795.21 15,519.09
Total for Veblen 869,868.50 161,544.81 375,898.61Other Cities
Services 8,275.21 0.00 8,275.21IOther 53,487.94 0.00 1,640.54
Total for Other Cities 61,763.15 0.00 9,915.75
02/12/13Page 67SD Dept. of Revenue

SIC Division Gross Sales Use Taxable Taxable Sales
COUNTY Statistics by Standard Industrial Classification (SIC) Major Group broken down by CITYReturns Filed: January 2013
Total for MARSHALL County 19,288,347.65 903,363.32 6,887,299.42
**************************************************************** COUNTY RECAP ***************************************************************
****************************************************************************************************************************************************
MarshallCounty:Agriculture, Forestry, & Fishing 421,101.02 149,091.91 245,551.42AManufacturing 2,939,242.99 680,512.89 986,120.86DTransportation & Public Utilities 153,249.27 258.67 89,764.27EWholesale Trade 4,611,778.13 1,568.74 1,977,646.14FRetail Trade 10,343,601.28 66,849.17 2,934,504.56GFinance, Insurance, & Real Estate 82,452.83 0.00 72,029.01HServices 733,031.14 5,081.94 577,792.16IOther N/A N/A N/A
Total for Marshall County 19,288,347.65 903,363.32 6,887,299.42
02/12/13Page 68SD Dept. of Revenue
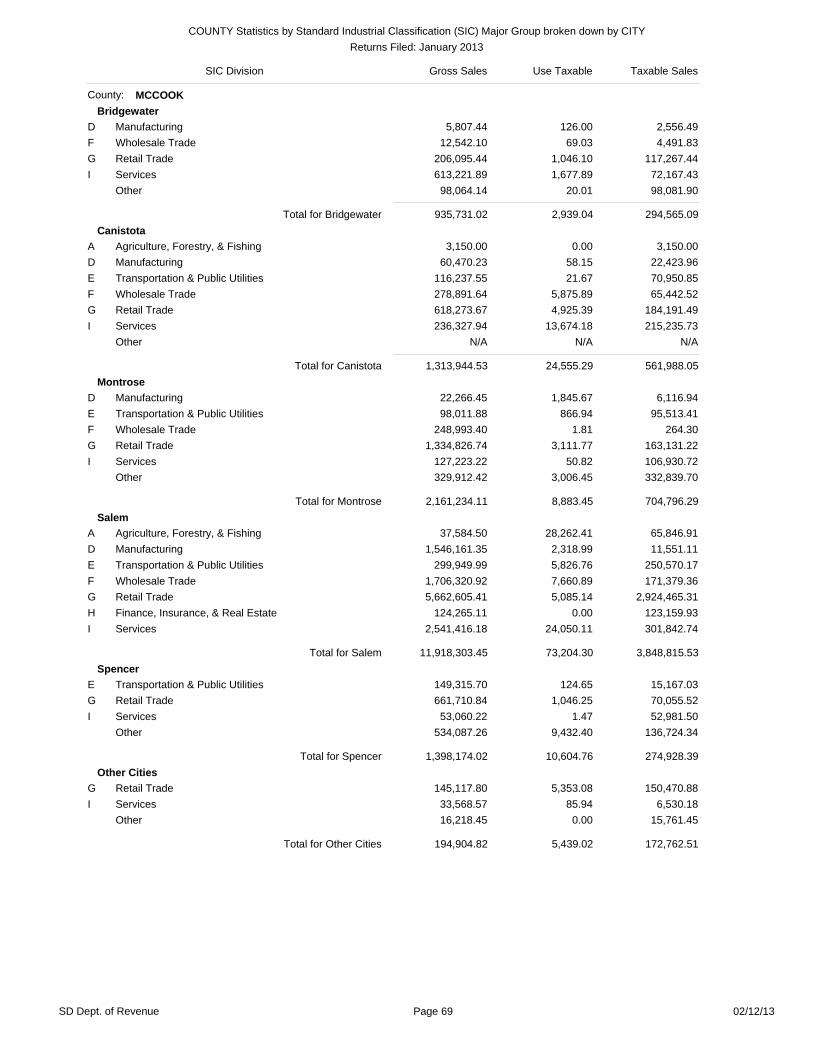
SIC Division Gross Sales Use Taxable Taxable Sales
COUNTY Statistics by Standard Industrial Classification (SIC) Major Group broken down by CITYReturns Filed: January 2013
MCCOOKCounty:Bridgewater
Manufacturing 5,807.44 126.00 2,556.49DWholesale Trade 12,542.10 69.03 4,491.83FRetail Trade 206,095.44 1,046.10 117,267.44GServices 613,221.89 1,677.89 72,167.43IOther 98,064.14 20.01 98,081.90
Total for Bridgewater 935,731.02 2,939.04 294,565.09Canistota
Agriculture, Forestry, & Fishing 3,150.00 0.00 3,150.00AManufacturing 60,470.23 58.15 22,423.96DTransportation & Public Utilities 116,237.55 21.67 70,950.85EWholesale Trade 278,891.64 5,875.89 65,442.52FRetail Trade 618,273.67 4,925.39 184,191.49GServices 236,327.94 13,674.18 215,235.73IOther N/A N/A N/A
Total for Canistota 1,313,944.53 24,555.29 561,988.05Montrose
Manufacturing 22,266.45 1,845.67 6,116.94DTransportation & Public Utilities 98,011.88 866.94 95,513.41EWholesale Trade 248,993.40 1.81 264.30FRetail Trade 1,334,826.74 3,111.77 163,131.22GServices 127,223.22 50.82 106,930.72IOther 329,912.42 3,006.45 332,839.70
Total for Montrose 2,161,234.11 8,883.45 704,796.29Salem
Agriculture, Forestry, & Fishing 37,584.50 28,262.41 65,846.91AManufacturing 1,546,161.35 2,318.99 11,551.11DTransportation & Public Utilities 299,949.99 5,826.76 250,570.17EWholesale Trade 1,706,320.92 7,660.89 171,379.36FRetail Trade 5,662,605.41 5,085.14 2,924,465.31GFinance, Insurance, & Real Estate 124,265.11 0.00 123,159.93HServices 2,541,416.18 24,050.11 301,842.74I
Total for Salem 11,918,303.45 73,204.30 3,848,815.53Spencer
Transportation & Public Utilities 149,315.70 124.65 15,167.03ERetail Trade 661,710.84 1,046.25 70,055.52GServices 53,060.22 1.47 52,981.50IOther 534,087.26 9,432.40 136,724.34
Total for Spencer 1,398,174.02 10,604.76 274,928.39Other Cities
Retail Trade 145,117.80 5,353.08 150,470.88GServices 33,568.57 85.94 6,530.18IOther 16,218.45 0.00 15,761.45
Total for Other Cities 194,904.82 5,439.02 172,762.51
02/12/13Page 69SD Dept. of Revenue

SIC Division Gross Sales Use Taxable Taxable Sales
COUNTY Statistics by Standard Industrial Classification (SIC) Major Group broken down by CITYReturns Filed: January 2013
Total for MCCOOK County 17,922,291.96 125,625.87 5,857,855.86
**************************************************************** COUNTY RECAP ***************************************************************
****************************************************************************************************************************************************
McCookCounty:Agriculture, Forestry, & Fishing 468,654.94 31,268.86 499,861.73AManufacturing 1,635,502.10 4,412.97 43,283.00DTransportation & Public Utilities 665,394.61 6,860.03 434,100.96EWholesale Trade 2,252,829.35 13,608.32 247,141.69FRetail Trade 8,628,629.90 20,567.73 3,609,581.86GFinance, Insurance, & Real Estate 125,865.69 0.00 124,741.16HServices 3,604,818.02 39,540.41 755,688.30IOther 540,597.35 9,367.55 143,457.16
Total for McCook County 17,922,291.96 125,625.87 5,857,855.86
02/12/13Page 70SD Dept. of Revenue

SIC Division Gross Sales Use Taxable Taxable Sales
COUNTY Statistics by Standard Industrial Classification (SIC) Major Group broken down by CITYReturns Filed: January 2013
MCPHERSONCounty:Eureka
Agriculture, Forestry, & Fishing 50,100.50 49.65 49,444.05AManufacturing 154,516.91 155.59 55,372.43DTransportation & Public Utilities 19,611.04 66,337.82 85,948.86EWholesale Trade 135,015.97 1,948.84 63,594.08FRetail Trade 2,197,970.00 4,823.95 1,454,575.94GFinance, Insurance, & Real Estate 4,754.53 23,656.00 28,409.22HServices 295,243.97 1,658.18 220,249.35I
Total for Eureka 2,857,212.92 98,630.04 1,957,593.93Leola
Agriculture, Forestry, & Fishing 119,728.95 0.00 119,728.95AManufacturing 146,609.01 0.00 12,388.91DTransportation & Public Utilities 15,483.10 153.90 14,915.67EWholesale Trade 55,287.23 868.00 3,782.30FRetail Trade 1,008,060.73 39,332.96 280,721.86GServices 53,022.45 121.47 30,016.79IOther 38,070.01 0.00 9,452.93
Total for Leola 1,436,261.48 40,476.32 471,007.41Long Lake
Retail Trade 8,485.66 0.00 7,157.49GServices 2,026.72 5,636.73 7,663.45IOther N/A N/A N/A
Total for Long Lake 10,685.09 5,636.73 14,993.65Other Cities
Services 5,323.66 0.00 5,323.66IOther 18,964.52 100.00 18,186.12
Total for Other Cities 24,288.18 100.00 23,509.78
Total for MCPHERSON County 4,328,447.67 144,843.09 2,467,104.77
**************************************************************** COUNTY RECAP ***************************************************************
****************************************************************************************************************************************************
McPhersonCounty:Agriculture, Forestry, & Fishing 169,829.45 49.65 169,173.00AManufacturing 301,125.92 155.59 67,761.34DTransportation & Public Utilities 35,094.14 66,491.71 100,864.53EWholesale Trade 202,218.14 2,816.84 78,412.91FRetail Trade 3,221,738.69 44,256.91 1,749,777.59GFinance, Insurance, & Real Estate 30,392.03 23,656.00 36,997.52HServices 355,616.80 7,416.39 263,253.25IOther N/A N/A N/A
Total for McPherson County 4,328,447.67 144,843.09 2,467,104.77
02/12/13Page 71SD Dept. of Revenue

SIC Division Gross Sales Use Taxable Taxable Sales
COUNTY Statistics by Standard Industrial Classification (SIC) Major Group broken down by CITYReturns Filed: January 2013
MEADECounty:Black Hawk
Agriculture, Forestry, & Fishing 69,485.65 8,482.47 60,268.81AConstruction 94,773.52 0.00 93,616.52CManufacturing 566,721.50 8,059.93 192,421.42DTransportation & Public Utilities 80,397.98 3,368.70 59,722.83EWholesale Trade 159,096.99 25.18 105,773.15FRetail Trade 3,367,694.16 18,040.09 1,498,941.38GFinance, Insurance, & Real Estate 5,334.14 0.00 5,334.14HServices 2,325,649.92 20,116.17 591,639.82I
Total for Black Hawk 6,669,153.85 58,092.55 2,607,718.07Ellsworth AFB
Retail Trade 62,857.40 0.00 16,876.06GServices 17,302.15 19.00 17,321.15IOther 102,325.96 0.00 59,306.16
Total for Ellsworth AFB 182,485.51 19.00 93,503.37Elm Springs
Other N/A N/A N/A
Total for Elm Springs N/A N/A N/AEnning
Retail Trade 20,369.99 165.00 20,490.99GServices 4,918.12 59.45 3,784.53IOther N/A N/A N/A
Total for Enning 25,288.11 224.45 24,275.52Faith
Manufacturing 108,668.24 66.86 1,528.30DTransportation & Public Utilities 70,050.29 11.86 69,590.79EWholesale Trade 353,928.43 6.27 27,631.32FRetail Trade 1,266,483.07 11,609.95 582,217.61GServices 242,695.73 515.00 209,365.51IOther 41,846.00 5,888.53 47,734.53
Total for Faith 2,083,671.76 18,098.48 938,068.06Ft. Meade
Other N/A N/A N/A
Total for Ft. Meade N/A N/A N/AHowes
Services 45,941.80 0.00 29,998.53IOther N/A N/A N/A
Total for Howes 110,878.21 655.50 64,792.52Mud Butte
Other 1,556.26 0.00 1,556.26
Total for Mud Butte 1,556.26 0.00 1,556.26Piedmont
Agriculture, Forestry, & Fishing 38,545.54 0.00 31,672.38AManufacturing 79,711.79 379.56 1,655.79DTransportation & Public Utilities 62,360.84 1,851.80 33,930.01EWholesale Trade 859,164.79 4,381.07 617,199.11FRetail Trade 1,542,374.84 32,057.49 517,766.07GFinance, Insurance, & Real Estate 86,125.85 0.00 86,107.00HServices 648,996.15 13,567.42 457,898.51IOther N/A N/A N/A
Total for Piedmont 3,317,279.81 52,237.34 1,746,228.87
02/12/13Page 72SD Dept. of Revenue

SIC Division Gross Sales Use Taxable Taxable Sales
COUNTY Statistics by Standard Industrial Classification (SIC) Major Group broken down by CITYReturns Filed: January 2013
SturgisAgriculture, Forestry, & Fishing 428,365.60 40,609.82 448,997.33AMining 12,666.78 0.00 8,551.53BManufacturing 573,330.11 12,196.11 191,527.98DTransportation & Public Utilities 538,590.74 11,542.57 408,599.98EWholesale Trade 541,931.74 1,241.31 155,858.41FRetail Trade 13,342,639.05 53,441.62 5,639,862.92GFinance, Insurance, & Real Estate 271,187.01 41,619.00 228,419.49HServices 3,395,918.31 194,716.83 1,907,399.68IOther N/A N/A N/A
Total for Sturgis 19,113,698.34 355,367.25 8,998,286.32Union Center
Retail Trade 770,299.03 2,328.40 555,552.05GServices 147,945.13 173.00 7,165.38IOther N/A N/A N/A
Total for Union Center 1,015,155.16 2,501.40 653,797.43White Owl
Services 11,066.27 24.81 11,091.08IOther N/A N/A N/A
Total for White Owl 12,179.46 348.96 12,128.82Other Cities
Agriculture, Forestry, & Fishing 135,624.86 0.00 118,743.51AManufacturing 13,383.71 0.00 5,374.00DTransportation & Public Utilities 7,864.56 0.00 2,264.56ERetail Trade 115,076.60 234.75 61,903.39GServices 453,149.14 336.02 186,285.16IOther 18,889.40 0.00 5,795.08
Total for Other Cities 743,988.27 570.77 380,365.70
Total for MEADE County 33,277,578.14 488,115.70 15,521,700.93
**************************************************************** COUNTY RECAP ***************************************************************
****************************************************************************************************************************************************
MeadeCounty:Agriculture, Forestry, & Fishing 713,867.65 50,303.88 702,739.62AMining 12,666.78 0.00 8,551.53BConstruction 117,589.92 0.00 103,338.60CManufacturing 1,341,815.35 20,702.46 392,507.49DTransportation & Public Utilities 856,175.40 16,774.94 665,188.17EWholesale Trade 2,016,447.92 5,653.83 965,768.15FRetail Trade 20,557,466.91 118,856.94 8,931,801.97GFinance, Insurance, & Real Estate 367,789.00 46,295.94 329,679.57HServices 7,293,759.20 229,527.70 3,422,125.83I
Total for Meade County 33,277,578.14 488,115.70 15,521,700.93
02/12/13Page 73SD Dept. of Revenue

SIC Division Gross Sales Use Taxable Taxable Sales
COUNTY Statistics by Standard Industrial Classification (SIC) Major Group broken down by CITYReturns Filed: January 2013
MELLETTECounty:Norris
Other N/A N/A N/A
Total for Norris N/A N/A N/AWhite River
Transportation & Public Utilities 35,374.92 366.02 35,261.50EWholesale Trade 16,027.19 100.29 11,185.00FRetail Trade 1,099,103.40 1,284.53 423,093.12GServices 194,923.94 2,872.92 49,566.57IOther 58,051.10 909.27 14,659.27
Total for White River 1,403,480.54 5,533.05 533,765.46Wood
Retail Trade 44,995.85 155.08 28,337.02GServices 7,880.50 0.00 1,600.00IOther 6,464.68 2.82 6,467.50
Total for Wood 59,341.03 157.90 36,404.52Other Cities
Services 12,615.00 5,087.03 17,702.03IOther N/A N/A N/A
Total for Other Cities 29,637.62 5,087.03 34,724.65
Total for MELLETTE County 1,543,187.23 10,777.97 633,497.86
**************************************************************** COUNTY RECAP ***************************************************************
****************************************************************************************************************************************************
MelletteCounty:Agriculture, Forestry, & Fishing 74,723.72 909.27 31,331.89ATransportation & Public Utilities 38,208.58 368.84 36,851.23EWholesale Trade 16,027.19 100.29 11,185.00FRetail Trade 1,192,258.30 1,439.61 478,711.14GServices 215,419.44 7,959.95 68,868.60IOther N/A N/A N/A
Total for Mellette County 1,543,187.23 10,777.97 633,497.86
02/12/13Page 74SD Dept. of Revenue

SIC Division Gross Sales Use Taxable Taxable Sales
COUNTY Statistics by Standard Industrial Classification (SIC) Major Group broken down by CITYReturns Filed: January 2013
MINERCounty:Canova
Retail Trade 729,726.70 106,012.81 235,673.51GServices 6,337.10 0.00 6,337.10IOther 211,529.82 18.41 3,344.62
Total for Canova 947,593.61 106,031.22 245,355.23Carthage
Transportation & Public Utilities 8,053.31 31.97 8,015.50EWholesale Trade 167,197.98 7.04 104,031.67FRetail Trade 152,328.77 1,295.52 51,809.61GServices 10,088.51 32.00 10,120.51IOther 34,256.73 11.68 16,802.09
Total for Carthage 371,925.30 1,378.21 190,779.38Fedora
Retail Trade 170,839.78 757.71 77,461.70GOther 12,302.49 0.00 7,873.00
Total for Fedora 183,142.27 757.71 85,334.70Howard
Agriculture, Forestry, & Fishing 83,673.01 50.82 38,881.47AManufacturing 348,457.38 1,734.35 81,635.51DTransportation & Public Utilities 33,968.63 1,634.48 23,108.97EWholesale Trade 43,406.28 509.64 12,902.99FRetail Trade 6,973,821.94 17,735.64 910,769.05GServices 1,003,360.87 69,842.02 379,058.38IOther N/A N/A N/A
Total for Howard 8,553,571.70 91,506.96 1,454,914.87Other Cities
Services 7,208.93 0.00 7,208.93I
Total for Other Cities 7,208.93 0.00 7,208.93
Total for MINER County 10,063,441.82 199,674.10 1,983,593.11
**************************************************************** COUNTY RECAP ***************************************************************
****************************************************************************************************************************************************
MinerCounty:Agriculture, Forestry, & Fishing 87,818.09 50.82 43,026.55AManufacturing 378,569.03 1,746.04 94,292.52DTransportation & Public Utilities 59,666.05 1,684.86 39,969.09EWholesale Trade 414,419.45 516.68 116,934.66FRetail Trade 8,026,717.19 125,801.68 1,275,713.87GServices 1,029,368.41 69,874.02 405,097.92IOther N/A N/A N/A
Total for Miner County 10,063,441.82 199,674.10 1,983,593.11
02/12/13Page 75SD Dept. of Revenue

SIC Division Gross Sales Use Taxable Taxable Sales
COUNTY Statistics by Standard Industrial Classification (SIC) Major Group broken down by CITYReturns Filed: January 2013
MINNEHAHACounty:Baltic
Agriculture, Forestry, & Fishing 26,538.66 0.00 26,538.66ATransportation & Public Utilities 15,053.03 872.16 15,897.34EWholesale Trade 809,715.98 2,917.54 357,848.56FRetail Trade 1,081,903.08 464.57 228,531.50GServices 516,051.93 13,718.06 185,575.60IOther 96,783.28 0.00 58,225.23
Total for Baltic 2,546,045.96 17,972.32 872,616.89Brandon
Agriculture, Forestry, & Fishing 3,652,020.97 35,108.65 377,359.46AManufacturing 8,727,289.82 86,300.19 239,278.24DTransportation & Public Utilities 2,252,855.26 8,116.17 1,427,470.52EWholesale Trade 6,724,667.40 41,259.90 223,965.95FRetail Trade 10,763,653.08 55,344.39 4,387,260.28GFinance, Insurance, & Real Estate 130,863.07 10,103.48 124,799.21HServices 2,173,645.58 53,828.49 1,248,761.79IOther N/A N/A N/A
Total for Brandon 34,451,520.09 290,061.27 8,029,495.45Buffalo Ridge
Other N/A N/A N/A
Total for Buffalo Ridge N/A N/A N/AColton
Manufacturing 19,630.22 69.88 2,229.10DTransportation & Public Utilities 16,524.17 1,292.04 17,811.67EWholesale Trade 1,896,850.74 9.24 78,116.94FRetail Trade 1,007,083.62 91,557.38 736,330.45GServices 123,207.84 0.00 58,416.43IOther N/A N/A N/A
Total for Colton 3,064,617.01 92,928.53 894,209.18Crooks
Manufacturing 9,843.51 82.05 6,120.66DTransportation & Public Utilities 112,481.38 1,242.69 112,748.58EWholesale Trade 24,588.55 123.87 10,835.43FRetail Trade 936,905.27 2,232.86 177,978.81GServices 148,079.26 0.00 27,603.24IOther N/A N/A N/A
Total for Crooks 1,234,516.97 3,681.47 337,905.72Dell Rapids
Agriculture, Forestry, & Fishing 14,183.62 3,200.00 16,030.62AManufacturing 311,897.75 433.60 142,274.88DTransportation & Public Utilities 165,554.80 16,664.04 68,691.64EWholesale Trade 36,803.15 858.31 21,614.72FRetail Trade 11,108,901.02 54,809.18 1,914,065.88GFinance, Insurance, & Real Estate 30,466.56 0.00 29,269.80HServices 2,435,318.04 -21,234.33 931,699.12IOther 18,924.43 0.00 18,924.43
Total for Dell Rapids 14,122,049.37 54,730.80 3,142,571.09
02/12/13Page 76SD Dept. of Revenue
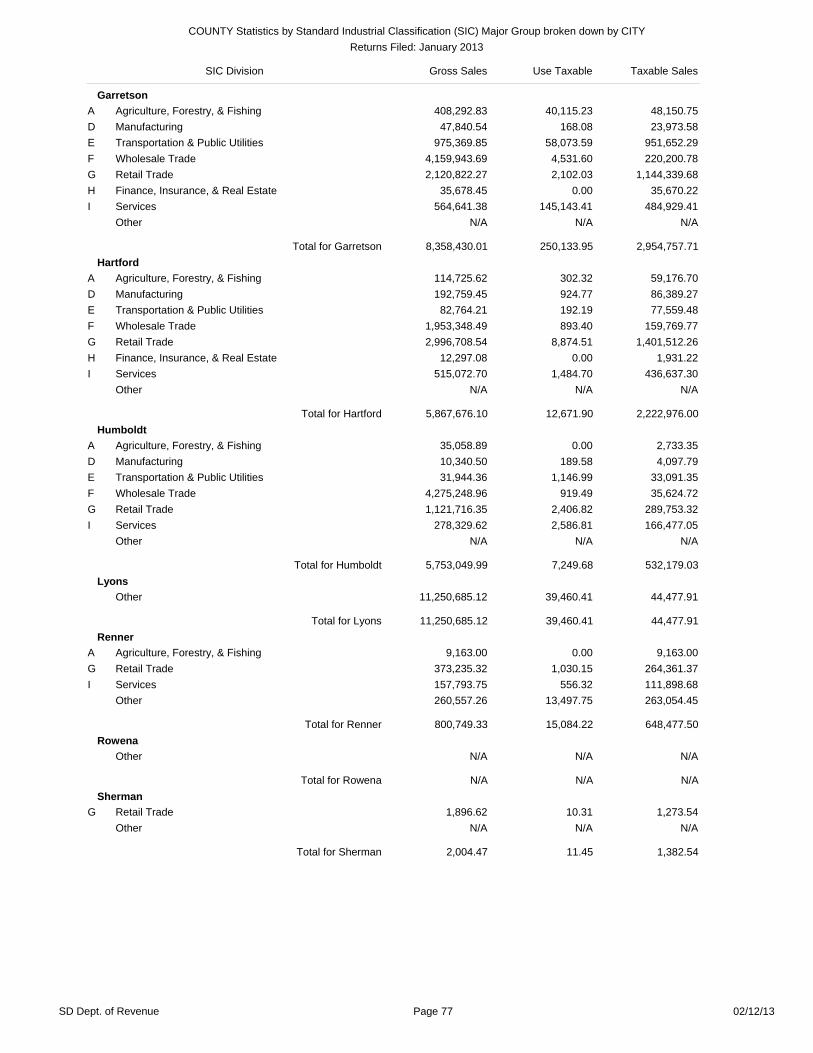
SIC Division Gross Sales Use Taxable Taxable Sales
COUNTY Statistics by Standard Industrial Classification (SIC) Major Group broken down by CITYReturns Filed: January 2013
GarretsonAgriculture, Forestry, & Fishing 408,292.83 40,115.23 48,150.75AManufacturing 47,840.54 168.08 23,973.58DTransportation & Public Utilities 975,369.85 58,073.59 951,652.29EWholesale Trade 4,159,943.69 4,531.60 220,200.78FRetail Trade 2,120,822.27 2,102.03 1,144,339.68GFinance, Insurance, & Real Estate 35,678.45 0.00 35,670.22HServices 564,641.38 145,143.41 484,929.41IOther N/A N/A N/A
Total for Garretson 8,358,430.01 250,133.95 2,954,757.71Hartford
Agriculture, Forestry, & Fishing 114,725.62 302.32 59,176.70AManufacturing 192,759.45 924.77 86,389.27DTransportation & Public Utilities 82,764.21 192.19 77,559.48EWholesale Trade 1,953,348.49 893.40 159,769.77FRetail Trade 2,996,708.54 8,874.51 1,401,512.26GFinance, Insurance, & Real Estate 12,297.08 0.00 1,931.22HServices 515,072.70 1,484.70 436,637.30IOther N/A N/A N/A
Total for Hartford 5,867,676.10 12,671.90 2,222,976.00Humboldt
Agriculture, Forestry, & Fishing 35,058.89 0.00 2,733.35AManufacturing 10,340.50 189.58 4,097.79DTransportation & Public Utilities 31,944.36 1,146.99 33,091.35EWholesale Trade 4,275,248.96 919.49 35,624.72FRetail Trade 1,121,716.35 2,406.82 289,753.32GServices 278,329.62 2,586.81 166,477.05IOther N/A N/A N/A
Total for Humboldt 5,753,049.99 7,249.68 532,179.03Lyons
Other 11,250,685.12 39,460.41 44,477.91
Total for Lyons 11,250,685.12 39,460.41 44,477.91Renner
Agriculture, Forestry, & Fishing 9,163.00 0.00 9,163.00ARetail Trade 373,235.32 1,030.15 264,361.37GServices 157,793.75 556.32 111,898.68IOther 260,557.26 13,497.75 263,054.45
Total for Renner 800,749.33 15,084.22 648,477.50Rowena
Other N/A N/A N/A
Total for Rowena N/A N/A N/ASherman
Retail Trade 1,896.62 10.31 1,273.54GOther N/A N/A N/A
Total for Sherman 2,004.47 11.45 1,382.54
02/12/13Page 77SD Dept. of Revenue

SIC Division Gross Sales Use Taxable Taxable Sales
COUNTY Statistics by Standard Industrial Classification (SIC) Major Group broken down by CITYReturns Filed: January 2013
Sioux FallsAgriculture, Forestry, & Fishing 4,845,570.94 18,570.74 2,199,157.85AConstruction 1,125,638.41 8,916.31 412,457.90CManufacturing 71,704,565.25 2,504,987.83 9,490,256.49DTransportation & Public Utilities 38,934,676.68 829,580.88 16,362,945.08EWholesale Trade 131,452,878.00 3,729,939.88 29,881,859.13FRetail Trade 654,548,499.90 3,907,269.20 273,900,705.65GFinance, Insurance, & Real Estate 10,653,435.70 6,576,056.29 12,466,563.89HServices 291,235,656.06 16,126,709.20 75,708,803.57IOther 74,108.31 156,438.62 232,026.31
Total for Sioux Falls 1,204,575,029.25 33,858,468.95 420,654,775.87Valley Springs
Agriculture, Forestry, & Fishing 34,610.95 87.35 21,556.30AManufacturing 4,989.07 2,418.91 4,526.10DTransportation & Public Utilities 177,113.84 38.94 7,875.33EWholesale Trade 1,386,873.55 24,079.53 62,087.82FRetail Trade 125,571.15 568.96 97,243.71GFinance, Insurance, & Real Estate 3,388.16 20.40 3,311.41HServices 104,165.65 1,994.79 86,259.16IOther N/A N/A N/A
Total for Valley Springs 1,836,712.37 29,208.87 282,859.83Other Cities
Services 14,181.00 0.00 13,548.75IOther 864,555.99 30.00 43,414.04
Total for Other Cities 878,736.99 30.00 56,962.79
Total for MINNEHAHA County 1,294,775,161.17 34,671,693.82 440,698,446.51
**************************************************************** COUNTY RECAP ***************************************************************
****************************************************************************************************************************************************
MinnehahaCounty:Agriculture, Forestry, & Fishing 9,143,444.48 97,384.29 2,763,145.69AMining 82,498.13 17,250.84 101,228.35BConstruction 1,245,311.60 8,916.31 465,882.52CManufacturing 81,164,239.08 2,595,802.09 10,088,440.18DTransportation & Public Utilities 42,844,341.02 917,220.83 19,152,551.88EWholesale Trade 164,888,141.23 3,844,817.47 31,235,197.63FRetail Trade 686,246,618.71 4,126,700.35 284,592,287.49GFinance, Insurance, & Real Estate 10,867,200.77 6,586,180.16 12,662,591.79HServices 298,269,642.80 16,324,787.45 79,461,110.10IPublic Administration 23,723.35 152,634.03 176,010.88J
Total for Minnehaha County 1,294,775,161.17 34,671,693.82 440,698,446.51
02/12/13Page 78SD Dept. of Revenue

SIC Division Gross Sales Use Taxable Taxable Sales
COUNTY Statistics by Standard Industrial Classification (SIC) Major Group broken down by CITYReturns Filed: January 2013
MOODYCounty:Colman
Manufacturing 795,371.16 642.91 26,379.50DTransportation & Public Utilities 6,913,348.83 53,026.82 4,197,452.24EWholesale Trade 3,415,530.91 11,990.62 63,496.42FRetail Trade 1,131,946.29 673.31 597,847.53GServices 266,783.21 6,193.52 60,208.97IOther 18,175.00 0.00 575.00
Total for Colman 12,541,155.40 72,527.18 4,945,959.66Egan
Transportation & Public Utilities 11,065.46 106.59 11,172.05ERetail Trade 21,842.40 113.36 20,616.10GServices 104,827.96 0.00 63,018.04IOther 3,925.48 16,213.77 20,008.91
Total for Egan 141,661.29 16,433.72 114,815.10Flandreau
Agriculture, Forestry, & Fishing 2,282,994.54 68,062.26 162,923.79AManufacturing 40,337.31 1,478.61 11,429.82DTransportation & Public Utilities 691,966.48 61,229.21 504,917.39EWholesale Trade 198,192.17 973.94 77,453.75FRetail Trade 2,385,466.33 13,686.92 1,315,972.80GFinance, Insurance, & Real Estate 187,897.19 650.00 187,289.74HServices 1,165,933.92 29,229.80 342,191.21I
Total for Flandreau 6,952,787.94 175,310.74 2,602,178.50Trent
Retail Trade 23,054.59 90.46 22,141.46GServices 20,991.35 0.00 20,991.35IOther 4,776.51 6.31 4,731.38
Total for Trent 48,822.45 96.77 47,864.19Ward
Retail Trade 284.64 2.35 236.53GOther N/A N/A N/A
Total for Ward 508.02 6.24 497.69Other Cities
Retail Trade 34,078.51 452.00 34,530.51GServices 10,725.88 0.00 5,016.63IOther N/A N/A N/A
Total for Other Cities 44,804.39 452.00 39,547.14
Total for MOODY County 19,729,739.49 264,826.65 7,750,862.28
**************************************************************** COUNTY RECAP ***************************************************************
****************************************************************************************************************************************************
MoodyCounty:Agriculture, Forestry, & Fishing 2,301,631.54 84,274.66 180,173.19AManufacturing 837,827.71 2,122.63 39,925.75DTransportation & Public Utilities 7,619,336.14 114,372.35 4,716,506.78EWholesale Trade 3,613,657.04 12,965.29 140,863.49FRetail Trade 3,596,672.75 15,018.40 1,991,344.93GFinance, Insurance, & Real Estate 188,472.19 650.00 187,864.74HServices 1,569,262.33 35,423.32 491,426.20IOther N/A N/A N/A
Total for Moody County 19,729,739.49 264,826.65 7,750,862.28
02/12/13Page 79SD Dept. of Revenue

SIC Division Gross Sales Use Taxable Taxable Sales
COUNTY Statistics by Standard Industrial Classification (SIC) Major Group broken down by CITYReturns Filed: January 2013
PENNINGTONCounty:Box Elder
Agriculture, Forestry, & Fishing 21,182.83 462.60 19,092.93AManufacturing 21,718.75 170.68 20,860.88DTransportation & Public Utilities 729,773.47 21,030.24 672,954.50EWholesale Trade 29,505.13 118.92 11,177.40FRetail Trade 1,606,109.79 10,936.64 771,019.64GFinance, Insurance, & Real Estate 39,474.61 426.69 18,861.81HServices 668,044.12 5,903.64 572,175.95IOther N/A N/A N/A
Total for Box Elder 3,124,483.32 39,049.41 2,088,716.52Caputa
Retail Trade 53,662.26 37.95 18,394.35GOther N/A N/A N/A
Total for Caputa 56,513.46 37.95 20,675.55Ellsworth AFB
Retail Trade 1,791,878.50 0.00 5,565.86GServices 515.00 0.00 515.00IOther N/A N/A N/A
Total for Ellsworth AFB 2,172,252.50 0.00 6,080.86Hill City
Agriculture, Forestry, & Fishing 4,641.00 0.00 3,766.00AManufacturing 808,357.49 137,301.84 475,672.57DTransportation & Public Utilities 64,773.05 206.29 27,293.19EWholesale Trade 733,032.87 22.71 37,444.57FRetail Trade 3,632,134.95 56,708.24 1,145,420.85GFinance, Insurance, & Real Estate 38,348.52 0.00 38,348.52HServices 368,139.66 1,839.69 173,879.54IOther N/A N/A N/A
Total for Hill City 5,774,167.04 196,078.76 2,025,273.83Keystone
Manufacturing 26,821.50 5.36 15,382.96DTransportation & Public Utilities 15,922.62 133.40 14,585.50ERetail Trade 418,947.99 14,708.67 333,009.64GServices 103,423.05 23.50 72,951.40IOther 142,646.41 164.27 4,020.18
Total for Keystone 707,761.57 15,035.19 439,949.68New Underwood
Transportation & Public Utilities 171,894.47 103.51 147,831.83EWholesale Trade 7,506.69 21.73 1,238.83FRetail Trade 619,463.22 45.66 164,539.54GServices 150,893.20 25.33 128,818.13IOther 92,761.29 60.69 82,006.76
Total for New Underwood 1,042,518.87 256.91 524,435.09Owanka
Retail Trade 3,258.00 431.00 3,689.00GOther N/A N/A N/A
Total for Owanka 5,604.15 431.00 6,035.15Quinn
Retail Trade 44,576.64 326.33 44,646.15GOther 264,578.17 15.81 51,837.53
Total for Quinn 309,154.81 342.13 96,483.68
02/12/13Page 80SD Dept. of Revenue
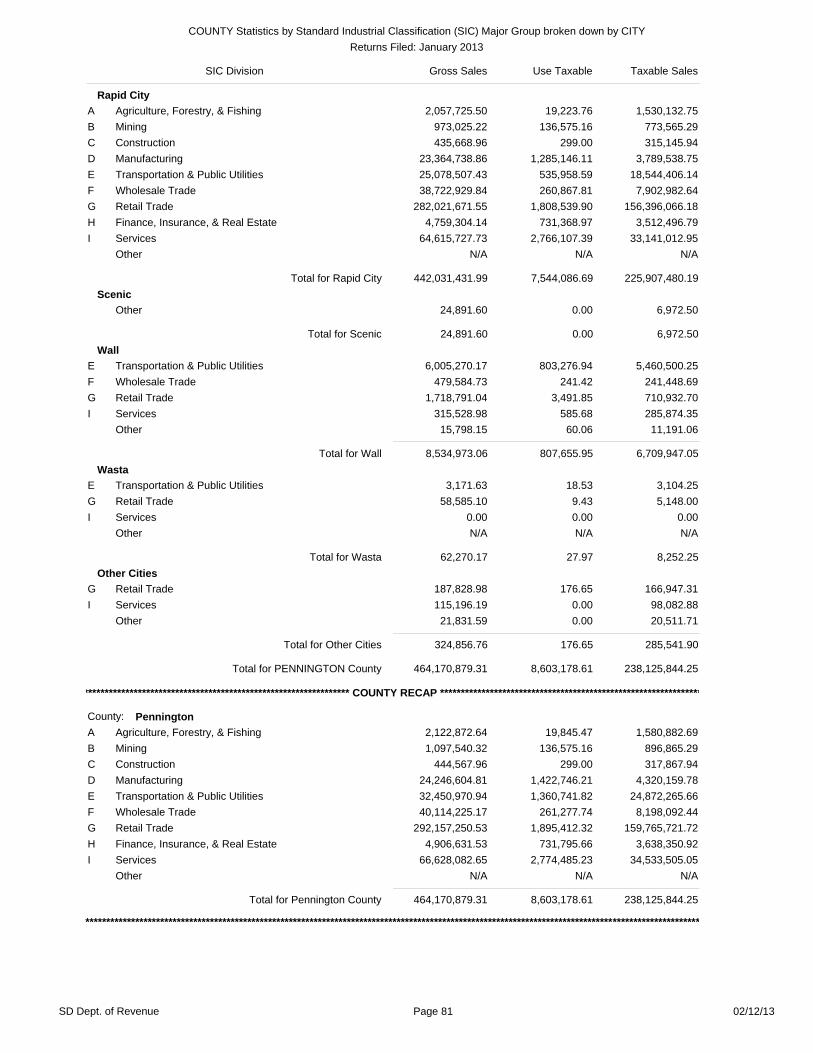
SIC Division Gross Sales Use Taxable Taxable Sales
COUNTY Statistics by Standard Industrial Classification (SIC) Major Group broken down by CITYReturns Filed: January 2013
Rapid CityAgriculture, Forestry, & Fishing 2,057,725.50 19,223.76 1,530,132.75AMining 973,025.22 136,575.16 773,565.29BConstruction 435,668.96 299.00 315,145.94CManufacturing 23,364,738.86 1,285,146.11 3,789,538.75DTransportation & Public Utilities 25,078,507.43 535,958.59 18,544,406.14EWholesale Trade 38,722,929.84 260,867.81 7,902,982.64FRetail Trade 282,021,671.55 1,808,539.90 156,396,066.18GFinance, Insurance, & Real Estate 4,759,304.14 731,368.97 3,512,496.79HServices 64,615,727.73 2,766,107.39 33,141,012.95IOther N/A N/A N/A
Total for Rapid City 442,031,431.99 7,544,086.69 225,907,480.19Scenic
Other 24,891.60 0.00 6,972.50
Total for Scenic 24,891.60 0.00 6,972.50Wall
Transportation & Public Utilities 6,005,270.17 803,276.94 5,460,500.25EWholesale Trade 479,584.73 241.42 241,448.69FRetail Trade 1,718,791.04 3,491.85 710,932.70GServices 315,528.98 585.68 285,874.35IOther 15,798.15 60.06 11,191.06
Total for Wall 8,534,973.06 807,655.95 6,709,947.05Wasta
Transportation & Public Utilities 3,171.63 18.53 3,104.25ERetail Trade 58,585.10 9.43 5,148.00GServices 0.00 0.00 0.00IOther N/A N/A N/A
Total for Wasta 62,270.17 27.97 8,252.25Other Cities
Retail Trade 187,828.98 176.65 166,947.31GServices 115,196.19 0.00 98,082.88IOther 21,831.59 0.00 20,511.71
Total for Other Cities 324,856.76 176.65 285,541.90
Total for PENNINGTON County 464,170,879.31 8,603,178.61 238,125,844.25
**************************************************************** COUNTY RECAP ***************************************************************
****************************************************************************************************************************************************
PenningtonCounty:Agriculture, Forestry, & Fishing 2,122,872.64 19,845.47 1,580,882.69AMining 1,097,540.32 136,575.16 896,865.29BConstruction 444,567.96 299.00 317,867.94CManufacturing 24,246,604.81 1,422,746.21 4,320,159.78DTransportation & Public Utilities 32,450,970.94 1,360,741.82 24,872,265.66EWholesale Trade 40,114,225.17 261,277.74 8,198,092.44FRetail Trade 292,157,250.53 1,895,412.32 159,765,721.72GFinance, Insurance, & Real Estate 4,906,631.53 731,795.66 3,638,350.92HServices 66,628,082.65 2,774,485.23 34,533,505.05IOther N/A N/A N/A
Total for Pennington County 464,170,879.31 8,603,178.61 238,125,844.25
02/12/13Page 81SD Dept. of Revenue

SIC Division Gross Sales Use Taxable Taxable Sales
COUNTY Statistics by Standard Industrial Classification (SIC) Major Group broken down by CITYReturns Filed: January 2013
PERKINSCounty:Bison
Agriculture, Forestry, & Fishing 145.85 0.00 145.85ATransportation & Public Utilities 304,818.39 28,968.96 261,371.02EWholesale Trade 64,501.65 103.41 58,486.27FRetail Trade 479,644.13 1,452.79 289,016.43GServices 61,472.26 173.70 52,427.26IOther 26,947.30 52.78 25,306.82
Total for Bison 937,529.59 30,751.64 686,753.65Lemmon
Agriculture, Forestry, & Fishing 72,902.82 110.00 67,133.94AManufacturing 34,322.00 31.81 8,374.06DTransportation & Public Utilities 3,520.85 288.96 3,686.31EWholesale Trade 1,161,555.79 5,594.68 341,304.33FRetail Trade 3,421,763.92 16,055.00 1,493,512.22GFinance, Insurance, & Real Estate 17,323.97 832.03 18,156.00HServices 499,305.55 12,281.01 369,011.67I
Total for Lemmon 5,210,694.91 35,193.49 2,301,178.53Lodgepole
Other 186,911.14 923.89 106,314.45
Total for Lodgepole 186,911.14 923.89 106,314.45Meadow
Retail Trade 11,026.19 9,056.61 20,082.80GServices 74,144.53 371.12 74,515.65IOther N/A N/A N/A
Total for Meadow 101,208.89 9,427.73 110,135.82Prairie City
Retail Trade 6,226.16 268.00 6,494.16GServices 5,793.13 51.10 4,929.83IOther N/A N/A N/A
Total for Prairie City 19,266.99 319.10 18,671.69Other Cities
Other 3,000.00 200.00 200.00
Total for Other Cities 3,000.00 200.00 200.00
Total for PERKINS County 6,458,611.52 76,815.85 3,223,254.14
**************************************************************** COUNTY RECAP ***************************************************************
****************************************************************************************************************************************************
PerkinsCounty:Agriculture, Forestry, & Fishing 73,048.67 110.00 67,279.79AManufacturing 51,767.91 47.98 24,142.88DTransportation & Public Utilities 308,339.24 29,257.92 265,057.33EWholesale Trade 1,323,190.56 5,698.10 448,019.74FRetail Trade 4,024,530.11 27,756.29 1,879,851.60GFinance, Insurance, & Real Estate 34,962.86 868.64 35,831.50HServices 641,031.66 13,076.93 501,330.80IOther N/A N/A N/A
Total for Perkins County 6,458,611.52 76,815.85 3,223,254.14
02/12/13Page 82SD Dept. of Revenue
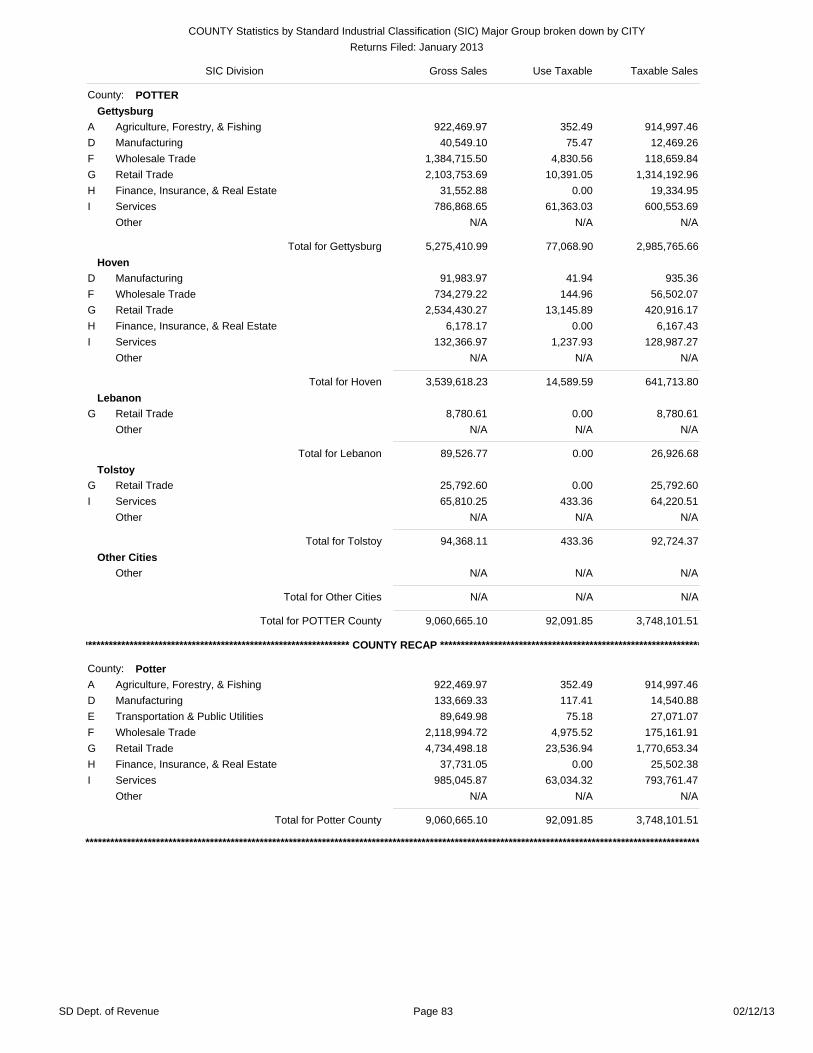
SIC Division Gross Sales Use Taxable Taxable Sales
COUNTY Statistics by Standard Industrial Classification (SIC) Major Group broken down by CITYReturns Filed: January 2013
POTTERCounty:Gettysburg
Agriculture, Forestry, & Fishing 922,469.97 352.49 914,997.46AManufacturing 40,549.10 75.47 12,469.26DWholesale Trade 1,384,715.50 4,830.56 118,659.84FRetail Trade 2,103,753.69 10,391.05 1,314,192.96GFinance, Insurance, & Real Estate 31,552.88 0.00 19,334.95HServices 786,868.65 61,363.03 600,553.69IOther N/A N/A N/A
Total for Gettysburg 5,275,410.99 77,068.90 2,985,765.66Hoven
Manufacturing 91,983.97 41.94 935.36DWholesale Trade 734,279.22 144.96 56,502.07FRetail Trade 2,534,430.27 13,145.89 420,916.17GFinance, Insurance, & Real Estate 6,178.17 0.00 6,167.43HServices 132,366.97 1,237.93 128,987.27IOther N/A N/A N/A
Total for Hoven 3,539,618.23 14,589.59 641,713.80Lebanon
Retail Trade 8,780.61 0.00 8,780.61GOther N/A N/A N/A
Total for Lebanon 89,526.77 0.00 26,926.68Tolstoy
Retail Trade 25,792.60 0.00 25,792.60GServices 65,810.25 433.36 64,220.51IOther N/A N/A N/A
Total for Tolstoy 94,368.11 433.36 92,724.37Other Cities
Other N/A N/A N/A
Total for Other Cities N/A N/A N/A
Total for POTTER County 9,060,665.10 92,091.85 3,748,101.51
**************************************************************** COUNTY RECAP ***************************************************************
****************************************************************************************************************************************************
PotterCounty:Agriculture, Forestry, & Fishing 922,469.97 352.49 914,997.46AManufacturing 133,669.33 117.41 14,540.88DTransportation & Public Utilities 89,649.98 75.18 27,071.07EWholesale Trade 2,118,994.72 4,975.52 175,161.91FRetail Trade 4,734,498.18 23,536.94 1,770,653.34GFinance, Insurance, & Real Estate 37,731.05 0.00 25,502.38HServices 985,045.87 63,034.32 793,761.47IOther N/A N/A N/A
Total for Potter County 9,060,665.10 92,091.85 3,748,101.51
02/12/13Page 83SD Dept. of Revenue

SIC Division Gross Sales Use Taxable Taxable Sales
COUNTY Statistics by Standard Industrial Classification (SIC) Major Group broken down by CITYReturns Filed: January 2013
ROBERTSCounty:Claire City
Retail Trade 29,681.99 0.00 29,513.99GServices 13,655.87 0.00 13,655.87IOther N/A N/A N/A
Total for Claire City 45,795.62 0.00 45,627.62Corona
Manufacturing 47,778.54 1,032.20 1,157.15DRetail Trade 224,129.59 401.87 202,616.39GServices 25,944.13 296.66 25,796.44IOther N/A N/A N/A
Total for Corona 1,047,447.42 1,730.73 234,741.28New Effington
Transportation & Public Utilities 534,700.52 -24,741.75 94,166.14ERetail Trade 41,586.71 10,328.00 41,248.57GServices 135,748.56 345.00 133,708.99I
Total for New Effington 712,035.79 -14,068.75 269,123.70Peever
Retail Trade 438,450.89 168.22 127,543.25GOther 5,263.75 207.58 5,441.33
Total for Peever 443,714.64 375.80 132,984.58Rosholt
Manufacturing 4,233,288.11 14,855.36 26,014.25DTransportation & Public Utilities 353,560.39 77.32 42,121.71EWholesale Trade 9,363.15 24.57 4,601.34FRetail Trade 1,238,526.75 18,812.33 490,308.72GServices 250,855.84 13,754.37 162,752.18IOther N/A N/A N/A
Total for Rosholt 6,085,839.51 47,523.95 726,037.59Sisseton
Agriculture, Forestry, & Fishing 49,458.01 263.29 48,656.89AManufacturing 1,630,564.82 41,005.39 74,762.81DTransportation & Public Utilities 201,832.20 538.68 144,187.88EWholesale Trade 560,282.72 16,233.12 200,861.59FRetail Trade 7,704,408.59 28,089.42 3,082,625.68GFinance, Insurance, & Real Estate 306,133.57 1,035.82 280,377.19HServices 1,057,969.48 13,858.84 611,164.81IOther N/A N/A N/A
Total for Sisseton 11,510,649.40 101,024.56 4,442,636.85Summit
Retail Trade 2,176,880.69 6,093.59 239,727.32GServices 31,850.36 342.67 28,363.47IOther 3,020,326.81 27,167.39 37,070.80
Total for Summit 5,229,057.87 33,603.65 305,161.59Wilmot
Manufacturing 33,855.17 163.80 6,416.08DTransportation & Public Utilities 13,682.60 107.85 13,682.00EWholesale Trade 51,479.92 849.62 29,130.59FRetail Trade 1,032,660.24 98,290.01 692,503.50GServices 207,872.66 1,438.21 86,524.15IOther 30,206.50 30.00 30,224.79
Total for Wilmot 1,369,757.09 100,879.49 858,481.11
02/12/13Page 84SD Dept. of Revenue

SIC Division Gross Sales Use Taxable Taxable Sales
COUNTY Statistics by Standard Industrial Classification (SIC) Major Group broken down by CITYReturns Filed: January 2013
Other CitiesAgriculture, Forestry, & Fishing 61,064.73 0.00 60,131.70ARetail Trade 1,093.22 0.00 1,093.22GOther 4,901.90 0.00 4,901.90
Total for Other Cities 67,059.85 0.00 66,126.82
Total for ROBERTS County 26,511,357.19 271,069.44 7,080,921.14
**************************************************************** COUNTY RECAP ***************************************************************
****************************************************************************************************************************************************
RobertsCounty:Agriculture, Forestry, & Fishing 3,111,342.17 27,293.29 167,065.59AManufacturing 5,966,116.27 57,176.66 110,884.79DTransportation & Public Utilities 1,112,664.98 -23,969.05 302,647.49EWholesale Trade 1,375,328.50 17,109.71 240,098.63FRetail Trade 12,887,418.68 162,183.45 4,907,180.64GFinance, Insurance, & Real Estate 307,562.83 1,035.82 281,788.86HServices 1,728,302.35 30,239.56 1,066,545.14IOther 22,621.40 0.00 4,710.00
Total for Roberts County 26,511,357.19 271,069.44 7,080,921.14
02/12/13Page 85SD Dept. of Revenue

SIC Division Gross Sales Use Taxable Taxable Sales
COUNTY Statistics by Standard Industrial Classification (SIC) Major Group broken down by CITYReturns Filed: January 2013
SANBORNCounty:Artesian
Manufacturing 4,581.15 26.33 4,030.50DTransportation & Public Utilities 9,639.36 35.70 5,726.50ERetail Trade 1,740,248.18 376.29 133,821.47GServices 87,812.07 1,849.74 89,639.29IOther 98,873.29 30,158.00 123,430.21
Total for Artesian 1,941,154.05 32,446.06 356,647.97Letcher
Transportation & Public Utilities 39,040.41 28.13 12,945.70ERetail Trade 421,093.52 264.12 143,795.93GServices 134,821.51 6,396.83 96,047.66IOther 11,997.06 0.00 11,997.06
Total for Letcher 606,952.50 6,689.08 264,786.35Woonsocket
Agriculture, Forestry, & Fishing 50,444.66 0.00 48,160.93ATransportation & Public Utilities 1,275,001.49 102,736.29 638,107.16EWholesale Trade 124,811.86 6,775.51 72,606.98FRetail Trade 420,483.39 1,417.43 245,593.87GServices 73,719.88 230.18 72,449.20IOther 23,951.45 6.68 3,352.36
Total for Woonsocket 1,968,412.72 111,166.09 1,080,270.50Other Cities
Other N/A N/A N/A
Total for Other Cities N/A N/A N/A
Total for SANBORN County 4,516,519.27 150,301.23 1,701,704.82
**************************************************************** COUNTY RECAP ***************************************************************
****************************************************************************************************************************************************
SanbornCounty:Agriculture, Forestry, & Fishing 117,915.95 30,158.00 140,239.14AManufacturing 6,703.32 33.01 6,014.75DTransportation & Public Utilities 1,323,681.26 102,800.12 656,779.36EWholesale Trade 166,361.86 6,775.51 114,106.98FRetail Trade 2,581,825.09 2,057.85 523,211.27GServices 296,353.46 8,476.75 258,136.15IOther N/A N/A N/A
Total for Sanborn County 4,516,519.27 150,301.23 1,701,704.82
02/12/13Page 86SD Dept. of Revenue

SIC Division Gross Sales Use Taxable Taxable Sales
COUNTY Statistics by Standard Industrial Classification (SIC) Major Group broken down by CITYReturns Filed: January 2013
SHANNONCounty:Batesland
Other N/A N/A N/A
Total for Batesland N/A N/A N/AKyle
Retail Trade 720,868.34 99.00 236,192.26GServices 358,445.57 480.26 156,301.83IOther N/A N/A N/A
Total for Kyle 1,084,244.21 579.26 397,424.39Manderson
Other N/A N/A N/A
Total for Manderson N/A N/A N/AOglala
Services 47,210.08 0.00 15,363.08I
Total for Oglala 47,210.08 0.00 15,363.08Pine Ridge
Retail Trade 2,531,518.72 999.72 1,131,924.88GServices 533,640.94 7,090.06 62,183.25IOther N/A N/A N/A
Total for Pine Ridge 3,072,098.60 8,089.78 1,197,999.68Porcupine
Retail Trade 510,961.17 1,685.50 231,907.44GOther 18,058.39 0.00 3,553.92
Total for Porcupine 529,019.56 1,685.50 235,461.36Wounded Knee
Other N/A N/A N/A
Total for Wounded Knee N/A N/A N/AOther Cities
Other 56,210.36 0.00 14,810.02
Total for Other Cities 56,210.36 0.00 14,810.02
Total for SHANNON County 4,892,122.29 10,354.54 1,924,809.64
**************************************************************** COUNTY RECAP ***************************************************************
****************************************************************************************************************************************************
ShannonCounty:Transportation & Public Utilities 67,525.76 0.00 14,167.42EWholesale Trade 11,869.24 0.00 8,821.85FRetail Trade 3,866,687.71 2,784.22 1,663,775.69GServices 945,121.98 7,570.32 237,402.08IOther N/A N/A N/A
Total for Shannon County 4,892,122.29 10,354.54 1,924,809.64
02/12/13Page 87SD Dept. of Revenue

SIC Division Gross Sales Use Taxable Taxable Sales
COUNTY Statistics by Standard Industrial Classification (SIC) Major Group broken down by CITYReturns Filed: January 2013
SPINKCounty:Ashton
Retail Trade 46,598.43 23.49 29,316.54GServices 67,757.46 377.70 65,667.44IOther 1,369,390.29 38.87 12,701.14
Total for Ashton 1,483,746.19 440.06 107,685.12Athol
Other N/A N/A N/A
Total for Athol N/A N/A N/ABrentford
Retail Trade 17,978.75 75.00 18,053.75GOther 15,792.29 0.00 15,642.79
Total for Brentford 33,771.04 75.00 33,696.54Conde
Transportation & Public Utilities 5,382.34 32.42 5,414.76ERetail Trade 180,000.40 3,809.96 39,000.17GServices 61,299.30 38.28 59,313.00I
Total for Conde 246,682.04 3,880.66 103,727.93Doland
Agriculture, Forestry, & Fishing 894,805.35 191.73 12,743.17ATransportation & Public Utilities 56,472.55 596.27 57,068.82EWholesale Trade 2,656.02 15.57 819.89FRetail Trade 475,278.21 28,267.58 162,241.80GServices 189,115.26 6,344.33 159,518.20IOther 4,010.30 54.07 1,013.34
Total for Doland 1,622,337.69 35,469.56 393,405.22Frankfort
Transportation & Public Utilities 3,879.88 28.99 3,460.50ERetail Trade 404,753.88 19,522.83 419,537.09GServices 206,723.10 6,850.21 206,862.13IOther 29.95 44.31 74.26
Total for Frankfort 615,386.81 26,446.35 629,933.98Melette
Retail Trade 1,035,576.40 2,570.35 104,477.53GServices 104,171.91 0.00 60,172.91IOther N/A N/A N/A
Total for Melette 1,268,094.69 2,570.35 164,650.44Northville
Retail Trade 36,465.40 257.00 36,626.40GServices 10,924.45 174.83 11,099.28I
Total for Northville 47,389.85 431.83 47,725.68Redfield
Agriculture, Forestry, & Fishing 82,078.16 33.67 82,111.83AManufacturing 556,269.67 529,604.57 540,497.31DTransportation & Public Utilities 424,797.09 11,156.95 225,954.53EWholesale Trade 469,746.37 167,763.76 275,929.51FRetail Trade 5,579,637.57 14,177.89 3,541,270.09GFinance, Insurance, & Real Estate 67,921.82 0.00 48,927.59HServices 1,079,770.51 12,815.15 896,764.09IOther N/A N/A N/A
Total for Redfield 8,260,221.19 735,551.98 5,611,454.95
02/12/13Page 88SD Dept. of Revenue

SIC Division Gross Sales Use Taxable Taxable Sales
COUNTY Statistics by Standard Industrial Classification (SIC) Major Group broken down by CITYReturns Filed: January 2013
TulareWholesale Trade 2,036,809.75 8,187.32 89,292.49FRetail Trade 246,166.85 6,334.96 169,297.17GServices 60,800.88 21.00 59,309.31IOther 6,431.04 82.25 5,587.64
Total for Tulare 2,350,208.52 14,625.54 323,486.61Turton
Retail Trade 21,409.98 4,132.68 22,947.55GServices 21,673.70 0.00 21,673.70IOther 7,417.42 511.00 7,844.42
Total for Turton 50,501.10 4,643.68 52,465.67Other Cities
Retail Trade 107,764.44 3,879.54 99,688.51GServices 13,444.34 45.00 12,027.90IOther 355,857.60 0.00 13,606.60
Total for Other Cities 477,066.38 3,924.54 125,323.01
Total for SPINK County 16,455,405.51 828,059.54 7,593,555.15
**************************************************************** COUNTY RECAP ***************************************************************
****************************************************************************************************************************************************
SpinkCounty:Agriculture, Forestry, & Fishing 2,327,676.85 225.40 109,023.60AManufacturing 578,352.59 529,705.66 542,035.50DTransportation & Public Utilities 628,271.87 11,880.24 301,273.85EWholesale Trade 2,864,538.10 175,975.14 375,698.78FRetail Trade 8,151,630.32 83,051.27 4,642,456.60GFinance, Insurance, & Real Estate 73,694.60 555.31 55,248.10HServices 1,831,241.18 26,666.51 1,567,818.72IOther N/A N/A N/A
Total for Spink County 16,455,405.51 828,059.54 7,593,555.15
02/12/13Page 89SD Dept. of Revenue

SIC Division Gross Sales Use Taxable Taxable Sales
COUNTY Statistics by Standard Industrial Classification (SIC) Major Group broken down by CITYReturns Filed: January 2013
STANLEYCounty:Fort Pierre
Agriculture, Forestry, & Fishing 3,126,015.75 1,616.43 404,736.51AConstruction 40,037.47 0.00 7,394.27CManufacturing 42,964.96 2,577.67 34,952.41DTransportation & Public Utilities 2,595,759.78 50,498.29 1,506,774.50EWholesale Trade 650,163.64 11,943.36 28,656.62FRetail Trade 5,705,081.82 9,135.52 2,194,920.32GFinance, Insurance, & Real Estate 71,480.45 110,148.80 170,464.46HServices 920,531.24 14,234.66 711,045.40IOther N/A N/A N/A
Total for Fort Pierre 13,155,733.45 200,154.73 5,062,642.83Hayes
Other N/A N/A N/A
Total for Hayes N/A N/A N/AOther Cities
Retail Trade 554.11 0.00 176.76GServices 16,964.57 73.80 17,038.37IOther N/A N/A N/A
Total for Other Cities 17,518.68 73.80 17,215.13
Total for STANLEY County 13,174,072.17 200,230.07 5,080,121.78
**************************************************************** COUNTY RECAP ***************************************************************
****************************************************************************************************************************************************
StanleyCounty:Agriculture, Forestry, & Fishing 3,126,015.75 1,616.43 404,736.51AConstruction 40,037.47 0.00 7,394.27CManufacturing 42,964.96 2,577.67 34,952.41DTransportation & Public Utilities 2,595,759.78 50,498.29 1,506,774.50EWholesale Trade 650,163.64 11,943.36 28,656.62FRetail Trade 5,705,635.93 9,135.52 2,195,097.08GFinance, Insurance, & Real Estate 71,480.45 110,148.80 170,464.46HServices 938,315.85 14,310.00 728,347.59IOther N/A N/A N/A
Total for Stanley County 13,174,072.17 200,230.07 5,080,121.78
02/12/13Page 90SD Dept. of Revenue

SIC Division Gross Sales Use Taxable Taxable Sales
COUNTY Statistics by Standard Industrial Classification (SIC) Major Group broken down by CITYReturns Filed: January 2013
SULLYCounty:Agar
Retail Trade 17,722.79 0.00 17,722.79GServices 188,149.13 11,290.27 180,036.77IOther N/A N/A N/A
Total for Agar 206,907.92 11,290.27 198,795.56Onida
Manufacturing 44,583.25 2.91 1,689.72DTransportation & Public Utilities 124,716.36 208.77 102,938.98EWholesale Trade 161,934.53 1,239.76 52,832.12FRetail Trade 4,958,366.21 53,153.65 1,427,722.46GFinance, Insurance, & Real Estate 7,065.99 0.00 7,065.99HServices 199,467.16 966.69 182,407.50IOther N/A N/A N/A
Total for Onida 5,496,133.50 55,571.79 1,774,656.77Other Cities
Agriculture, Forestry, & Fishing 35,940.00 0.00 35,940.00ARetail Trade 52,028.98 277.89 46,600.73GServices 11,449.63 0.00 11,449.63IOther N/A N/A N/A
Total for Other Cities 111,623.95 277.89 94,941.79
Total for SULLY County 5,814,665.37 67,139.95 2,068,394.12
**************************************************************** COUNTY RECAP ***************************************************************
****************************************************************************************************************************************************
SullyCounty:Agriculture, Forestry, & Fishing 35,940.00 0.00 35,940.00AManufacturing 44,583.25 2.91 1,689.72DTransportation & Public Utilities 137,561.70 208.77 104,530.41EWholesale Trade 162,330.53 1,239.76 53,228.12FRetail Trade 5,028,117.98 53,431.54 1,492,045.98GFinance, Insurance, & Real Estate 7,065.99 0.00 7,065.99HServices 399,065.92 12,256.96 373,893.90I
Total for Sully County 5,814,665.37 67,139.95 2,068,394.12
02/12/13Page 91SD Dept. of Revenue

SIC Division Gross Sales Use Taxable Taxable Sales
COUNTY Statistics by Standard Industrial Classification (SIC) Major Group broken down by CITYReturns Filed: January 2013
TODDCounty:Mission
Agriculture, Forestry, & Fishing 63,743.48 0.00 11,302.25ATransportation & Public Utilities 1,100,205.30 2,964.20 736,789.25EWholesale Trade 80,734.67 45.19 51,945.36FRetail Trade 4,701,876.15 13,651.74 2,014,277.29GServices 1,617,162.54 4,700.36 412,368.48IOther N/A N/A N/A
Total for Mission 7,585,822.62 21,361.49 3,233,093.75Okreek
Other 0.00 0.00 0.00
Total for Okreek 0.00 0.00 0.00Parmelee
Other 2,042.71 0.00 1,754.72
Total for Parmelee 2,042.71 0.00 1,754.72Rosebud
Retail Trade 1,560,612.09 362.32 536,572.56GServices 96,995.50 114.99 31,193.99IOther N/A N/A N/A
Total for Rosebud 1,945,042.17 477.31 658,891.49Saint Francis
Retail Trade 3,242,665.49 4,666.88 34,116.20GOther N/A N/A N/A
Total for Saint Francis 3,242,665.49 4,666.88 34,116.20Other Cities
Other N/A N/A N/A
Total for Other Cities N/A N/A N/A
Total for TODD County 12,775,572.99 26,505.68 3,927,856.16
**************************************************************** COUNTY RECAP ***************************************************************
****************************************************************************************************************************************************
ToddCounty:Agriculture, Forestry, & Fishing 63,743.48 0.00 11,302.25AManufacturing 17,478.98 0.00 1,789.62DTransportation & Public Utilities 1,387,589.88 2,964.20 827,864.19EWholesale Trade 80,784.67 45.19 51,995.36FRetail Trade 9,505,153.73 18,680.94 2,584,966.05GServices 1,716,200.75 4,815.35 445,317.19IOther N/A N/A N/A
Total for Todd County 12,775,572.99 26,505.68 3,927,856.16
02/12/13Page 92SD Dept. of Revenue

SIC Division Gross Sales Use Taxable Taxable Sales
COUNTY Statistics by Standard Industrial Classification (SIC) Major Group broken down by CITYReturns Filed: January 2013
TRIPPCounty:Colome
Agriculture, Forestry, & Fishing 91,701.78 0.00 91,701.78AWholesale Trade 151,129.66 78.97 4,238.77FRetail Trade 416,934.55 2,181.78 127,664.32GServices 71,605.54 -1,376.57 85,214.47IOther 42,278.69 141.53 40,516.98
Total for Colome 773,650.22 1,025.71 349,336.32Hamill
Agriculture, Forestry, & Fishing 32,907.72 0.00 32,907.72AServices 152,825.72 0.00 152,825.72IOther N/A N/A N/A
Total for Hamill 188,953.44 0.00 188,953.44Ideal
Agriculture, Forestry, & Fishing 61,349.17 0.00 61,349.17AServices 59,480.75 41,220.00 98,585.40IOther N/A N/A N/A
Total for Ideal 122,024.53 41,220.00 161,129.18Winner
Agriculture, Forestry, & Fishing 638,800.47 1,367.20 562,543.55AManufacturing 3,552,660.91 648.24 335,455.11DTransportation & Public Utilities 1,554,354.32 349.04 358,635.95EWholesale Trade 1,507,762.65 3,204.47 273,882.31FRetail Trade 17,408,769.95 54,961.79 8,453,439.24GFinance, Insurance, & Real Estate 50,543.58 0.00 48,293.58HServices 1,514,852.34 38,001.07 1,127,265.34IOther N/A N/A N/A
Total for Winner 26,239,755.65 98,531.82 11,166,891.51Witten
Transportation & Public Utilities 26,926.26 0.70 1,543.25EWholesale Trade 2,332.04 7.14 548.19FRetail Trade 30,093.47 106.79 30,007.41GServices 52,822.21 0.00 43,306.33IOther N/A N/A N/A
Total for Witten 123,773.99 114.63 87,005.18Other Cities
Agriculture, Forestry, & Fishing 133,866.70 0.00 133,866.70AServices 36,307.00 0.00 36,307.00IOther N/A N/A N/A
Total for Other Cities 170,173.70 0.00 170,173.70
02/12/13Page 93SD Dept. of Revenue

SIC Division Gross Sales Use Taxable Taxable Sales
COUNTY Statistics by Standard Industrial Classification (SIC) Major Group broken down by CITYReturns Filed: January 2013
Total for TRIPP County 27,618,331.52 140,892.16 12,123,489.33
**************************************************************** COUNTY RECAP ***************************************************************
****************************************************************************************************************************************************
TrippCounty:Agriculture, Forestry, & Fishing 970,225.84 1,367.20 893,968.92AManufacturing 3,552,974.79 673.52 335,705.11DTransportation & Public Utilities 1,585,040.49 356.83 363,794.19EWholesale Trade 1,661,224.35 3,290.59 278,669.27FRetail Trade 17,860,212.59 57,250.36 8,615,525.58GFinance, Insurance, & Real Estate 64,193.58 0.00 61,943.58HServices 1,887,893.56 77,844.50 1,543,504.26IOther 36,566.33 109.17 30,378.42
Total for Tripp County 27,618,331.52 140,892.16 12,123,489.33
02/12/13Page 94SD Dept. of Revenue

SIC Division Gross Sales Use Taxable Taxable Sales
COUNTY Statistics by Standard Industrial Classification (SIC) Major Group broken down by CITYReturns Filed: January 2013
TURNERCounty:Centerville
Agriculture, Forestry, & Fishing 5,993.71 0.00 5,393.71AManufacturing 15,125.56 98.00 2,371.90DTransportation & Public Utilities 8,119.57 89.04 7,682.00EWholesale Trade 11,638,509.29 6,237.33 34,108.10FRetail Trade 4,885,378.66 2,565.12 296,758.28GServices 72,643.00 876.61 48,587.45IOther N/A N/A N/A
Total for Centerville 16,630,266.79 11,221.14 400,753.47Chancellor
Agriculture, Forestry, & Fishing 51,051.80 2,652.94 21,163.02ATransportation & Public Utilities 13,702.98 20.75 12,997.00EWholesale Trade 348,857.91 337.04 4,135.31FRetail Trade 155,738.70 257.46 68,386.46GServices 108,106.40 867.00 70,950.55IOther 307,804.85 168,887.75 169,397.73
Total for Chancellor 985,262.64 173,022.94 347,030.07Davis
Transportation & Public Utilities 9,670.33 88.03 9,401.40ERetail Trade 26,089.96 3,284.25 18,675.44GServices 5,649.73 492.80 4,535.70IOther 3,822.73 81.55 1,604.23
Total for Davis 45,232.74 3,946.63 34,216.77Hurley
Agriculture, Forestry, & Fishing 11,359.27 0.00 5,756.27AManufacturing 13,775.91 146.24 1,800.69DTransportation & Public Utilities 42,671.30 373.03 41,412.12EWholesale Trade 71,499.66 142.19 6,648.00FRetail Trade 718,676.24 388.92 147,895.55GServices 101,047.19 10.00 14,812.83IOther N/A N/A N/A
Total for Hurley 1,340,369.86 1,060.38 339,429.14Marion
Agriculture, Forestry, & Fishing 1,688.00 0.00 1,688.00AManufacturing 26,632,683.70 137,267.68 139,586.81DTransportation & Public Utilities 43,257.90 257.76 31,126.44EWholesale Trade 23,232,952.73 18,191.59 -1,556,939.10FRetail Trade 752,983.61 5,161.77 398,473.25GFinance, Insurance, & Real Estate 2,228,140.00 22,864.05 1,145,374.24HServices 4,354,149.75 5,495.59 200,549.10I
Total for Marion 57,245,855.68 189,238.43 359,858.74Monroe
Retail Trade 71,035.41 64.32 31,251.43GServices 825.00 0.00 825.00IOther 2,926.08 9.46 2,935.54
Total for Monroe 74,786.50 73.78 35,011.97
02/12/13Page 95SD Dept. of Revenue
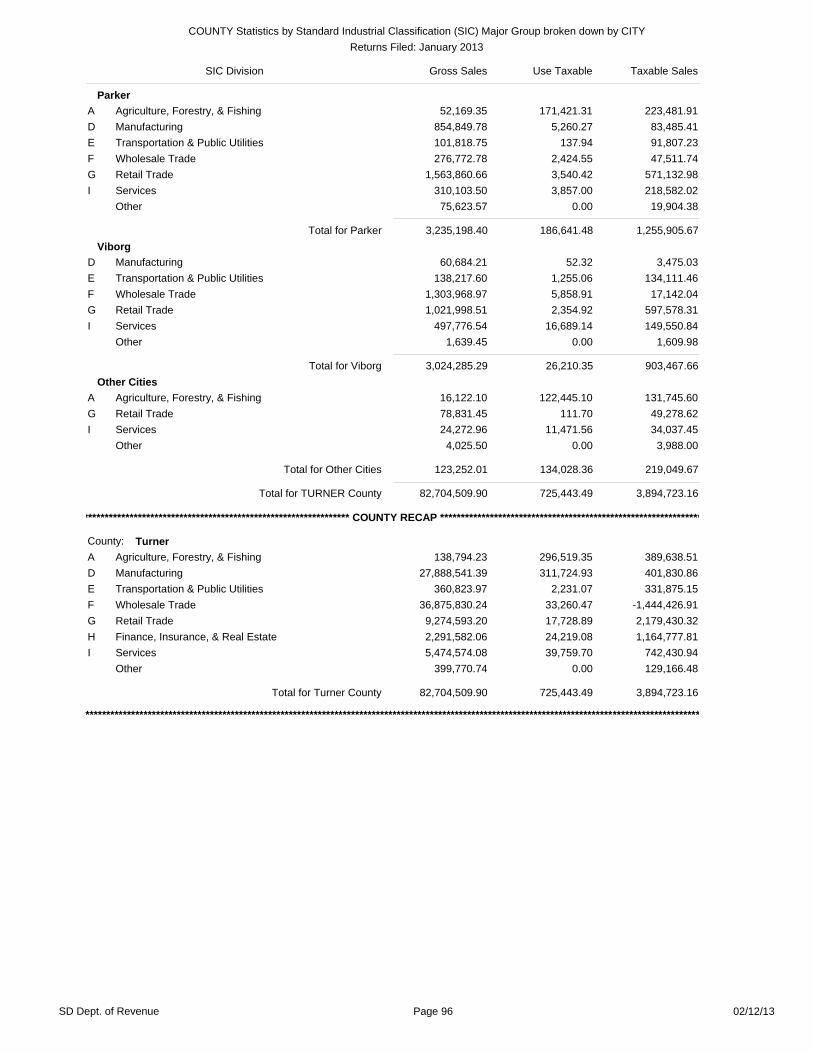
SIC Division Gross Sales Use Taxable Taxable Sales
COUNTY Statistics by Standard Industrial Classification (SIC) Major Group broken down by CITYReturns Filed: January 2013
ParkerAgriculture, Forestry, & Fishing 52,169.35 171,421.31 223,481.91AManufacturing 854,849.78 5,260.27 83,485.41DTransportation & Public Utilities 101,818.75 137.94 91,807.23EWholesale Trade 276,772.78 2,424.55 47,511.74FRetail Trade 1,563,860.66 3,540.42 571,132.98GServices 310,103.50 3,857.00 218,582.02IOther 75,623.57 0.00 19,904.38
Total for Parker 3,235,198.40 186,641.48 1,255,905.67Viborg
Manufacturing 60,684.21 52.32 3,475.03DTransportation & Public Utilities 138,217.60 1,255.06 134,111.46EWholesale Trade 1,303,968.97 5,858.91 17,142.04FRetail Trade 1,021,998.51 2,354.92 597,578.31GServices 497,776.54 16,689.14 149,550.84IOther 1,639.45 0.00 1,609.98
Total for Viborg 3,024,285.29 26,210.35 903,467.66Other Cities
Agriculture, Forestry, & Fishing 16,122.10 122,445.10 131,745.60ARetail Trade 78,831.45 111.70 49,278.62GServices 24,272.96 11,471.56 34,037.45IOther 4,025.50 0.00 3,988.00
Total for Other Cities 123,252.01 134,028.36 219,049.67
Total for TURNER County 82,704,509.90 725,443.49 3,894,723.16
**************************************************************** COUNTY RECAP ***************************************************************
****************************************************************************************************************************************************
TurnerCounty:Agriculture, Forestry, & Fishing 138,794.23 296,519.35 389,638.51AManufacturing 27,888,541.39 311,724.93 401,830.86DTransportation & Public Utilities 360,823.97 2,231.07 331,875.15EWholesale Trade 36,875,830.24 33,260.47 -1,444,426.91FRetail Trade 9,274,593.20 17,728.89 2,179,430.32GFinance, Insurance, & Real Estate 2,291,582.06 24,219.08 1,164,777.81HServices 5,474,574.08 39,759.70 742,430.94IOther 399,770.74 0.00 129,166.48
Total for Turner County 82,704,509.90 725,443.49 3,894,723.16
02/12/13Page 96SD Dept. of Revenue

SIC Division Gross Sales Use Taxable Taxable Sales
COUNTY Statistics by Standard Industrial Classification (SIC) Major Group broken down by CITYReturns Filed: January 2013
UNIONCounty:Alcester
Manufacturing 2,477,509.62 15,311.06 22,562.47DWholesale Trade 22,526.23 128.84 14,666.51FRetail Trade 534,883.09 846.33 317,336.87GServices 139,845.63 1,287.16 106,555.60IOther 33,347.95 284.45 30,903.12
Total for Alcester 3,208,112.53 17,857.84 492,024.57Beresford
Agriculture, Forestry, & Fishing 52,629.96 10.15 52,345.51AManufacturing 33,369.67 0.00 28,400.57DTransportation & Public Utilities 1,655,847.99 0.00 287,978.51EWholesale Trade 6,971,455.57 6,088.70 181,096.13FRetail Trade 6,484,458.04 81,347.44 1,814,592.75GFinance, Insurance, & Real Estate 21,944.60 1,689.20 22,433.80HServices 424,333.25 10,116.21 295,841.98I
Total for Beresford 15,644,039.08 99,251.70 2,682,689.25Elk Point
Agriculture, Forestry, & Fishing 20,505.45 76,991.38 95,949.33AManufacturing 2,027,280.33 23,974.49 210,815.56DTransportation & Public Utilities 532,197.06 10,147.57 510,561.91EWholesale Trade 806,411.02 982.93 44,928.74FRetail Trade 1,724,806.71 3,465.25 557,425.05GFinance, Insurance, & Real Estate 72,219.19 1,614.40 27,950.98HServices 891,304.81 12,322.72 165,056.70IOther N/A N/A N/A
Total for Elk Point 6,074,724.58 129,498.74 1,612,688.27Jefferson
Agriculture, Forestry, & Fishing 38,066.85 0.00 37,790.45AManufacturing 4,979.75 75,410.76 79,497.66DTransportation & Public Utilities 40,028.63 12,210.11 52,221.35EWholesale Trade 590,080.06 71.70 5,494.84FRetail Trade 1,007,845.71 39,121.78 280,629.11GServices 649,650.03 2,955.72 94,342.39IOther N/A N/A N/A
Total for Jefferson 2,330,847.61 129,770.07 550,167.67North Sioux City
Agriculture, Forestry, & Fishing 111,163.41 0.00 84,644.41AManufacturing 8,446,630.16 643,237.30 760,337.76DTransportation & Public Utilities 203,150.25 20,656.25 189,749.95EWholesale Trade 13,343,407.11 391,828.35 689,695.72FRetail Trade 13,900,762.35 57,869.17 1,310,970.09GFinance, Insurance, & Real Estate 6,304,202.97 50,807.81 367,339.53HServices 16,149,111.51 530,196.04 1,520,202.49IOther N/A N/A N/A
Total for North Sioux City 58,467,258.01 1,694,594.92 4,929,280.59Other Cities
Retail Trade 2,392,350.21 7,557.23 216,922.78GOther 16,585.00 0.00 16,585.00
Total for Other Cities 2,408,935.21 7,557.23 233,507.78
02/12/13Page 97SD Dept. of Revenue

SIC Division Gross Sales Use Taxable Taxable Sales
COUNTY Statistics by Standard Industrial Classification (SIC) Major Group broken down by CITYReturns Filed: January 2013
Total for UNION County 88,133,917.02 2,078,530.49 10,500,358.13
**************************************************************** COUNTY RECAP ***************************************************************
****************************************************************************************************************************************************
UnionCounty:Agriculture, Forestry, & Fishing 240,536.67 77,001.53 287,100.70AManufacturing 12,990,433.54 757,933.61 1,102,278.02DTransportation & Public Utilities 2,461,710.89 43,298.37 1,070,363.18EWholesale Trade 21,733,880.00 399,100.52 935,881.94FRetail Trade 26,045,106.11 190,207.20 4,497,876.65GFinance, Insurance, & Real Estate 6,399,174.34 54,111.41 418,517.84HServices 18,254,245.24 556,877.85 2,181,999.16IOther N/A N/A N/A
Total for Union County 88,133,917.02 2,078,530.49 10,500,358.13
02/12/13Page 98SD Dept. of Revenue
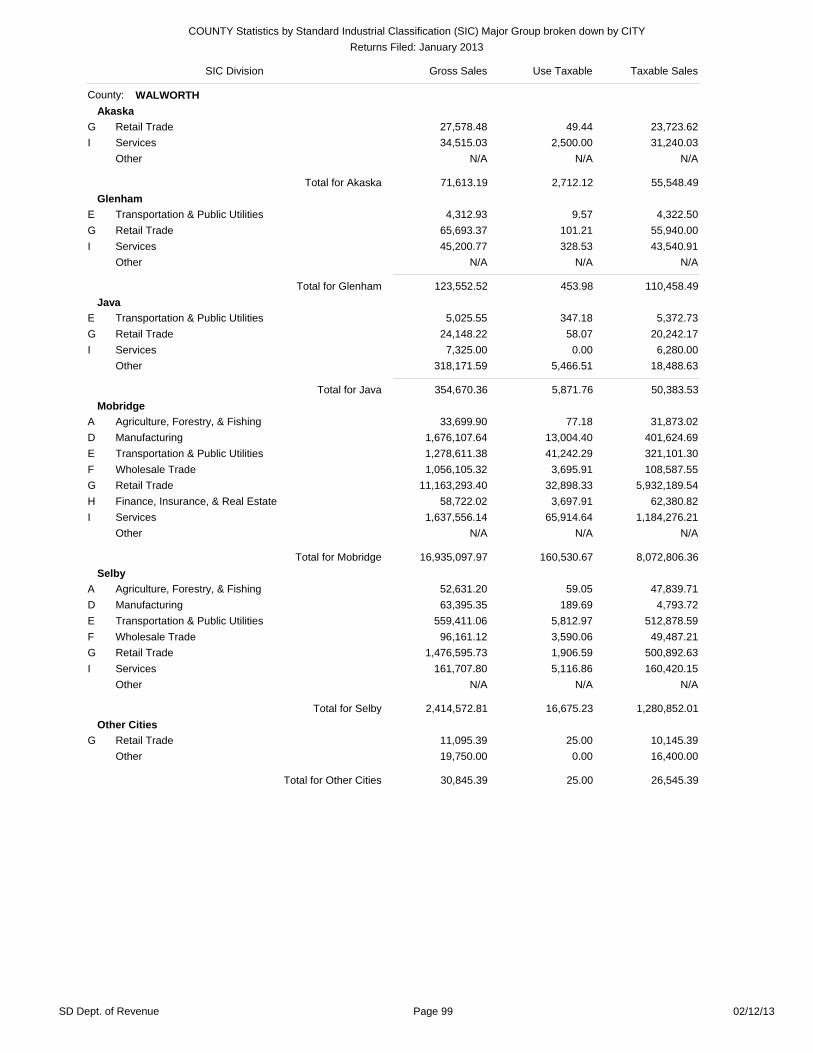
SIC Division Gross Sales Use Taxable Taxable Sales
COUNTY Statistics by Standard Industrial Classification (SIC) Major Group broken down by CITYReturns Filed: January 2013
WALWORTHCounty:Akaska
Retail Trade 27,578.48 49.44 23,723.62GServices 34,515.03 2,500.00 31,240.03IOther N/A N/A N/A
Total for Akaska 71,613.19 2,712.12 55,548.49Glenham
Transportation & Public Utilities 4,312.93 9.57 4,322.50ERetail Trade 65,693.37 101.21 55,940.00GServices 45,200.77 328.53 43,540.91IOther N/A N/A N/A
Total for Glenham 123,552.52 453.98 110,458.49Java
Transportation & Public Utilities 5,025.55 347.18 5,372.73ERetail Trade 24,148.22 58.07 20,242.17GServices 7,325.00 0.00 6,280.00IOther 318,171.59 5,466.51 18,488.63
Total for Java 354,670.36 5,871.76 50,383.53Mobridge
Agriculture, Forestry, & Fishing 33,699.90 77.18 31,873.02AManufacturing 1,676,107.64 13,004.40 401,624.69DTransportation & Public Utilities 1,278,611.38 41,242.29 321,101.30EWholesale Trade 1,056,105.32 3,695.91 108,587.55FRetail Trade 11,163,293.40 32,898.33 5,932,189.54GFinance, Insurance, & Real Estate 58,722.02 3,697.91 62,380.82HServices 1,637,556.14 65,914.64 1,184,276.21IOther N/A N/A N/A
Total for Mobridge 16,935,097.97 160,530.67 8,072,806.36Selby
Agriculture, Forestry, & Fishing 52,631.20 59.05 47,839.71AManufacturing 63,395.35 189.69 4,793.72DTransportation & Public Utilities 559,411.06 5,812.97 512,878.59EWholesale Trade 96,161.12 3,590.06 49,487.21FRetail Trade 1,476,595.73 1,906.59 500,892.63GServices 161,707.80 5,116.86 160,420.15IOther N/A N/A N/A
Total for Selby 2,414,572.81 16,675.23 1,280,852.01Other Cities
Retail Trade 11,095.39 25.00 10,145.39GOther 19,750.00 0.00 16,400.00
Total for Other Cities 30,845.39 25.00 26,545.39
02/12/13Page 99SD Dept. of Revenue

SIC Division Gross Sales Use Taxable Taxable Sales
COUNTY Statistics by Standard Industrial Classification (SIC) Major Group broken down by CITYReturns Filed: January 2013
Total for WALWORTH County 19,930,352.24 186,268.77 9,596,594.27
**************************************************************** COUNTY RECAP ***************************************************************
****************************************************************************************************************************************************
WalworthCounty:Agriculture, Forestry, & Fishing 92,131.10 136.22 82,162.73AManufacturing 1,741,623.57 13,210.39 406,714.54DTransportation & Public Utilities 1,847,360.92 47,412.02 843,675.12EWholesale Trade 1,486,182.58 12,913.55 183,507.18FRetail Trade 12,768,404.59 35,038.65 6,543,133.35GFinance, Insurance, & Real Estate 63,392.57 3,697.91 66,920.82HServices 1,900,254.74 73,860.03 1,439,707.30IOther N/A N/A N/A
Total for Walworth County 19,930,352.24 186,268.77 9,596,594.27
02/12/13Page 100SD Dept. of Revenue

SIC Division Gross Sales Use Taxable Taxable Sales
COUNTY Statistics by Standard Industrial Classification (SIC) Major Group broken down by CITYReturns Filed: January 2013
YANKTONCounty:Gayville
Transportation & Public Utilities 6,096.22 36.64 6,084.00EWholesale Trade 432,242.46 0.70 27,625.58FRetail Trade 888,723.20 485.25 32,820.74GServices 20,145.05 3.09 20,066.51IOther 394,597.95 0.00 0.00
Total for Gayville 1,741,804.88 525.68 86,596.83Lesterville
Wholesale Trade 438,828.70 93.93 9,469.29FRetail Trade 108,291.65 371.56 77,381.23GServices 9,396.71 0.00 9,396.71IOther 2,437.84 4.16 2,184.20
Total for Lesterville 558,954.89 469.64 98,431.43Mission Hill
Retail Trade 109,346.88 33,100.00 131,995.62GServices 83,192.15 102.95 17,629.85IOther 13,527.84 0.00 13,527.84
Total for Mission Hill 206,066.87 33,202.95 163,153.31Utica
Retail Trade 39,206.51 4,394.53 39,676.87GServices 30,923.43 2,359.66 24,641.98IOther 260,640.68 1.06 2,639.41
Total for Utica 330,770.61 6,755.25 66,958.26Volin
Transportation & Public Utilities 4,189.64 27.71 4,211.75ERetail Trade 70,325.83 33.47 32,933.00GServices 50,572.62 275.62 35,502.47IOther N/A N/A N/A
Total for Volin 125,918.09 336.80 73,477.22Yankton
Agriculture, Forestry, & Fishing 596,237.79 4,971.02 154,623.88AConstruction 47,832.92 0.00 33,214.65CManufacturing 25,607,429.68 1,836,064.27 2,499,774.55DTransportation & Public Utilities 5,943,202.99 40,017.61 899,303.98EWholesale Trade 5,340,536.31 32,351.85 1,132,683.07FRetail Trade 41,324,838.88 310.22 26,168,030.04GFinance, Insurance, & Real Estate 357,545.68 15,760.20 292,139.03HServices 11,045,203.38 432,750.42 4,048,365.08I
Total for Yankton 90,262,827.64 2,362,225.60 35,228,134.28Other Cities
Wholesale Trade 284,577.24 0.00 1,163.11FRetail Trade 180,600.23 57,559.87 210,300.43GServices 23,772.58 13,975.25 35,507.83IOther 21,298.35 0.00 2,318.57
Total for Other Cities 510,248.40 71,535.12 249,289.94
02/12/13Page 101SD Dept. of Revenue
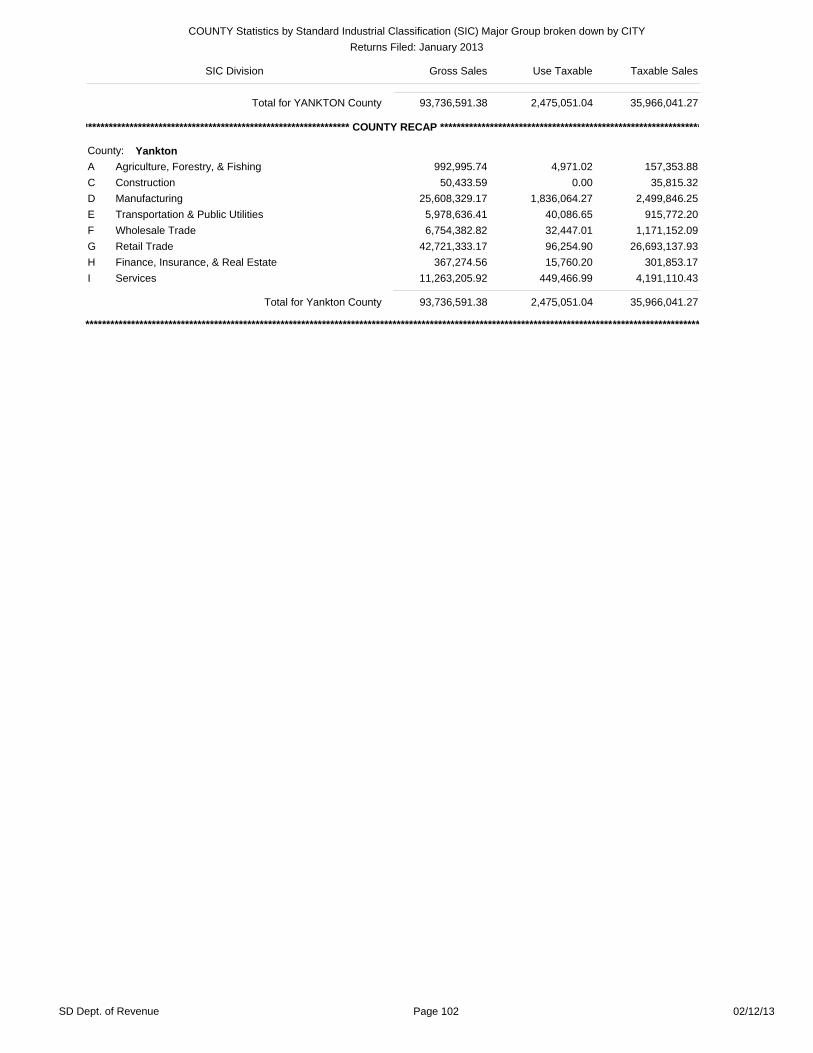
SIC Division Gross Sales Use Taxable Taxable Sales
COUNTY Statistics by Standard Industrial Classification (SIC) Major Group broken down by CITYReturns Filed: January 2013
Total for YANKTON County 93,736,591.38 2,475,051.04 35,966,041.27
**************************************************************** COUNTY RECAP ***************************************************************
****************************************************************************************************************************************************
YanktonCounty:Agriculture, Forestry, & Fishing 992,995.74 4,971.02 157,353.88AConstruction 50,433.59 0.00 35,815.32CManufacturing 25,608,329.17 1,836,064.27 2,499,846.25DTransportation & Public Utilities 5,978,636.41 40,086.65 915,772.20EWholesale Trade 6,754,382.82 32,447.01 1,171,152.09FRetail Trade 42,721,333.17 96,254.90 26,693,137.93GFinance, Insurance, & Real Estate 367,274.56 15,760.20 301,853.17HServices 11,263,205.92 449,466.99 4,191,110.43I
Total for Yankton County 93,736,591.38 2,475,051.04 35,966,041.27
02/12/13Page 102SD Dept. of Revenue

SIC Division Gross Sales Use Taxable Taxable Sales
COUNTY Statistics by Standard Industrial Classification (SIC) Major Group broken down by CITYReturns Filed: January 2013
ZIEBACHCounty:Cherry Creek
Other N/A N/A N/A
Total for Cherry Creek N/A N/A N/ADupree
Manufacturing 198,063.27 59.06 1,503.86DWholesale Trade 14,405.13 570.36 10,897.17FRetail Trade 796,503.96 69.96 245,774.66GServices 69,953.91 0.10 69,948.90IOther 8,648.80 385.46 9,034.26
Total for Dupree 1,087,575.07 1,084.94 337,158.85Other Cities
Other N/A N/A N/A
Total for Other Cities N/A N/A N/A
Total for ZIEBACH County 1,107,862.17 1,189.76 357,550.77
**************************************************************** COUNTY RECAP ***************************************************************
****************************************************************************************************************************************************
ZIEBACHCounty:Manufacturing 198,063.27 59.06 1,503.86DWholesale Trade 14,405.13 570.36 10,897.17FRetail Trade 802,106.06 69.96 251,376.76GServices 84,638.91 104.92 84,738.72IOther 8,648.80 385.46 9,034.26
Total for ZIEBACH County 1,107,862.17 1,189.76 357,550.77
02/12/13Page 103SD Dept. of Revenue

SIC Division Gross Sales Use Taxable Taxable Sales
COUNTY Statistics by Standard Industrial Classification (SIC) Major Group broken down by CITYReturns Filed: January 2013
PUBLIC UTILITIESCounty:Other Cities
Transportation & Public Utilities 39,895,182.92 7,825,566.05 42,799,734.08E
Total for Other Cities 39,895,182.92 7,825,566.05 42,799,734.08
Total for PUBLIC UTILITIES County 39,895,182.92 7,825,566.05 42,799,734.08
**************************************************************** COUNTY RECAP ***************************************************************
****************************************************************************************************************************************************
Public UtilitiesCounty:Transportation & Public Utilities 39,895,182.92 7,825,566.05 42,799,734.08E
Total for Public Utilities County 39,895,182.92 7,825,566.05 42,799,734.08
02/12/13Page 104SD Dept. of Revenue
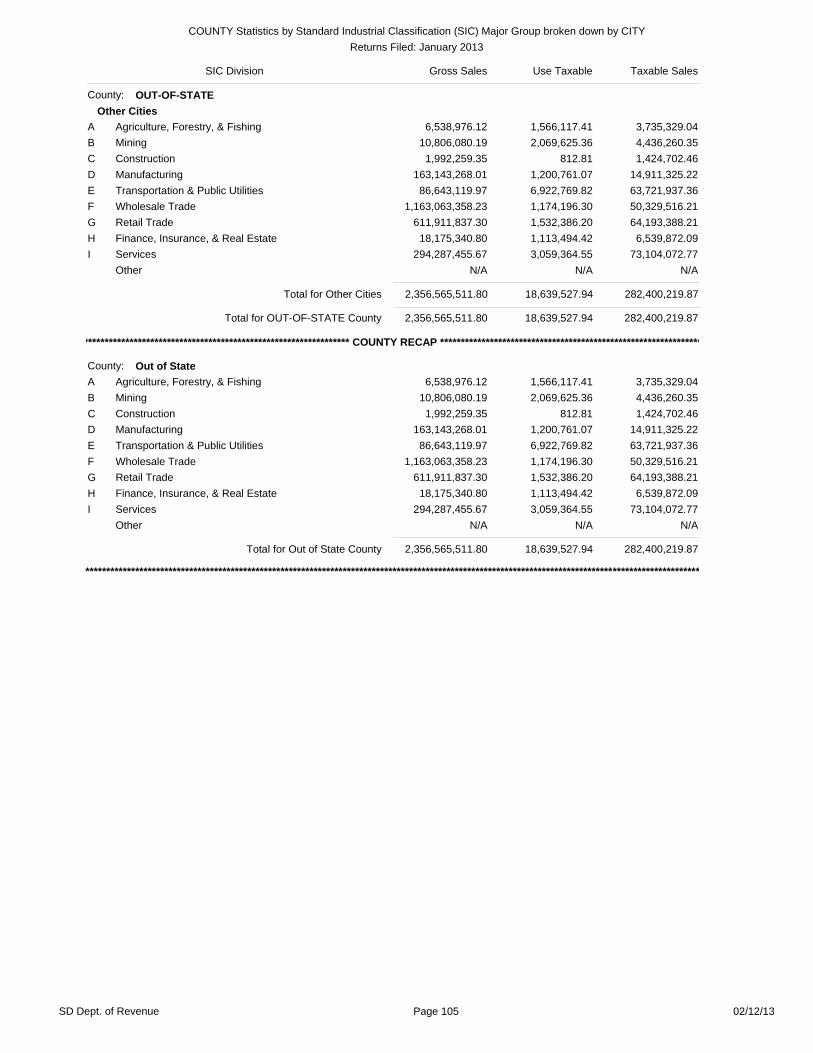
SIC Division Gross Sales Use Taxable Taxable Sales
COUNTY Statistics by Standard Industrial Classification (SIC) Major Group broken down by CITYReturns Filed: January 2013
OUT-OF-STATECounty:Other Cities
Agriculture, Forestry, & Fishing 6,538,976.12 1,566,117.41 3,735,329.04AMining 10,806,080.19 2,069,625.36 4,436,260.35BConstruction 1,992,259.35 812.81 1,424,702.46CManufacturing 163,143,268.01 1,200,761.07 14,911,325.22DTransportation & Public Utilities 86,643,119.97 6,922,769.82 63,721,937.36EWholesale Trade 1,163,063,358.23 1,174,196.30 50,329,516.21FRetail Trade 611,911,837.30 1,532,386.20 64,193,388.21GFinance, Insurance, & Real Estate 18,175,340.80 1,113,494.42 6,539,872.09HServices 294,287,455.67 3,059,364.55 73,104,072.77IOther N/A N/A N/A
Total for Other Cities 2,356,565,511.80 18,639,527.94 282,400,219.87
Total for OUT-OF-STATE County 2,356,565,511.80 18,639,527.94 282,400,219.87
**************************************************************** COUNTY RECAP ***************************************************************
****************************************************************************************************************************************************
Out of StateCounty:Agriculture, Forestry, & Fishing 6,538,976.12 1,566,117.41 3,735,329.04AMining 10,806,080.19 2,069,625.36 4,436,260.35BConstruction 1,992,259.35 812.81 1,424,702.46CManufacturing 163,143,268.01 1,200,761.07 14,911,325.22DTransportation & Public Utilities 86,643,119.97 6,922,769.82 63,721,937.36EWholesale Trade 1,163,063,358.23 1,174,196.30 50,329,516.21FRetail Trade 611,911,837.30 1,532,386.20 64,193,388.21GFinance, Insurance, & Real Estate 18,175,340.80 1,113,494.42 6,539,872.09HServices 294,287,455.67 3,059,364.55 73,104,072.77IOther N/A N/A N/A
Total for Out of State County 2,356,565,511.80 18,639,527.94 282,400,219.87
02/12/13Page 105SD Dept. of Revenue

SIC Division Gross Sales Use Taxable Taxable Sales
COUNTY Statistics by Standard Industrial Classification (SIC) Major Group broken down by CITYReturns Filed: January 2013
CONSOLIDATEDCounty:Other Cities
Agriculture, Forestry, & Fishing 3,158,036.79 64,005.66 1,440,473.87AManufacturing -17,400,633.93 -1,115,696.44 783,971.89DTransportation & Public Utilities 6,009,990.26 156,530.03 5,741,821.38EWholesale Trade 110,362,605.60 294,730.71 6,197,816.21FRetail Trade 106,116,529.33 348,972.86 62,106,178.81GFinance, Insurance, & Real Estate 1,044,836.24 4,921.22 1,049,216.73HServices 14,966,095.38 195,317.11 2,087,163.12IOther N/A N/A N/A
Total for Other Cities 224,600,660.19 -51,218.83 79,618,713.33
Total for CONSOLIDATED County 224,600,660.19 -51,218.83 79,618,713.33
**************************************************************** COUNTY RECAP ***************************************************************
****************************************************************************************************************************************************
CONSOLIDATED-No City taxCounty:Agriculture, Forestry, & Fishing 3,158,036.79 64,005.66 1,440,473.87AManufacturing -17,400,633.93 -1,115,696.44 783,971.89DTransportation & Public Utilities 6,009,990.26 156,530.03 5,741,821.38EWholesale Trade 110,362,605.60 294,730.71 6,197,816.21FRetail Trade 106,116,529.33 348,972.86 62,106,178.81GFinance, Insurance, & Real Estate 1,044,836.24 4,921.22 1,049,216.73HServices 14,966,095.38 195,317.11 2,087,163.12IOther N/A N/A N/A
Total for CONSOLIDATED-No City tax County 224,600,660.19 -51,218.83 79,618,713.33
02/12/13Page 106SD Dept. of Revenue

SIC Division Gross Sales Use Taxable Taxable Sales
COUNTY Statistics by Standard Industrial Classification (SIC) Major Group broken down by CITYReturns Filed: January 2013
STATE-WIDE TOTALS
ITEMS OF NOTE:
2. GROSS SALES: This is the amount reported on Line 1 of the South Dakota Sales and Use Tax Return.3. USE TAXABLE: This is the amount reported on Line 2 of the South Dakota Sales and Use Tax Return.
5. All figures are compiled by location zip code within a county. Some businesses may not be within City limits. These are State taxable figures only!
4. TAXABLE SALES: This is the amount of sales and use taxable sales subject to state tax or reservation tax.
6. Some cities may fall into more than one county.
8. City, County, and State Totals include 'Other' categories.7. Whenever there are less than 3 licenses in any one classification, the information is combined into an 'Other' category.
1. Report is NOT based on City tax collections or remittances. Report shows state taxable sales by zip code.
9. No Contractors Excise taxes are included.
Agriculture, Forestry, & Fishing 75,748,364.72 4,044,404.74 28,534,044.91AMining 22,690,950.29 3,666,041.90 7,676,707.03BConstruction 5,410,722.59 10,946.66 3,335,935.46CManufacturing 821,162,549.45 27,016,913.28 66,607,666.18DTransportation & Public Utilities 336,331,223.86 20,506,831.04 220,651,952.98EWholesale Trade 1,881,398,319.14 7,572,297.97 125,027,360.66FRetail Trade 2,745,101,981.64 13,781,289.02 1,023,339,219.37GFinance, Insurance, & Real Estate 57,500,103.34 9,903,483.25 35,760,207.38HServices 942,453,097.60 29,960,253.55 295,229,094.27IPublic Administration 159,075.49 165,697.37 263,471.74J
STATE-WIDE TOTALS: 6,887,956,388.12 116,628,158.78 1,806,425,659.98
02/12/13Page 107SD Dept. of Revenue