Embed Size (px)
Citation preview

Department of Criminology and Criminal Justice
South Carolina Law Enforcement Census 2009:
Less-Lethal Technology and Use-of-Force Policy
Jeff Rojek, Ph.D.
Robert J. Kaminski, Ph.D.
Michael R. Smith, Ph.D.
Ben Meade, M.A.
August 2009

1
SOUTH CAROLINA LAW ENFORCEMENT CENSUS 2009:
LESS-LETHAL TECHNOLOGY AND USE-OF-FORCE POLICY
EXECUTIVE SUMMARY
The South Carolina Law Enforcement Census is an annual survey conducted by the Department of Criminology and Criminal Justice at the University of South Carolina. The topics examined in the survey shift on a year to year basis between a general inquiry into the characteristics of law enforcement agencies in the state and the investigation of special issues confronting these agencies. This year’s survey focused on less-lethal weapons and related policies. Over the past decade conducted energy devices (CEDs) such as the TASER� and Stinger� have increasingly been added to the inventory of less-lethal force weapons. While CEDs have been viewed as a useful new tool by agencies, their use has drawn criticism from some corners. Within this context of a new use-of-force technology and related criticism, the goal of this year’s survey was to identify standard practices across law enforcement agencies on the deployment of less-lethal technologies and the policies that guide their use. This is intended to provide agencies the ability to benchmark their practices relative to their peers. The survey was distributed to all law enforcement agencies in the State of South Carolina, as well as to law enforcement agencies nationwide that employ 100 or more sworn personnel. The national sample provides South Carolina agencies the opportunity to compare their policies and practices to agencies across the nation.
The survey responses revealed that the less-lethal weapons most commonly deployed to law enforcement personnel in both the South Carolina and national sample agencies were personal-issue chemical sprays (primarily pepper spray) and expandable batons (e.g. ASP). However, the third most common less-lethal weapon that has been rapidly adopted by agencies in South Carolina and across the nation over the past ten years has been CEDs. Seventy percent of South Carolina agencies and seventy-eight percent of agencies in the national sample have adopted CEDs, with the vast majority deploying the TASER M26 or X26 models. The use of CEDs by law enforcement, however, has not been without controversy. Although a substantial body of literature suggests the use of CEDs are generally safe when used properly, incidents involving the deaths of citizens proximate to CED exposure have prompted critics to argue agencies should no longer deploy this weapon or that they should place a moratorium on its use until additional research on their impact has been conducted. The survey reveals that no responding agency permanently discontinued the use of CEDs, and no agency in South Carolina temporarily suspended the use of CEDs. However, a small percentage of agencies in the national sample (3.1%) temporarily suspended the use of CEDs.
Regarding use-of-force policy, the overwhelming majority of agencies reported that they employ a use-of-force continuum or model to guide their policy and training. Approximately seventy percent of South Carolina (68.1%) agencies and the agencies in the national sample (75.5%) reported their use-of-force policy has remained unchanged and they have not considered changing it in the past two years. To gauge standards

2
related to when weapons and tactics could be used, the agencies were asked to rank various force options. One of the more notable findings from these rankings was that South Carolina and the national sample agencies on average placed CEDs on the same force level as personal issue chemical sprays and hard empty hand tactics (strikes/punches/kicks). With regard to CED policy, almost all agencies reported that they had established guidance on the use of this weapon through a standalone policy or through the inclusion of CED-specific language in a general use-of-force policy. The majority of agencies in South Carolina (75.6%) and in the national sample (62.1%) reported circumstances when CEDs could be used have not changed in the past two years. However, a notable percentage of agencies reported that they had expanded the circumstances where CEDs could be used (South Carolina 11.1%, national sample 15.5%) or reduced the circumstances in which they could be used (South Carolina 2.2%, national sample 15.2%).
In sum, the findings reveal there is considerable similarity between South Carolina agencies and the national sample of agencies in the deployment of less-lethal weapons and the related policies that guide their use. This is particularly notable with the emergence of new generations CEDs, which have found rapid adoption in both groups of agencies.

3
SOUTH CAROLINA LAW ENFORCEMENT CENSUS 2009:
LESS-LETHAL TECHNOLOGY AND USE-OF-FORCE POLICY
INTRODUCTION This year’s South Carolina Law Enforcement Census examines less-lethal weapons and related policies in South Carolina and compares South Carolina law enforcement practices in these areas to a nationwide sample of local law enforcement agencies. Less-lethal weapons and policies were chosen as the focus of the 2009 Census because the use-of-force by police continues to be a source of controversy both in South Carolina and across the country. Over the last two years, three South Carolina troopers were charged with civil rights violations stemming from allegations of excessive force, and the State’s secretary of public safety and highway patrol chief were forced from office as a result (Kinnard, 2009). At the same time, law enforcement agencies in South Carolina are grappling with how best to integrate emerging less-lethal technologies into their existing use-of-force options and administrative policies so as to minimize risk and avoid future problems. Within the last five years, conducted energy devices (CEDs) such as the Taser� and Stinger� have proliferated in South Carolina and among law enforcement agencies in other states. A 2005 report from the U.S. Government Accounting Office found that CEDs were in use by more than 7,000 law enforcement agencies in the United States. Industry figures place that number at more than 12,000 agencies, which represents approximately two thirds of the nation’s state and local law enforcement agencies. As the use of CEDs has spread, controversy has followed. Interest groups such as the ACLU and Amnesty International have called for a moratorium on the use of CEDs following allegations of in-custody deaths. Although an emerging body of literature suggests that CEDs are generally safe and effective (Bozeman, Hauda, Heck, Graham, Martin, & Winslow, 2008; Smith, Kaminski, Alpert, Fridell, MacDonald, & Kubu, 2009), law enforcement agencies in South Carolina and elsewhere have little comparative information to draw upon in developing appropriate administrative policies to guide their use of CEDs. The 2009 South Carolina Law Enforcement Census was designed to provide law enforcement policy-makers with information on a range of issues related to less-lethal weapons and policies. In particular, this year’s Census provides comparative data on the following less-lethal force-related questions:
x What less-lethal technologies are in use by South Carolina law enforcement agencies and how does South Carolina compare to a national sample of local law enforcement agencies?
x Under what conditions are various less-lethal tactics and weapons permitted to be used within agency guidelines?
x What policies and procedures apply specifically to the use of CEDs and do agencies place limits on their use?
4
The remainder of the report is organized into three sections. The first section provides a brief discussion of the study methodology. The second section presents the findings from the survey, which is divided into four areas: less-lethal weapons deployment, use-of-force policies, use-of-force reporting and review, and conducted energy devices. The third section provide a brief review and discussion of the findings.
METHODOLOGY The South Carolina Law Enforcement Census is an annual survey conducted by the Department of Criminology and Criminal Justice at the University of South Carolina. The survey fluctuates on an annual basis between a general census of South Carolina law enforcement agency characteristics and surveys on special issues confronting agencies in the state. In prior years, these special issue surveys have explored patterns of gang activity in South Carolina and standards of training. As noted above, this year’s special issue survey was dedicated to exploring less-lethal technology and use-of-force policy. The survey was administered to all law enforcement agencies in South Carolina, which includes municipal, county, state, and special function agencies. The survey was also administered to a sample number of agencies outside the state. The sample was composed of local law enforcement agencies nationwide with 100 or more sworn personnel. This additional sample was intended to provide a comparative context for the findings related to South Carolina agencies, as well as for developing an understanding of nationwide trends regarding use-of-force standards. The survey was administered by mail to the South Carolina agencies and the national sample. A full description of the methods used to conduct the survey can be found in Appendix A, and the survey instrument is provided in Appendix B. A total of 1,067 surveys were distributed, with 291 sent to South Carolina law enforcement agencies and 776 to the national sample of law enforcement agencies with 100 or more sworn personnel. A total of 552 completed surveys were returned representing 51.7% of all agencies. The response rate among the national sample of agencies was slightly higher at 52.8% than the South Carolina agencies at 48.8%. The findings presented below are based on the responses of these 552 agencies.
FINDINGS The survey contained questions about the less-lethal weapons carried by agencies and the policies that guide their use. Given the increased deployment of conducted energy devices and the concerns related to their use, the survey contained a specific set of questions on the use and related policies for these weapons. The overall goal of the survey was to identify policy standards for less-lethal weapons among South Carolina law enforcement agencies, and subsequently how these standards compare to agencies across the United States. As a result, each of the figures and tables below present the results from the responding South Carolina agencies and national sample of agencies separately to aid in comparison. One caveat is that the South Carolina agencies represent a wide range of departments, from departments with a few sworn

5
personnel to a few hundred, whereas the national sample only contains agencies with 100 or more sworn personnel. Less-lethal Weapons Deployment The survey first asked agencies to identify the less-lethal weapons they deploy in the field. Figure 1 illustrates the percentage of agencies that carry each type of less-lethal weapon. The two most utilized less-lethal force options used by the national sample of agencies and South Carolina departments are handheld chemical agents and expandable batons. Over 97% of national agencies and almost 88% of South Carolina police agencies utilize personal-issue chemical sprays, and expandable batons are deployed among 95.1% of the national sample and 77.3% of South Carolina agencies. Conducted energy devices are the third most frequently deployed less-lethal technology, with 78.6% of the national sample agencies and 70.2% of South Carolina departments utilizing CEDs. Forty-five percent of national agencies carry the straight or side-handle baton (as opposed to the previously mentioned 95.1% that utilize the collapsible baton) while only 14.2% of South Carolina departments deploy straight or side-handle batons. Finally, the percentage of South Carolina agencies that have either weapon-deployed chemical agents or other impact munitions at their disposal is far below the percentage of the national sample agencies. Only 12.1% of South Carolina departments deploy weapon-delivered chemical agents, compared to almost half (46.7%) of the national sample agencies. Similarly, nearly 70% of the national sample departments deploy some type of impact munitions, but only 21.3% of agencies in South Carolina deploy impact munitions. Figure 1. Percent of agencies deploying less-lethal weapons

6
The agencies were asked a follow-up question about the extent to which these less-lethal weapons were deployed within their department. The results are presented Table 1, broken down by the percent of agencies that deploy the weapon to more or less than fifty percent of their sworn personnel. Among the national sample of agencies that provide officers with personal-issue chemical sprays and expandable batons, 93.5% of agencies deploy chemical spray to more than half of their personnel and 86.7% of departments distribute expandable batons to over 50% of department personnel. In South Carolina, 85.5% of departments that use handheld chemical agents deploy it to more than half of their personnel and 80.7% using expandable batons deploy them to over 50% of department personnel. In relation to CEDs, 72.4% of the national sample of agencies that use CEDs distribute them to more than 50% of personnel. In South Carolina, 82.8% of agencies that utilize CEDs deploy to more than half of their personnel. Of those agencies that utilize the straight or side-handle batons, 55% of South Carolina agencies deploy them to more than half of their department personnel while only 34.1% of national agencies have more than half of their personnel carrying this weapon. Only a very small percentage of departments that deploy weapon-delivered chemical agents or impact munitions distribute them to more than half of the department’s personnel. This last finding is partially the result of weapon-delivered chemical agents and impact munitions typically only being deployed to specialized units, such as tactical teams. Table 1. Percent of uniformed officers/deputies and supervisors that routinely carry specific less- lethal weapons*
Less-lethal Weapon Less than 50%
of personnel Carry Weapon
More than 50% of personnel
Carry Weapon National Sample of Agencies
Straight or side-handle baton 65.9% 34.1% Expandable baton (e.g., ASP) 13.3% 86.7% Conducted energy device (e.g. Taser, Stringer, stun Gun)
27.6% 72.4%
Personal issue chemical agency (e.g. OC, CS) 6.5% 93.5% Weapon-deployed chemical agent (e.g. pepper ball) 98.4% 1.6% Other Impact Munitions (e.g., soft projectiles, bean bags)
90.6% 9.4%
South Carolina Agencies Straight or side-handle baton 45.0% 55.0% Expandable baton (e.g., ASP) 19.3% 80.7% Conducted energy device (e.g. Taser, Stringer, stun Gun)
17.2% 82.8%
Personal issue chemical agency (e.g. OC, CS) 14.5% 85.5% Weapon-deployed chemical agent (e.g. pepper ball) 94.1% 5.9% Other Impact Munitions (e.g., soft projectiles, bean bags)
100.0% 0.0%
* Based only on agencies who reported deploying the given less-lethal weapon The survey also explored whether agencies required their personnel to experience the effects of chemical agents or CEDs prior to being authorized to carry them. Figure 2

7
represents the percentage of agencies that require their personnel to experience either. A greater percentage of the national sample of agencies require personnel to experience the effects of chemical agents than do police agencies in South Carolina, but a greater percentage of responding South Carolina departments require their officers/deputies to experience the effects of CEDs prior to carrying them. Over three-fourths of the national sample of agencies (77.9%) require personnel to experience the effects of chemical agents prior to authorization to carry, while almost 70% of South Carolina departments require officers to experience chemical agents. The difference between South Carolina and the national sample agencies concerning experiencing the effects of CEDs is larger, with 61.2% of South Carolina departments requiring officers to experience the effect of CEDs prior to carrying them, and only 41.5% of responding national sample agencies require officers to experience this effect. Figure 2. Percent of agencies requiring officers/deputies to experience the effects of chemical spray and CED before they are authorized to carry each
Use-of-force Policies After exploring the type and degree of less-lethal weapon deployment, the survey questions shifted to the related polices. The agencies were first asked if they used a use-of-force continuum/model to guide policy and/or training. Figure 3 illustrates the percentage of law enforcement agencies that use a continuum/model. A greater percentage of police agencies in the state of South Carolina reference a use-of-force continuum or model (93.3%) than do the comparative national sample of agencies (86.4%).

8
Figure 3. Percent of agencies that use a use-of-force continuum/model in policy or training
Agencies indicating they used a use-of-force continuum/model, were subsequently asked whether a linear, matrix, circular or other model best characterized their particular continuum. As represented in Figure 4, the most widely utilized type is a linear continuum, with 70.5% of South Carolina and 45.9% of the national sample agencies reporting its use. The matrix continuum is the second most widely used model, employed by 21.3% of South Carolina agencies and 25.1% of the national sample of agencies. Very few South Carolina agencies reported using a circular continuum or other type of model; combined less than 10% of agencies of South Carolina use these models. The circular matrix is in much greater use by responding national sample agencies at 20.8%. Close to 10% of agencies across the United States responded their continuum/model was of some type other than linear, matrix or circular. Figure 4. Distribution of use-of-force continua/models used by agencies

9
After indicating the particular type of use-of-force continuum/model in use by the department, police agencies were asked whether they had considered changing their model/continuum in the past two years or were currently in the process of revising it. Figure 5 reveals that most responding police agencies, both in South Carolina (75.6%) and across the United States (68.1%) had not changed their continuum in the past two years and were not currently considering a change. Sixteen percent of the national sample of agencies changed their continuum/model in the past two years and 16% are currently considering a change. Just over 15% of South Carolina agencies are currently considering changes to their use-of-force continuum or model, and slightly less than 10% (9.2%) instituted a change in the past two years. Figure 5. Percent of agencies who changed or considering changing their use-of-force continua/model
The emergence of CEDs as a less-lethal weapon for law enforcement agencies has raised important policy questions about the circumstances in which this tool should be used, particularly in relation to other less-lethal weapons and use-of-force tatics. In order to measure where CED use falls relative to other weapons and tactics, agencies were asked to rank the following ten types of force:
x Verbal control commands x Chemical incapacitants (e.g., pepper spray) x CED (e.g., TASER) x Control holds (e.g., escort, pain-compliance holds) x Strikes/punches x Baton/impact weapons x Chemical/kinetic hybrids (e.g., pepper filled projectiles) x Kinetic weapons or munitions (e.g., beanbag projectile) x Incapacitation holds (e.g., neck restraints) x Firearms
10
The agencies were asked to rank these ten force types from the lowest type of force to the highest type, with the number 1 representing the lowest possible ranking of a force type. If their agency did not employ a force type, they could note it was not applicable to their ranking. Given agencies may rank force types at the same level, the survey respondents were also informed that they may assign the same rank to more than one type of force. Providing a comparison of these force types, however, created some complications. Agencies may use different force scales because they rank force types at the same level or they do not use a given force type, which can result in agencies using scales of 1 through 10, 1 though 7, 1 though 5, and so on. As a result, the ranking of force types is presented with the mean rank score, which provides the ability to examine the average ranking relative to other force types.
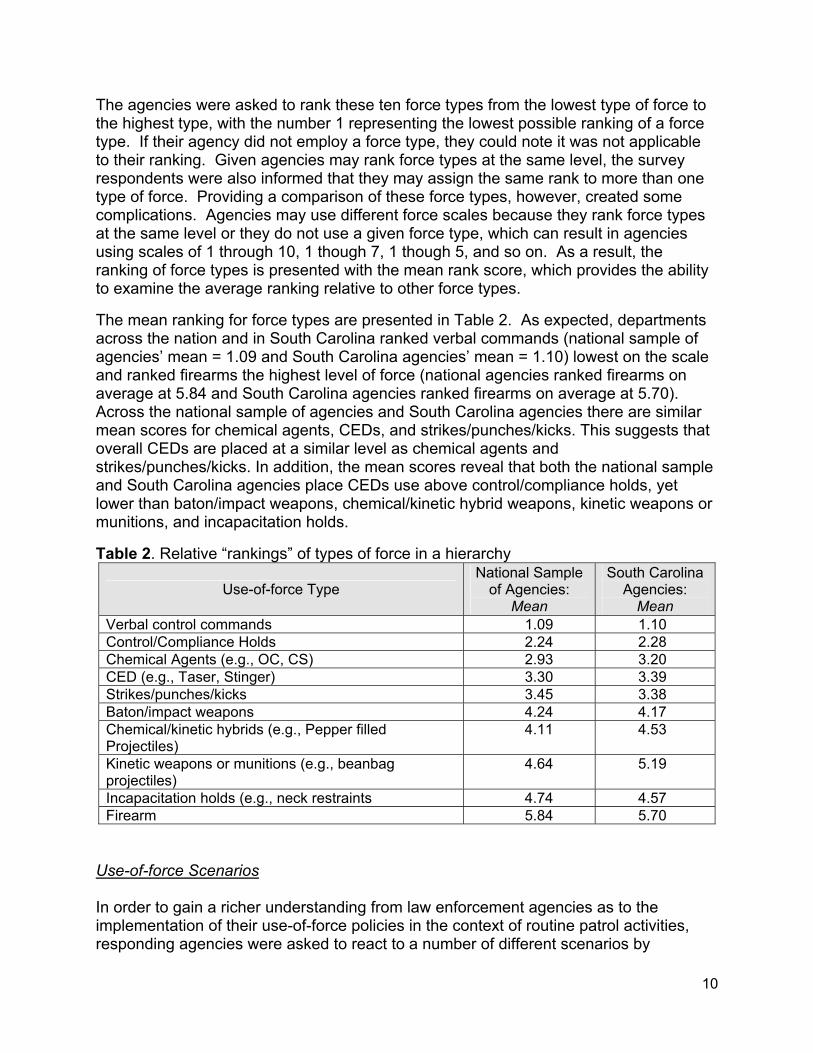
The mean ranking for force types are presented in Table 2. As expected, departments across the nation and in South Carolina ranked verbal commands (national sample of agencies’ mean = 1.09 and South Carolina agencies’ mean = 1.10) lowest on the scale and ranked firearms the highest level of force (national agencies ranked firearms on average at 5.84 and South Carolina agencies ranked firearms on average at 5.70). Across the national sample of agencies and South Carolina agencies there are similar mean scores for chemical agents, CEDs, and strikes/punches/kicks. This suggests that overall CEDs are placed at a similar level as chemical agents and strikes/punches/kicks. In addition, the mean scores reveal that both the national sample and South Carolina agencies place CEDs use above control/compliance holds, yet lower than baton/impact weapons, chemical/kinetic hybrid weapons, kinetic weapons or munitions, and incapacitation holds.
Table 2. Relative “rankings” of types of force in a hierarchy
Use-of-force Type National Sample
of Agencies: Mean
South Carolina Agencies:
Mean Verbal control commands 1.09 1.10 Control/Compliance Holds 2.24 2.28 Chemical Agents (e.g., OC, CS) 2.93 3.20 CED (e.g., Taser, Stinger) 3.30 3.39 Strikes/punches/kicks 3.45 3.38 Baton/impact weapons 4.24 4.17 Chemical/kinetic hybrids (e.g., Pepper filled Projectiles)
4.11 4.53
Kinetic weapons or munitions (e.g., beanbag projectiles)
4.64 5.19
Incapacitation holds (e.g., neck restraints 4.74 4.57 Firearm 5.84 5.70
Use-of-force Scenarios In order to gain a richer understanding from law enforcement agencies as to the implementation of their use-of-force policies in the context of routine patrol activities, responding agencies were asked to react to a number of different scenarios by

11
indicating what level of force would be policy appropriate as an initial response to a suspect’s action. Agencies were given five scenarios, with a brief introductory statement applicable to all scenarios, and asked which of the following types of force would be authorized in response to the suspect’s actions in each scenario: soft empty-hand tactics/control, hard empty-hand tactics/strikes/punches, etc., OC spray, foam or other chemical weapons, baton (collapsible, straight, side handle, etc.), CED in probe/dart mode or CED in drive stun mode. Agencies also could indicate that their policy had no specific directives concerning the type of force provided in the available responses or that their department did not use or deploy a specific type of force. All scenarios were based on the following introductory information:
The following scenarios take place during a traffic stop for a minor moving violation during daylight hours. After stopping the vehicle and conducting a routine warrant check on the driver, the officer learns that the driver is wanted on a warrant for a misdemeanor-level, criminal domestic offense. The suspect is a 25 year-old male who is 5’9” tall and weighs 160 lbs. He is of average strength and fitness and has never been arrested before. The officer seeking to make the arrest is also a male and is of similar size, age, and fitness. When the following arrest scenarios take place, the suspect is standing next to his car, and the officer is by himself. Back up is responding but is 10 minutes away and no other citizens are present at the scene.
As scenarios progressed from A to E, the level of suspect resistance increased. The first scenario (Scenario A) reads as follows: “When told by the officer that he is under arrest, the suspect sits down on the ground, hands clearly visible. He silently refuses repeated commands to get up or to place his hands behind his back. His only statement to the officer is ‘I don’t want to go to jail.’” Table 3 presents the response of police agencies to Scenario A. The most frequently authorized response to the suspect’s actions in Scenario A was the use of soft or empty-handed tactics, with over 99% of national agencies and 97% of South Carolina agencies authoring their usage. Oleoresin capsicum (OC)/ pepper spray or other chemical agent were similarly authorized among national agencies (36.5%) and South Carolina departments (33.3%). However, a greater percentage of South Carolina department authorized the use of CEDs, both in probe/dart and driver stun mode, than did national agencies. Twenty-two percent (22.6%) of South Carolina agencies authorized CED use in probe/dart mode and 32.6% authorized CED use in drive stun mode, while only 15.6% of the national sample of agencies authorized CED use in probe/dart mode and 19.3% authorized CED use in drive stun mode. Hard empty-handed tactics and batons were the types of force that are the least likely to be authorized by department policy. Approximately 10% of national sample (10.9%) and South Carolina (9.8%) agencies authorized the use of hard empty-hand tactics such as strikes or punches, and even fewer departments authorized the use of batons. Almost 6% (6.5%) of national agencies and 5.7% of South Carolina agencies authorized the use of batons in response to Scenario A.

12
Table 3. Less-lethal force authorized for use in scenario A
Less-Lethal Force
National Sample of Agencies:
% Authorizing Force
South Carolina Agencies:
% Authorizing Force
Soft empty-hand tactics/control 99.3% 97.0% Hard empty-hand tactics/strikes/punches, etc. 10.9% 9.8% OC spray, foam, or other chemical weapons 36.5% 33.3% Baton (collapsible, straight, side handle, etc.) 5.7% 6.5% CED in probe/dart mode 15.6% 22.6% CED in drive stun mode 19.3% 32.6%
Scenario B reads as follows: “When told by the officer that he is under arrest, the suspect initially cooperates, but when the officer grasps his wrists to guide his hands behind his back, he tenses his arms and refuses to comply with the officer’s orders to stop resisting. He continues to tense and pull against the officer for 15-20 seconds.” Table 4 reveals that nearly all national sample agencies (97%) and almost 90% (86.7%) of South Carolina agencies authorize soft-empty handed tactics, while about 60% of the national sample (64.3%) and South Carolina (60.6%) departments authorize hard empty-handed tactics. A greater percentage of national sample agencies (84.8%) authorized OC spray or some other chemical agent than did South Carolina agencies (66.7%). Just as in Scenario A, the baton was the weapon that the smallest percentage of national sample (34.4%) and South Carolina (29.5%) agencies authorized. A similar percentage of national sample (69.6%) and South Carolina (70.5%) agencies authorized CEDs in drive stun mode. Sixty-five percent (65.4%) of national agencies and 59.8% of South Carolina police agencies authorized the use of CEDs in probe/dart mode. Table 4. Less-lethal force authorized for use in scenario B
Less-Lethal Force National Sample of
Agencies: % Authorizing Force
South Carolina Agencies:
% Authorizing Force Soft empty-hand tactics/control 97.0% 86.7% Hard empty-hand tactics/strikes/punches, etc.
64.3% 60.6%
OC spray, foam, or other chemical weapons 84.8% 66.7% Baton (collapsible, straight, side handle, etc.)
34.4% 29.5%
CED in probe/dart mode 65.4% 59.8% CED in drive stun mode 69.6% 70.5%

13
Table 5 presents agency responses to Scenario C, which reads as follows: “When told by the officer that he is under arrest, the suspect immediately turns and starts to run away. The officer begins to chase him and quickly closes the gap between himself and the suspect. When the officer and suspect are 12 feet apart, the suspect slows down and looks over his shoulder, but does not stop running.” In response to Scenario C, the only weapon that was not authorized by at least half of police agencies was the baton, with slightly less than half (45.9%) of national sample agencies authorizing it and only 35.6% of South Carolina agencies authorizing baton usage. The majority of police departments authorized the use of soft-empty handed tactics (93.1% of national agencies and 78.4% of South Carolina agencies), hard empty-handed tactics (72.4% of national agencies and 60.6% of South Carolina agencies), OC spray or other chemical agent (85.8% of national agencies and 67.5% of South Carolina agencies), CED in probe/dart mode (78.9% of national agencies and 83.5% of South Carolina agencies) and CED in drive stun mode (71.9% of national agencies and 65.6% of South Carolina agencies). Table 5. Less-lethal force authorized for use in scenario C
Less-Lethal Force
National Sample of Agencies:
% Authorizing Force
South Carolina Agencies:
% Authorizing Force
Soft empty-hand tactics/control 93.1% 78.4% Hard empty-hand tactics/strikes/punches, etc. 72.4% 60.6% OC spray, foam, or other chemical weapons 85.8% 67.5% Baton (collapsible, straight, side handle, etc.) 49.5% 35.6% CED in probe/dart mode 78.9% 83.5% CED in drive stun mode 71.9% 65.6%
The responses to Scenario D are presented in Table 6. Scenario D describes the suspect’s actions as follows: “When told by the officer that he is under arrest, the suspect states ‘I’m not going to jail’ and faces off against the officer with his hands raised in a “boxer’s stance.” The national sample and South Carolina departments overwhelmingly authorize OC spray and CEDs in probe/dart mode as an appropriate response, with at least 95% approval from both groups of agencies. South Carolina departments tended to authorize force responses that can be used or deployed without closely approaching or engaging in physical contact with the suspect (such as OC spray or CEDs in probe/dart mode) in greater percentages than types of force that would require a “hands on” approach by officers, such as soft or hard empty-handed tactics, batons, or CEDs in drive stun mode. Although the national sample of agencies preferred chemical spray and CEDs in probe/dart mode over the other force options, a greater percentage of the national sample of agencies authorized force types requiring the officer to approach or

14
make physical contact with the suspect than did police agencies in the state of South Carolina. Table 6. Less-lethal force authorized for use in scenario D
Less-Lethal Force
National Sample of Agencies:
% Authorizing Force
South Carolina Agencies:
% Authorizing Force
Soft empty-hand tactics/control 88.4% 70.1% Hard empty-hand tactics/strikes/punches, etc. 93.2% 81.3% OC spray, foam, or other chemical weapons 99.0% 96.1% Baton (collapsible, straight, side handle, etc.) 91.3% 84.4% CED in probe/dart mode 95.0% 96.9% CED in drive stun mode 88.3% 74.7%
Scenario E reads as follows: “When told by the officer that he is under arrest, the suspect swings at the officer’s head with a closed fist. The officer dodges the blow and backs away, but the suspect continues to advance towards him with his fist raised.” Agency responses to Scenario E are presented in Table 7. Soft-empty handed tactics was the force option that was authorized by the smallest percentage of both national (86.1%) and South Carolina (68.2%) police agencies, possibly indicating that policy and practice would recognize this approach as an inadequate or risky response to the level of threat posed by the suspect. The majority of agencies view the use of CEDs in probe/dart mode as an appropriate response to Scenario E, with over 98% of the national sample and South Carolina departments authorizing the use of this weapon mode. Over 90% of all responding national sample agencies authorized the use of the remaining force types. South Carolina departments were less likely than the national sample departments to authorize the use of CEDs in drive stun mode (only 84.7% compared to 93.7% of national departments) and the use of hard empty-handed tactics (88.3% compared to 96.7% of national agencies). Table 7. Less-lethal force authorized for use in scenario E
Less-Lethal Force
National Sample of Agencies:
% Authorizing Force
South Carolina Agencies:
% Authorizing Force
Soft empty-hand tactics/control 86.1% 68.2% Hard empty-hand tactics/strikes/punches, etc. 96.7% 88.3% OC spray, foam, or other chemical weapons 97.5% 94.5% Baton (collapsible, straight, side handle, etc.) 99.2% 94.4% CED in probe/dart mode 98.8% 99.0% CED in drive stun mode 93.7% 84.7%

15
Use-of-force Reporting and Review Most police agencies require officers to complete special documentation when force is used. Table 8 presents information indicating the percentage of departments responding to the survey that require documentation for a number of different types of force used during encounters with suspects. Agencies were asked to indicate whether or not their policy required officers to document the use of the particular type of force. The percentages are based only on agencies who reported that they authorize the force type in question. Table 8. Percent of agencies requiring mandatory documentation of use-of-force tactic
Use-of-force Type National
Sample of Agencies
South Carolina Agencies
Bodily force 83.3% 91.9% Chemical agent (e.g. OC, CS) 99.3% 98.4% Baton strikes 97.7% 97.2% CED presented, arced or laser pointed (without activation)
45.4% 54.1%
CED in drive stun mode 99.7% 100.0% CED in probe mode 99.7% 100.0% Other impact devices (i.e., projectile or non-projectile devices)**
98.9% 97.0%
Neck restraint/unconsciousness-rendering hold* 97.9% 96.6% Release of canine** 93.6% 98.1% Vehicle ramming* 97.4% 100.0% Firearms discharge at vehicles that miss 99.7% 100.0% Firearms discharge at vehicles that hit 99.7% 100.0% Pointing, but not discharging, a firearm at individual 45.0% 69.4%
* Fewer than 50 national and SC agencies reported authorizing this force type ** Fewer than 50 SC agencies reported authorizing this force type Overall, use-of-force reporting policies are similar across the responding national sample and South Carolina agencies. Almost all agencies (97% or greater) in both groups require mandatory documentation for police-citizen encounters that involve the use of chemical agents, baton strike, CEDs in drive stun or probe mode, other impact devices, and firearm discharges at vehicles with a miss or a hit. Moreover, a high percentage of national sample and South Carolina agencies mandate reporting of force incidents involving neck restraints/unconsciousness-rending holds, the release of a canine, and the ramming of vehicles. However, it is important to note that less than 50% of the agencies in both groups reported the use of neck restraints/unconsciousness-rending holds and vehicle ramming as force options, and less than 50% of South Carolina agencies reported the release of canines as a force option. The only force types that did not require mandatory documentation by most agencies were the presentation of CEDs (arced or laser pointed) and pointing of a firearm at an individual.

16
Conducted Energy Devices In addition to exploring general use-of-force policies, a primary focus of the survey was to capture information on the deployment of new generation CEDs and related policies. The new generation distinction is intended to capture the recent growth of CED deployment, which can largely be attributed to the products of TASER Incorporated such as the models M26 or X26. Thus, new generation CEDs were defined for the respondents as the TASER M26 and X26 models and the Stinger. The survey first asked agencies if any personnel in their agency carried a new generation CED. Figure 6 reveals that 66.7% of South Carolina agencies and 78.8% of the national sample agencies reported deploying new generation CEDs.1 Figure 6. Percent of agencies deploying new generation CEDs
The survey subsequently questioned agencies on when they first deployed new generation CEDs in their agency. Figure 7 depicts a timeline over the past 10 years (since 1999) representing the cumulative percentage of the national sample and South Carolina departments adopting new generation conducted energy devices. Comparatively, the growth of CED deployment among South Carolina agencies has lagged behind the responding agencies in the national sample. For example, 17.8% of the national sample of agencies had deployed new generation CEDs by 2002 as compared to 5.9% of South Carolina agencies (probably due to differences in size of the
1 One additional agency reported the use of new generation CEDs that did not report the deployment of CEDs in relation to Figure 1, resulting in a .2% difference between Figure 1 and Figure 6 in the reported use of CEDs for the national sample of agencies. Alternatively, 66.7% of South Carolina agencies reported the use of new generation CEDs as compared to 70.2% of South Carolina agencies reporting the use of CEDs in relation to figure 1, the difference presumably due to the distinction of “new generation” CEDs in figure 6.

17
agencies in the two samples). By 2005, 50.6% of the national sample agencies had adopted new generation CEDs compared to 28.1% of the South Carolina agencies. Figure 7. Cumulative percent of agencies adopting new generation CEDs since 1999
The survey further inquired about the specific CEDs that agencies are deploying among their sworn personnel, essentially comparing the use of TASER models M26 and X26 to all other CEDs. Table 9 displays information about the distribution of TASERs or other CEDs across agency departments or units. Overwhelmingly, police agencies across the nation and in the state of South Carolina adopted TASERs rather than another brands of CED. Among the departments that indicated they issued CEDs to their personnel, over 90% (in both the national sample of agencies and South Carolina agencies) reported their patrol officers or deputies and patrol supervisors are equipped with TASER models. The dominance of TASER models holds across other functional units, including those in which CEDs are not as commonly deployed (investigators and school resource officers).

18
Table 9. Type of CEDs deployed across agency functions
Agency Function Taser (e.g. M26, X26) Other CED
Do not deploy CEDs to unit or do not have this
type of unit National Sample of Agencies
Patrol officers/deputies 95.3% .9% 3.8% Patrol supervisors 90.6% 1.3% 8.1% Investigators 53.7% 1.3% 45.0% Special operations units (e.g. SWAT) 95.6% 1.0% 3.4% School resource officers 78.1% .4% 21.5% Other specialized units 83.1% 1.6% 15.3%
South Carolina Agencies Patrol officers/deputies 97.8% 0% 2.2% Patrol supervisors 93.5% 1.1% 5.4% Investigators 57.6% 0% 42.4% Special operations units (e.g. SWAT) 88.0% 2.0% 10.0% School resource officers 64.0% 0% 36.0% Other specialized units 78.4% 0% 21.6%
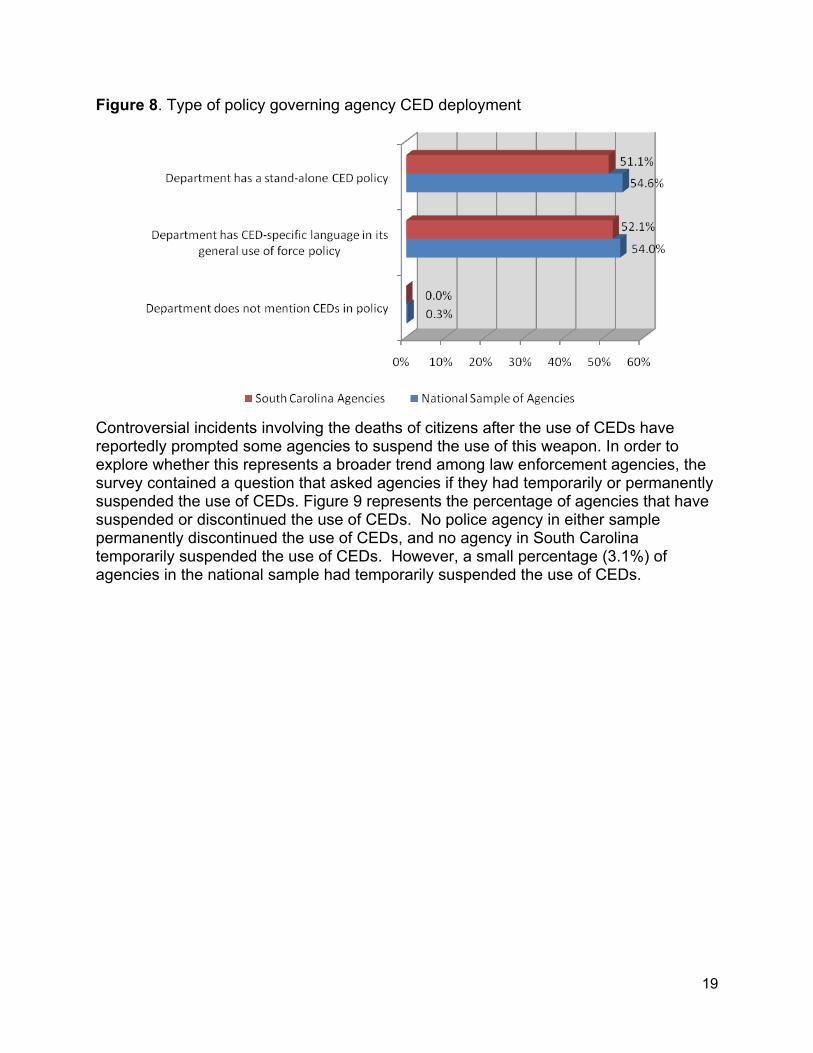
Agencies that deploy CEDs were additionally asked how their use-of-force policy specifically governed CED usage. They were asked if their department has a stand-alone policy for CEDs, CED-specific language in its general use-of-force policy, or if CEDs are not mentioned in policy. Agencies can have a stand-alone policy and also include CED-specific language in their general use-of-force policy. The results of this question are presented in Figure 8. Approximately 54.6% of the national sample agencies have a stand-alone policy that governs the use of CEDs and 54.0% have CED-specific language in their general use-of-force policy. The results were similar across South Carolina agencies, where 51.1% have a stand-alone policy for CEDs and 52.1% have CED-specific language in their general use-of-force policy. None of the police agencies in South Carolina who deploy CEDs responded that their use-of-force policy did not mention CEDs, but one agency (0.3%) in the national sample stated that they did not mention CEDs in policy.
19
Figure 8. Type of policy governing agency CED deployment
Controversial incidents involving the deaths of citizens after the use of CEDs have reportedly prompted some agencies to suspend the use of this weapon. In order to explore whether this represents a broader trend among law enforcement agencies, the survey contained a question that asked agencies if they had temporarily or permanently suspended the use of CEDs. Figure 9 represents the percentage of agencies that have suspended or discontinued the use of CEDs. No police agency in either sample permanently discontinued the use of CEDs, and no agency in South Carolina temporarily suspended the use of CEDs. However, a small percentage (3.1%) of agencies in the national sample had temporarily suspended the use of CEDs.

20
Figure 9. Percent of agencies that have temporarily suspended or permanently discontinued that use of CEDs
Another important policy issue related to CEDs is whether there are circumstances where their use should be restricted or prohibited. The survey asked agencies about policy restrictions on CED use in specific circumstances or against specific populations. Agencies were provided a list of special populations and circumstances and asked to indicate if their use-of-force policy or policy governing CED usage prohibited their use, restricted their use except when necessary and/or in special circumstances, or whether there are no restrictions or prohibitions regarding their use. Table 10 provides the results to this question for the national sample and Table 11 provides the results for South Carolina agencies. More than half (57%) of departments across the nation indicated that the use of a CED against a suspect around flammable substances is prohibited in all circumstances. The other common situations to which a number of national agencies reported their policy prohibited CED use in all circumstances were persons in elevated areas (28.2%), drivers of moving vehicles (22.9%), women who are apparently pregnant (20.9%), persons with a known or apparent cardiac condition (13.5%), persons in or around water (11.8%) and persons who are handcuffed (10.5%). Fewer than ten percent of departments across the nation prohibited the use of CEDs in all circumstances for youth, the elderly, subjects who are threatening deadly force, persons fleeing on foot, apparently physically disabled persons and persons who seem to be in a state of excited delirium. From the information presented in Table 10, it appears that national sample departments tend to recognize that circumstances or populations exist wherein CED use may not be appropriate, but permit officer discretion to make the ultimate determination based upon the presence of necessary or special situational factors. Most departments (over 50%) restrict the use of CEDs unless necessary or special circumstances exist in the following circumstances/on the following populations: the elderly (70.8%), youth based on age (69.8%), apparently pregnant women (67.4%), youth based on size (66.7%), handcuffed suspects (62.3%), apparently physically disabled persons (59.7%), persons in elevated areas (59.2%), persons in or

21
around water (53.7%), persons with known or apparent cardiac conditions (52.2%) and drivers of moving vehicles (52.5%). A majority of national sample departments place no restrictions on the use of CEDs on the following individuals/circumstances: persons fleeing on foot (60.8%), persons who seem in excited delirium (56.1%) and suspects threatening deadly force (55%). Table 10. Distribution of agencies restricting the use of CEDs on certain populations or in center circumstances – national sample of agencies
Population/Circumstance Prohibits CED
use in all circumstances
Restricts CED use except
when necessary &/or
special circumstances
No restriction set forth in
policy, procedure,
training
Driver of moving vehicle 22.9% 52.5% 24.5% Person in elevated area (e.g., on bridge, in tree)
28.2% 59.2% 12.7%
Youth/size 5.1% 66.7% 28.3% Youth/age 6.3% 69.8% 23.8% Elderly 6.3% 70.8% 22.9% Handcuffed suspect 10.5% 62.3% 27.2% Person around flammable substances 57.0% 34.8% 8.2% Person/in around water 11.8% 53.7% 34.5% Subject threatening deadly force 2.9% 42.1% 55.0% Person fleeing on foot 3.2% 36.0% 60.8% Known or apparent cardiac condition 13.5% 52.2% 34.3% Apparently pregnant women 20.9% 67.4% 11.7% Apparently physically disabled person 5.4% 59.7% 34.9% Population/circumstance .3% 32.4% 67.3% Person who seems in Excited Delirium 2.9% 41.1% 56.1%
Similar to the national sample of agencies, the only circumstance in which most South Carolina agencies prohibit the use of CEDs in all circumstances is for persons around flammable substances. Almost three-fourths (74.2%) of South Carolina agencies prohibit using CEDs in all circumstances where a person is around flammable substances, compared to 57% of national agencies. Other situations in which South Carolina departments prohibit CED use in all circumstances include apparently pregnant women (35.1%), suspects operating moving vehicles (31.2%), handcuffed suspects (26.1%), suspects with a known or apparent cardiac condition (19.1%), suspects with an apparent physical disability (16.3%) and persons in or around water (13.8%). A greater percentage of South Carolina agencies prohibit CED in the above listed circumstances than found in the national sample of agencies, although the differences generally are not large. The pattern for prohibitions and restrictions for the remaining circumstances found across South Carolina agencies are similar to the pattern across the national sample of agencies.

22
Table 11. Distribution of agencies restricting the use of CEDs on certain populations or in center circumstances – South Carolina agencies
Population/Circumstance Prohibits CED
use in all circumstances
Restricts CED use except
when necessary &/or
special circumstances
No restriction set forth in
policy, procedure,
training
Driver of moving vehicle 31.2% 41.9% 26.9% Person in elevated area (e.g., on bridge, in tree)
25.5% 55.3% 19.1%
Youth/size 6.5% 64.5% 29.0% Youth/age 5.4% 65.6% 29.0% Elderly 7.4% 67.0% 25.5% Handcuffed suspect 26.1% 55.4% 18.5% Person around flammable substances 74.2% 19.4% 6.5% Person/in around water 13.8% 50.0% 36.2% Subject threatening deadly force 3.2% 41.5% 55.3% Person fleeing on foot 2.1% 40.4% 57.4% Known or apparent cardiac condition 19.1% 51.1% 29.8% Apparently pregnant women 35.1% 52.1% 12.8% Apparently physically disabled person 16.3% 55.4% 28.3% Population/circumstance 2.2% 47.3% 50.5% Person who seems in Excited Delirium
6.4% 50.0% 43.6%
Agencies reporting they have deployed new generation CEDs were also asked if they modified their policy in the last two years regarding where CEDs are placed on their use-of-force continuum/model. Figure 10 indicates the majority of agencies did not change their policy. Over 75% (75.6%) of responding South Carolina agencies did not change their placement of CEDs and 62.1% of the national sample of agencies did not change their placement of CEDs. However, 15.5% of the national sample of agencies expanded the circumstances in which CEDs can be used and 15.2% have also reduced the circumstances in which CEDs may be used. Among South Carolina agencies, a greater percentage of agencies have expanded (11.1%) the circumstances in which CEDs may be used, while only a very small percentage (2.2%) of departments reduced the circumstances.

23
Figure 10. Percent of agencies changing the circumstance for CED use
The survey inquired whether agencies made a policy distinction between the use of CEDs in dart/probe and drive stun modes. As reported in Figure 11, over 80% of departments in the national sample and South Carolina reported their policy governing use-of-force made no distinction between these use modes. Among those South Carolina agencies that did report different policy standards, 9.6% placed more restrictions on the drive stun mode and 7.4% place more restrictions on the dart/probe mode. Similarly, 10.5% of the national sample of agencies place more restrictions on drive stun mode while 5.8% placed more restrictions on the dart/probe mode.

24
Figure 11. Differences in policy restrictions related to CED dart/probe and drive stun modes
Finally, agencies who reported deploying new generation CEDs were asked if their policy restricted the number of CED activations that officers could administer to a suspect. The results are presented in Figure 11. The vast majority of departments reported that the number of activations that a suspect could receive was not restricted by departmental policy. A greater percentage of agencies in South Carolina (92.4%) reported that policy placed no restrictions on the number of activations than did agencies across the national sample (86.8%). Of those agencies that did report a restriction on the number of activations, the majority reported their policy dictated that suspects could receive no more than three activations. Almost 8% (7.6%) of national sample agencies and 5.4% of agencies in South Carolina reported that they could administer no more than three CED activations to a suspect. A very small percentage of departments reported that the restriction on the number of activations was one (1.1% of South Carolina agencies and 0.9% of national sample agencies) or two (1.1% of South Carolina agencies and 1.6% of national sample agencies). No police agencies in South Carolina reported that the maximum number of CED activations was either four or five, but 2.2% of the national sample of agencies stated they could administer no more than four activations and 0.9% reported that five activations was the maximum allowable number.

25
Figure 12. Percent of agencies with policy restrictions on the number of CEDs activations that can be administered to a subject
DISCUSSION
Composed of more than 18,000 federal, state, and local agencies, law enforcement is a complex and diverse institution in the United States. These agencies have considerable discretion in regards to their standards, policies and overall operations. In the context of use-of-force, there are only loose boundaries found in legislation and Supreme Court decisions that govern actions and policies in this area. Hypothetically, agencies have a fair degree of latitude in what use-of-force weapons, tactics and policies they adopt. The intent of the South Carolina Law Enforcement Census this year was to examine whether standard practices have emerged in relation to the deployment of less-lethal weapons and related policies that guide their use. The census survey was distributed to all law enforcement agencies in South Carolina, as well as to all law enforcement agencies across the nation employing 100 or more sworn personnel to provide a group for comparing standards found in South Carolina agencies. Overall, South Carolina agencies were similar in the deployment of less-lethal weapons to the national sample of agencies. The most common less-lethal weapons deployed by agencies in both groups were personal use chemical sprays (i.e. OC or CS spray)

26
and expandable batons. The third most common weapon was conducted energy weapons, with 70.2% of South Carolina agencies and 78.6% of the national sample of agencies currently deploying this relatively new device. Moreover, the new generation conducted energy devices used by South Carolina and the national sample of agencies were almost exclusively the devices produced by TASER International (i.e. the M26 and X26). With regard to use-of-force policies, the patterns across the South Carolina and national sample of agencies were generally similar in relation to the circumstances when given less-lethal weapons were authorized for use, the reporting requirements, and the formation of standards for using conducted energy devices. One of the more notable findings regarding conducted energy devices was that South Carolina and the national sample of agencies tend to place CED use at the same force level, essentially equivalent to chemical sprays (i.e. OC and CS spray) and hard empty-hand tactics. In sum, despite the absence of any regulatory body or statute providing detailed guidance on less-lethal force weapons and tactics, it appears that common practices have emerged on what weapons and tactics agencies should be deploying and the policies directing their use.

27
References
Bozeman, W.P., Hauda, W.E., Heck, J.J., Graham, D.D., Martin, B.P., & Winslow, J.E. (2008). Safety and injury profile of conducted electrical weapons used by law enforcement officers against criminal suspects. Annals of Emergency Medicine, 53, 480-489.
Kinnard, M. (2009, April 28). Community service for SC trooper who bumped runner.
Associated Press State & Local Wire. Smith, M.R., Kaminski, R.J., Alpert, G.P., Fridell, L.A., MacDonald, J., & Kubu, B.
(2009). A multi-method evaluation of police use-of-force outcomes: Final report to the National Institute of Justice. Columbia, SC: Department of Criminology and Criminal Justice, University of South Carolina.

28
Appendix A
Methodology
The South Carolina Law Enforcement Census is an annual survey undertaken by the Department of Criminology and Criminal Justice at the University of South Carolina. This year’s census survey focused on less-lethal technology and use-of-force policy. The survey was based on a prior survey administered by Smith et al., (2009) as part of a National Institute of Justice grant: A multi-method evaluation of police use-of-force outcomes (final report available at http://www.cas.sc.edu/crju/). The survey was distributed to all South Carolina law enforcement agencies and to agencies in other states that employed 100 or more sworn personnel. The results reported in this monograph are based on the analysis of 552 completed surveys completed by these two groups between January 2009 and May 2009.
The 2008 National Directory of Law Enforcement Agencies was used to identify all 291 South Carolina law enforcement agencies that were selected to be a part of the survey. The South Carolina agencies included state, local, county, and special jurisdiction law enforcement agencies. The national sample of agencies was composed of all municipal and county level law enforcement agencies in the United States with 100 or more sworn personnel (minus South Carolina agencies with 100 or more sworn personnel) as identified by a combination of the 2003 Law Enforcement Management and Administration Statistics survey conducted the by the Bureau of Justice Statistics and the 2008 National Directory of Law Enforcement Agencies. The national sample of agencies contained a total of 776 agencies that received a copy of the survey. Combined, the survey was administered to 1,067 agencies.
The survey administration process involved the survey being mailed to agencies in three separate waves, a follow-up reminder card, and phone calls to agencies to improve response rates. All agencies received a copy of the survey in the first wave of survey mailing, and a follow-up reminder card was mailed to non-responding agencies two weeks after the first survey was mailed. A second wave of surveys was mailed to non-responding agencies three weeks after the reminder cards, and an additional third wave of surveys was mailed three weeks after that. Finally, phone calls were made to the remaining non-responding agencies to encourage response, and to provide additional copies of the survey as needed. In total, 563 agencies returned copies of the survey. However, 11 surveys were substantially incomplete and were eliminated from the analysis. As a result, the analysis contained in this monograph is based on 552 agencies, representing a 51.7% response rate. A total 410 of the 776 national sample agencies returned a completed survey, representing a response rate of 52.8%. A total of 142 of the 291 South Carolina agencies returned a completed survey, representing 48.8%. Table 12 provides a comparison of the distribution of agency types between the initial sample of national and South Carolina agencies and the agencies returning completed copies of the survey. Despite a response rate of approximately 50%, Table 12 reveals that the type of agencies among the national and South Carolina agencies returning the survey essentially reflect the initial sampling pool.

29
Table 12. Characteristics of agencies in the initial sampling pool and those returning surveys
Initial Sampling Pool Agencies Returning Surveys
Number of Agencies
% of Agencies
Number of Agencies
% of Agencies
South Carolina Agencies
Municipal agencies 186 63.9% 83 58.6%
County agencies 48 16.5% 34 23.9%
University/College campus agencies 49 16.8% 19 13.4%
State and special jurisdiction agencies 8 2.7% 6 4.2%
National Sample of Agencies
Municipal agencies 497 64.0% 259 63.2%
County agencies 279 36.0% 151 36.8%

30
Appendix B
Less-Lethal Technology & Use-of-Force Policy Survey

1
UUniversity of South Carolina (USC) Department of Criminology & Criminal Justice
Less-Lethal Technology & Use-of-Force Policy Survey
! Please complete all relevant questions. There are
Instructions:
20 questions! Please use either blue or black ink and print as neatly as possibly using only CAPITAL letters.
in total.
! Please mail the completed survey within two weeks of receiving it. ! Please retain a copy of the completed survey for your records as project staff may call to clarify responses. ! If you have any questions regarding the survey, please call or email Bob Kaminski at (803) 777-1560,
Agency Name:___________________________________________________________________ Agency ORI #:_____________________________________
Thank you for participating in the USC study on less-lethal technology and use of force. Your responses will help us understand departmental practices and policies as they pertain to the use of force and the challenges associated with this critical law enforcement issue. All department responses will be kept confidential. No department will be linked to its responses in any report.
We appreciate your contribution to this very important project.
Respondent Contact Information:
Title
Last Name
First Name
Email Address
Telephone ( ) – Ext.
2
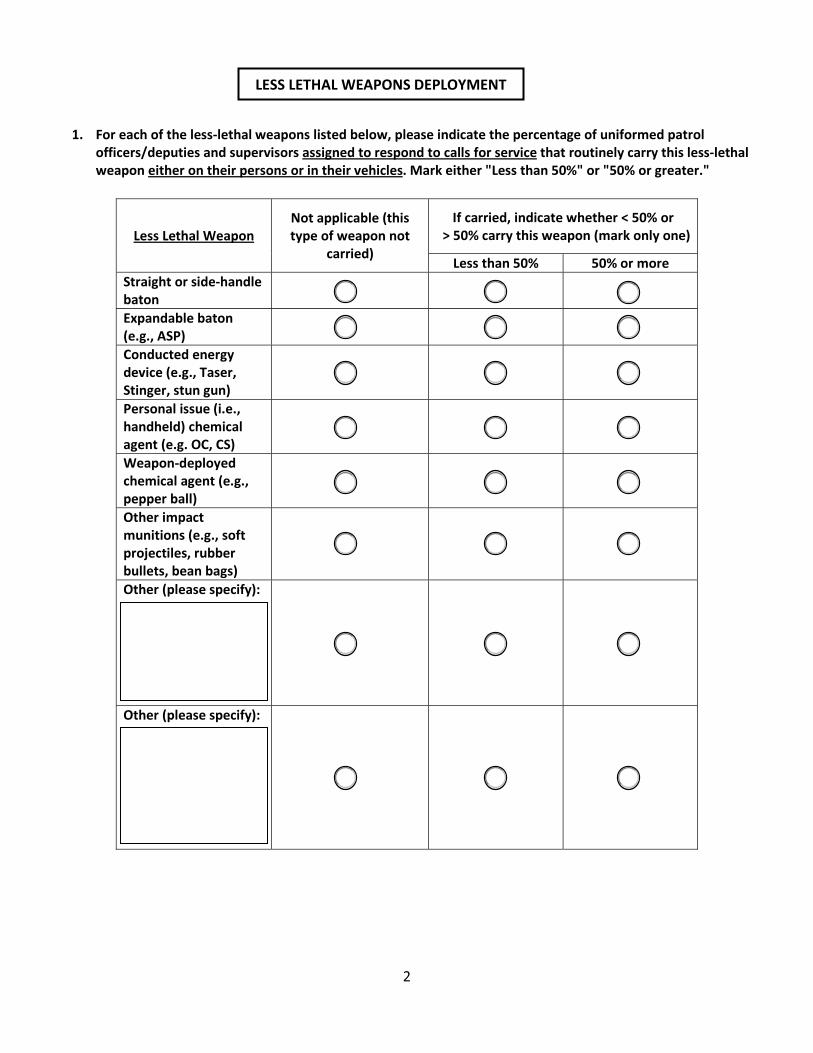
1. For each of the less-lethal weapons listed below, please indicate the percentage of uniformed patrol officers/deputies and supervisors assigned to respond to calls for service that routinely carry this less-lethal weapon either on their persons or in their vehicles
. Mark either "Less than 50%" or "50% or greater."
Not applicable (this type of weapon not
carried) Less Lethal Weapon
If carried, indicate whether < 50% or > 50% carry this weapon (mark only one)
Less than 50% 50% or more Straight or side-handle baton
Expandable baton (e.g., ASP)
Conducted energy device (e.g., Taser, Stinger, stun gun)
Personal issue (i.e., handheld) chemical agent (e.g. OC, CS)
Weapon-deployed chemical agent (e.g., pepper ball)
Other impact munitions (e.g., soft projectiles, rubber bullets, bean bags)
Other (please specify):
Other (please specify):
LESS LETHAL WEAPONS DEPLOYMENT

3
2. Do you use a use-of-force continuum/model in policy or training?
No "" If NO, please explain why not and then skip to question 5:
Yes " If YES, please indicate which one of the following BEST describes your continuum or model:
Linear
Matrix
Circular
Other (please describe):
Optional Comments:
3. On which law enforcement agency, organization, training vendor, or professional association is your use-of-
force continuum/model based on?
International Association of Chiefs of Police (IACP)
Police Executive Research Forum (PERF)
Police Foundation
Other law enforcement agency (specify): ______________________________________________________
Other source (specify): _____________________________________________________________________
FORCE POLICIES

4
4. There is flux in the field of law enforcement with regard to the use of continua/models and the type of continua/models adopted. Please indicate below whether your department has changed in this regard during the last two years OR is contemplating such a change.
Our use of a continuum/model or type used has changed in the last two years
We are in the process of reconsidering our use of the continuum/model and/or the type used
Our agency has not changed in the last two years and is not now considering change
Optional Comments:
5. Are your officers/deputies required to experience the effects of (a) chemical agents (e.g., OC, CS) or (b) conducted energy devices (CEDs), such as a Taser, before they are authorized to carry them? Please mark (##) one answer for each. (a) Chemical agent (OC, CS)
Yes
No
Not applicable (weapon not deployed)
(b) Conducted energy device (CED)
Yes
No
Not applicable (weapon not deployed)

5
6. Based on your policy and/or training, please RANK the following force types from 1 to highest, with 1 indicating the lowest level of force and the highest number indicating the most elevated level of force. Please note that more than one type of force can have the same force ranking if they are believed to represent the same level of force. Also note that departments will vary in terms of their highest number (for instance, 3, 6, 8). Use consecutive numbers. If your department does not utilize a particular type of force, please write in that box "NA." As an example a department might give verbal control commands a rank of "1"; give Chemical agents, Control holds and Strikes/punches/kicks ranks of "2"; give CEDs, Batons/impact weapons, Chemical/kinetic hybrids, and Kinetic weapons or munitions ranks of "3"; Firearms a rank of "4"; and Incapacitating holds an "NA."
Type of force Rank
1 = Lowest
Verbal control commands
Chemical agents (e.g., OC, CS)
CED (e.g., Taser, Stinger)
Control/compliance holds
Strikes/punches/kicks
Baton/impact weapons
Chemical/kinetic hybrids (e.g., pepper filled projectiles)
Kinetic weapons or munitions (e.g., beanbag projectiles)
Incapacitation holds (e.g., neck restraints)
Firearms
N/A
N/A
N/A
N/A
N/A
N/A
N/A
N/A
N/A
N/A

6
7. For each of the following 5 scenarios (Scenarios A through E), indicate whether your department would consider each use of force option provided in the table as a reasonable initial
The following scenarios take place during a traffic stop for a minor moving violation during daylight hours. After stopping the vehicle and conducting a routine warrant check on the driver, the officer learns that the driver is wanted on a warrant for a misdemeanor-level, criminal domestic violence offense. The suspect is a 25 year-old male who is 5'9" tall and weighs 160 lbs. He is of average strength and fitness and has never before been arrested. The officer seeking to make the arrest is also a male and is of similar size, age, and fitness. When the following arrest scenarios take place, the suspect is standing next to his car, and the officer is by himself. Backup is responding but is 10 minutes away and no other citizens are present at the scene.
response to the suspect's resistance based on training standards and/or use of force policy. For each of the scenarios, please assume the following facts:
SCENARIO A
When told by the officer that he is under arrest, the suspect sits down on the ground, hands clearly visible. He silently refuses repeated commands to get up or to place his hands behind his back. His only statement to the officer is "I don't want to go to jail." Which of the following less-lethal options would be authorized under your department's policy or training standards as an initial response to the suspect's actions? Please mark either "Yes" or "No" for each force option. If neither policy nor training cover the use of force type in the given scenario, please mark "No policy." If the type of force is not used by your department mark "Force option not utilized by department." Please mark (## ) only one answer for each weapon category.
Less-lethal force authorized?
Yes Less-lethal force type No No policy
Force option not utilized by department
Soft empty-hand tactics/control
Hard empty-hand tactics/strikes/punches, etc.
OC spray, foam, or other chemical weapons
Baton (collapsible, straight, side handle, etc.)
CED in probe/dart mode
CED in drive stun mode

7
SCENARIO B
When told by the officer that he is under arrest, the suspect initially cooperates, but when the officer grasps his wrists to guide his hands behind his back, he tenses his arms and refuses to comply with the officer's orders to stop resisting. He continues to tense and pull against the officer for 15-20 seconds. Which of the following less-lethal options would be authorized under your department's policy or training standards as an initial response to the suspect's actions? Please mark either "Yes" or "No" for each force option. If neither policy nor training cover the use of force type in the given scenario, please mark "No policy." If the type of force is not used by your department mark "Force option not utilized by department." Please mark (##) only one answer for each weapon category.
Less-lethal force authorized?
Less-lethal force type Yes No No policy
Force option not utilized by department
Soft empty-hand tactics/control
Hard empty-hand tactics/strikes/punches, etc.
OC spray, foam, or other chemical weapons
Baton (collapsible, straight, side handle, etc.
CED in probe/dart mode
CED in drive stun mode
SCENARIO C
When told by the officer that he is under arrest, the suspect immediately turns and starts to run away. The officer begins to chase him and quickly closes the gap between himself and the suspect. When the officer and suspect are 12 feet apart, the suspect slows down and looks over his shoulder but does not stop running. Which of the following less-lethal options would be authorized under your department's policy or training standards as an initial response to the suspect's actions? Please mark either "Yes" or "No" for each force option. If neither policy nor training cover the use of force type in the given scenario, please mark "No policy." If the type of force is not used by your department mark "Force option not utilized by department." Please mark (#) only one answer for each weapon category.
Less-lethal force authorized?
Less-lethal force type Yes No No policy
Force option not utilized by department
Soft empty-hand tactics/control
Hard empty-hand tactics/strikes/punches, etc.
OC spray, foam, or other chemical weapons
Baton (collapsible, straight, side handle, etc.)
CED in probe/dart mode
CED in drive stun mode

8
SCENARIO D
When told by the officer that he is under arrest, the suspect states "I'm not going to jail" and faces off against the officer with his hands raised in a "boxer's stance." Which of the following less-lethal options would be authorized under your department's policy or training standards as an initial response to the suspect's actions? Please mark either "Yes" or "No" for each force option. If neither policy nor training cover the use of force type in the given scenario, please mark "No policy." If the type of force is not used by your department mark "Force option not utilized by department." Please mark (##) only one answer for each weapon category.
Less-lethal force authorized?
Less-lethal force type Yes No No policy
Force option not utilized by department
Soft empty-hand tactics/control
Hard empty-hand tactics/strikes/punches, etc.
OC spray, foam, or other chemical weapons
Baton (collapsible, straight, side handle, etc.)
CED in probe/dart mode
CED in drive stun mode
SCENARIO E When told by the officer that he is under arrest, the suspect swings at the officer's head with a closed fist. The officer dodges the blow and backs away, but the suspect continues to advance toward him with his fist raised. Which of the following less-lethal options would be authorized under your department's policy or training standards as an initial response to the suspect's actions? Please mark either "Yes" or "No" for each force option. If neither policy nor training cover the use of force type in the given scenario, please mark "No policy." If the type of force is not used by your department mark "Force option not utilized by department." Please mark (##) only one answer for each weapon category.
Less-lethal force authorized
Less-lethal force type Yes No No policy
Force option not utilized by department
Soft empty-hand tactics/control
Hard empty-hand tactics/strikes/punches, etc.
OC spray, foam, or other chemical weapons
Baton (collapsible, straight, side handle, etc.)
CED in probe/dart mode
CED in drive stun mode

9
8. Please indicate your department's policy regarding the submission of documentation of the various types of force listed below when there is no injury or claim of injury. That is, for each type, indicate whether the documentation of use of force is mandatory or not mandatory. If your department does not permit the use of the type of force listed, please mark "Use of force option not utilized by department." Please mark (##) only one answer per type of force.
Type of force used without injury Mandatory Not
mandatory
Use-of-force option not utilized by department
Bodily force
Chemical agent (e.g. OC, CS)
Baton strikes
CED presented, arced or laser pointed (without activation)
CED in drive stun mode
CED in probe mode
Other impact devices (i.e., projectile or non-projectile)
Neck restraint/unconsciousness-rendering hold
Release of canine
Vehicle ramming
Firearms discharge at vehicles that miss
Firearms discharge at vehicles that hit
Pointing, but not discharging, a firearm at individual
FORCE REPORTING/REVIEW

10
9. Has your department ever deployed any form of new generation CED (e.g., Taser M26, X26; Stinger) to any sworn personnel? (Please mark Yes even if CEDs were deployed but later suspended or discontinued.) $ No " PLEASE STOP – SURVEY COMPLETE. Thank you for your participation.
$ Yes " PLEASE CONTINUE TO NEXT QUESTION.
10. Indicate below the year that you (a) first placed a new generation CED on the street, (b) provided CEDs to patrol supervisors, (c) provided CEDs to some or all patrol officers/deputies, and (d) provided CEDs to one or more special units. Some dates may be the same. If you did not engage in the deployment activity, please mark "Not applicable."
Department activity related to CED deployment Year Not applicable
(a) First placed a CED on the street
NA
(b) Provided CEDs to patrol supervisors
NA
(c) Provided CEDs to some or all patrol officers/deputies
NA
(d) Provided CEDs to one or more special units
NA
11. Which of the following types of new generation CEDs are routinely deployed to the following categories of
personnel in your department? Please mark (##) all that apply for each row. If you do not have the group specified in the top row, please mark the row labeled "No such unit/group."
Type of CED Patrol officers/
deputies Patrol
supervisors Investigators
Special operations units
(e.g., SWAT)
School resource officers/ deputies
Other specialized units (e.g., gang unit)
Taser (e.g., M26, X26)
Other (please specify):
CEDs not routinely deployed to this group
No such unit/group
CONDUCTED ENERGY DEVICES (CED)

11
12. Which statement describes your department's policy governing CED deployment? Please mark (##) all that
apply. 
My department has a stand-alone CED policy
My department has CED-specific language in its general use of force policy
My department does not mention CEDs in policy
Other (please specify):
13. On which law enforcement agency, organization, training vendor, or professional association is your
department's policy governing CED deployment based on?
International Association of Chiefs of Police (IACP)
Police Executive Research Forum (PERF)
Police Foundation
Based on other law enforcement agency (specify): _____________________________________________
Other source (specify): _____________________________________________________________________
14. Has your agency temporally suspended or permanently discontinued the use of conducted energy devices (CEDs) for regular patrol officers / deputies? Please mark (#) only one.
No
Yes – temporarily suspended " Please indicate year: ________________
Yes – permanently discontinued " Please indicate year: ________________
If Yes, please explain the events or factor(s) that led to their suspension or discontinuation:

12
15. Has your CED policy and/or placement of the CED on your use of force continuum/model changed since January 2005?
No
Yes, the change expanded the circumstances in which officers/deputies could use the CED
Yes, the change reduced the circumstances in which officers/deputies could use the CED
Not applicable (for instance, the department does not reference CEDs in policy or on a use-of-force continuum/model; department did not have CEDs in January 2003)
16. Some department policies, procedures, and/or training prohibit in all circumstances the use of CEDs against certain populations or in certain circumstances. Other department policies, procedures, and/or training indicate in some manner that such use is generally not allowed, but is allowable if necessary and/or special circumstances exist. Still others do not set forth any specific restrictions on these populations/circumstances. For each population and/or circumstance listed below, indicate whether your department's policy, procedures and/or training on CED use in PROBE MODE (1) prohibit CED use in all circumstances, (2) restrict use except when necessary and/or when special circumstances exist, or (3) have no restriction set forth in policy, procedure and/or training. Please (##) mark one choice for each population/circumstance.
Population / Circumstance Prohibits CED
use in all circumstances
Restricts CED use except when
necessary &/or special
circumstances
No restriction set forth in
policy, procedure,
training Driver of moving vehicle
Person in elevated area (e.g., on bridge, in tree)
Youth/size
Youth/age
Elderly
Handcuffed suspect
Person around flammable substances
Person in/around water
Subject threatening deadly force
Person fleeing on foot
Known or apparent cardiac condition
Apparently pregnant woman
Apparently physically disabled person
Population/circumstance
Person who seems in Excited Delirium
13
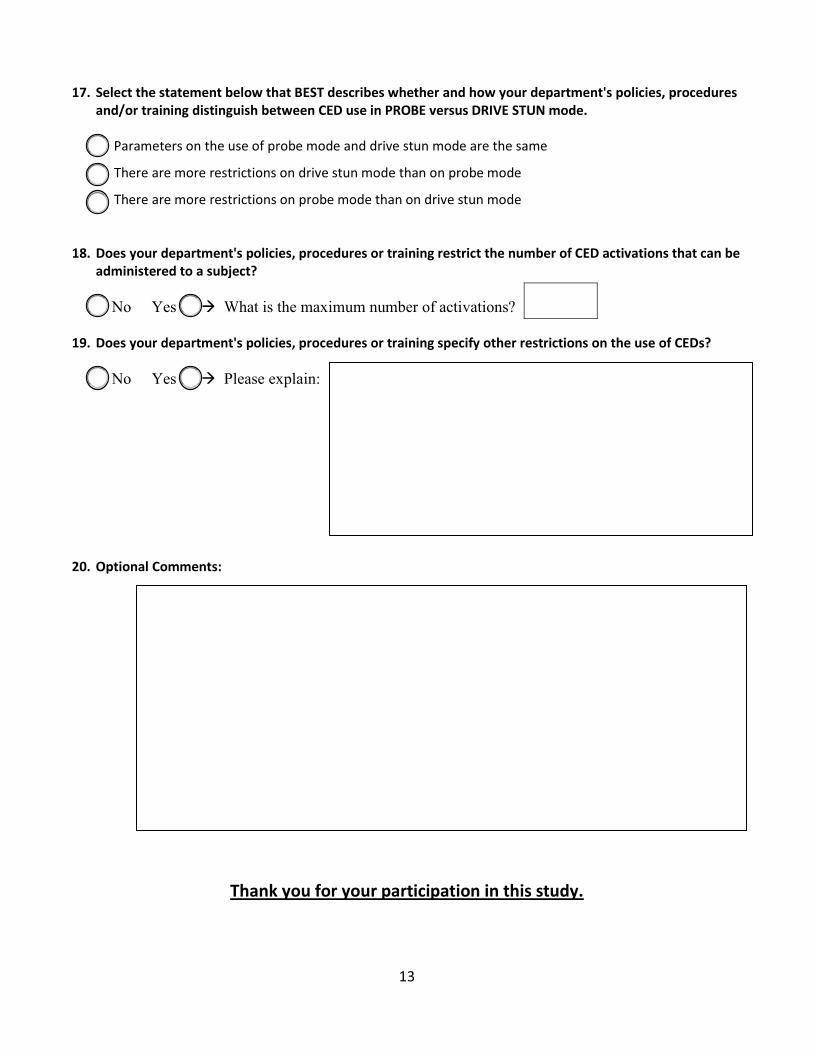
17. Select the statement below that BEST describes whether and how your department's policies, procedures and/or training distinguish between CED use in PROBE versus DRIVE STUN mode. Parameters on the use of probe mode and drive stun mode are the same
There are more restrictions on drive stun mode than on probe mode
There are more restrictions on probe mode than on drive stun mode
18. Does your department's policies, procedures or training restrict the number of CED activations that can be administered to a subject?
No Yes " What is the maximum number of activations?
19. Does your department's policies, procedures or training specify other restrictions on the use of CEDs?
No Yes " Please explain:
20. Optional Comments:
Thank you for your participation in this study.