Embed Size (px)
Citation preview
South Carolina House of Representatives Higher Education and Technical Colleges
Subcommittee Briefing
Dr. Daniel F. Mahony, President, Winthrop University
January 10, 2018
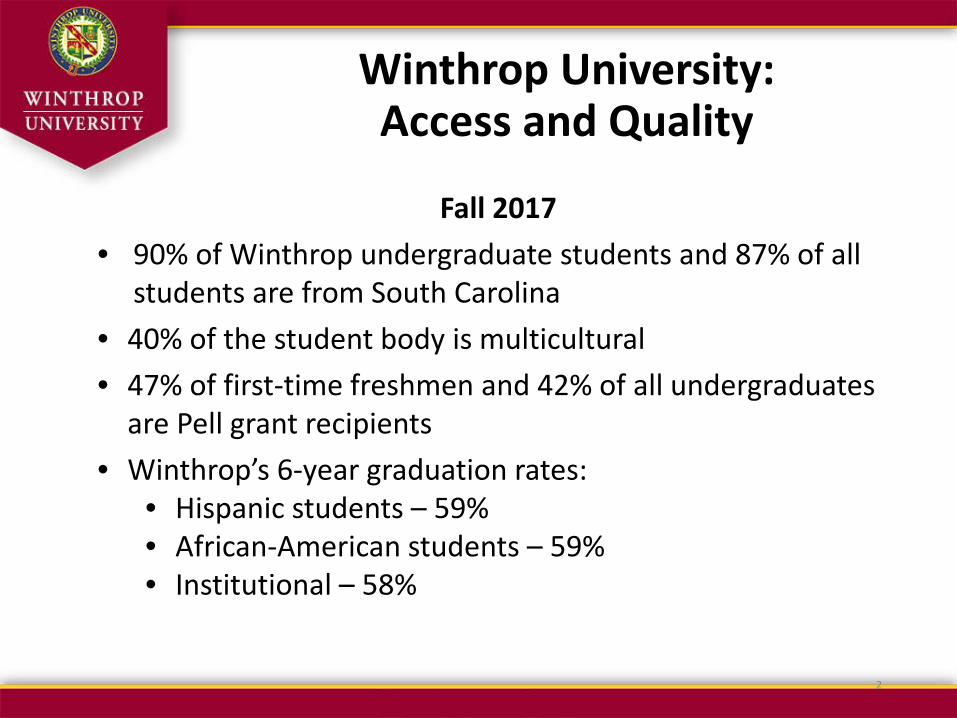
Winthrop University: Access and Quality
Fall 2017 • 90% of Winthrop undergraduate students and 87% of all
students are from South Carolina • 40% of the student body is multicultural • 47% of first-time freshmen and 42% of all undergraduates
are Pell grant recipients • Winthrop’s 6-year graduation rates:
• Hispanic students – 59% • African-American students – 59% • Institutional – 58%
2

Winthrop University: Accountability Report Highlights
• The Southern Association of Colleges and Schools Commission on Colleges (SACSCOC) approved Winthrop’s Fifth-Year Interim Report and requested no additional reports or information.
• Winthrop ranked 8th among Southern public universities in U.S. News & World Report’s edition of “America’s Best Colleges.”
• The Education Trust in its recent national report, “A Look at Black Student Success” listed Winthrop University as #2 in the country for graduating Black students.
• In 2016-17, Winthrop’s student-athletes, representing 18 sports teams, raised their average cumulative GPA to a record-high 3.2 on a 4.0 point scale.
3
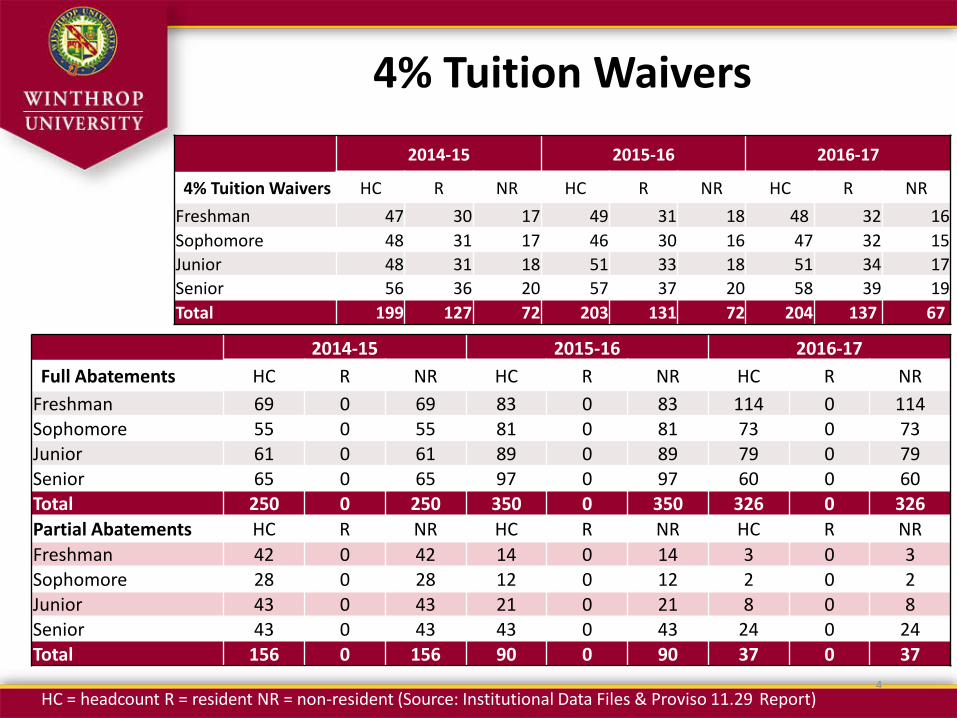
4% Tuition Waivers 2014-15 2015-16 2016-17
4% Tuition Waivers HC R NR HC R NR HC R NR Freshman 47 30 17 49 31 18 48 32 16 Sophomore 48 31 17 46 30 16 47 32 15 Junior 48 31 18 51 33 18 51 34 17 Senior 56 36 20 57 37 20 58 39 19 Total 199 127 72 203 131 72 204 137 67
HC = headcount R = resident NR = non-resident (Source: Institutional Data Files & Proviso 11.29 Report)
2014-15 2015-16 2016-17 Full Abatements HC R NR HC R NR HC R NR
Freshman 69 0 69 83 0 83 114 0 114 Sophomore 55 0 55 81 0 81 73 0 73 Junior 61 0 61 89 0 89 79 0 79 Senior 65 0 65 97 0 97 60 0 60 Total 250 0 250 350 0 350 326 0 326 Partial Abatements HC R NR HC R NR HC R NR Freshman 42 0 42 14 0 14 3 0 3 Sophomore 28 0 28 12 0 12 2 0 2 Junior 43 0 43 21 0 21 8 0 8 Senior 43 0 43 43 0 43 24 0 24 Total 156 0 156 90 0 90 37 0 37
4

Merit Award Abatements
Policies pursuant to 59-112-70 (A) • In accordance with Section 59-112-70, the Board of Trustees of
Winthrop University has authorized the abatement of any part or all of the out-of-state differential rates for out-of-state students who are recipients of scholarship aid.
• 363 undergraduates received abatements for Academic Year 2016-17.
Policies pursuant to 59-112-70 (C) • Winthrop University’s Board of Trustees has no formally
approved agreements with international institutions pursuant to Section C of 59-112-70.
5

Appropriations History
$14,324,851 $14,889,562 $15,873,982 $991,655 $2,000,000 $4,500,000
$86,293,320 $89,293,320 $86,293,320
$51,197,500 $51,197,500 $51,197,500
$-
$20,000,000
$40,000,000
$60,000,000
$80,000,000
$100,000,000
$120,000,000
$140,000,000
$160,000,000
$180,000,000
FY 2014-2015 FY 2015-2016 FY 2016-2017
Recurring Non-Recurring/Capital Other Funds Federal
6

FY18 Projected Current Revenue
State Appropriations Recurring, $16,365,381 ,
11.76%
Student Tuition and Fees, $77,240,300 ,
55.49%
Federal Operating Grants, $2,150,000 ,
1.54%
State and Other Operating Grants,
$14,923,000 , 10.72% Auxiliary Enterprises, $18,343,000 , 13.18%
Other, $10,181,000 , 7.31%
Total: $139,202,681
7

FY18 Projected Current Expenses
Instruction and Instructional Support,
[VALUE], [PERCENTAGE]
Research, $1,757,083 , 1.26%
Public Service, $14,800,000 , 10.64%
Student Services, $13,255,000 , 9.53%
Institutional Support, $11,357,647 , 8.16%
Physical Plant, $12,580,000 , 9.04%
Auxiliary Enterprise (including debt),
$17,720,550 , 12.74%
Debt Service (institutional and
athletic), $5,176,100 , 3.72%
Total: $139,130,751
8

Carry Forward
FY15-16 FY16-17 FY 17-18
Recurring $0 $0 $0
Non-Recurring $0 $0 $0
Other $16,443,222* $18,751,058* $17,000,000*
Federal $0 $0 $0
Carry Forward of Other Funds consists of auxiliary funds and institutional capital project funds: •Since auxiliary services must be self-supporting, funds are maintained to cover equipment and building maintenance, as well as emergency equipment or facility repairs. •Institutional capital project funds are maintained to cover small facility maintenance and refurbishment projects. *Without regard to the impact of GASB68 (“Accounting and Financial Reporting for Pensions”).
9

Winthrop currently has two active PIP projects and one non-active in the process of closure:
• Withers Roof Replacement, project number 9577 funded by non-recurring. Current balance is $193,215.
• 2015-16 Maintenance Needs, project number 9578 funded by Lottery and Institutional Match funds. Project in process of closure. Current balance is $-0-.
• Music Conservatory / Byrnes Auditorium, project number 9579 funded by non-recurring. Current balance is $4,444,347.
10 Source: SPIRS Report
Capital Projects

11
Winthrop addresses maintenance needs by the following methods: • Maintains a rolling project list which includes facility maintenance
and repair needs. • Maintains a project team with representatives from the campus
constituencies that meets monthly. • Project team creates a list which includes items such as roof
repairs and replacement, fire alarm replacements, painting, electrical and small facility changes to accommodate programs.
• These projects are given budget estimates and are performed as time and funding permit.
In FY 2016-17, Winthrop spent $9,223,245 on maintenance needs. Winthrop has ongoing projects for an additional $10,065,000.
Maintenance

FY19 Revenue Budget With anticipated funding
[CATEGORY NAME] (includes $1.6M for
Operational Support and $.75M for Equipment for
STEM Initiatives), [VALUE], [PERCENTAGE]
[CATEGORY NAME] (includes $10.8M for
Strategic Risk Management, $4M for Instructional Scientific
Equipment, $7M for Dacus Library Renovations),
[VALUE], [PERCENTAGE]
Student Tuition and Fees, $78,398,905 , 47.79%
Federal Operating Grants, $2,350,000 , 1.43%
State and Other Operating Grants, $14,900,000 ,
9.08%
Auxiliary Enterprises, $18,618,145 , 11.35%
Other, $9,250,000 , 5.64%
Total: $164,032,431
Note: Revenue Budget FY 18-19 does not include $32M capital request for the science complex renovation or the $10M capital request for an interdisciplinary arts technology facility.
12

FY19 Expense Budget With anticipated funding
Instruction and Instructional
Support,(includes requested funds:
$2.35M in recurring and $4M in non-recurring) $69,062,000, 42.31%
[CATEGORY NAME], $2,010,000, 1.23%
[CATEGORY NAME], [VALUE], 9.13%
[CATEGORY NAME], [VALUE], 8.16%
[CATEGORY NAME], [VALUE], 7.03%
[CATEGORY NAME], (includes $17,800,000 in requested non-recurring funds) [VALUE], 18.03%
[CATEGORY NAME], [VALUE], 10.93% [CATEGORY NAME],
[VALUE], 3.18%
Total: $163,251,494
Note: Expense Budget FY 18-19 does not include $32M capital request for the science complex renovation or the $10M capital request for an interdisciplinary arts technology facility.
13

Recurring Requests
Request Amount Requested Description of Request
Operational Support of STEAM Disciplines
$1.6 Million • Support increasing online program options to students and promote on-time or early degree completion by both undergraduate and graduate students.
• Hire a full-time Information Security Officer.
• Fund recurring software for GIS (Geographic Information Systems) technology and other systems.
Ongoing STEAM Equipment Upgrades
$750,000 • Create recurring funding to support annual updates to equipment and software in expanding STEAM fields.
14

Non-Recurring Requests
Request Amount Requested
Description of Request
Instructional Scientific Equipment Replacement
$4 Million • Replace equipment and associated software in biology, chemistry, human nutrition, and exercise science.
Strategic Risk Management
$10.8 Million • Electric distribution modernization. ($2 M) • Steam line renovation and enhancements. ($2 M) • Fire alarm upgrades and enhancements. ($1.1 M) • Improve Wi-Fi coverage in our classroom facilities.
($1.3 M) • Building envelope and building infrastructure
improvements. ($4.4 M)
15

Non-Recurring Capital Requests
Request Amount Requested
Description of Request
Dacus Library Renovation
$7 Million • Instead of replacing Dacus Library (at a cost of $55 million), respond to increased use and expanded services by improving the building’s infrastructure.
Interdisciplinary Arts Technology Facility
$10 Million • Build an interdisciplinary technology facility (approximately 17,000 sq. ft.) to support student experiential learning for career preparation in the expanding music, performance, and software fields.
Science Complex Renovation and Addition
$32 Million • Renovate and expand the Science Complex facilities (Dalton Hall and Sims Hall) by adding teaching labs, classrooms, faculty offices, and research lab space and by refurbishing four teaching labs.
16

Other Funds Authorization
Request Amount Requested Description of Request
Support of Center for Educator Recruitment, Retention, and Advancement (CERRA)
$9 Million • Permits additional funding allocated from the General Assembly to the Center for Educator Recruitment, Retention, and Advancement (CERRA)
17

Winthrop University had no requests to increase federal funds authorization for FY 2018-19.
18
Federal Funds Request

FTE Request
Proviso 11.14. (CHE: Other Funded FTE Revenue) When institutions of higher learning request additional other funded full-time equivalent positions, the Executive Budget Office shall inform the Commission on Higher Education of its decision regarding the request and whether or not sufficient revenues exist to fund the salary and fringe benefits for the positions. Winthrop University is requesting no other-funded FTE positions.
19

Cost Savings (3% Target)
• 3% cost saving total: $490,961 • Reduction targets: One-half through across-the-board administrative and
operational budget reductions One-half through a reduction in interim faculty
• Reductions likely will negatively impact class size, maintenance, and student support.
NOTE: In FY2015, Winthrop implemented a 10% across-the-board cut in operational budgets, saving approximately $1.1M annually, which is used to keep tuition costs low.
20

General Provisos Winthrop Requests to “Keep”
Winthrop has submitted no proviso requests.
117.7 Fee Increases
117.8 State Institutions – Revenues & Income
117.11 Fixed Student Fees
117.14 FTE Management
117.15 Allowance for Residences & Compensation Restrictions
117.16 Universities & Colleges – Allowance for Presidents
117.20 Travel – Subsistence Expenses & Mileage
117.29 Base Budget Analysis
117.45 Parking Fees
117.47 Insurance Claims
117.59 Purchase Card Incentive Rebates
117.71 Reduction in Force/Agency Head Furlough
117.72 Printed Report Requirements
117.83 Bank Account Transparency & Accountability
117.113 Information Technology & Information Security Plans 117.121 Statewide Strategic Information Technology Plan Implementation
21

Appendix
22

Student Enrollment – Fall 2017
Total Enrollment • 6,073 Headcount (6,109 in Fall 2016) • 5,312* Full-time Equivalent Enrollment (5,386 in
Fall 2016)
Undergraduate • 5,014 headcount (5,091 in Fall 2016) • 42% Pell Grant Recipients • 41% Minority/International
New Freshmen • 1,050 (1,072 in Fall 2016) • 47% Pell Grant Recipients • 45% Minority/International
23
*Estimated. Official FTE enrollment has not yet been published by CHE.

Applied, Admitted, Enrolled
4,546 4,876 4,940
4,573
[VALUE] 71% acceptance
[VALUE] 67% acceptance
[VALUE] 69% acceptance
[VALUE] 73% acceptance
[VALUE] 31% yield
[VALUE] 33% yield
[VALUE] 32% yield
[VALUE] 31% yield
0
1,000
2,000
3,000
4,000
5,000
6,000
2014 2015 2016 2017
Applied Admitted Enrolled
Source: Admissions Standards for First-Time Entering Freshmen reported to CHE annually. 24

Minority Enrollment Fall 2017
White; 3660; 60%
Black or African American; 1678; 28%
Hispanic; 279; 5%
Two or more races; 214; 4%
International /Non Resident Alien; 135; 2%
Asian; 83; 1%
American Indian/Alaskan; 17; 0%
Unknown; 4; 0%
Native Hawaiian/Pacific Islander; 3; 0%
25

Enrollment by College Fall – 2017
2298
1044 1670
630 431
6073
2688
805 1029 572 218
5312
0
1000
2000
3000
4000
5000
6000
7000
College of Arts &Sciences
College ofBusiness
Administration
College ofEducation
College of Visual& Performing
Arts
University College Total
Num
ber o
f Stu
dent
s
Headcount FTE
Source: Headcount data based on fall data files submitted to Commission on Higher Education. Headcount data reflect enrollment based on student major/college. FTE enrollment calculated by dividing total credit hours produced in a discipline/college by 15 for undergraduate and 12 for graduate students. FTE is estimated. Official FTE enrollment has not yet been published by CHE.
26

In-State vs. Out-of- State Fall 2017 Enrollment
[CATEGORY NAME] HC: [VALUE] or [PERCENTAGE]
FTE: 4633 or 87.0%
[CATEGORY NAME] HC: [VALUE] or [PERCENTAGE]
FTE: 693 or 13%
Note: The method for calculating FTE is the method used by the Common Data Set (and others) -- full-time plus one-third of part-time headcount. 27

Graduation Data
58.2%
40.4%
18.2%
8.1%
1.5%
19.3%
7.0%
15.6%
0% 10% 20% 30% 40% 50% 60% 70% 80% 90%
6 Years Later
4 Years Later
Graduated from Winthrop Graduated from Another Institution
Still Enrolled at Winthrop Still Enrolled at Another Institution
More than 38,000 alumni live in South Carolina 28

Tuition and Fees per Semester Undergraduate
$6,715 $6,906 $7,078 $7,255 $7,435
$13,000 $13,369 $13,702 $14,045 $14,393
$0
$2,000
$4,000
$6,000
$8,000
$10,000
$12,000
$14,000
$16,000
FY 2014 FY 2015 FY 2016 FY 2017 FY2018
Resident Non-Resident
FY15 - FY16 Increase
2.49%
FY16 - FY17 Increase
2.5%
FY17 - FY18 Increase
2.48%
FY14 - FY15 Increase
2.84%
FY13 - FY14 Increase 3.1% Resident
6.23% Non-resident
29

2017-18 Tuition & Fee Schedule
Full-time Undergraduate Fees per Semester Resident Non-Resident
E & G Operating $5,897 $12,269
Information Technology $155 $155
Student Activity $790 $790
Debt Service Institutional Bonds (tuition) $571 $1,157
Debt Service Revenue Bonds (athletic) $22 $22
Total $7,435 $14,393
% Increase from Previous Year 2.48 2.48
30

Scholarships and Grants 2016-17 Students Dollars
FEDERAL PELL Grant 2,158 $9,239,153
SEOG Grant 346 $205,290
TEACH 98 $332,892
Total 2,602 $9,777,335
STATE LIFE Scholarship 1,771 $8,518,889
Life Scholarship Enhancement 153 $370,646
Palmetto Fellows Scholarship 363 $2,633,350
Palmetto Fellows Enhancement Scholarship 73 $183,525
HOPE Scholarship 321 $835,800
SC Need Based Grant 929 $1,726,980
SC Need Based Grant - CTP Students 11 $85,000
National Guard Grant 24 $102,375
Teaching Fellows (loan forgive w/ work in-state) 102 $565,250
Total 3,747 $15,021,815
INSTITUTIONAL SCHOLARSHIPS & GRANTS Merit 1,842 $9,037,046
Athletic & Talent 380 $2,975,458
Named Restricted 639 $743,805
Public Service 99 $1,424,005
Total 2,960 $14,180,314
2016-17
Students Dollars
FEDERAL PELL Grant 2,158 $9,239,153 SEOG Grant 346 $205,290 TEACH 98 $332,892
Total 2,602 $9,777,335
STATE LIFE Scholarship 1,771 $8,518,889 Life Scholarship Enhancement 153 $370,646 Palmetto Fellows Scholarship 363 $2,633,350 Palmetto Fellows Enhancement Scholarship 73 $183,525 HOPE Scholarship 321 $835,800 SC Need Based Grant 929 $1,726,980 SC Need Based Grant - CTP Students 11 $85,000 National Guard Grant 24 $102,375 Teaching Fellows (loan forgive w/ work in-state) 102 $565,250
Total 3,747 $15,021,815
INSTITUTIONAL SCHOLARSHIPS & GRANTS Merit 1,842 $9,037,046 Athletic & Talent 380 $2,975,458 Named Restricted 639 $743,805 Public Service 99 $1,424,005
Total 2,960 $14,180,314 31
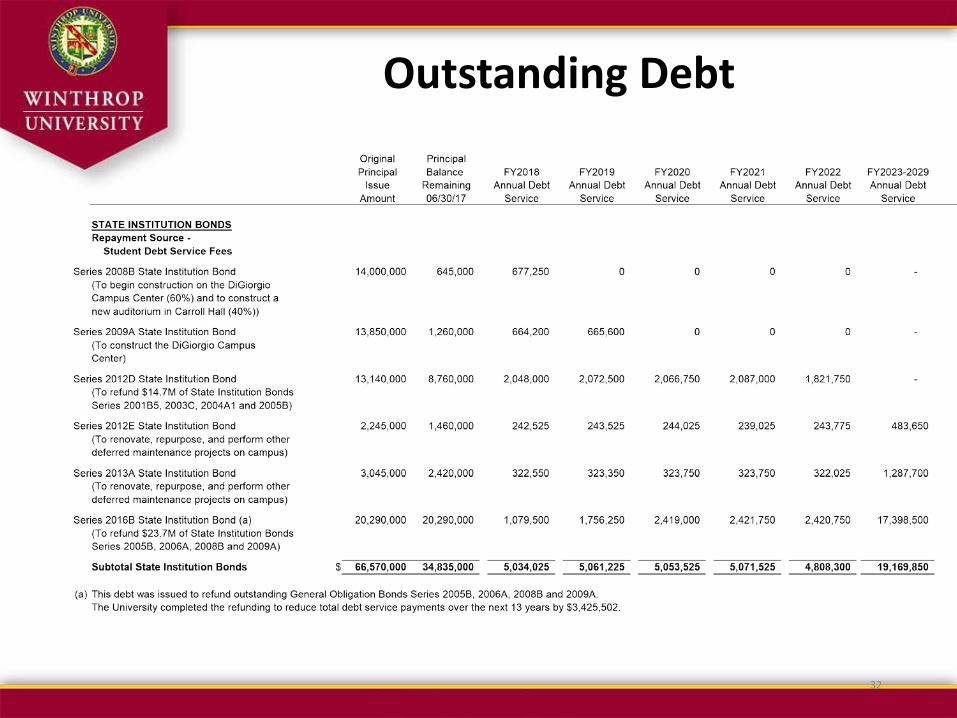
Outstanding Debt
32

Outstanding Debt
33
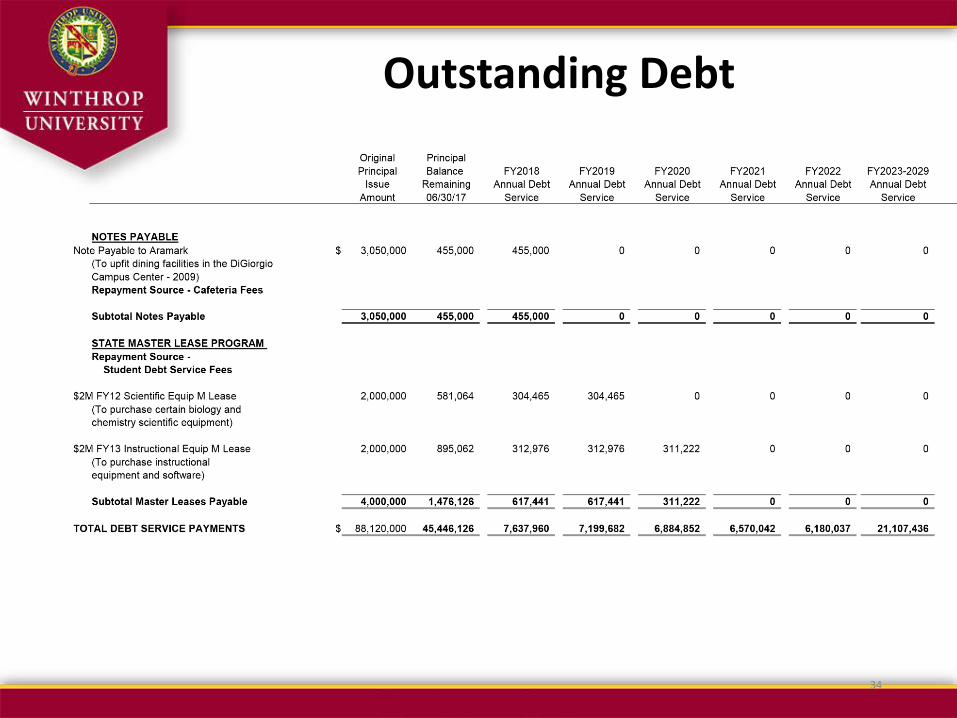
Outstanding Debt
34
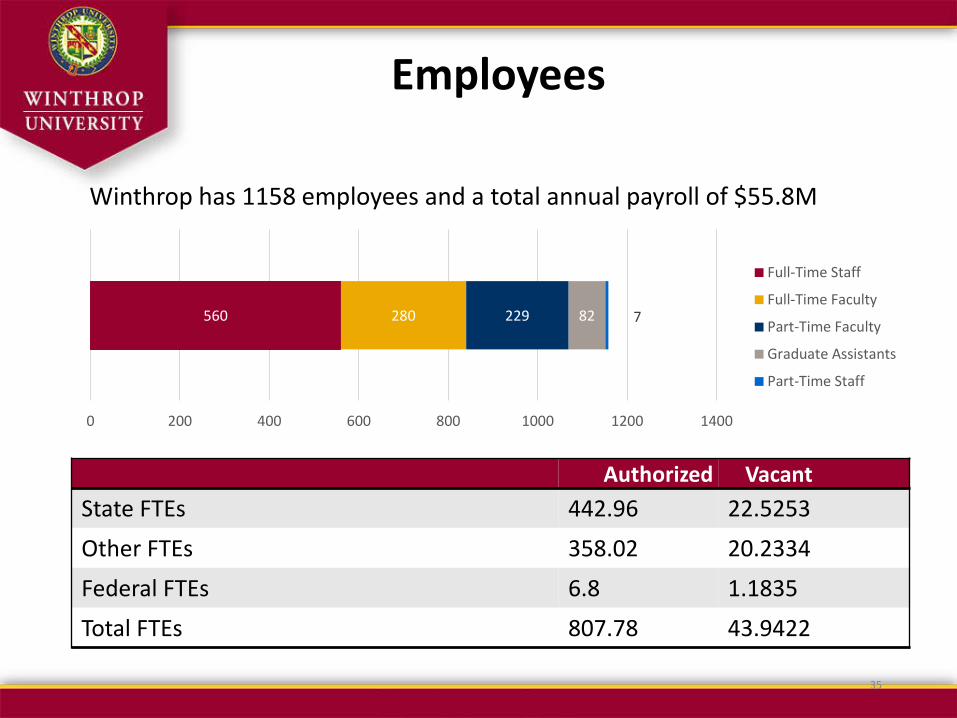
Employees
Authorized Vacant State FTEs 442.96 22.5253
Other FTEs 358.02 20.2334
Federal FTEs 6.8 1.1835
Total FTEs 807.78 43.9422
Winthrop has 1158 employees and a total annual payroll of $55.8M
560 280 229 82 7
0 200 400 600 800 1000 1200 1400
Full-Time Staff
Full-Time Faculty
Part-Time Faculty
Graduate Assistants
Part-Time Staff
35
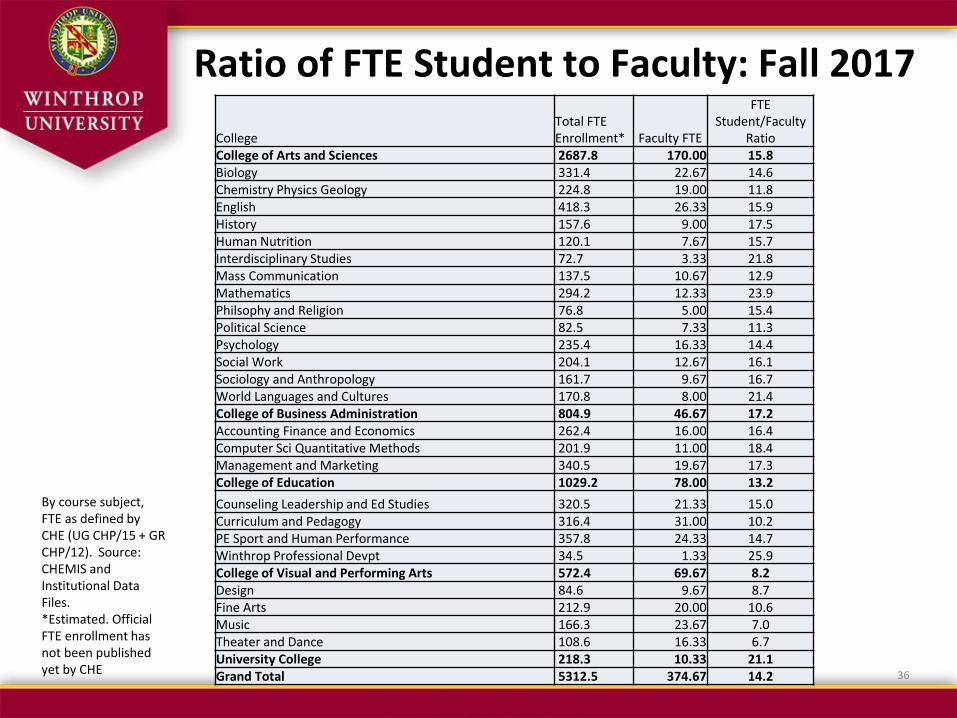
Ratio of FTE Student to Faculty: Fall 2017
36
College Total FTE Enrollment* Faculty FTE
FTE Student/Faculty
Ratio College of Arts and Sciences 2687.8 170.00 15.8 Biology 331.4 22.67 14.6 Chemistry Physics Geology 224.8 19.00 11.8 English 418.3 26.33 15.9 History 157.6 9.00 17.5 Human Nutrition 120.1 7.67 15.7 Interdisciplinary Studies 72.7 3.33 21.8 Mass Communication 137.5 10.67 12.9 Mathematics 294.2 12.33 23.9 Philsophy and Religion 76.8 5.00 15.4 Political Science 82.5 7.33 11.3 Psychology 235.4 16.33 14.4 Social Work 204.1 12.67 16.1 Sociology and Anthropology 161.7 9.67 16.7 World Languages and Cultures 170.8 8.00 21.4 College of Business Administration 804.9 46.67 17.2 Accounting Finance and Economics 262.4 16.00 16.4 Computer Sci Quantitative Methods 201.9 11.00 18.4 Management and Marketing 340.5 19.67 17.3 College of Education 1029.2 78.00 13.2 Counseling Leadership and Ed Studies 320.5 21.33 15.0 Curriculum and Pedagogy 316.4 31.00 10.2 PE Sport and Human Performance 357.8 24.33 14.7 Winthrop Professional Devpt 34.5 1.33 25.9 College of Visual and Performing Arts 572.4 69.67 8.2 Design 84.6 9.67 8.7 Fine Arts 212.9 20.00 10.6 Music 166.3 23.67 7.0 Theater and Dance 108.6 16.33 6.7 University College 218.3 10.33 21.1 Grand Total 5312.5 374.67 14.2
By course subject, FTE as defined by CHE (UG CHP/15 + GR CHP/12). Source: CHEMIS and Institutional Data Files. *Estimated. Official FTE enrollment has not been published yet by CHE

Minority Representation
Administration Headcount by Race/Ethnicity
American Indian/Alaskan, 1
International, 1
Hispanic, 2
Black or African American, 8
White, 57
Staff Headcount by Race/Ethnicity
International, 1
Asian, 2
American Indian/Alaskan, 3
Two or More, 3
Native Hawaiian/Pacific Islander, 3
Hispanic, 11
Black or African American, 125
White, 346
Faculty Headcount by Race/Ethnicity
American Indian/Alaskan, 1
Native Hawaiian/Pacific Islander, 1
International, 4
Hispanic, 6
Asian, 13
Black or African American, 22
White, 23537

The Winthrop Plan: Diversity Objectives
38
1.4 Refine and implement a long-term student recruitment plan with an emphasis on expanding our reach domestically, both inside and outside South Carolina, and internationally while increasing diversity.
3.1 Develop innovative approaches for increasing the diversity of the candidate pools for all faculty and staff positions and increase our success for attracting, hiring, and retaining diverse employees.

The Winthrop Plan: Diversity Initiatives
39
• Appointed a Chief Diversity Officer, Ms. Zan C. Jones • Appointed an Assistant Dean for Student Diversity and
Inclusive Excellence, Ms. Kinyata A. Brown • Required all members serving on executive level searches
to participate in implicit bias training • The Chief Diversity Officer meets with executive search
firms to discuss strategies for attracting diverse applicants • Resources, such as a list of minority-serving institutions
that offer doctoral programs, are provided to faculty search chairs
• Membership with the Higher Education Recruitment Consortium (HERC)

The Winthrop Plan: Recent African American Hires
40
• Associate Dean, College of Visual and Performing Arts • Executive Director of Sponsored Programs and Research • Director of Technology Services • Professor of Political Science • Assistant Professor of Exercise Science • Assistant Professor of Business Administration • Director of Residence Life • Admissions Counselor (3 hired) • Head Women’s Basketball Coach • Assistant Women’s Basketball Coach (2 hired)
Thank you
41