Embed Size (px)
Citation preview

SOUTH AUSTRALIAN PRODUCE MARKET LIMITED ANNUAL REPORT 2017

2
Contents
2017 Highlights & Achievements 3
Chairman’s Report 4
CEO’s Report 6
Directors’ Report 17
Auditor’s Independence Declaration 24
Financial Statements
Statement of Profit or Loss and Other Comprehensive Income 26
Statement of Financial Position 27
Statement of Changes In Equity 28
Statement of Cash Flows 30
Notes to the Financial Statements 31
Directors’ Declaration 53
Independent Auditor’s Report 54
Organisational Structure 56
Corporate Directory inside front cover

3
2017 Highlights & Achievements
Distributionper share
(fully franked)
Gearing Ratio
Total Revenue
Total Assets
70 cents
32 %30% Gearing Ratio 2016
$124.5M3.5% increase on 2016
$12.400.8% increase on 2016
$15.6M3% increase on 2016
Net AssetBacking
SO
UT
H A
US
TR
AL
IAN
PR
OD
UC
E M
AR
KE
T L
IMIT
ED
AN
NU
AL
RE
PO
RT
20
17
4
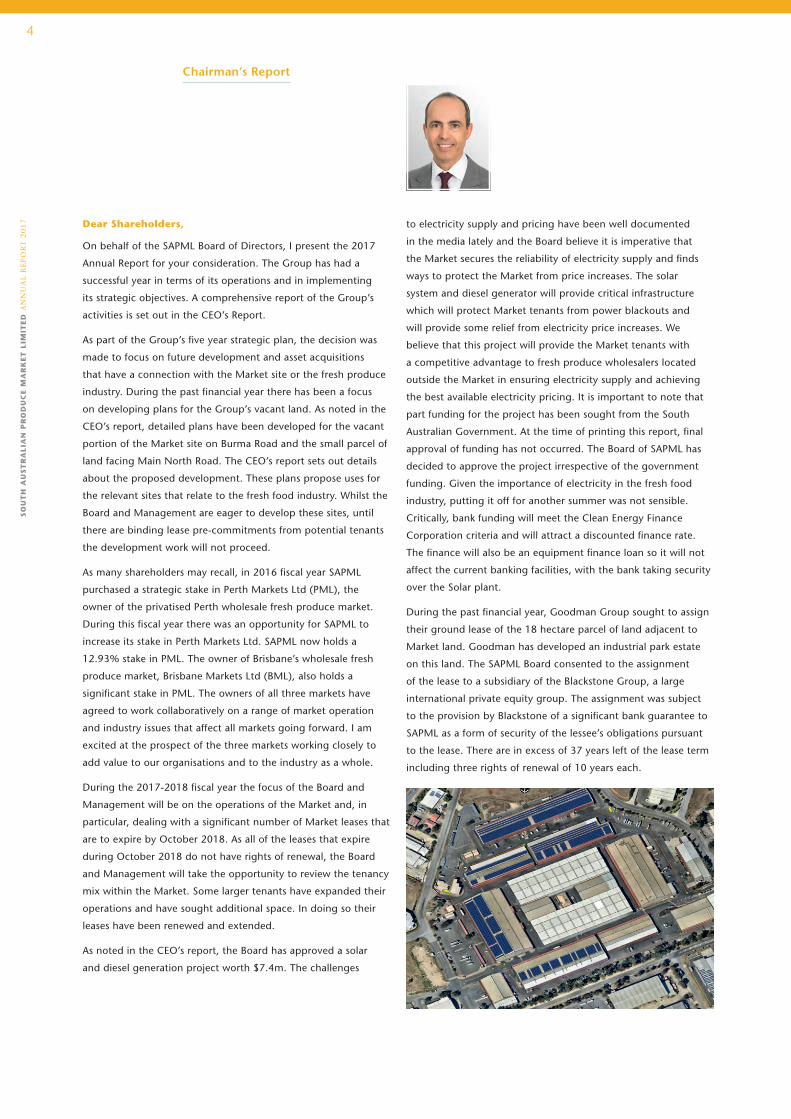
Dear Shareholders,
On behalf of the SAPML Board of Directors, I present the 2017
Annual Report for your consideration. The Group has had a
successful year in terms of its operations and in implementing
its strategic objectives. A comprehensive report of the Group’s
activities is set out in the CEO’s Report.
As part of the Group’s five year strategic plan, the decision was
made to focus on future development and asset acquisitions
that have a connection with the Market site or the fresh produce
industry. During the past financial year there has been a focus
on developing plans for the Group’s vacant land. As noted in the
CEO’s report, detailed plans have been developed for the vacant
portion of the Market site on Burma Road and the small parcel of
land facing Main North Road. The CEO’s report sets out details
about the proposed development. These plans propose uses for
the relevant sites that relate to the fresh food industry. Whilst the
Board and Management are eager to develop these sites, until
there are binding lease pre-commitments from potential tenants
the development work will not proceed.
As many shareholders may recall, in 2016 fiscal year SAPML
purchased a strategic stake in Perth Markets Ltd (PML), the
owner of the privatised Perth wholesale fresh produce market.
During this fiscal year there was an opportunity for SAPML to
increase its stake in Perth Markets Ltd. SAPML now holds a
12.93% stake in PML. The owner of Brisbane’s wholesale fresh
produce market, Brisbane Markets Ltd (BML), also holds a
significant stake in PML. The owners of all three markets have
agreed to work collaboratively on a range of market operation
and industry issues that affect all markets going forward. I am
excited at the prospect of the three markets working closely to
add value to our organisations and to the industry as a whole.
During the 2017-2018 fiscal year the focus of the Board and
Management will be on the operations of the Market and, in
particular, dealing with a significant number of Market leases that
are to expire by October 2018. As all of the leases that expire
during October 2018 do not have rights of renewal, the Board
and Management will take the opportunity to review the tenancy
mix within the Market. Some larger tenants have expanded their
operations and have sought additional space. In doing so their
leases have been renewed and extended.
As noted in the CEO’s report, the Board has approved a solar
and diesel generation project worth $7.4m. The challenges
to electricity supply and pricing have been well documented
in the media lately and the Board believe it is imperative that
the Market secures the reliability of electricity supply and finds
ways to protect the Market from price increases. The solar
system and diesel generator will provide critical infrastructure
which will protect Market tenants from power blackouts and
will provide some relief from electricity price increases. We
believe that this project will provide the Market tenants with
a competitive advantage to fresh produce wholesalers located
outside the Market in ensuring electricity supply and achieving
the best available electricity pricing. It is important to note that
part funding for the project has been sought from the South
Australian Government. At the time of printing this report, final
approval of funding has not occurred. The Board of SAPML has
decided to approve the project irrespective of the government
funding. Given the importance of electricity in the fresh food
industry, putting it off for another summer was not sensible.
Critically, bank funding will meet the Clean Energy Finance
Corporation criteria and will attract a discounted finance rate.
The finance will also be an equipment finance loan so it will not
affect the current banking facilities, with the bank taking security
over the Solar plant.
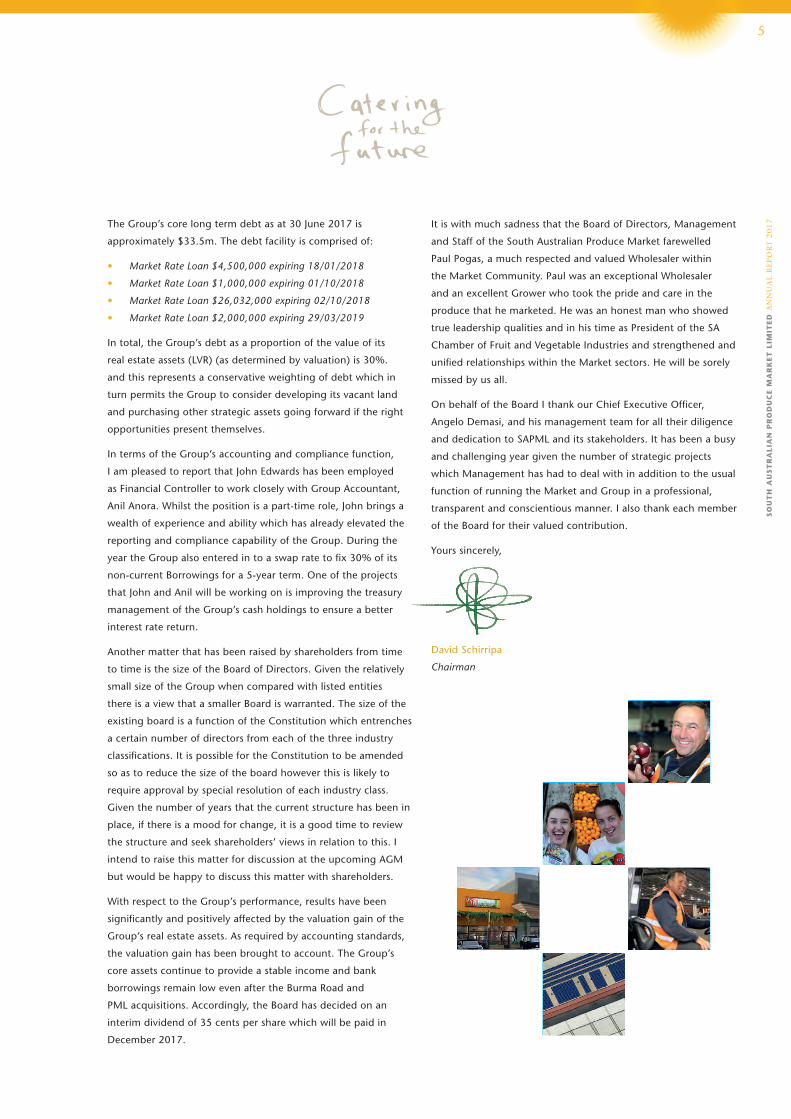
During the past financial year, Goodman Group sought to assign
their ground lease of the 18 hectare parcel of land adjacent to
Market land. Goodman has developed an industrial park estate
on this land. The SAPML Board consented to the assignment
of the lease to a subsidiary of the Blackstone Group, a large
international private equity group. The assignment was subject
to the provision by Blackstone of a significant bank guarantee to
SAPML as a form of security of the lessee’s obligations pursuant
to the lease. There are in excess of 37 years left of the lease term
including three rights of renewal of 10 years each.
Chairman’s Report
SO
UT
H A
US
TR
AL
IAN
PR
OD
UC
E M
AR
KE
T L
IMIT
ED
AN
NU
AL
RE
PO
RT
20
17
5
The Group’s core long term debt as at 30 June 2017 is
approximately $33.5m. The debt facility is comprised of:
• Market Rate Loan $4,500,000 expiring 18/01/2018
• Market Rate Loan $1,000,000 expiring 01/10/2018
• Market Rate Loan $26,032,000 expiring 02/10/2018
• Market Rate Loan $2,000,000 expiring 29/03/2019
In total, the Group’s debt as a proportion of the value of its
real estate assets (LVR) (as determined by valuation) is 30%.
and this represents a conservative weighting of debt which in
turn permits the Group to consider developing its vacant land
and purchasing other strategic assets going forward if the right
opportunities present themselves.
In terms of the Group’s accounting and compliance function,
I am pleased to report that John Edwards has been employed
as Financial Controller to work closely with Group Accountant,
Anil Anora. Whilst the position is a part-time role, John brings a
wealth of experience and ability which has already elevated the
reporting and compliance capability of the Group. During the
year the Group also entered in to a swap rate to fix 30% of its
non-current Borrowings for a 5-year term. One of the projects
that John and Anil will be working on is improving the treasury
management of the Group’s cash holdings to ensure a better
interest rate return.
Another matter that has been raised by shareholders from time
to time is the size of the Board of Directors. Given the relatively
small size of the Group when compared with listed entities
there is a view that a smaller Board is warranted. The size of the
existing board is a function of the Constitution which entrenches
a certain number of directors from each of the three industry
classifications. It is possible for the Constitution to be amended
so as to reduce the size of the board however this is likely to
require approval by special resolution of each industry class.
Given the number of years that the current structure has been in
place, if there is a mood for change, it is a good time to review
the structure and seek shareholders’ views in relation to this. I
intend to raise this matter for discussion at the upcoming AGM
but would be happy to discuss this matter with shareholders.
With respect to the Group’s performance, results have been
significantly and positively affected by the valuation gain of the
Group’s real estate assets. As required by accounting standards,
the valuation gain has been brought to account. The Group’s
core assets continue to provide a stable income and bank
borrowings remain low even after the Burma Road and
PML acquisitions. Accordingly, the Board has decided on an
interim dividend of 35 cents per share which will be paid in
December 2017.
It is with much sadness that the Board of Directors, Management
and Staff of the South Australian Produce Market farewelled
Paul Pogas, a much respected and valued Wholesaler within
the Market Community. Paul was an exceptional Wholesaler
and an excellent Grower who took the pride and care in the
produce that he marketed. He was an honest man who showed
true leadership qualities and in his time as President of the SA
Chamber of Fruit and Vegetable Industries and strengthened and
unified relationships within the Market sectors. He will be sorely
missed by us all.
On behalf of the Board I thank our Chief Executive Officer,
Angelo Demasi, and his management team for all their diligence
and dedication to SAPML and its stakeholders. It has been a busy
and challenging year given the number of strategic projects
which Management has had to deal with in addition to the usual
function of running the Market and Group in a professional,
transparent and conscientious manner. I also thank each member
of the Board for their valued contribution.
Yours sincerely,
David Schirripa
Chairman
SO
UT
H A
US
TR
AL
IAN
PR
OD
UC
E M
AR
KE
T L
IMIT
ED
AN
NU
AL
RE
PO
RT
20
17
6
Finacial Results
We have completed our second year since the Boards
endorsement of the Companies 5-year Strategic Plan and continue
to transform our business whilst maintaining our Market operations
and property portfolios. The focus of our transformation has been
to ensure the Market continues to play an integral role in the Fruit
and Vegetables supply chain, catering for the future needs of its
stakeholders. This has been achieved whilst continuing to strengthen
our balance sheet through a mix of favourable property valuations
and share acquisitions.
South Australia and the Market experienced a challenging year
in 2016/17 including floods in Virginia, extremely high prices in
electricity, a state-wide blackout that affected the Market and a
fire within one of the Market’s switchboards. Despite this, property
assets for the Group achieved a gain on revaluation in 2017 of
$1.59M, following on from two significant increases in revaluation
reserves in 2015 and 2016 of $9.99M and $9.07M respectively.
The smaller valuation increase this year is one of the main reasons
for the significant decrease in profit before income tax compared
to last year. This year’s valuation increase was mainly a result of the
increased valuation of the land leased to Gallop Australia Sub TC
Pty Ltd, a subsidiary of Blackstone Group, as reported by Chairman
David Schirripa.
Further to the Chairman’s Report, our stake in Perth Markets
increased from $5,275,000 to $7,894,159. With the increased
revaluation and the share acquisition in Perth Markets, Gross Assets
for the Group increased to $124.5M from $120M in 2016. As a
result of this investment, gearing has marginally increased from
29.5% to 32.3% while the Net Asset backing has increased from
$12.30 in 2016 to $12.40 per share in 2017.
During the 2017 financial year 46,666 shares were traded at an
average selling price of $15.81 per share, compared to 44,200
shares traded at an average selling price of $9.76 per share in 2016.
Revenue for 2017 increased to $15.6M (2016: $15.1M) with the
growth continuing to be attributed by the new businesses and
property acquisitions undertaken in line with the Company’s
2015-20 Strategic Plan.
Whilst implementing some of the transformation strategies,
short-term profitability continues to be adversely impacted by
the increased costs of activities such as developing our new food
precinct, our solar on-site power generation project, our export
business and the cost of the new Burma Road recycling businesses.
The Recycling business was reviewed after 12-months of operation
and a decision was made to wind up the business at the end of
September 2017. The cost of labour in providing these services
was not sustainable going forward. The business was acquired as
an indirect result of purchasing the property and was not the main
objective of SAPML’s acquisition in 2016. Net profit after tax from
continuing operations (excluding revaluation gain and income tax)
for the 2017 year was $5.23M, a decrease from
$5.45M in 2016.
Valuation
The Market site was valued at $64.4M compared to $65.15M in the
previous year showing a decrease of $0.75M. The valuer opted for
an 8.96% capitalisation rate compared to 8.9% in the 2016
financial year.
The Group’s land leased to Gallop Australia Sub TC Pty Ltd was valued
at $29M in 2017 compared to $26.7M, in 2016, an increase of
$2.3M. This was mainly due to a reduction in the capitalisation rate,
moving from 5.97% in 2016 to 5.66% in the 2017 financial year.
With a new 5-year lease negotiated in 2016 the yield remained
steady as per the previous year.
The effect of the increased valuation this year can be explained
as follows:
CEO’s Report
Valuation @ 30/6/16 $109,865,000
Additions at cost $14,180 Depreciation expense (104,389)
Revaluation increment $1,590,209
Movement in Valuation $1,500,000
Valuation @ 30/6/17 $111,365,000
SO
UT
H A
US
TR
AL
IAN
PR
OD
UC
E M
AR
KE
T L
IMIT
ED
AN
NU
AL
RE
PO
RT
20
17
Tota
l Ass
ets
A$ m
illio
n
FY14FY12 FY15FY13 FY16 FY17
140
120
100
80
60
40
20
0
Rev
enue
A$ m
illio
n
FY14FY12 FY15FY13 FY16 FY17
16
15.5
15
14.5
14
13.5
13
12.5
12

7
Leasing
2017 has seen the commencement of reviewing our tenancy
mix and securing longer term leases with key stakeholders within
the Market. This project will continue during the 2018 financial
year leading up to the expiry of a number of store leases in October
2018. Ensuring we continue to maintain a 100% occupancy rate
across store, warehouse and commercial facilities.
As reported last year, management has continued to develop
a master plan, taking into account some of the stakeholders’
requirements and will continue to work through this with
existing and new tenants.
The merger of LaManna and Premier Fruits Group also presented
an opportunity to enter into a long-term lease with the new
Group which has now established a 6,140 sqm footprint within
the Market. A number of other wholesale store leases have
also been negotiated on longer term leases prior to the leases
expiring in October 2018. Consolidation of the wholesaling
sector is occurring on a national basis and will continue in the
next few years.
The weighted average lease expiry (WALE) of leases, within
the Market precinct, has increased to 3.33 years at the time of
writing this report. This compares favourably to a WALE of 2.59
years as at 30 June 2017 and a WALE of 2.74 as at June 2016.
Burma Road Property
The Burma Road facility comprising 5,046 sqm in lettable area
and 1.4ha of land had some tenancy changes during the year
with one secondary wholesaler leaving the premises and an
additional two tenants including secondary wholesaler, Mighty
Fresh and a longstanding Market transport company, Wakefield
Transport, taking up 388sqm and 1,494 Sqm respectively. The
current rent stands at $340k compared to $260k for the previous
year. The rent in both years included an imputed rental for the
recycling business which closed on 30 September 2017 with
currently 2,000sqm up for lease.
The site was master planned in order to obtain optimum land
utilization however it was decided to keep the site the same
with minor alterations to the existing vacant building including
a possible canopy and concrete realignment. Agents Alliance
has been appointed as leasing agent for the property. No capital
works will be done on the property until the property is leased.
Vacant land Eastern side of Market site
SAPML vacant land has been marketed for lease on a local,
national and international basis by JLL since 2015 with proposals
submitted to CHEP Australia to relocate the CHEP State office and
main facility to the site. Although these discussions have been
put on hold due to CHEPs national review, we have been able to
utilize a smaller footprint using the current CHEP yard located
within the Market. Management have been working with CHEP
for a number of years on equipment rental reform within the
market. South Australian Produce Market has recently kicked off a
pilot project introducing plastic crates and bins within the Market
system. Additional area has been leased to CHEP for this project.
If the pilot project is successful then it may still be possible that a
larger footprint is built.
A Memorandum of Understanding between Steritech and SAPML
to locate their facility within the Market did not proceed after
a business case funded by the State Government and Steritech
was conducted in establishing a Bio Security
export facility within SA. Unfortunately the
Victorian Govt funded $5M for the facility
to be located in Epping Market. SAPML
continue to explore other opportunities in this area.
SO
UT
H A
US
TR
AL
IAN
PR
OD
UC
E M
AR
KE
T L
IMIT
ED
AN
NU
AL
RE
PO
RT
20
17

8
Market Operations / Capital Works
Technology has brought us to a paradigm shift to the digital
world with the introduction of a multi-functional tool, the
Digiclip Safety app. It has affected all aspects of business, from
the way we track success to the way we manage our documents.
iPads are now used to provide real time reporting and instant
accessibility while on the market floor which in turn informs
management via an automated email of incidents, reports,
timesheets and issuing sanctions, etc. for easy reference.
Ultimately, the Digiclip Safety app system provides reporting
about Workplace Health and Safety, Environmental Management
and Quality Programs and is a paperless system. The system is
backed up on the cloud.
In December 2016, 80% of the Market’s electrical supply failed
which left the Market in total darkness. Due to severe weather
conditions advertised the day before, our electrician was on site
as part of the company’s disaster recovery plan. At 5.00am we
lost power and at the same time, we were advised that there was
an explosion at the main switchboard which services Shed H. Our
electrician was asked to proceed to Shed H to investigate as the
switchboard had caught fire.
The Emergency Services were called and the MSF attended the
site which deemed the switchboard to be safe. Our electrician
reported back that the explosion had disengaged three-quarters
of the site’s electrical high voltage supply which caused the
blackout. Works began to restore power. Supply was re-instated
once the High Voltage system was reset which was completed
in a couple of hours when power was restored to the site apart
from Shed H.
In order to provide electricity to the Lessees affected in Shed H,
a generator was sourced locally and in place within two hours
with full power restored within 14 hours.
A new switchboard then had to be designed, manufactured
and supplied. It was installed on 29 February 2017. The new
switchboard incorporates far more safety mechanisms that if in
future, an electrical issue occurs within the board, it does
not impact the transformer and will therefore, not disrupt the
site’s supply.
The total cost of the repairs of the new switchboard came to
$151k which was covered by SAPML’s Fusion Insurance and no
counter claims were received due to the speediness of the repair
and the efficiencies and professionalism of SAPML staff and our
electrical engineer, C & J Electrical.
For the first time in the Market’s history, operations were
suspended due to a result of a state-wide blackout. An incident
involving infrastructure near Port Augusta at 3.48pm on
28 September 2016 prompted the failure of the entire SA
electricity network. Emergency Procedures were initiated and
communicated to the Market Users via text message. These
Procedures were to close the Market for the first time in Market
history. Power to the Market site was fully restored at 2.00am
the next day. The impact on businesses within the market and
potential revenue loss was estimated to be approximately $200k.
Energy
At the September 2017 Board Meeting, the SAPML Board
approved the installation of our onsite solar PV and backup and
spot price mitigation generation system. As reported last year,
SAPML management have been extremely busy exploring all
options for the site including addressing the possibility of future
blackouts. With the installation of our Solar PV and Backup
system, the Market will have a system that will reduce our
demand from the electricity grid, providing protection against
high spot prices and consequently save costs. Tenants will have
the added advantage of uninterrupted power as a result of the
backup diesel generators.
During February 2017, SAPML placed Expressions of Interest
in the media seeking companies wishing to participate in a
nationwide tender to ensure all options for our site were available
to be considered by Management. Consultants GHD and CQ
Partners were appointed to assist in the process.
SO
UT
H A
US
TR
AL
IAN
PR
OD
UC
E M
AR
KE
T L
IMIT
ED
AN
NU
AL
RE
PO
RT
20
17

9
Nineteen EOI’s were received with nine companies meeting the
engineer’s minimum selection criteria who were then asked to
submit tenders. Out of the nine tenders received, four tenders
were shortlisted to work through the different options. After
careful deliberation, Autonomous Energy were awarded the
contract for $10.5M from which the SAPML Board has approved
in stages including Stage 1 of $7.4M for a 2.5MW PV solar
system, 2.5MW diesel generator for back up and spot price
mitigation and smart switching technology which will be a first
to be installed on a commercial site like ours. This technology will
forecast when to produce power on site or purchase off the grid
which will reduce our power costs and provide onsite power back
up. As reported by the SAPML Chairman at the time of writing
this report, we were waiting for a significant State Government
grant application to be approved. If the grant is approved we will
introduce Stage 2 which includes a 1MW battery storage system
providing further saving and spot price mitigation. Phase 2 of the
project which is subject to the Government Grant will be $3.1M.
The energy market is in disarray as power generators shut down
coal generation forcing businesses to look at innovative ways to
reduce energy prices and provide onsite power back up systems.
Lessees should enjoy reliable, efficient and reduced power costs
once the full system is in place.
Planning and approval process from the different power
regulators has commenced with the procurement process
currently underway. Completion of the project is anticipated to
be early 2018.
South Australian Produce Market Food Precinct Expansion
As reported last year, work commenced in 2015/16 on the Site
Master Plan and I am delighted to report Local Council Planning
approval for our Precinct Expansion was granted in early 2017.
The Food Precinct Expansion will be located at the SAPML
Pooraka site behind Building H and fronting Main North Road.
The Centre will provide small to medium food processors the
opportunity to take their businesses to the next level. It will
capitalize upon SAPML’s existing annual trade of fresh produce
between our current market users.
The Precinct will enable operators to process and provide fresh
fish, meat, baked goods, ready meals and fresh produce to both
wholesale clients and retail customers.
Retail study by independent consultants Macro Plan Dimasi
indicated this project is a way to service the rapidly growing
North, North-Eastern and North-Western populations that are
currently underserviced.
The project will also compliment other food initiatives and
developments including the combined State and Federal
Government Northern Adelaide Irrigation Scheme. (NAIS)
This Food Precinct Expansion is ideally situated adjacent to Main
North Road to capture household customers from throughout
Northern Adelaide and it builds upon SAPML’s strengths in
logistics and fresh produce and export consolidation.
The facilities will meet customer and food compliance
requirements for local and export markets with shared
infrastructure and amenities to remain cost effective for tenants.
We also want to link prospective tenants to export markets
through the South Australian Produce Market export strategy.
It is intended that a feature of the Food Precinct Expansion will
also be a cooking and education centre to enable the public
and school children to understand the benefits of cooking and
consuming fresh products and produce. As reported by SAPML
Chairman, the project will only be built once leases and firm
commitments are made.
Registrations of Interest to lease opened in September 2017 and
we are currently negotiating with numerous South Australian
successful small and medium sized food processing companies
and retail groups.
It is anticipated if contracts are completed, the Precinct will open
within two years.
SO
UT
H A
US
TR
AL
IAN
PR
OD
UC
E M
AR
KE
T L
IMIT
ED
AN
NU
AL
RE
PO
RT
20
17

10
Market Fresh SA Pty Ltd
Market Fresh SA Pty Ltd, an initiative of the
South Australian Fruit and Vegetable Industry,
continues to work with the South Australian
Produce Market and the SA Chamber for
Fruit and Vegetables to promote fresh
produce, family-owned retailers and the local
supply chain.
During the 2016-2017 financial year,
the Pick A Local, Pick SA! marketing
campaign saw an increased investment
in an integrated marketing approach using television, radio, print
advertising and a range of other marketing channels to introduce
and establish the new, revitalised campaign.
Funding saw the production of the first Pick A Local, Pick SA!
television commercial aimed at encouraging families to pick local
ingredients and retailers and saw the development of a series of
radio advertisements featuring advocate Callum Hann and local
Adelaide personality Hayley Pearson.
These activities, complimented by working with local media,
enabled the Pick A Local, Pick SA! campaign to grow and continue
to gain traction in the community.
Market Fresh SA continued to provide promotional fee for service
work in 2016-2017, working with local wholesalers and retailers to
create in store experiences for their customers as well as providing
the Wholesale Price Report to local and national customers. These
activities continue to deliver the Market Fresh SA objective of
increasing the volume of produce sold through our market through
the independent retail sector.
The Market Fresh SA Board welcomed Nadia Boscaini as a
Marketing, Events and Promotions Coordinator. Nadia comes with
experience as a journalist and public relations advisor as well as
skills in event management and planning, communications and
marketing. Nadia’s experience working with start-up and small
to medium sized businesses, in a variety of roles ensures that the
strategic plans are implemented and new ideas continue to be
developed.
We look forward to this new stage of development, working with
Nadia as she continues to implement the Marketing Plan.
Foodbank Milestone
Further to my previous report I am delighted to report that over
one million kilograms of fresh fruit and vegetables, worth over $2.5
million, has been donated by South Australian growers to Foodbank
SA through the market facility.
The fruit and vegetables have been used by Foodbank SA to provide
more than 5 million meals across South Australia, to families in need.
South Australian Produce Market Limited (SAPML), growers and
wholesalers donate fresh fruit and vegetables every day, which
are then distributed across the Foodbank SA’s network of 500
welfare agencies.
Over 100 horticulture businesses work with Foodbank SA, donating
produce either through the Market or direct from the farm gate or
packing shed.
The food is distributed to more than 85,000 marginalised South
Australians each month, one third being children.
When we started this partnership, we were only receiving 100,000
kilograms as donations per year. To see annual fruit and vegetable
donations hit one million kilograms annually is amazing. It makes a
significant difference to the support we can provide families in SA
who struggle to put food on the table.
The Foodbank SA partnership with the SAPML was an Australian
first, with Foodbank Queensland now trialling a similar program.
In 2012 SAPML and Foodbank SA embarked on a vision to grow
our 100,000 kg of donated fresh fruit and veg to one million kg by
providing Foodbank a state-of the art refrigerated warehouse facility
at the Market. We are delighted to have reached this millstone. This
fresh produce milestone could not have been possible without the
generosity of our growers and wholesalers who have made fresh
fruit and vegetables available. It is essential Foodbank SA continues
to provide food relief to people in need.
SO
UT
H A
US
TR
AL
IAN
PR
OD
UC
E M
AR
KE
T L
IMIT
ED
AN
NU
AL
RE
PO
RT
20
17
Nadia Boscaini
Marketing, Events and Promotions Coordinator

11
Fruit & Vegetable Export Development
As reported in 2015/16, the establishment of an export
arm (Australian Produce Collective (APC)) is another strategic
pillar which is catering for the future of the Market, our Growers
and Wholesalers. The initiative has continued to provide many
focal points on a state, national and international level. The
Premier of South Australia used our export facility to launch the
$110M Northern Adelaide Irrigation Scheme (NAIS), and APC
hosted a breakfast for Hort Connections, the largest Horticultural
conference ever held in Australia. On an international basis, all
Agricultural overseas inbound delegations have come to the
market in 2017.
APC was set up to fulfil a number of different requirements:
• create an entity that would benefit the tenants of the Market
and increase volume of produce being sold;
• establish an export hub that would highlight the Market
innovative thinking;
• open new channels of international engagement which
would result in more effective in-bound delegations;
• leverage new opportunities that would arise for the retail
precinct project.
These requirements are part of the strategic plan for the Market
to cater for the future and in the short period of time we have
started to achieve these objectives.
The export market in Australia is highly fragmented and
opportunistic with consolidators reacting to enquiries from
importers, always based on price which has led to growers
constantly being squeezed on price, second grade produce being
sent as a result and inconsistency of orders. All this has caused
the exporting of fresh produce to remain an afterthought for the
majority of growers.
The APC model looked at all of these aspects and created a
complete supply chain solution, eliminating many overseas
middle men, dealing direct with the retailers and gaining
valuable insights into consumer consumption trends which would
result in new product varieties, consistency of ordering and
knowing exactly where and what is happening to the produce
being sent.
This model is an extremely complex model to setup, develop and
drive given the complexities of each part of the business
The primary focus of APC is on the growers, understanding their
produce, seasons, packaging requirements, on farm operations
and capabilities. APC have spent the first six months meeting
with the majority of growers and wholesalers in the Market to
discuss the APC model, trying to get the buy-in to this new
approach.
With all products being packed under one brand, Fresh Please,
APC has been trying to deliver packaging to as many growers
as possible so packing can be done on farm. However, again, as
volumes were in the start-up stage, this has taken some time to
achieve which is time consuming and labour intensive.
A review in this area was conducted and changes are currently
being made.
APC started in November 2016 initially within a temporary
facility using Store 53. The opportunity to negotiate with the
LaManna Premier Group for their facility in Store 44 and 45
provided the best cost affective opportunity for the start-up
business, APC. It was always planned to have a dedicated
export facility that housed an inspection room and a number of
cold rooms. APC was able to send their first orders out from
this facility in February 2017, bringing the four-month’s year to
date sales figures to $376k. S
OU
TH
AU
ST
RA
LIA
N P
RO
DU
CE
MA
RK
ET
LIM
ITE
D A
NN
UA
L R
EP
OR
T 2
01
7

12
The importance of the dedicated facility was one of the key
requirements in providing a more efficient supply chain. The
new facility was upgraded and was accredited for export at
the end of January 17. Since then, the Market has an exported
accredited registered premise for conventional and Organic Fruit
and Vegetables and employs one of three Authorise Officer’s
in the country (most qualified in the State) to cover the full
range of fruits and vegetables. The accreditation means APC
has the capability of supplying protocol countries, and this is
one of APC’s advantages as we develop the business activities
internationally.
Fresh Please is about consumer education, working with retailers
to engage with consumers to tell them about the nutritional
benefits, taste and quality of Australian and Fresh Please produce.
APC have done a number of engagement strategies, such as an
extremely comprehensive website that is now consumer friendly
and can be accessed by QR codes on all Fresh Please packing.
The website has content that educates about the benefits of
Fresh Please, recipe cards that relate to a range of seasonal
produce with demonstration videos online which are easy to
follow and tasty. There are also regular updates for buyers about
what is happening in the Australian markets and what produce is
coming into season, etc. This is a full end to end value chain that
has been created, and is something unique and innovative.
It has taken time to reach the stage where we can focus on
sourcing and selling the best local produce to a growing number
of international clients. This is the focus for the year ahead and
with our clients now doing weekly orders, up from a few cases
when we commenced this has already begun.
In 2015/16 the APC team visited a number of countries,
including Qatar, Dubai, Singapore, Japan, Hong Kong, Malaysia
and Thailand - some private trips, others as part of a delegation
or trade mission. This has been vital in understanding how
retailers work in different countries, consumer preferences,
getting to know importers as well as seek out other
opportunities.
The 2017/18 financial year will focus on building sales and
markets with bulk unbranded and branded produce.
As stated, last year was about building the foundations that
will enable us to focus on sales. Establishing the company, with
all of the various registrations, packaging, marketing as well as
building sales networks, it was a busy year with the small team of
four pulling on their export experience to ensure as much of the
foundation had been laid.
In 2015/16, I reported that we entered an MOU with IM
Holdings who are building a cold storage facility which we
were hoping to use as a centralised distribution centre for
Australian products. We are continuing to discuss these
opportunities and we have hosted a delegation from Singapore
to review our options moving forward. The Singapore market
is a well-established mature market with long term established
partnerships with the added issue of limited air cargo out of
Adelaide. These are some of the challenges we will continue to
work around.
After a mid-year review of the business model, we have
also established an opportunity to consolidate and trade
other branded produce through the business which will be
implemented in 2017/18.
SO
UT
H A
US
TR
AL
IAN
PR
OD
UC
E M
AR
KE
T L
IMIT
ED
AN
NU
AL
RE
PO
RT
20
17

13
Industry Matters
SA Flood Appeal 2016
Growers in Northern Adelaide Plains were affected by floods in
October 2016 with devastating affects to their livelihoods and
the State vegetable production. The South Australian Produce
Market Limited was instrumental in proposing a SA Flood Appeal
and partnered with Foodbank SA, The Horticultural Coalition
of SA and AusVeg SA, to run a sector-wide industry appeal.
Although an initial target of $100,000 was set, SAPML and its
industry partners were instrumental in raising $152,000, thanks
to significant contributions made by SAPML, Fresh Markets
Australia , IGA and the South Australian Government.
The funds provided growers with money to purchase much
needed seedlings helping in re-establishing viable crops for the
2016 summer season.
.
Horticultural Mandatory Code of Conduct
SAPML, as Secretariat of CMAA, played an integral role in
negotiating the Mandatory Code with the Federal Government
by ensuring the Wholesale Markets were not disadvantaged.
The Central Market Association of Australia (CMAA) supported
most of the 13 recommendations made by the Horticulture Code
Review Panel. The code is a much better code now than where
it was when it was introduced and we continue to ensure the
Markets get a fair go.
Hort Connections in Adelaide in 2017
It has been many years since we have been advocating for one
major horticultural industry conference in Australia. Finally, in
2017 AUSVEG, PMA and FMA/CMAA combined by having one
of the largest Horticultural conferences ever held in Australia and
Adelaide was lucky enough to be the first to host this event. We
were also instrumental in making the partnership occur, bringing
the parties to the table to make it happen. Over 2,000 industry
people attended the 2-day event which included a market tour
where wholesalers and growers within the Market, including our
export business and show cased their produce to national and
international buyers.
SO
UT
H A
US
TR
AL
IAN
PR
OD
UC
E M
AR
KE
T L
IMIT
ED
AN
NU
AL
RE
PO
RT
20
17

14
2015-20 Strategic Plan and Future Outlook
We are two years into our strategic plan, entering our third
year and we have completed the groundwork for all our key
strategic pillars. These pillars include;
• the land utilisation plan with the food precinct expansion
currently being marketed,
• commencement of our on-site energy plan with solar and
backup system,
• investment in Perth Markets,
• export plan completed and already exporting to
overseas markets,
• completion of master plan;
• commencement in negotiations of Market leases; and
• continual review of all our business units and
Market operations.
It is important to understand the forever changing landscape
in South Australia and the challenges we face with the closure
of the Manufacturing industries and transformation of the
new economy from these industries to new business sectors,
the ongoing proliferation of retail markets and the aggressive
expansion into Australia of offshore discount grocery retailers
and online platforms like Amazon. With these threats also come
opportunities. Wholesale markets like ours will continue to play a
pivotal role in the supply chain. Our 2015-20 Strategic plan has
catered for the current and future transformation of our economy
and will continue to evolve in order to take advantage of our
Market’s strength. The Board and management continue to work
with local and national stakeholders to ensure the Wholesale
Markets work together to build on our local heritage to ensure
we strengthen our role in within the supply chain.
It is important that we, as a business, continue to remain
competitive in the market place and we continue to review the
way we operate and review our cost of doing business. While
the BDO review undertaken in 2015 was implemented during
2015 and 2016, in 2017 the departure of our previous Finance
Manager created an opportunity to review the finance function.
The Audit, Corporate Governance and Finance Committee
reviewed the roles within the finance department and employed
a part-time Financial Controller, John Edwards who will oversee
the Accounting and Finance function of the business. This change
has already started to pay dividends for the business and I am
pleased to provide shareholders the team and structure that will
help shape our business moving forward (refer to Organisational
Structure – page 56).
2017/18 will be an extremely busy year where we will continue
to market and develop our food precinct concept, build the
onsite solar and power generation before the summer period
is in full swing, deal with store leases that expire in late 2018,
continue to review and develop the export business and further
review operational costs in order to continue to reduce the
operating costs within the Market.
The Brisbane, Perth and South Australian market management
teams will work closely together to review opportunities where
we are able to synergise and streamline some of our operational
and business functions.
As stated last year, it is imperative that we continue to be
innovative like our founders were in 1988 becoming the first
privatised Market in Australia and, although we may not succeed
in all our opportunities, it is important we continue to be
innovative in our thinking in order to be a dominate force within
our sector.
I would like to take this opportunity to welcome our new team
members and thank them and existing members for what has
been another challenging year. I thank them for bringing a
positive attitude to work every day which makes projects easier
to execute, changes become easier to implement and problems
become easier to solve. I look forward to the positive attitude
and working together in further improving our business now and
into the future.
Angelo Demasi
Chief Executive Officer
SO
UT
H A
US
TR
AL
IAN
PR
OD
UC
E M
AR
KE
T L
IMIT
ED
AN
NU
AL
RE
PO
RT
20
17

15
SO
UT
H A
US
TR
AL
IAN
PR
OD
UC
E M
AR
KE
T L
IMIT
ED
AN
NU
AL
RE
PO
RT
20
17

16
Directors’ Report

17
SO
UT
H A
US
TR
AL
IAN
PR
OD
UC
E M
AR
KE
T L
IMIT
ED
& C
ON
TR
OL
LE
D E
NT
ITIE
S A
CN
00
8 1
29
56
6 A
NN
UA
L R
EP
OR
T 2
01
7
Your Directors present their report on the parent company (South Australian Produce Market Limited) and its controlled entities, (Consolidated Group), for the financial year ended.
The names of the Directors in office at any time during or since the end of the year (until the date of this report) are:
•MrDavidSchirripa(Chairman)
•MrNicola(Nic)Minicozzi(DeputyChairman)
•MrPasquale(Pat)Scalzi
•MrDaniele(Danny)Deleso
•MrAntonio(Tony)Ceravolo
•MrMichaelRuggiero
•MsChristineScalzi
•MrGirolamo(James)Fragnito
•MrDerrickPatterson
Directors have been in office since the start of the financial year to the date of this report.
Company Secretary
The position of Company Secretary is held by the Consolidated Group’s Chief Executive Officer, Mr Angelo Demasi.
Principal Activities
The principal activities of the Group during the financial year were the management of the wholesale market, the position of related market services and related property investments. No significant changes in the nature of these activities occurred during the year.
Operating Result: Summary Consolidated Group
2017 2016 $ $
Consolidated profit before income tax 6,818,822 14,521,776
Revaluation (loss)/gain included in consolidated profit 1,590,209 9,069,190
Consolidated profit before income tax, excluding the revaluation gain/loss 5,228,613 5,452,586
Current income tax payable 1,628,849 1,518,897
Consolidated profit after income tax excluding revaluation gain/(loss) 3,599,764 3,933,689
Directors’ Report

18S
OU
TH
AU
ST
RA
LIA
N P
RO
DU
CE
MA
RK
ET
LIM
ITE
D &
CO
NT
RO
LL
ED
EN
TIT
IES
AC
N 0
08
12
9 5
66
AN
NU
AL
RE
PO
RT
20
17
Dividends
The dividends paid and declared to be paid since the start of the 2017 financial year are as follows:
•Fullyfrankedfinaldividendof35centspershare (for the year ended 30 June 2016) paid in December 2016, as declared by the Directors: $2,021,096.
•Fullyfrankedinterimdividendof35centspershare (for the year ended 30 June 2017) paid in May 2017, as declared by the Directors: $2,021,096.
Review of operations
A review of operations of the Consolidated Group and the results of those operations are contained in the accompanying Chairman’s and Chief Executive Officer’s Reports.
During the year the Consolidated Group continued to engage in its principal activities, the results of which are disclosed in the accompanying financial report.
Significant changes in the state of affairs
No significant changes in the state of affairs of the Consolidated Group occurred during the year.
After reporting date events
No other matters or circumstances have arisen since the end of the financial year which significantly affected or could significantly affect the operations of the company, the results of those operations or the state of affairs of the company in future financial years.
Future developments, prospects and business strategies
Future developments, prospects and business strategies in the operations of the Consolidated Group are referred to in the accompanying Chairman’s and Chief Executive Officer’s Reports.
Share options
No options to have shares issued in the Consolidated Group were granted during or since the end of the financial year and there were no options outstanding at the end of the financial year.
Environmental issues
The Consolidated Group has complied with all environmental regulations under the Commonwealth or State legislation.
Directors’ Report

19
SO
UT
H A
US
TR
AL
IAN
PR
OD
UC
E M
AR
KE
T L
IMIT
ED
& C
ON
TR
OL
LE
D E
NT
ITIE
S A
CN
00
8 1
29
56
6 A
NN
UA
L R
EP
OR
T 2
01
7
Directors’ Report …INFORMATION ON DIRECTORS
MR DAVID SCHIRRIPA
Director and Chairman
Qualifications:
- Lawyer LLB (Hons) GDLP
- B. Econ.(Accg)
- Notary Public
Experience:
- Involvement in fresh produce industry at grower, wholesale and retail level
- APML Director from November 2004 to November 2007 including period as Deputy Chairman
- Director - Schirripa Evans Lawyers, a private client and family business commercial law practice
- Director - Schirripa Orchards Pty Ltd
- Director - Perth Markets Limited (as a representative of SAPML and it’s shareholding in the company).
- Total director fees received for 2016/2017 from Perth Markets Limited was $18,068.88
Registered interest in shares & options:
273,623
Attendance:
Meetings of Directors 1 July 2016 to 30 June 2017 (for the Consolidated Group)
Board Meetings:
Number eligible to attend: 12
Number attended: 12
Committee Meetings:
Number eligible to attend: 3
Number attended: 3
Committees presided on:
Audit, Corporate Governance and Finance Committee
MR NICOLA (NIC) MINICOZZI
Director and Deputy Chairman
Qualifications:
- Bachelor of Laws (LLB)
- Notary Public
Experience:
- Admitted Legal Practitioner in 1974
- Experience in non-litigious and litigious Commercial Law
Registered interest in shares & options:
Nil
Attendance:
Meetings of Directors 1 July 2016 to 30 June 2017 (for the Consolidated Group)
Board Meetings:
Number eligible to attend: 12
Number attended: 10
Committee Meetings:
Number eligible to attend: 3
Number attended: 3
PASQUALE (PAT) SCALZI, OAM
Director
Experience
- Managing Director – P.E Scalzi Pty Ltd
- Director - P.E. Services Pty Ltd
- Director - Pooraka Wholesalers Pty Ltd
- Over 50 years’ wholesale fruit and vegetable industry
- Wholesaler Board Member since 1987
Registered interest in shares & options
823,199
Attendance:
Meetings of Directors 1 July 2016 to 30 June 2017 (for the Consolidated Group)
Board Meetings:
Number eligible to attend: 12
Number attended: 10

20S
OU
TH
AU
ST
RA
LIA
N P
RO
DU
CE
MA
RK
ET
LIM
ITE
D &
CO
NT
RO
LL
ED
EN
TIT
IES
AC
N 0
08
12
9 5
66
AN
NU
AL
RE
PO
RT
20
17
Directors’ Report …INFORMATION ON DIRECTORS
MR DANIELE (DANNY) RAFAELE DE IESO
Director
Qualifications
- Advanced Diploma in Horticulture Production
- Diploma of Rural Business Management
Experience
- Over 35 years’ experience in fruit and vegetable industry
- Grower Board Member since 2002
- Director – Ausveg
- Director - Ausveg SA
Registered interest in shares & options:
1,400
Attendance:
Meetings of Directors 1 July 2016 to 30 June 2017 (for the Consolidated Group)
Board Meetings
Number eligible to attend: 12
Number attended: 12
MR GIROLAMO (JAMES) FRAGNITO
Director
Experience:
- Over 30 years of experience in fruit and vegetable retailing
- 2007 Chairman - Adelaide Produce Markets Young Leaders Committee
- Managing Director - Mount Barker Fresh Market
- Committee member - SA Fruit & Veg Retailer Association
Registered interest in shares & options:
37,500
Attendance:
Meetings of Directors 1 July 2016 to 30 June 2017 (for the Consolidated Group)
Board Meetings:
Number eligible to attend: 12
Number attended: 12
MS CHRISTINE SCALZI
Director
Experience:
- Director - Select Naturally Pty Ltd
- Commenced with City Fruit in 1990, underpinning many years of experience fulfilling various administration and business roles with Select Naturally.
Registered interest in shares & options:
238,200
Attendance:
Meetings of Directors 1 July 2016 to 30 June 2017 (for the Consolidated Group)
Board Meetings:
Number eligible to attend: 12
Number attended: 9

21
SO
UT
H A
US
TR
AL
IAN
PR
OD
UC
E M
AR
KE
T L
IMIT
ED
& C
ON
TR
OL
LE
D E
NT
ITIE
S A
CN
00
8 1
29
56
6 A
NN
UA
L R
EP
OR
T 2
01
7
MR ANTONIO (TONY) CERAVOLO
Director
Qualifications:
- Managing Director - R Ceravolo & Co Pty Ltd
- Director - Ashton Valley Fresh Juices
- Director - Ceravolo Orchards Pty Ltd
- Director - Apple & Pear Growers Association of SA
Experience:
- 35 years of orchard experience
- 35 years of experience in wholesale of fruit and vegetables
Registered interest in shares & options:
98,500
Attendance:
Meetings of Directors 1 July 2016 to 30 June 2017 (for the Consolidated Group)
Board Meetings:
Number eligible to attend: 12
Number attended: 10
MR DERRICK PATTERSON
Director
Experience:
- Over 40 years of experience in fresh fruit and vegetable Retailing
- Former Chairman - Go Green Grocer Retailer Association
- Cherry Ball Charity Committee member since 1997
Registered interest in shares & options:
20,000
Attendance:
Meetings of Directors 1 July 2016 to 30 June 2017 (for the Consolidated Group)
Board Meetings:
Number eligible to attend: 12
Number attended: 12
Committee Meetings:
Number eligible to attend: 3
Number attended: 1
Committees presided on:
Audit, Corporate Governance & Finance Committee
MR MICHAEL RUGGIERO
Director
Qualifications:
- Bachelor of Arts (Accounting)
- Chartered Accountant
- Chartered Tax Adviser
- Diploma in Financial Services
Experience:
- 30 years of experience as a Chartered Accountant
- Managing Partner - Bentleys Accountants, Auditors and Advisors
- Advisor in the area of taxation and business consulting in the property, retail and wholesale sectors and professional services industry
- Experience in Capital Gains Tax, international taxation, structuring property and business acquisitions
Registered interest in shares & options:
Nil
Attendance:
Meetings of Directors 1 July 2016 to 30 June 2017 (for the Consolidated Group)
Board Meetings:
Number eligible to attend: 12
Number attended: 12
Committee Meetings:
Number eligible to attend: 3
Number attended: 2
Committees presided on:
Audit, Corporate Governance & Finance Committee
Directors’ Report …INFORMATION ON DIRECTORS
22S
OU
TH
AU
ST
RA
LIA
N P
RO
DU
CE
MA
RK
ET
LIM
ITE
D &
CO
NT
RO
LL
ED
EN
TIT
IES
AC
N 0
08
12
9 5
66
AN
NU
AL
RE
PO
RT
20
17
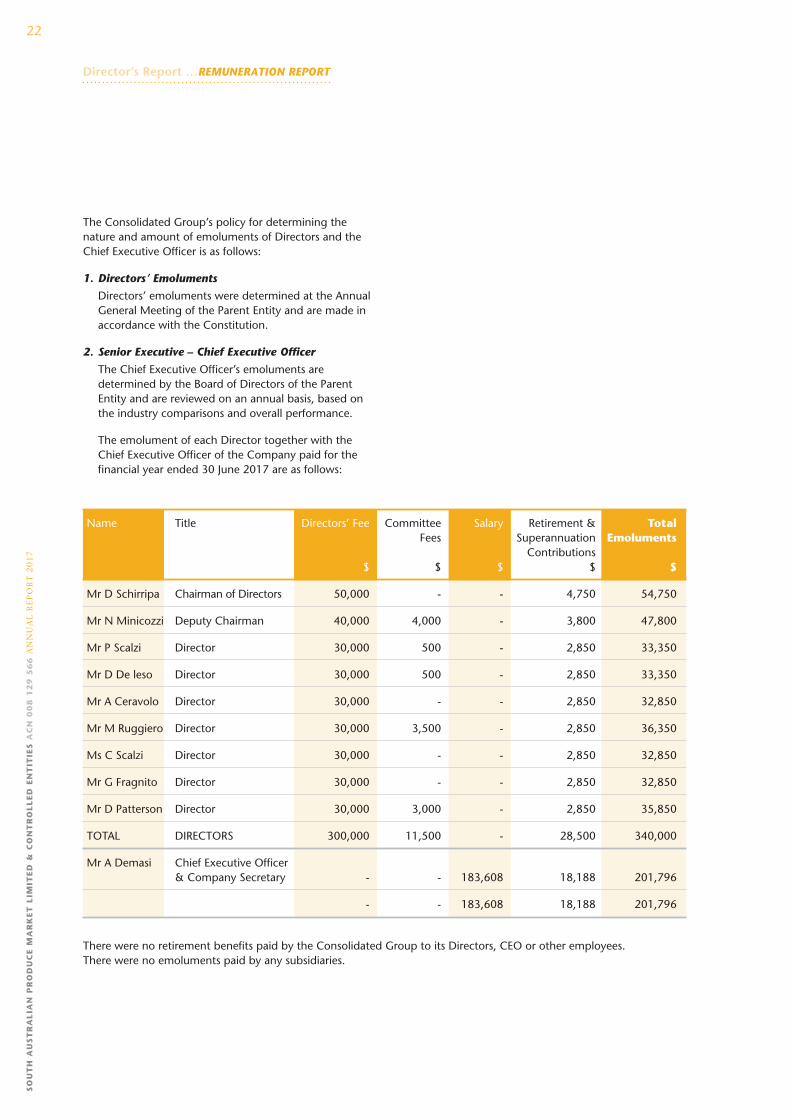
The Consolidated Group’s policy for determining the nature and amount of emoluments of Directors and the Chief Executive Officer is as follows:
1. Directors’ Emoluments
Directors’ emoluments were determined at the Annual General Meeting of the Parent Entity and are made in accordance with the Constitution.
2. Senior Executive – Chief Executive Officer
The Chief Executive Officer’s emoluments are determined by the Board of Directors of the Parent Entity and are reviewed on an annual basis, based on the industry comparisons and overall performance.
The emolument of each Director together with the Chief Executive Officer of the Company paid for the financial year ended 30 June 2017 are as follows:
Name Title Directors’ Fee Committee Salary Retirement & Total Fees Superannuation Emoluments Contributions $ $ $ $ $
Mr D Schirripa Chairman of Directors 50,000 - - 4,750 54,750
Mr N Minicozzi Deputy Chairman 40,000 4,000 - 3,800 47,800
Mr P Scalzi Director 30,000 500 - 2,850 33,350
Mr D De leso Director 30,000 500 - 2,850 33,350
Mr A Ceravolo Director 30,000 - - 2,850 32,850
Mr M Ruggiero Director 30,000 3,500 - 2,850 36,350
Ms C Scalzi Director 30,000 - - 2,850 32,850
Mr G Fragnito Director 30,000 - - 2,850 32,850
Mr D Patterson Director 30,000 3,000 - 2,850 35,850
TOTAL DIRECTORS 300,000 11,500 - 28,500 340,000
Mr A Demasi Chief Executive Officer & Company Secretary - - 183,608 18,188 201,796
- - 183,608 18,188 201,796
There were no retirement benefits paid by the Consolidated Group to its Directors, CEO or other employees. There were no emoluments paid by any subsidiaries.
Director’s Report …REMUNERATION REPORT

23
SO
UT
H A
US
TR
AL
IAN
PR
OD
UC
E M
AR
KE
T L
IMIT
ED
& C
ON
TR
OL
LE
D E
NT
ITIE
S A
CN
00
8 1
29
56
6 A
NN
UA
L R
EP
OR
T 2
01
7
Directors’ Benefits – Other than Benefits Separately Disclosed in Note 23: Related Party Disclosures
Other than that disclosed in Note 23, no Director has received or become entitled to receive during or since the financial year, a benefit because of a contract made by the Company or a related body corporate with a Director, a firm of which the Director is a member or an entity in which the Director has a substantial financial interest.
Indemnifying Officers or Auditor
The Company has not, during or since the financial year, in respect of any person who is or has been an officer or auditor of the Company or a related body corporate:
•Indemnifiedormadeanyrelevantagreementforindemnifying against a liability as an officer or auditor, including costs and expenses in successfully defending legal proceedings; or
•Paidoragreedtopayapremiuminrespectofacontract insuring against a liability incurred as an officer or auditor for the costs or expenses to defend legal proceedings, with exception of the following:
- The Company paid insurance premiums to insure all Directors against liabilities for costs and expenses incurred by them in defending any legal proceedings arising out of their conduct while acting in the capacity of Director of the Company, other than conduct involving a wilful breach of duty in relation to the company.
Share Options
There are no share options that have been granted over the unissued shares of the Company.
Proceedings on Behalf of the Company
No person has applied for leave of Court to bring proceedings on behalf of the Company or intervene in any proceedings to which the Company is a party for the purpose of taking responsibility on behalf of the Company for all or any part of those proceedings.
The Company was not a party to any such proceedings during the year.
Non-Audit Services – External Auditor
Fees for non-audit services were not paid/payable to the external auditor during the year ended 30 June 2017.
Auditor’s independence declaration
A copy of the Auditor’s independence declaration as required under Section 307C of the Corporations Act 2001 is following this report.
Signed in accordance with a resolution of the Board of Directors.
David Schirripa Chairman of Directors
Signed at Pooraka, South Australia on this 29th day of September 2017

24S
OU
TH
AU
ST
RA
LIA
N P
RO
DU
CE
MA
RK
ET
LIM
ITE
D &
CO
NT
RO
LL
ED
EN
TIT
IES
AC
N 0
08
12
9 5
66
AN
NU
AL
RE
PO
RT
20
17
Auditor’s Declaration of Independence

25
SO
UT
H A
US
TR
AL
IAN
PR
OD
UC
E M
AR
KE
T L
IMIT
ED
& C
ON
TR
OL
LE
D E
NT
ITIE
S A
CN
00
8 1
29
56
6 A
NN
UA
L R
EP
OR
T 2
01
7
Financial Statements
26S
OU
TH
AU
ST
RA
LIA
N P
RO
DU
CE
MA
RK
ET
LIM
ITE
D &
CO
NT
RO
LL
ED
EN
TIT
IES
AC
N 0
08
12
9 5
66
AN
NU
AL
RE
PO
RT
20
17
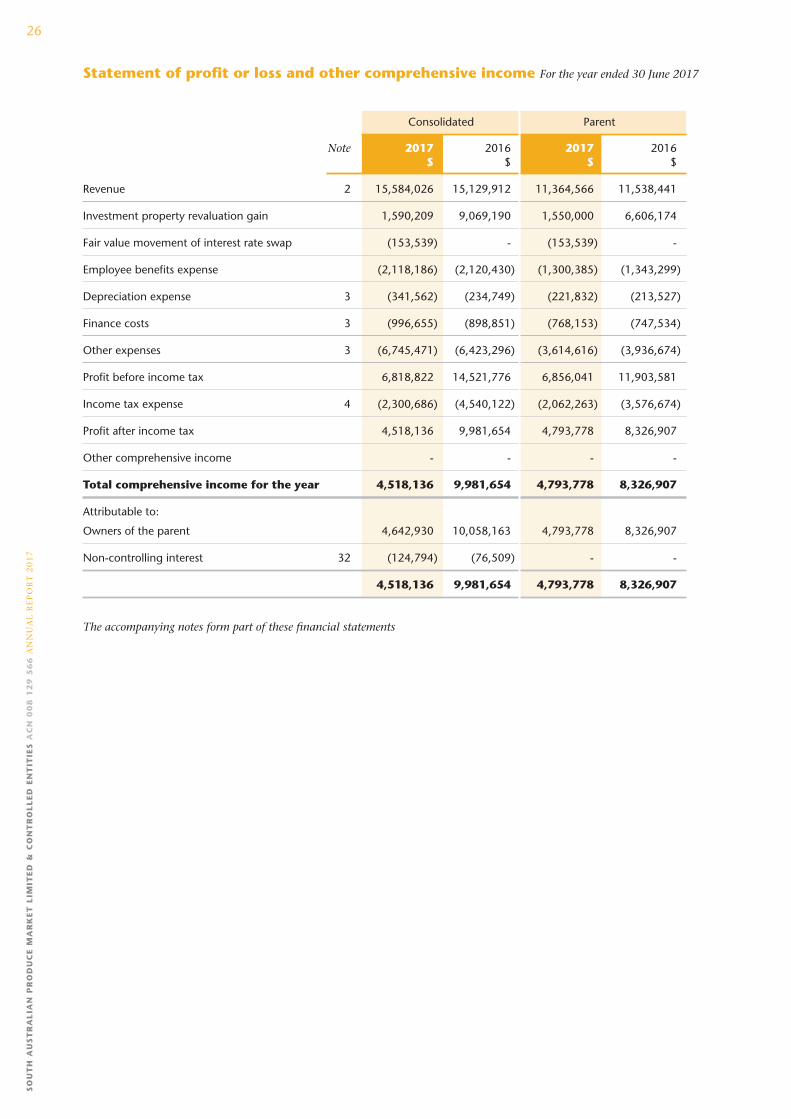
Consolidated Parent
Note 2017 2016 2017 2016 $ $ $ $
Revenue 2 15,584,026 15,129,912 11,364,566 11,538,441
Investment property revaluation gain 1,590,209 9,069,190 1,550,000 6,606,174
Fair value movement of interest rate swap (153,539) - (153,539) -
Employee benefits expense (2,118,186) (2,120,430) (1,300,385) (1,343,299)
Depreciation expense 3 (341,562) (234,749) (221,832) (213,527)
Finance costs 3 (996,655) (898,851) (768,153) (747,534)
Other expenses 3 (6,745,471) (6,423,296) (3,614,616) (3,936,674)
Profit before income tax 6,818,822 14,521,776 6,856,041 11,903,581
Income tax expense 4 (2,300,686) (4,540,122) (2,062,263) (3,576,674)
Profit after income tax 4,518,136 9,981,654 4,793,778 8,326,907
Other comprehensive income - - - -
Total comprehensive income for the year 4,518,136 9,981,654 4,793,778 8,326,907
Attributable to:
Owners of the parent 4,642,930 10,058,163 4,793,778 8,326,907
Non-controlling interest 32 (124,794) (76,509) - -
4,518,136 9,981,654 4,793,778 8,326,907
The accompanying notes form part of these financial statements
Statement of profit or loss and other comprehensive income For the year ended 30 June 2017

27
SO
UT
H A
US
TR
AL
IAN
PR
OD
UC
E M
AR
KE
T L
IMIT
ED
& C
ON
TR
OL
LE
D E
NT
ITIE
S A
CN
00
8 1
29
56
6 A
NN
UA
L R
EP
OR
T 2
01
7
Consolidated Parent
Note 2017 2016 2017 2016 $ $ $ $
CURRENT ASSETS
Cash and cash equivalents 6 1,172,888 2,776,772 544,520 1,667,335
Trade and other receivables 7 1,670,976 445,257 1,242,325 225,216
Other current assets 8 521,985 422,143 378,847 348,400
TOTAL CURRENT ASSETS 3,365,849 3,644,172 2,165,692 2,240,951
NON-CURRENT ASSETS
Trade and other receivables 7 203,982 59,942 13,136,119 13,300,678
Investment properties 9 111,365,000 109,865,000 95,865,000 94,315,000
Plant and equipment 10 1,693,124 1,418,994 1,590,617 1,348,605
Financial assets 28 7,894,159 5,275,000 7,894,161 5,275,002
TOTAL NON-CURRENT ASSETS 121,156,265 116,618,936 118,485,897 114,239,285
TOTAL ASSETS 124,522,114 120,263,108 120,651,589 116,480,236
CURRENT LIABILITIES
Trade and other payables 11 1,900,227 2,078,555 1,418,322 1,697,132
Short-term borrowings 12 11,049 5,671 11,049 5,671
Current tax liabilities 14 727,048 652,105 546,416 495,149
Short-term provisions 13 349,748 368,990 325,289 353,675
TOTAL CURRENT LIABILITIES 2,988,072 3,105,321 2,301,076 2,551,627
NON-CURRENT LIABILITIES
Long-term borrowings 12 33,451,692 30,462,741 33,451,692 30,462,741
Long-term provisions 13 14,026 35,136 14,026 35,136
Deferred tax liabilities 14 16,313,829 15,641,992 16,136,627 15,522,581
Financial liabilities 28 153,539 - 153,539 -
TOTAL NON-CURRENT LIABILITIES 49,933,086 46,139,869 49,755,884 46,020,458
TOTAL LIABILITIES 52,921,158 49,245,190 52,056,960 48,572,085
NET ASSETS 71,600,956 71,017,918 68,594,629 67,908,151
EQUITY
Issued capital 15 5,774,560 5,774,560 5,774,560 5,774,560
Reserves 31 392,750 392,750 392,750 392,750
Non-controlling interest 32 (829) 16,871 - -
Retained earnings 65,434,475 64,833,737 62,492,427 61,740,841
TOTAL EQUITY 71,600,956 71,017,918 68,659,737 67,908,151
The accompanying notes form part of these financial statements
Statement of financial position As at 30 June 2017

28S
OU
TH
AU
ST
RA
LIA
N P
RO
DU
CE
MA
RK
ET
LIM
ITE
D &
CO
NT
RO
LL
ED
EN
TIT
IES
AC
N 0
08
12
9 5
66
AN
NU
AL
RE
PO
RT
20
17
Note Issued Retained Non-controlling Share Total capital earnings interests premium $ $ reserve $ $
CONSOLIDATED
Balance as at 1 July 2015 5,774,560 59,106,494 - 392,750 65,273,804
Contributions by minority owners - - 93,380 - 93,380
Profit for the year - 10,058,163 (76,509) - 9,981,654
Other comprehensive income - - - - -
Total comprehensive income - 10,058,163 16,871 - 10,075,034
Transactions with owners
Dividends paid or provided for 5 - (4,330,920) - - (4,330,920)
Total transactions with owners - (4,330,920) - - (4,330,920)
Balance as at 30 June 2016 5,774,560 64,833,737 16,871 392,750 71,017,918
Contributions by minority owners - - 107,094 - 107,094
Profit for the year - 4,642,930 (124,794) - 4,518,136
Other comprehensive income - - - - - -
Total comprehensive income - 4,642,930 (17,700) - 4,625,230
Transactions with owners
Dividends paid or provided for 5 - (4,042,192) - - (4,042,192)
Total transactions with owners - (4,042,192) - - (4,042,192)
Balance as at 30 June 2017 5,774,560 65,434,475 (829) 392,750 71,600,956
The accompanying notes form part of these financial statements
Statement of changes in equity For the year ended 30 June 2017

29
SO
UT
H A
US
TR
AL
IAN
PR
OD
UC
E M
AR
KE
T L
IMIT
ED
& C
ON
TR
OL
LE
D E
NT
ITIE
S A
CN
00
8 1
29
56
6 A
NN
UA
L R
EP
OR
T 2
01
7
Note Issued Retained Non-controlling Share Total capital earnings interests premium $ $ reserve $ $
PARENT
Balance as at 1 July 2015 5,774,560 57,744,854 - 392,750 63,912,164
Profit for the year - 8,326,907 - - 8,326,907
Other comprehensive income - - - - -
Total comprehensive income - 8,326,907 - - 8,326,907
Transactions with owners
Dividends paid or provided for 5 - (4,330,920) - - (4,330,920)
Total transactions with owners - (4,330,920) - - (4,330,920)
Balance as at 30 June 2016 5,774,560 61,740,841 - 392,750 67,908,151
Profit for the year - 4,793,778 - - 4,793,778
Other comprehensive income - - - - -
Total comprehensive income - 4,793,778 - - 4,793,778
Transactions with owners
Dividends paid or provided for 5 - (4,042,192) - - (4,042,192)
Total transactions with owners - (4,042,192) - - (4,042,192)
Balance as at 30 June 2017 5,774,560 62,492,427 - 392,750 68,659,737
The accompanying notes form part of these financial statements
Statement of changes in equity For the year ended 30 June 2017
30S
OU
TH
AU
ST
RA
LIA
N P
RO
DU
CE
MA
RK
ET
LIM
ITE
D &
CO
NT
RO
LL
ED
EN
TIT
IES
AC
N 0
08
12
9 5
66
AN
NU
AL
RE
PO
RT
20
17
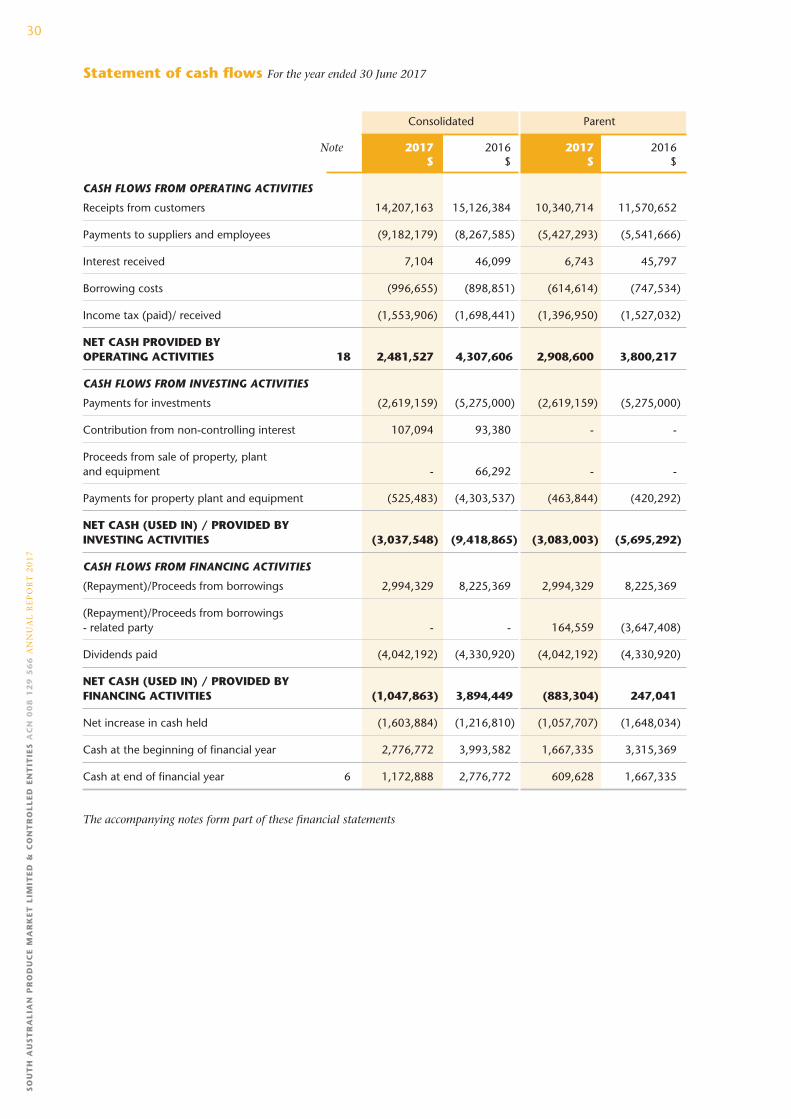
Consolidated Parent
Note 2017 2016 2017 2016 $ $ $ $
CASH FLOWS FROM OPERATING ACTIVITIES
Receipts from customers 14,207,163 15,126,384 10,340,714 11,570,652
Payments to suppliers and employees (9,182,179) (8,267,585) (5,427,293) (5,541,666)
Interest received 7,104 46,099 6,743 45,797
Borrowing costs (996,655) (898,851) (614,614) (747,534)
Income tax (paid)/ received (1,553,906) (1,698,441) (1,396,950) (1,527,032)
NET CASH PROVIDED BY OPERATING ACTIVITIES 18 2,481,527 4,307,606 2,908,600 3,800,217
CASH FLOWS FROM INVESTING ACTIVITIES
Payments for investments (2,619,159) (5,275,000) (2,619,159) (5,275,000)
Contribution from non-controlling interest 107,094 93,380 - -
Proceeds from sale of property, plant and equipment - 66,292 - -
Payments for property plant and equipment (525,483) (4,303,537) (463,844) (420,292)
NET CASH (USED IN) / PROVIDED BY INVESTING ACTIVITIES (3,037,548) (9,418,865) (3,083,003) (5,695,292)
CASH FLOWS FROM FINANCING ACTIVITIES
(Repayment)/Proceeds from borrowings 2,994,329 8,225,369 2,994,329 8,225,369
(Repayment)/Proceeds from borrowings - related party - - 164,559 (3,647,408)
Dividends paid (4,042,192) (4,330,920) (4,042,192) (4,330,920)
NET CASH (USED IN) / PROVIDED BY FINANCING ACTIVITIES (1,047,863) 3,894,449 (883,304) 247,041
Net increase in cash held (1,603,884) (1,216,810) (1,057,707) (1,648,034)
Cash at the beginning of financial year 2,776,772 3,993,582 1,667,335 3,315,369
Cash at end of financial year 6 1,172,888 2,776,772 609,628 1,667,335
The accompanying notes form part of these financial statements
Statement of cash flows For the year ended 30 June 2017

31
SO
UT
H A
US
TR
AL
IAN
PR
OD
UC
E M
AR
KE
T L
IMIT
ED
& C
ON
TR
OL
LE
D E
NT
ITIE
S A
CN
00
8 1
29
56
6 A
NN
UA
L R
EP
OR
T 2
01
7
1 STATEMENT OF SIGNIFICANT ACCOUNTING POLICIES
General information and statement of compliance
The consolidated general purpose financial statements of the Group have been prepared in accordance with the requirements of the Corporations Act 2001, Australian Accounting Standards and other authoritative pronouncements of the Australian Accounting Standards Board. Compliance with Australian Accounting Standards results in full compliance with the International Financial Reporting Standards (IFRS) as issued by the International Accounting Standards Board (IASB). South Australian Produce Market Ltd is a for-profit entity for the purpose of preparing the financial statements.
South Australian Produce Market Ltd is the Group’s Ultimate Parent Company. South Australian Produce Market Ltd is a public company incorporated and domiciled in Australia. The address of its registered office and its principal place of business is Burma Road, Pooraka, SA 5095, Australia.
The consolidated financial statements for the year ended 30 June 2017 (including comparatives) were approved and authorised for issue by the Board of Directors.
New accounting standards and interpretations not yet adopted
The accounting standards that have not been early adopted for the year ended 30 June 2017 but will be applicable to the Group in future reporting periods are detailed below. Apart from these standards, we have considered other accounting standards that will be applicable in future periods but are considered insignificant to the Group.
Standard/Interpretation Effective Date
AASB 9 Financial Instruments, AASB 2010-7 Amendments to Australian Accounting Standards arising from AASB 9 (December 2010), AASB 2014-1 Amendments to Australian Accounting Standards (Part E- Financial Instruments), AASB 2014-7 Amendments to Australian Accounting Standards arising from AASB 9 (December 2014).
1-Jan-18
AASB 16 ‘Leases’ 1-Jan-19
AASB 2014-4 ‘Amendments to Australian Accounting Standards-Clarification of Acceptable Methods of Depreciation and Amortisation’
1-Jan-16
AASB 2015-1 ‘Amendments to Australian Accounting Standards - Annual Improvements to Australian Accounting Standards 2012-2014 Cycle’
1-Jan-16
AASB 2015-2 ‘Amendments to Australian Accounting Standards - Disclosure Initiative: Amendments to AASB 101’
1-Jan-16
AASB 2016-1 ‘Amendments to Australian Accounting Standards - Recognition of Deferred Tax Assets for Unrealised Losses’
1-Jan-17
AASB 2016-2 ‘Amendments to Australian Accounting Standards - Disclosure Initiative: Amendments to AASB 107’
1-Jan-17
We do not expect these accounting standards will have any material impact on our financial results upon adoption.
Notes to the Financial Statements For the year ended 30 June 2017

32S
OU
TH
AU
ST
RA
LIA
N P
RO
DU
CE
MA
RK
ET
LIM
ITE
D &
CO
NT
RO
LL
ED
EN
TIT
IES
AC
N 0
08
12
9 5
66
AN
NU
AL
RE
PO
RT
20
17
1 STATEMENT OF SIGNIFICANT ACCOUNTING POLICIES continued
New and amended standards adopted by the company
The Group has adopted the following revisions and amendments to AASBs issued by the Australian Accounting Standards Board and IFRS issued by the International Accounting Standards Board, which are relevant to and effective for the Group’s financial statements for the annual period beginning 1 July 2015.
- AASB 2014-3 Amendments to Australian Accounting Standards – Accounting for Acquisitions of Interests in Joint Operations;
- AASB 2014-4 Amendments to Australian Accounting Standards – Clarification of Acceptable Methods of Depreciation and Amortisation;
- AASB 2015-1 Amendments to Australian Accounting Standards – Annual Improvements to Australian Accounting Standards 2012-2014 Cycle;
- AASB 2015-2 Amendments to Australian Accounting Standards – Disclosure Initiative: Amendments to AASB 101;
- AASB 1057 Application of Australian Accounting Standards;
- AASB 2014-8 Amendments to Australian Accounting Standards arising from AASB 9 (December 2014) – Application of AASB 9 (December 2009) and AASB 9 (December 2010); and
- AASB 2015-3 Amendments to Australian Accounting Standards arising from the Withdrawal of AASB 1031 Materiality Management has reviewed the requirements of the above standards and has concluded that there was no effect on the classification or presentation of balances.
Summary of accounting policies
The significant accounting policies that have been used in the preparation of these consolidated financial statements are summarised below.
The consolidated financial statements have been prepared using the measurement bases specified by Australian Accounting Standards for each type of asset, liability, income and expense.
The measurement bases are more fully described in the accounting policies below.
They have been consistently applied unless otherwise stated.
The financial report has been prepared on an accruals basis and is based on historical costs, modified, where applicable, by the measurement at fair value of selected non-current assets, financial assets and financial liabilities.
(a) Basis of consolidation
The Group financial statements consolidate those of the parent company and its subsidiaries as of 30 June 2017. The parent controls a subsidiary if it is exposed, or has rights, to variable returns from its involvement with the subsidiary and has the ability to affect those returns through its power over the subsidiary. The subsidiaries have a reporting date of 30 June.
All transactions and balances between group companies are eliminated on consolidation, including unrealised gains and losses on transactions between group companies. Where unrealised losses on intra-group asset sales are reversed on consolidation, the underlying asset is also tested for impairment from a group perspective. Amounts reported in the financial statements of subsidiaries have been adjusted where necessary to ensure consistency with the accounting policies adopted by the Group.
Profit or loss and other comprehensive income of subsidiaries acquired or disposed of during the year are recognised from the effective date of acquisition, or up to the effective date of disposal, as applicable.
(b) Investments in joint ventures
A joint venture is an arrangement that the Group controls jointly with one or more other investors, and over which the Group has rights to a share of the arrangement’s net assets rather than direct rights to underlying assets and obligations for underlying liabilities. A joint arrangement in which the Group has direct rights to underlying assets and obligations for underlying liabilities is classified as a joint operation.
Investments in joint ventures are accounted for using the equity method. Interests in joint operations are accounted for by recognising the Group’s assets (including its share of any assets held jointly), its liabilities (including its share of any liabilities incurred jointly), its revenue from the sale of its share of the output arising from the joint operation, its share of the revenue from the sale of the output by the joint operation and its expenses (including its share of any expenses incurred jointly).
Any goodwill or fair value adjustment attributable to the Group’s share in the associate or joint venture is not recognised separately and is included in the amount recognised as investment.
The carrying amount of the investment in joint ventures is increased or decreased to recognise the Group’s share of the profit or loss and other comprehensive income of the joint venture, adjusted where necessary to ensure consistency with the accounting policies of the Group.
Notes to the Financial Statements For the year ended 30 June 2017
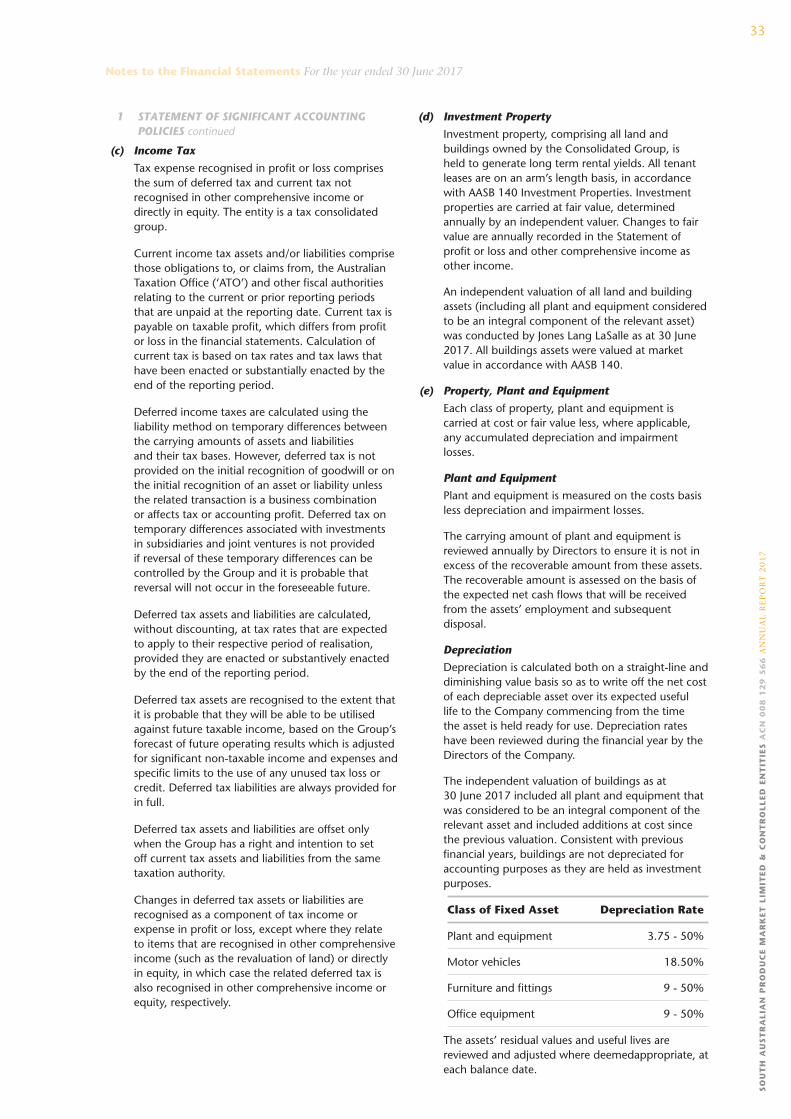
33
SO
UT
H A
US
TR
AL
IAN
PR
OD
UC
E M
AR
KE
T L
IMIT
ED
& C
ON
TR
OL
LE
D E
NT
ITIE
S A
CN
00
8 1
29
56
6 A
NN
UA
L R
EP
OR
T 2
01
7
1 STATEMENT OF SIGNIFICANT ACCOUNTING POLICIES continued
(c) Income Tax
Tax expense recognised in profit or loss comprises the sum of deferred tax and current tax not recognised in other comprehensive income or directly in equity. The entity is a tax consolidated group.
Current income tax assets and/or liabilities comprise those obligations to, or claims from, the Australian Taxation Office (‘ATO’) and other fiscal authorities relating to the current or prior reporting periods that are unpaid at the reporting date. Current tax is payable on taxable profit, which differs from profit or loss in the financial statements. Calculation of current tax is based on tax rates and tax laws that have been enacted or substantially enacted by the end of the reporting period.
Deferred income taxes are calculated using the liability method on temporary differences between the carrying amounts of assets and liabilities and their tax bases. However, deferred tax is not provided on the initial recognition of goodwill or on the initial recognition of an asset or liability unless the related transaction is a business combination or affects tax or accounting profit. Deferred tax on temporary differences associated with investments in subsidiaries and joint ventures is not provided if reversal of these temporary differences can be controlled by the Group and it is probable that reversal will not occur in the foreseeable future.
Deferred tax assets and liabilities are calculated, without discounting, at tax rates that are expected to apply to their respective period of realisation, provided they are enacted or substantively enacted by the end of the reporting period.
Deferred tax assets are recognised to the extent that it is probable that they will be able to be utilised against future taxable income, based on the Group’s forecast of future operating results which is adjusted for significant non-taxable income and expenses and specific limits to the use of any unused tax loss or credit. Deferred tax liabilities are always provided for in full.
Deferred tax assets and liabilities are offset only when the Group has a right and intention to set off current tax assets and liabilities from the same taxation authority.
Changes in deferred tax assets or liabilities are recognised as a component of tax income or expense in profit or loss, except where they relate to items that are recognised in other comprehensive income (such as the revaluation of land) or directly in equity, in which case the related deferred tax is also recognised in other comprehensive income or equity, respectively.
(d) Investment Property
Investment property, comprising all land and buildings owned by the Consolidated Group, is held to generate long term rental yields. All tenant leases are on an arm’s length basis, in accordance with AASB 140 Investment Properties. Investment properties are carried at fair value, determined annually by an independent valuer. Changes to fair value are annually recorded in the Statement of profit or loss and other comprehensive income as other income.
An independent valuation of all land and building assets (including all plant and equipment considered to be an integral component of the relevant asset) was conducted by Jones Lang LaSalle as at 30 June 2017. All buildings assets were valued at market value in accordance with AASB 140.
(e) Property, Plant and Equipment
Each class of property, plant and equipment is carried at cost or fair value less, where applicable, any accumulated depreciation and impairment losses.
Plant and Equipment
Plant and equipment is measured on the costs basis less depreciation and impairment losses.
The carrying amount of plant and equipment is reviewed annually by Directors to ensure it is not in excess of the recoverable amount from these assets. The recoverable amount is assessed on the basis of the expected net cash flows that will be received from the assets’ employment and subsequent disposal.
Depreciation
Depreciation is calculated both on a straight-line and diminishing value basis so as to write off the net cost of each depreciable asset over its expected useful life to the Company commencing from the time the asset is held ready for use. Depreciation rates have been reviewed during the financial year by the Directors of the Company.
The independent valuation of buildings as at 30 June 2017 included all plant and equipment that was considered to be an integral component of the relevant asset and included additions at cost since the previous valuation. Consistent with previous financial years, buildings are not depreciated for accounting purposes as they are held as investment purposes.
Class of Fixed Asset Depreciation Rate
Plant and equipment 3.75 - 50%
Motor vehicles 18.50%
Furniture and fittings 9 - 50%
Office equipment 9 - 50%
The assets’ residual values and useful lives are reviewed and adjusted where deemed appropriate, at each balance date.
Notes to the Financial Statements For the year ended 30 June 2017
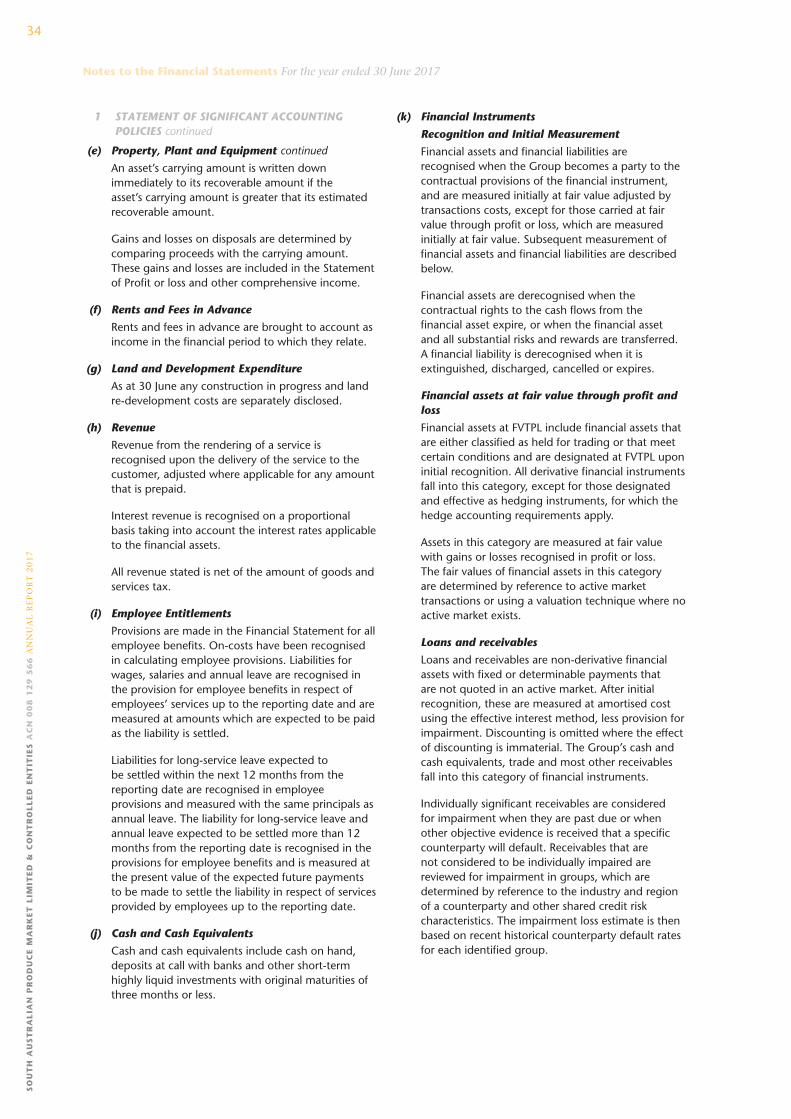
34S
OU
TH
AU
ST
RA
LIA
N P
RO
DU
CE
MA
RK
ET
LIM
ITE
D &
CO
NT
RO
LL
ED
EN
TIT
IES
AC
N 0
08
12
9 5
66
AN
NU
AL
RE
PO
RT
20
17
1 STATEMENT OF SIGNIFICANT ACCOUNTING POLICIES continued
(e) Property, Plant and Equipment continued
An asset’s carrying amount is written down immediately to its recoverable amount if the asset’s carrying amount is greater that its estimated recoverable amount.
Gains and losses on disposals are determined by comparing proceeds with the carrying amount. These gains and losses are included in the Statement of Profit or loss and other comprehensive income.
(f) Rents and Fees in Advance
Rents and fees in advance are brought to account as income in the financial period to which they relate.
(g) Land and Development Expenditure
As at 30 June any construction in progress and land re-development costs are separately disclosed.
(h) Revenue
Revenue from the rendering of a service is recognised upon the delivery of the service to the customer, adjusted where applicable for any amount that is prepaid.
Interest revenue is recognised on a proportional basis taking into account the interest rates applicable to the financial assets.
All revenue stated is net of the amount of goods and services tax.
(i) Employee Entitlements
Provisions are made in the Financial Statement for all employee benefits. On-costs have been recognised in calculating employee provisions. Liabilities for wages, salaries and annual leave are recognised in the provision for employee benefits in respect of employees’ services up to the reporting date and are measured at amounts which are expected to be paid as the liability is settled.
Liabilities for long-service leave expected to be settled within the next 12 months from the reporting date are recognised in employee provisions and measured with the same principals as annual leave. The liability for long-service leave and annual leave expected to be settled more than 12 months from the reporting date is recognised in the provisions for employee benefits and is measured at the present value of the expected future payments to be made to settle the liability in respect of services provided by employees up to the reporting date.
(j) Cash and Cash Equivalents
Cash and cash equivalents include cash on hand, deposits at call with banks and other short-term highly liquid investments with original maturities of three months or less.
(k) Financial Instruments
Recognition and Initial Measurement
Financial assets and financial liabilities are recognised when the Group becomes a party to the contractual provisions of the financial instrument, and are measured initially at fair value adjusted by transactions costs, except for those carried at fair value through profit or loss, which are measured initially at fair value. Subsequent measurement of financial assets and financial liabilities are described below.
Financial assets are derecognised when the contractual rights to the cash flows from the financial asset expire, or when the financial asset and all substantial risks and rewards are transferred. A financial liability is derecognised when it is extinguished, discharged, cancelled or expires.
Financial assets at fair value through profit and loss
Financial assets at FVTPL include financial assets that are either classified as held for trading or that meet certain conditions and are designated at FVTPL upon initial recognition. All derivative financial instruments fall into this category, except for those designated and effective as hedging instruments, for which the hedge accounting requirements apply.
Assets in this category are measured at fair value with gains or losses recognised in profit or loss. The fair values of financial assets in this category are determined by reference to active market transactions or using a valuation technique where no active market exists.
Loans and receivables
Loans and receivables are non-derivative financial assets with fixed or determinable payments that are not quoted in an active market. After initial recognition, these are measured at amortised cost using the effective interest method, less provision for impairment. Discounting is omitted where the effect of discounting is immaterial. The Group’s cash and cash equivalents, trade and most other receivables fall into this category of financial instruments.
Individually significant receivables are considered for impairment when they are past due or when other objective evidence is received that a specific counterparty will default. Receivables that are not considered to be individually impaired are reviewed for impairment in groups, which are determined by reference to the industry and region of a counterparty and other shared credit risk characteristics. The impairment loss estimate is then based on recent historical counterparty default rates for each identified group.
Notes to the Financial Statements For the year ended 30 June 2017

35
SO
UT
H A
US
TR
AL
IAN
PR
OD
UC
E M
AR
KE
T L
IMIT
ED
& C
ON
TR
OL
LE
D E
NT
ITIE
S A
CN
00
8 1
29
56
6 A
NN
UA
L R
EP
OR
T 2
01
7
1 STATEMENT OF SIGNIFICANT ACCOUNTING POLICIES continued
(k) Financial Instruments continued
Classification and subsequent measurement of financial liabilities
The Group’s financial liabilities include borrowings and trade and other payables.
Financial liabilities are measured subsequently at amortised cost using the effective interest method, except for financial liabilities held for trading or designated at FVTPL, that are carried subsequently at fair value with gains or losses recognised in profit or loss.
(l) Impairment of Assets
At each reporting date, the directors review the carrying values of tangible assets to determine whether there is any indication that those assets have been impaired. If such an indication exists, the recoverable amount of the asset, being the higher of the asset’s fair value less costs to sell and value in use, is compared to the asset’s carrying value. Any excess of the asset’s carrying value over its recoverable amount is expensed to the Statement of Profit or loss and other comprehensive income.
Where it is not possible to estimate the recoverable amount of an individual asset, the group estimates the recoverable amount of cash-generating unit to which the asset belongs.
(m) Comparative Figures
Where required by Australian Accounting Standards, comparative figures have been adjusted to conform to changes in presentation for the current financial year.
(n) Goods and Services Tax (GST)
Revenues, expenses and assets are recognised net of the amount of GST, except where the amount of GST incurred is not recoverable from the Tax Office. In these circumstances the GST is recognised as part of the cost of acquisition of the asset or as part of an item of the expense. Receivables and payables in the statement of financial position are shown inclusive of GST.
Cash flows are presented in the statement of cash flows on a gross basis, except for the GST components of investing and financing activities, which are disclosed as operating cash flows.
(o) Critical Accounting Estimates and Judgements
The preparation of the South Australian Produce Market Limited Financial Statements requires management to make estimates and judgements based on the information available at that time that has an effect on the reported amounts of assets and liabilities and the disclosure of any contingent assets and liabilities at the date of the financial report and the reported revenues and expenses during the reporting period.
On an ongoing basis, management evaluates judgements and estimates made that impact on the Financial Report. Management bases its judgements and estimates on historical experience and on various other factors that are believed to be reasonable under the circumstances, the results of which form the basis of making judgements and estimates about carrying values of transactions that are not readily apparent from other sources. There may be variances between estimates and actual results which are monitored by management as mentioned above.
Key Estimates - Impairment
The Consolidated Group assesses impairment at each reporting date by evaluating conditions specific to the Consolidated Group that may lead to impairment of assets. Where an impairment trigger exists, the recoverable amounts incorporate a number of key estimates.
Based on the performance of the Sunday Markets, the Directors have resolved that the investment is impaired in respect of goodwill and was written down to nil for the year ended 30 June 2015.
Key Judgements - Provision for Impairment of Receivables
The Directors have resolved that no provision for impairment of receivables is required for the year ended 30 June 2017.
(p) Parent entity information
The financial information for the parent entity, South Australian Produce Market Ltd, has been prepared on the same basis as the consolidated financial statements.
(q) Borrowing costs
Borrowing costs directly attributable to the acquisition, construction or production of a qualifying asset are capitalised during the period of time that is necessary to complete and prepare the asset for its intended use or sale. Other borrowing costs are expensed in the period in which they are incurred and reported in ‘finance costs’.
Notes to the Financial Statements For the year ended 30 June 2017

36S
OU
TH
AU
ST
RA
LIA
N P
RO
DU
CE
MA
RK
ET
LIM
ITE
D &
CO
NT
RO
LL
ED
EN
TIT
IES
AC
N 0
08
12
9 5
66
AN
NU
AL
RE
PO
RT
20
17
1 STATEMENT OF SIGNIFICANT ACCOUNTING POLICIES continued
(r) Leases
The economic ownership of a leased asset is transferred to the lessee if the lessee bears substantially all the risks and rewards of ownership of the leased asset. Where the Group is a lessee in this type of arrangement, the related asset is recognised at the inception of the lease at the fair value of the leased asset or, if lower, the present value of the lease payments plus incidental payments, if any. A corresponding amount is recognised as a finance lease liability.
See Note 1(e) for the depreciation methods and useful lives for assets held under finance lease. The corresponding finance lease liability is reduced by lease payments net of finance charges.
The interest element of lease payments represents a constant proportion of the outstanding capital balance and is charged to profit or loss, as finance costs over the period of the lease. All other leases are treated as operating leases. Where the Group is a lessee, payments on operating lease agreements are recognised as an expense on a straight-line basis over the lease term. Associated costs, such as maintenance and insurance, are expensed as incurred.
(s) Equity, reserves and dividend payments
Share capital represents the fair value of shares that have been issued. Any transaction costs associated with the issuing of shares are deducted from share capital, net of any related income tax benefits.
Retained earnings include all current and prior period retained profits.
Dividend distributions payable to equity shareholders are included in other liabilities when the dividends have been approved in a general meeting prior to the reporting date.
All transactions with owners of the parent are recorded separately within equity.
Notes to the Financial Statements For the year ended 30 June 2017
Consolidated Parent
2017 2016 2017 2016 $ $ $ $
2 REVENUE
Rental Revenue:
Rents and recoveries 15,576,922 15,083,813 11,161,462 11,227,043
Other Revenue:
Interest received 7,104 46,099 6,743 45,797
Interest recoveries - - 196,361 265,601
15,584,026 15,129,912 11,364,566 11,538,441
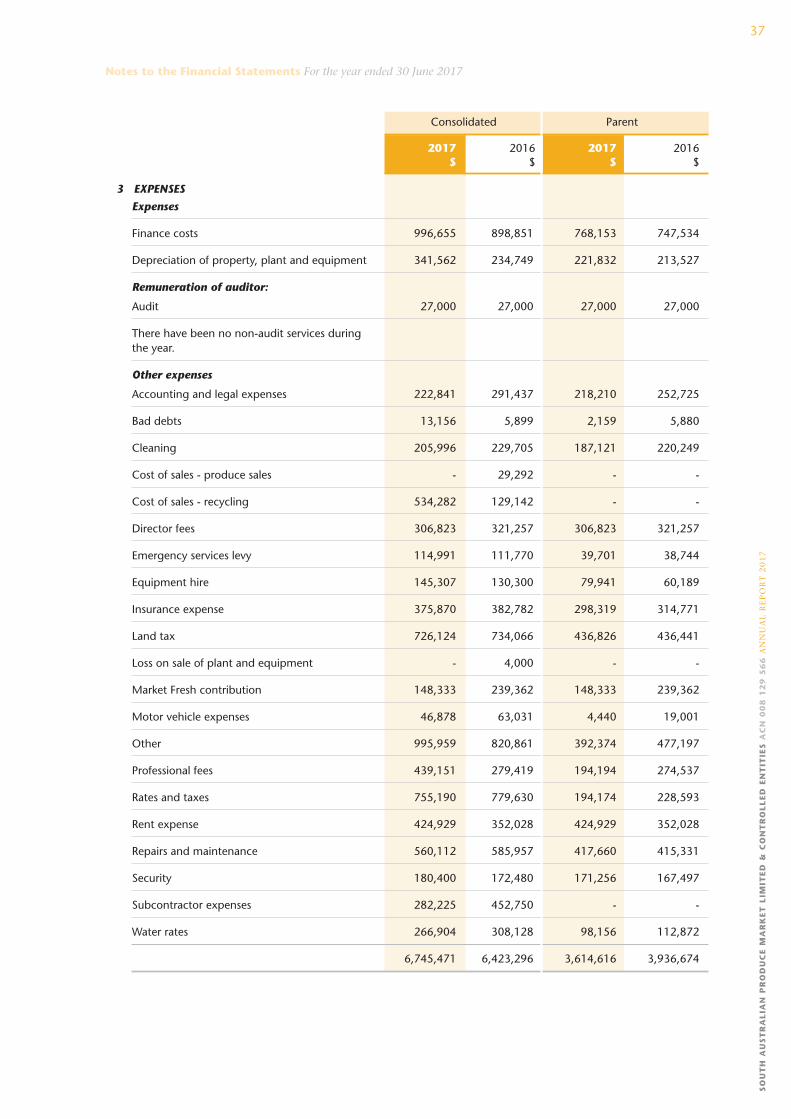
37
SO
UT
H A
US
TR
AL
IAN
PR
OD
UC
E M
AR
KE
T L
IMIT
ED
& C
ON
TR
OL
LE
D E
NT
ITIE
S A
CN
00
8 1
29
56
6 A
NN
UA
L R
EP
OR
T 2
01
7
Notes to the Financial Statements For the year ended 30 June 2017
Consolidated Parent
2017 2016 2017 2016 $ $ $ $
3 EXPENSES
Expenses
Finance costs 996,655 898,851 768,153 747,534
Depreciation of property, plant and equipment 341,562 234,749 221,832 213,527
Remuneration of auditor:
Audit 27,000 27,000 27,000 27,000
There have been no non-audit services during the year.
Other expenses
Accounting and legal expenses 222,841 291,437 218,210 252,725
Bad debts 13,156 5,899 2,159 5,880
Cleaning 205,996 229,705 187,121 220,249
Cost of sales - produce sales - 29,292 - -
Cost of sales - recycling 534,282 129,142 - -
Director fees 306,823 321,257 306,823 321,257
Emergency services levy 114,991 111,770 39,701 38,744
Equipment hire 145,307 130,300 79,941 60,189
Insurance expense 375,870 382,782 298,319 314,771
Land tax 726,124 734,066 436,826 436,441
Loss on sale of plant and equipment - 4,000 - -
Market Fresh contribution 148,333 239,362 148,333 239,362
Motor vehicle expenses 46,878 63,031 4,440 19,001
Other 995,959 820,861 392,374 477,197
Professional fees 439,151 279,419 194,194 274,537
Rates and taxes 755,190 779,630 194,174 228,593
Rent expense 424,929 352,028 424,929 352,028
Repairs and maintenance 560,112 585,957 417,660 415,331
Security 180,400 172,480 171,256 167,497
Subcontractor expenses 282,225 452,750 - -
Water rates 266,904 308,128 98,156 112,872
6,745,471 6,423,296 3,614,616 3,936,674

38S
OU
TH
AU
ST
RA
LIA
N P
RO
DU
CE
MA
RK
ET
LIM
ITE
D &
CO
NT
RO
LL
ED
EN
TIT
IES
AC
N 0
08
12
9 5
66
AN
NU
AL
RE
PO
RT
20
17
Consolidated Parent
2017 2016 2017 2016 $ $ $ $
4 INCOME TAX EXPENSE
The components of Tax Expense comprise:
Current tax 1,628,849 1,518,897 1,448,217 1,361,941
Deferred tax 671,837 3,021,225 614,046 2,214,733
2,300,686 4,540,122 2,062,263 3,576,674
The prima facie tax on profit before income tax is reconciled to the income tax as follows:
Prima facie tax payable on profit before income tax at 30% (2016: 30%) 2,045,647 4,356,533 2,056,812 3,571,074
Add: Tax Effect of:
- provision for holiday pay 7,386 (5,183) 4,643 (7,348)
- provision for long service leave (3,988) 3,588 (3,988) 3,588
- non-controlling interest 37,438 22,953 - -
- other non-allowable items 471,200 318,877 279,452 117,534
Less: Tax Effect of:
- revaluation gain (477,063) (2,720,757) (465,000) (1,981,852)
- allowable deduction for bitumen works (318,300) (363,925) (332,082) (253,709)
- other allowable items (133,471) (93,189) (91,620) (87,346)
1,628,849 1,518,897 1,448,217 1,361,941
5 DIVIDENDS
Final Distribution Paid 2,021,096 2,021,096 2,021,096 2,021,096
Interim Distribution Paid 2,021,096 2,309,824 2,021,096 2,309,824
Franking Account 603,825 779,587 603,825 779,587
6 CASH AND CASH EQUIVALENTS
Cash on hand 900 900 900 900
Cash at bank 1,171,988 2,775,872 543,620 1,666,435
1,172,888 2,776,772 544,520 1,667,335
Reconciliation of Cash
Cash at the end of the financial year as shown in the statement of cash flows is reconciled to the items in the statement of financial position as follows:
Cash and cash equivalents 1,172,888 2,776,772 544,520 1,667,335
A security interest over cash and cash equivalents has been provided for certain debt. Refer to Note 12 - Borrowings.
Notes to the Financial Statements For the year ended 30 June 2017

39
SO
UT
H A
US
TR
AL
IAN
PR
OD
UC
E M
AR
KE
T L
IMIT
ED
& C
ON
TR
OL
LE
D E
NT
ITIE
S A
CN
00
8 1
29
56
6 A
NN
UA
L R
EP
OR
T 2
01
7
Notes to the Financial Statements For the year ended 30 June 2017
Consolidated Parent
2017 2016 2017 2016 $ $ $ $
7 TRADE AND OTHER RECEIVABLES
CURRENT
Trade debtors 1,333,216 388,413 1,104,999 172,680
Provision for impairment (10,997) - - -
1,322,219 388,413 1,104,999 172,680
Other debtors 348,757 56,844 137,326 52,536
1,670,976 445,257 1,242,325 225,216
NON-CURRENT
Trade debtors 203,982 59,942 203,982 59,942
Loan - Subsidiaries - - 12,932,137 13,240,736
203,982 59,942 13,136,119 13,300,678
All of the Group’s trade and other receivables have been reviewed for indicators of impairment. No trade receivables were found to be impaired.
Gross Past due & Past due but not impaired Within initial amount impaired (days overdue) trade terms
<30 31-60 61-90 90+ days $ $ $ $ $ $ $
2017
Consolidated Group
Trade Receivables 1,333,216 (10,997) 221,138 200,557 40,464 148,804 722,253
Parent Entity
Trade Receivables 1,104,999 - 154,840 172,176 25,474 115,044 637,465
2016
Consolidated Group
Trade Receivables 388,413 - 68,040 51,663 79,718 29,794 159,198
Parent Entity
Trade Receivables 172,680 - (11,567) 27,841 20,246 4,757 131,403
Consolidated Parent
2017 2016 2017 2016 $ $ $ $
8 OTHER CURRENT ASSETS
CURRENT
Prepaid recycling supplies and inventory 70,872 5,604 - -
Prepayments - other 451,113 416,539 378,847 348,400
521,985 422,143 378,847 348,400

40S
OU
TH
AU
ST
RA
LIA
N P
RO
DU
CE
MA
RK
ET
LIM
ITE
D &
CO
NT
RO
LL
ED
EN
TIT
IES
AC
N 0
08
12
9 5
66
AN
NU
AL
RE
PO
RT
20
17
Consolidated Parent
2017 2016 2017 2016 $ $ $ $
9 INVESTMENT PROPERTIES
Investment Properties:
Land 53,865,000 51,565,000 46,565,000 44,265,000
Buildings 57,500,000 58,300,000 49,300,000 50,050,000
Total Investment Properties 111,365,000 109,865,000 95,865,000 94,315,000
Movements in carrying amounts
Movements in the carrying amounts for investment properties is as follows:
Investment Properties Consolidated Group $
Balances at 1 July 2015 96,865,000
Additions - at cost 3,930,810
Revaluation increment 9,069,190
Carrying amounts at 30 June 2016 109,865,000
Balances at 1 July 2016 109,865,000
Additions - at cost 14,180
Depreciation expense (104,389)
Revaluation increment 1,590,209
Carrying amounts at 30 June 2017 111,365,000
Investment Properties Parent Entity $
Balances at 1 July 2015 87,565,000
Additions - at cost 143,826
Revaluation increment 6,606,174
Carrying amounts at 30 June 2016 94,315,000
Balances at 1 July 2016 94,315,000
Additions - at cost -
Revaluation increment 1,550,000
Carrying amounts at 30 June 2017 95,865,000
Investment properties are leased out on operating leases. Rental income amounts to $5,281,167 (2016: $5,219,130) included in revenue.
Notes to the Financial Statements For the year ended 30 June 2017
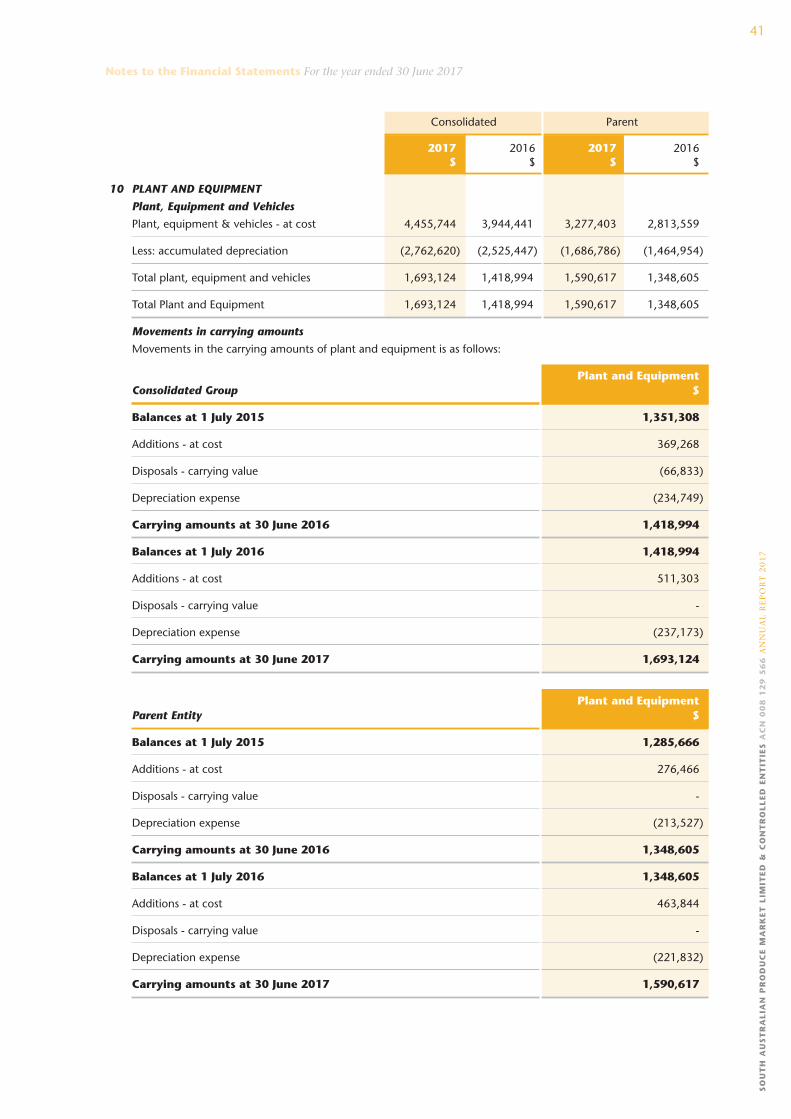
41
SO
UT
H A
US
TR
AL
IAN
PR
OD
UC
E M
AR
KE
T L
IMIT
ED
& C
ON
TR
OL
LE
D E
NT
ITIE
S A
CN
00
8 1
29
56
6 A
NN
UA
L R
EP
OR
T 2
01
7
Notes to the Financial Statements For the year ended 30 June 2017
Consolidated Parent
2017 2016 2017 2016 $ $ $ $
10 PLANT AND EQUIPMENT
Plant, Equipment and Vehicles
Plant, equipment & vehicles - at cost 4,455,744 3,944,441 3,277,403 2,813,559
Less: accumulated depreciation (2,762,620) (2,525,447) (1,686,786) (1,464,954)
Total plant, equipment and vehicles 1,693,124 1,418,994 1,590,617 1,348,605
Total Plant and Equipment 1,693,124 1,418,994 1,590,617 1,348,605
Movements in carrying amounts
Movements in the carrying amounts of plant and equipment is as follows:
Plant and Equipment Consolidated Group $
Balances at 1 July 2015 1,351,308
Additions - at cost 369,268
Disposals - carrying value (66,833)
Depreciation expense (234,749)
Carrying amounts at 30 June 2016 1,418,994
Balances at 1 July 2016 1,418,994
Additions - at cost 511,303
Disposals - carrying value -
Depreciation expense (237,173)
Carrying amounts at 30 June 2017 1,693,124
Plant and Equipment Parent Entity $
Balances at 1 July 2015 1,285,666
Additions - at cost 276,466
Disposals - carrying value -
Depreciation expense (213,527)
Carrying amounts at 30 June 2016 1,348,605
Balances at 1 July 2016 1,348,605
Additions - at cost 463,844
Disposals - carrying value -
Depreciation expense (221,832)
Carrying amounts at 30 June 2017 1,590,617

42S
OU
TH
AU
ST
RA
LIA
N P
RO
DU
CE
MA
RK
ET
LIM
ITE
D &
CO
NT
RO
LL
ED
EN
TIT
IES
AC
N 0
08
12
9 5
66
AN
NU
AL
RE
PO
RT
20
17
Consolidated Parent
2017 2016 2017 2016 $ $ $ $
11 TRADE AND OTHER PAYABLES
Current Unsecured Liabilities:
Trade payables 351,857 455,765 129,988 426,252
Sundry payables and accruals 1,548,370 1,622,790 1,288,334 1,270,880
1,900,227 2,078,555 1,418,322 1,697,132
All amounts are short-term. The carrying values of trade payables and other payables are considered to be a reasonable approximation of fair value.
12 BORROWINGS
Current
Finance lease liability 11,049 5,671 11,049 5,671
Non-current
Bank bills secured 33,451,692 30,451,692 33,451,692 30,451,692
Finance lease liability - 11,049 - 11,049
33,451,692 30,462,741 33,451,692 30,462,741
The bank bills are secured by: - a guarantee unlimited as to the amount ($4,500,000) by APML No. Two Pty Ltd
- registered equitable mortgage by South Australian Produce Market Limited over the whole of its assets and undertakings including uncalled capital.
- a first registered mortgage over the APML No. One Pty Ltd property located at Diagonal Road, Pooraka SA.
- a first registered mortgage over the South Australian Produce Market Limited property located at Market Lane, Pooraka SA.
- a first registered mortgage over the South Australian Produce Market Limited vacant land property located at Commerce Crescent, Pooraka SA.
The covenants for the above bank loans relate to interest cover. All required covenants have been met by the Company.
The finance lease liability is secured by a motor vehicle.
Consolidated Parent
2017 2016 2017 2016 $ $ $ $
13 PROVISIONS
Current
Provision for dividends 3,210 54,890 3,210 54,890
Employee benefits 346,538 314,100 322,079 298,785
349,748 368,990 325,289 353,675
Non-current
Employee benefits 14,026 35,136 14,026 35,136
Notes to the Financial Statements For the year ended 30 June 2017
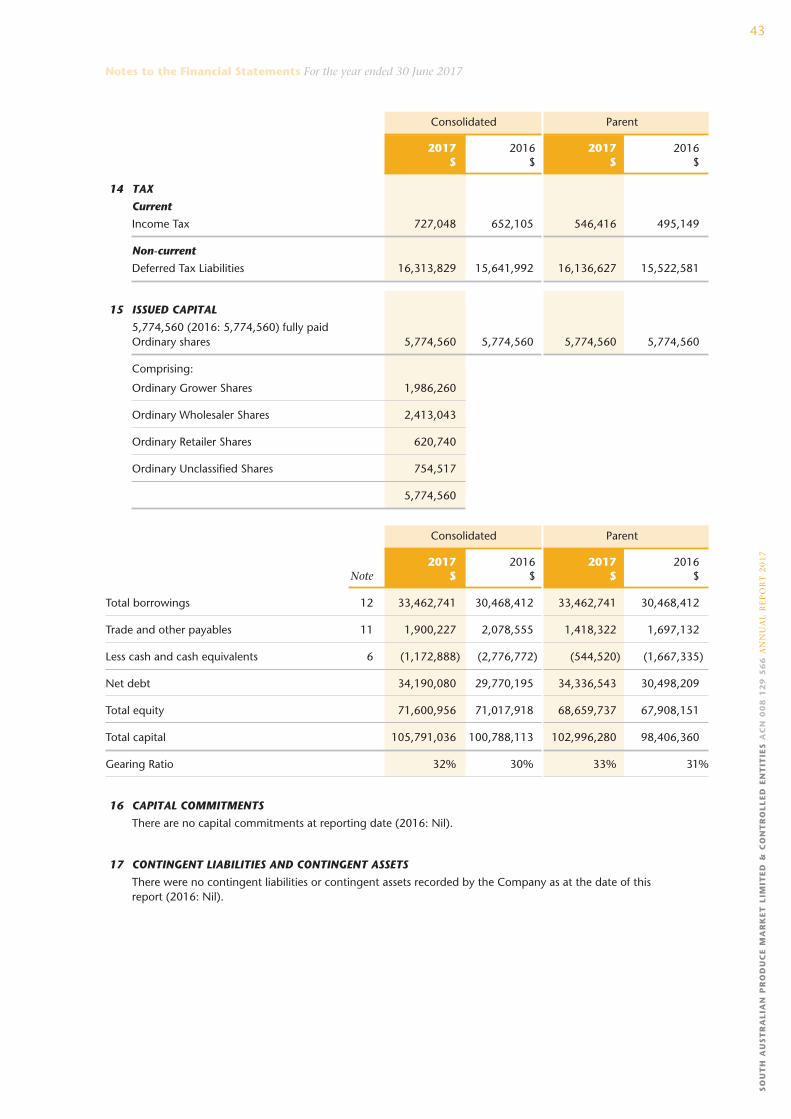
43
SO
UT
H A
US
TR
AL
IAN
PR
OD
UC
E M
AR
KE
T L
IMIT
ED
& C
ON
TR
OL
LE
D E
NT
ITIE
S A
CN
00
8 1
29
56
6 A
NN
UA
L R
EP
OR
T 2
01
7
Notes to the Financial Statements For the year ended 30 June 2017
Consolidated Parent
2017 2016 2017 2016 $ $ $ $
14 TAX
Current
Income Tax 727,048 652,105 546,416 495,149
Non-current
Deferred Tax Liabilities 16,313,829 15,641,992 16,136,627 15,522,581
15 ISSUED CAPITAL
5,774,560 (2016: 5,774,560) fully paid Ordinary shares 5,774,560 5,774,560 5,774,560 5,774,560
Comprising:
Ordinary Grower Shares 1,986,260
Ordinary Wholesaler Shares 2,413,043
Ordinary Retailer Shares 620,740
Ordinary Unclassified Shares 754,517
5,774,560
Consolidated Parent
2017 2016 2017 2016 Note $ $ $ $
Total borrowings 12 33,462,741 30,468,412 33,462,741 30,468,412
Trade and other payables 11 1,900,227 2,078,555 1,418,322 1,697,132
Less cash and cash equivalents 6 (1,172,888) (2,776,772) (544,520) (1,667,335)
Net debt 34,190,080 29,770,195 34,336,543 30,498,209
Total equity 71,600,956 71,017,918 68,659,737 67,908,151
Total capital 105,791,036 100,788,113 102,996,280 98,406,360
Gearing Ratio 32% 30% 33% 31%
16 CAPITAL COMMITMENTS
There are no capital commitments at reporting date (2016: Nil).
17 CONTINGENT LIABILITIES AND CONTINGENT ASSETS
There were no contingent liabilities or contingent assets recorded by the Company as at the date of this report (2016: Nil).

44S
OU
TH
AU
ST
RA
LIA
N P
RO
DU
CE
MA
RK
ET
LIM
ITE
D &
CO
NT
RO
LL
ED
EN
TIT
IES
AC
N 0
08
12
9 5
66
AN
NU
AL
RE
PO
RT
20
17
Consolidated Parent
2017 2016 2017 2016 $ $ $ $
18 CASH FLOW INFORMATION
Reconciliation of cash flows from operations with profit after income tax:
Profit after income tax 4,518,136 9,981,654 4,793,778 8,326,907
Non-cash flows in profit
- revaluation gain (1,590,209) (9,069,190) (1,550,000) (6,606,174)
- depreciation 341,562 234,749 221,832 213,527
- fair value movement on interest rate swap 153,539 - 153,539 -
- (gain)/loss on sale of asset - 4,000 - -
Changes in assets and liabilities:
- (increase)/decrease in trade receivables (1,225,719) 42,571 (1,017,109) 78,008
- (increase)/decrease in other current assets (99,842) (8,145) (30,447) 20,266
- increase/(decrease) in trade payables (178,328) 232,853 (278,810) (322,176)
- increase/(decrease) in tax liability 746,780 2,841,681 665,313 2,049,642
- increase/(decrease) in provisions (40,352) 47,433 (49,496) 40,217
2,625,567 4,307,606 2,908,600 3,800,217
Non-cash financing and investing activities
There were no transactions or events during the year which affected assets and liabilities and did not result in cash flows
Credit standby arrangements with banks to provide funds and support facilities.
Credit facility 33,567,000 30,532,000 33,567,000 30,532,000
Credit facility utilised (33,451,692) (30,451,692) (33,451,692) (30,451,692)
Unused credit facility 115,308 80,308 115,308 80,308
Notes to the Financial Statements For the year ended 30 June 2017

45
SO
UT
H A
US
TR
AL
IAN
PR
OD
UC
E M
AR
KE
T L
IMIT
ED
& C
ON
TR
OL
LE
D E
NT
ITIE
S A
CN
00
8 1
29
56
6 A
NN
UA
L R
EP
OR
T 2
01
7
Notes to the Financial Statements For the year ended 30 June 2017
Consolidated Parent
2017 2016 2017 2016 $ $ $ $
19 LEASE COMMITMENTS
(a) Operating Lease Commitments
Not later than 1 year 405,074 62,990 405,074 62,990
Later than 1 year but not later than 5 years 1,442,829 104,983 1,442,829 104,983
1,847,903 167,973 1,847,903 167,973
There is an operating lease for the building rental on Warehouse K from Pooraka Fruit & Vegetable Supply Pty Ltd ending in August 2022. Annual rental payments including GST are $342,085.
There is one other lease entered into with the Commonwealth Bank for electricity meter rentals ending February 2019. Annual rental payments are $62,990.
Consolidated Parent
2017 2016 2017 2016 $ $ $ $
(b) Finance lease commitments
Not later than 1 year 11,049 6,153 11,049 6,153
Later than 1 year but not later than 5 years - 11,075 25 11,075
Minimum lease payments 11,074 17,228 11,074 17,228
Less future finance charges (25) (508) (25) (508)
Present value of minimum lease payments 11,049 16,720 11,049 16,720
The finance lease is with the Commonwealth Bank for a Ford Ranger. The lease was entered into in August 2013.
20 FINANCIAL RISK MANAGEMENT
Risk management objectives and policies
The Group is exposed to various risks in relation to financial instruments. The Group’s financial assets and liabilities is summarised below. The main types of risks are interest rate risk and liquidity risk.
Consolidated Parent
2017 2016 2017 2016 $ $ $ $
Financial assets
Cash and cash equivalents 1,172,888 2,776,772 544,520 1,667,335
Trade and other receivables - current 1,670,976 445,257 1,242,325 225,216
Trade and other receivables - non-current 203,982 59,942 13,136,119 13,300,678
Financial assets 7,894,159 5,275,000 7,894,161 5,275,002
10,942,005 8,556,971 22,817,125 20,468,231
Financial liabilities
Market rate loans 33,451,692 30,451,692 33,451,692 30,451,692
Finance leases 11,049 16,720 11,049 16,720
Interest rate swap 153,539 - 153,539 -
Trade and other payables 1,900,227 2,078,555 1,418,322 1,697,132
35,516,507 32,546,967 35,034,602 32,165,544

46S
OU
TH
AU
ST
RA
LIA
N P
RO
DU
CE
MA
RK
ET
LIM
ITE
D &
CO
NT
RO
LL
ED
EN
TIT
IES
AC
N 0
08
12
9 5
66
AN
NU
AL
RE
PO
RT
20
17
20 FINANCIAL RISK MANAGEMENT continued
Interest Rate Risk
The Group’s policy is to minimise interest rate cash flow risk exposures on market rate loans. The interest rates are variable therefore the Group has entered into an interest rate swap agreement to hedge against unfavorable changes in interest rates. The fixed rate on $10,000,000 of the market rate loans is 2.65%.
The following illustrates the sensitivity of profit and equity to a 1% change in interest rates on the remaining amount.
Year ended 30 June 2017 $
+/- 1% in interest rates 235,000
Liquidity Risk
Liquidity risk is the risk that the Group might be unable to meet its obligations. The Group manages its liquidity needs by monitoring scheduled debt payments for market rate loans as well as cash inflows an outflows due in day-to-day business. The timing of cash outflows is presented below:
Consolidated group within 6-12 1-5 greater 6 months months years than 5 years Total 2017 $ $ $ $ $
Financial assets
Trade and other receivables - current 1,670,976 - - - 1,670,976
Trade and other receivables - non-current - - 203,982 - 203,982
Total financial assets 1,670,976 - 203,982 - 1,874,958
Financial liabilities
Trade and other payables 1,900,227 - - - 1,900,227
Borrowings - lease liability 11,049 - - - 11,049
Borrowings - bank loans - - 33,451,692 - 33,451,692
Interest rate swap - - 153,539 - 153,539
Total financial liabilities 1,911,276 - 33,605,231 - 35,516,507
Consolidated group within 6-12 1-5 greater 6 months months years than 5 years Total 2016 $ $ $ $ $
Financial assets
Trade and other receivables - current 445,257 - - - 445,257
Trade and other receivables - non-current - - 59,942 - 59,942
Total financial assets 445,257 - 59,942 - 505,199
Financial liabilities
Trade and other payables 2,078,555 - - - 2,078,555
Borrowings - lease liability 2,759 2,912 11,049 - 16,720
Borrowings - bank loans - - 30,451,692 - 30,451,692
Total financial liabilities 2,081,314 2,912 30,462,741 - 32,546,967
Notes to the Financial Statements For the year ended 30 June 2017

47
SO
UT
H A
US
TR
AL
IAN
PR
OD
UC
E M
AR
KE
T L
IMIT
ED
& C
ON
TR
OL
LE
D E
NT
ITIE
S A
CN
00
8 1
29
56
6 A
NN
UA
L R
EP
OR
T 2
01
7
Notes to the Financial Statements For the year ended 30 June 2017
20 FINANCIAL RISK MANAGEMENT continued The Board has determined that the carrying values of financial assets and financial liabilities are consistent with fair
values. The interest rate swap has been valued by the Commonwealth Bank of Australia using the standard pricing methodology.
Parent entity within 6-12 1-5 greater 6 months months years than 5 years Total 2017 $ $ $ $ $
Financial assets Trade and other receivables - current 1,242,325 - - - 1,242,325
Trade and other receivables - non-current - - 13,136,119 - 13,136,119
Total financial asset 1,242,325 - 13,136,119 - 14,378,444
Financial liabilities Trade and other payables 1,418,322 - - - 1,418,322
Borrowings - lease liability 11,049 - - - 11,049
Borrowings - bank loans - - 33,451,692 - 33,451,692
Interest rate swap - - 153,539 -
Total financial liabilities 1,429,371 - 33,605,231 - 34,881,063
Parent entity within 6-12 1-5 greater 6 months months years than 5 years Total 2016 $ $ $ $ $
Financial assets Trade and other receivables - current 225,216 - - - 225,216
Trade and other receivables - non-current - - 13,300,678 - 13,300,678
Total financial assets 225,216 - 13,300,678 - 13,525,894
Financial liabilities Trade and other payables 1,697,132 - - - 1,697,132
Borrowings - lease liability 2,759 2,912 11,049 - 16,720
Borrowings - bank loans - - 30,451,692 - 30,451,692
Total financial liabilities 1,699,891 2,912 30,462,741 - 32,165,544
The Board has determined that the carrying values of financial assets and financial liabilities are consistent with fair
values. The interest rate swap has been valued by the Commonwealth Bank of Australia using the standard pricing methodology.

48S
OU
TH
AU
ST
RA
LIA
N P
RO
DU
CE
MA
RK
ET
LIM
ITE
D &
CO
NT
RO
LL
ED
EN
TIT
IES
AC
N 0
08
12
9 5
66
AN
NU
AL
RE
PO
RT
20
17
Consolidated Parent
2017 2016 2017 2016 $ $ $ $
21 TRANSACTIONS WITH KEY MANAGEMENT PERSONNEL
Key management of the group are the Board of Directors and the Chief Executive Officer.
Short term employee benefits
Salaries & Directors fees 460,043 501,930 460,043 501,930
Other - salary sacrifice 30,500 - 30,500 -
490,543 501,930 490,543 501,930
Post-employment benefits
Superannuation Contributions 40,283 47,938 40,283 47,938
40,283 47,938 40,283 47,938
Total Remuneration 530,826 549,868 530,826 549,868
22 FINANCIAL REPORTING BY SEGMENTS
The Company operates wholly within Australia and owns and operates a large scale facility for the wholesale marketing of fresh produce.
23 RELATED PARTY DISCLOSURES
Directors and Director-related entities hold directly, indirectly or beneficially as at balance date the following number of shares in this Company. Details of each Director’s holdings are listed in the accompanying Director’s Report.
Consolidated Parent
2017 2016 2017 2016 No. No. No. No.
South Australian Produce Market Ltd - Ordinary Shares 1,492,422 1,492,422 1,492,422 1,492,422
The group used the legal and accounting services of director related entities over which they exercise significant influence. The amounts billed were based on normal market rates and amounts to:
Consolidated Parent
2017 2016 2017 2016 $ $ $ $
Schirripa Evans Lawyers 206,863 199,467 206,863 199,467
Bentleys 45,595 32,101 45,595 32,101
Minicozzi Solicitors 10,382 - 10,382 -
262,840 231,568 262,840 231,568
There was nil outstanding to these related entities (2016: $1,843 to Bentleys).
Legal fees paid to the director related law firms noted above may include fees paid to barristers acting on behalf of the Company and other disbursements incurred on the Company’s behalf. Fees paid to Director related law and accounting firms are charged at normal commercial rates. Detailed timesheets are provided to the Board and Directors whose firms provide professional services do not participate in the approval for payment of any fees paid to their respective firms.
Notes to the Financial Statements For the year ended 30 June 2017

49
SO
UT
H A
US
TR
AL
IAN
PR
OD
UC
E M
AR
KE
T L
IMIT
ED
& C
ON
TR
OL
LE
D E
NT
ITIE
S A
CN
00
8 1
29
56
6 A
NN
UA
L R
EP
OR
T 2
01
7
Notes to the Financial Statements For the year ended 30 June 2017
Consolidated Parent
2017 2016 2017 2016 $ $ $ $
23 RELATED PARTY DISCLOSURES continued
The Group transacted with several directors in the company and their related entities as customers, in relation to leased premises and market services. The amounts charged were based on normal market rates and amounted to:
P & E Scalzi Services Pty Ltd 256,269 232,276 256,269 232,276
Paseva Pty Ltd ATF P & E Scalzi Superannuation Fund 151,620 135,333 151,620 135,333
Thorndon Park Produce Co Pty Ltd 5,285 5,226 5,285 5,226
Dublin Fruit & Veg 3,300 - 3,300 -
R Ceravolo & Co Pty Ltd 308,967 217,891 308,967 217,891
Pooraka Fruit & Vegetable Supply 57,365 41,680 57,365 41,680
782,806 632,406 782,806 632,406
The outstanding balances at the reporting date
were as follows:
P & E Scalzi Services Pty Ltd 12,548 6,244 12,548 6,244
Paseva Pty Ltd ATF P & E Scalzi Superannuation Fund 10,314 5,130 10,314 5,130
R Ceravolo & Co Pty Ltd 52,917 1,138 52,917 1,138
Pooraka Fruit & Vegetable Supply 6,036 (13,022) 6,036 (13,022)
81,815 (510) 81,815 (510)
Lease payments to Pooraka Fruit and Vegetable Supply 397,941 352,028 397,941 352,028
Transactions with Joint Ventures
During 2017, South Australian Produce Market provided contribution to Market Fresh of $105,000 (2016: $185,200). At reporting date there is no anounts owed to or by Market Fresh (2016: Nil).
24 SUPERANNUATION COMMITMENTS
The Company does not participate in any employer sponsored defined benefit superannuation plans for its employees. All superannuation payments by the Company are in accordance with the relevant Superannuation Guarantee legislation.
25 EVENTS AFTER THE REPORTING DATE
There are no events subsequent to 30 June 2017 that would have a material effect on the 2017 Financial Report (2016: Nil).
26 ECONOMIC DEPENDENCY
The future revenue of the Consolidated Group is dependent on the commercial contribution of the principal activities disclosed in the Directors’ Report.

50S
OU
TH
AU
ST
RA
LIA
N P
RO
DU
CE
MA
RK
ET
LIM
ITE
D &
CO
NT
RO
LL
ED
EN
TIT
IES
AC
N 0
08
12
9 5
66
AN
NU
AL
RE
PO
RT
20
17
27 CONTROLLED ENTITIES
Percentage Owned
Controlled Entities Country of Incorporation 2017 2016
APML No. One Pty Ltd Australia 100% 100%
APML No. Two Pty Ltd Australia 100% 100%
5101 Commerce Crescent Pty Ltd Australia 100% 100%
5102 Commerce Crescent Pty Ltd Australia 100% 100%
APML Exports Pty Ltd Australia 100% 100%
Adelaide Market Pty Ltd Australia 100% 100%
9 Burma Road Pooraka Pty Ltd Australia 100% 100%
Australian Produce Cases and Recycling Pty Ltd Australia 100% 100%
Australian Produce Collective Pty Ltd Australia 85% 85%
Controlled Entities Acquired
No controlled entities were acquired during the year.
Control Entity Disposal
No controlled entities were disposed during the year.
Controlled Entities with Ownership Interest of 50% or Less
No controlled entities are held by the Parent Entity with an ownership interest of 50% or less.
28 OTHER FINANCIAL ASSETS Consolidated Parent
2017 2016 2017 2016 $ $ $ $
Non-Current
Unlisted Investments - at cost
- Shares in Controlled Entities - - 2 2
- Shares in Perth Markets Ltd & Perth Markets
Land Trust (PML) (non-controlling interest) 7,894,159 5,275,000 7,894,159 5,275,000
7,894,159 5,275,000 7,894,161 5,275,002
29 INVESTMENTS ACCOUNTED FOR USING THE EQUITY METHOD
The Group has one material joint venture, Market Fresh SA Pty Ltd (Market Fresh).
Market Fresh was incorporated in Australia and it was formed for the purpose of establishing a jointly owned marketing company to promote and increase the volume of fruit and vegetable produce sold through the South Australian Produce Market.
Percentage Owned
2017 2016
Proportion of ownership interests held by the group 50% 50%
The investment in Market Fresh is accounted for using the equity method in accordance with AASB 128. Market Fresh SA is in a deficit position at 30 June 2017 and as such the carrying value of the investment is nil. South Australian Produce Market Ltd paid share capital of $50 upon the set up of the new company.
Notes to the Financial Statements For the year ended 30 June 2017

51
SO
UT
H A
US
TR
AL
IAN
PR
OD
UC
E M
AR
KE
T L
IMIT
ED
& C
ON
TR
OL
LE
D E
NT
ITIE
S A
CN
00
8 1
29
56
6 A
NN
UA
L R
EP
OR
T 2
01
7
Notes to the Financial Statements For the year ended 30 June 2017
30 CHANGES IN ACCOUNTING POLICY
There were no changes in accounting policy for the year ended 30 June 2017.
31 RESERVES
Reserves represent share premiums.
32 NON-CONTROLLING INTEREST Consolidated Parent
2017 2016 2017 2016 $ $ $ $
Balance at the beginning of the year 16,871 - - -
Contributions from minority interest 107,094 93,380 - -
Share of profit (loss) for the year (124,794) (76,509) - -
Balance at the end of the year (829) 16,871 - -
During the prior year the Group acquired 85% of Australian Produce Collective Pty Ltd. The movement in the non-controlling interest represents 15% of the company’s net assets.
33 COMPANY DETAILS
The registered office of the Consolidated Group is:
Burma Road Pooraka SA 5095
The principal place of business of the Consolidated Group is:
Burma Road Pooraka SA 5095

52S
OU
TH
AU
ST
RA
LIA
N P
RO
DU
CE
MA
RK
ET
LIM
ITE
D &
CO
NT
RO
LL
ED
EN
TIT
IES
AC
N 0
08
12
9 5
66
AN
NU
AL
RE
PO
RT
20
17
CORPORATE DIRECTORY (AS OF THE DATE OF THIS REPORT)
DIRECTORS
David Schirripa (Chairman) Nicola Minicozzi (Deputy Chairman) Pasquale Scalzi Daniele De leso Antonio Ceravolo Michael Ruggiero Christine Scalzi Girolamo Fragnito Derrick Patterson
SECRETARY
Angelo Demasi
REGISTERED OFFICE
Burma Road Pooraka South Australia 5095
Telephone: 08 8349 4493 Facsimile: 08 8349 6574
Internet site: www.saproducemarket.com.au
AUDITOR
Grant Thornton Audit Pty Ltd
Level 3 170 Frome Street Adelaide South Australia 5000
BANKER
Commonwealth Bank of Australia 213 Glynburn Road Firle South Australia 5070
SHARE REGISTRAR
David Garry & Associates 225 Fullarton Road Eastwood South Australia 5063
Notes to the Financial Statements For the year ended 30 June 2017

53
SO
UT
H A
US
TR
AL
IAN
PR
OD
UC
E M
AR
KE
T L
IMIT
ED
& C
ON
TR
OL
LE
D E
NT
ITIE
S A
CN
00
8 1
29
56
6 A
NN
UA
L R
EP
OR
T 2
01
7
In accordance with a resolution of the Directors of South Australian Produce Market
Limited, the Directors of the Company declare that:
1) The financial statements and notes, as set out on pages 26 to 52, are in
accordance with the Corporations Act 2001 and:
a) comply with Australian Accounting Standards which, as stated in accounting
policy Note 1 to the financial statements, constitutes compliance with
International Financial Reporting Standard (IFRS); and
b) give a true and fair view of the financial position as at 30 June 2017 and
of the performance for the year ended on that date of the Company and
Consolidated Group.
2) In the Directors’ opinion there are reasonable grounds to believe that the
Company will be able to pay its debts as and when they become due
and payable.
This declaration is made in accordance with a resolution of the Board of Directors.
David Schirripa
Chairman of Directors
Signed at Pooraka, South Australia on this
29th day of September 2017.
Directors’ Declaration

54S
OU
TH
AU
ST
RA
LIA
N P
RO
DU
CE
MA
RK
ET
LIM
ITE
D &
CO
NT
RO
LL
ED
EN
TIT
IES
AC
N 0
08
12
9 5
66
AN
NU
AL
RE
PO
RT
20
17
Independent Auditor’s Report

55
SO
UT
H A
US
TR
AL
IAN
PR
OD
UC
E M
AR
KE
T L
IMIT
ED
& C
ON
TR
OL
LE
D E
NT
ITIE
S A
CN
00
8 1
29
56
6 A
NN
UA
L R
EP
OR
T 2
01
7
Independent Auditor’s Report

SO
UT
H A
US
TR
AL
IAN
PR
OD
UC
E M
AR
KE
T L
IMIT
ED
& C
ON
TR
OL
LE
D E
NT
ITIE
S A
CN
00
8 1
29
56
6 A
NN
UA
L R
EP
OR
T 2
01
7
Organisational Structure
* This Organisational Chart does not include business units or subsidiary companies.
Cindy Parker
Property Administrator
Teresa Williams
Accounts Payable Part-time
John Edwards
FInancial Controller Part-time
Anil Arora
Accountant
Karen Butler
Facilities & Compliance Manager
Wendy Helps
Administration Part-time
Anna Lennard
Accounts Receivable Part-time
Suzanne Heaton
Executive Assistant
Angelo Demasi
Chief Executive Officer
Frank Cantelmi
Operations Controller
Rodney Helps
Team Leader
Renee Cammferman
Project Administrator
Board of Directors
Wayne Dolan
Market Official
Dave Pridham
Market Official
Joyce Fagan
Market Official
Clive Young
Market Official
Friday Nwaiwu
Market Official
Board of Directors
56

57
SO
UT
H A
US
TR
AL
IAN
PR
OD
UC
E M
AR
KE
T L
IMIT
ED
& C
ON
TR
OL
LE
D E
NT
ITIE
S A
CN
00
8 1
29
56
6 A
NN
UA
L R
EP
OR
T 2
01
7
NOTES

NOTES

Corporate Directory
DIRECTORS
David Schirripa (Chairman) Nicola Minicozzi (Deputy Chairman) Pasquale Scalzi Daniele De leso Antonio Ceravolo Michael Ruggiero Christine Scalzi Girolamo Fragnito Derrick Patterson
SECRETARY
Angelo Demasi
REGISTERED OFFICE
South Australian Produce Market Limited Burma Road Pooraka South Australia 5095
Telephone: 08 8349 4493 Facsimile: 08 8349 6574
www.saproducemarket.com.au
AUDITOR
Grant Thornton Audit Pty Ltd Level 3 , 170 Frome Street Adelaide South Australia 5000
BANKER
Commonwealth Bank of Australia 213 Glynburn Road Firle South Australia 5070
SHARE REGISTRAR
David Garry & Associates 225 Fullarton Road Eastwood South Australia 5063


![How Microsoft Secures its Online Services [WHITEPAPER]](https://img.dokumen.tips/doc/110x75/554a40b0b4c905293a8b507c/how-microsoft-secures-its-online-services-whitepaper.jpg)